Article

Quantitative Analysis of Prostate MRI: Correlation between Contrast-Enhanced Magnetic Resonance Fingerprinting and Dynamic Contrast-Enhanced MRI Parameters

1
Department of Radiology, Eunpyeong St. Mary’s Hospital, College of Medicine, The Catholic University of Korea, Seoul 03312, Republic of Korea
2
Siemens Healthineers Ltd., Seoul 06620, Republic of Korea
3
School of Electrical and Electronic Engineering, Yonsei University, Seoul 03722, Republic of Korea
*
Author to whom correspondence should be addressed.
Curr. Oncol. 2023, 30(12), 10299-10310; https://doi.org/10.3390/curroncol30120750
Submission received: 30 October 2023 / Revised: 27 November 2023 / Accepted: 30 November 2023 / Published: 4 December 2023

Abstract

:
This research aimed to assess the relationship between contrast-enhanced (CE) magnetic resonance fingerprinting (MRF) values and dynamic contrast-enhanced (DCE) MRI parameters including (Ktrans, Kep, Ve, and iAUC). To evaluate the correlation between the MRF-derived values (T1 and T2 values, CE T1 and T2 values, T1 and T2 change) and DCE-MRI parameters and the differences in the parameters between prostate cancer and noncancer lesions in 68 patients, two radiologists independently drew regions-of-interest (ROIs) at the focal prostate lesions. Prostate cancer was identified in 75% (51/68) of patients. The CE T2 value was significantly lower in prostate cancer than in noncancer lesions in the peripheral zone and transition zone. Ktrans, Kep, and iAUC were significantly higher in prostate cancer than noncancer lesions in the peripheral zone (p < 0.05), but not in the transition zone. The CE T1 value was significantly correlated with Ktrans, Ve, and iAUC in prostate cancer, and the CE T2 value was correlated to Ve in noncancer. Some CE MRF values are different between prostate cancer and noncancer tissues and correlate with DCE-MRI parameters. Prostate cancer and noncancer tissues may have different characteristics regarding contrast enhancement.

1. Introduction

The Prostate Imaging—Reporting and Data System (PI-RADS) recommends a multiparametric prostate MRI protocol that encompasses T2-weighted imaging (T2WI), T1-weighted imaging (T1WI), diffusion-weighted imaging (DWI), and dynamic contrast-enhanced (DCE) MR [1]. As a contrast material and additional scan time are necessary to obtain DCE MRI, the usefulness of biparametric MRI without DEC MRI has been proven [2,3,4]. However, DCE MRI helps to diagnose clinically significant prostate cancer in the peripheral zone that shows early enhancement, especially in the case where DWI is degraded [5]. PI-RADS recommends qualitatively reviewing DCE MRI and determining whether early enhancement is present in the focal lesion. Although visual analysis based on the relative signal intensity of the lesion compared to the surrounding normal tissue is the common way to interpret DCE MRI, research on quantitative analyses has continued to produce objective parameters [6].
DCE MRI, which repeatedly obtains many images on the same section with a very short time interval, provides a change in signal intensity in the pixel over time. PI-RADS version 1 suggested interpreting DCE MRI by classifying time-intensity curves among three types [7]. Some studies have shown a high proportion of type 3 curves (rapid enhancement and washout) in prostate cancer [8,9]. However, curve type analysis showed poor performance in differentiating prostate cancer from healthy tissue [10]. Moreover, quantitative DCE parameters (Ktrans, Kep, Ve, and iAUC) from the Tofts model have been suggested to explain the pharmacokinetic characteristics of contrast material in prostate cancer [11]. Ktrans, Kep, and iAUC are higher in prostate cancer than in benign or normal tissue and are higher in more aggressive cancer than in less aggressive cancer, especially in the peripheral zone [9,12,13,14,15].
In terms of quantitative analysis, magnetic resonance fingerprinting (MRF) has emerged as a method to measure multiple tissue properties with relatively shorter scan times than conventional mapping methods [16]. MRF-derived T1 or T2 values were significantly lower in prostate cancer than in noncancer or benign tissue [17,18,19]. In some research, MRF was acquired before and after contrast enhancement, and the T1 value significantly decreased on contrast-enhanced (CE) MRF compared with nonenhanced (NE) MRF [20]. The contrast-enhanced T1 and T2 values exhibited significant differences when comparing prostate cancer to normal tissue [21]. However, the CE MRF-derived T1 and T2 values of prostate cancer were not explored in the peripheral zone and transition zone separately. Additionally, CE MRF values and DCE parameters, the quantitative parameters related to CE MRI, may be correlated. The purpose of this study was to evaluate the correlation between CE MRF values and DCE-MRI parameters (Ktrans, Kep, Ve, and iAUC) as well as to validate the difference in the parameters between prostate cancer and noncancer lesions.

2. Materials and Methods

The institutional review board of the hospital approved this study, and the requirement for informed consent was waived owing to its retrospective design.

2.1. Patients

We searched all prostate MRI examinations performed in our institution between January 2020 and March 2021. Among 560 examinations, MRI examinations were excluded according to the following criteria: (1) patients with known prostate cancer including post-treatment or postbiopsy status (n = 203); (2) patients who did not undergo prostate biopsy (n = 198); (3) MRI examinations without MRF (n = 77); (4) patients without suspected prostate cancer (PI-RADS ≥ 3) (n = 9); and (5) DCE MRI was not obtained (n = 5). A total of 68 patients who underwent prostate prebiopsy MRI and prostate biopsy for prostate focal lesions were included in this study (Figure 1).
Patient clinical information, including age and prostate-specific antigen (PSA) level before prostate MRI, was collected. Location and PI-RADS v.2.1 classification were recorded from the MRI reports that were already generated during the clinical process by one of two abdominal/genitourinary radiologists with more than 10 years of experience. If the prostate focal lesion involved both the peripheral zone and the transition zone, the location of the lesion was determined by the center of the lesion. One of the two radiologists performed transrectal ultrasound-guided prostate biopsy using an ultrasound-MRI fusion system (Logiq E10, GE healthcare, Chicago, IL, USA). The radiologist performed targeted and systematic biopsy and reported the location of the targeted biopsy. Pathology results were reported by one of four board-certified pathologists and included the Gleason grade group of prostate cancer, which was defined by the International Society of Urological Pathology, and the number and location of positive cores.

2.2. MRI Protocol

The study involved all patients undergoing multiparametric MRI without an endorectal coil on a 3-T system (Magnetom Vida, Siemens Healthineers, Erlangen, Germany), utilizing a 30-channel body coil along with either a 32-channel or 72-channel spine coil. The specific MRI parameters are detailed in Table 1. Dynamic contrast-enhanced (DCE) MRI was conducted using the Golden-angle RAdial Sparse Parallel (GRASP) technique, with a temporal resolution of 4.3 s for the first 17 s, followed by 7 s for the subsequent 180 s. To calculate the DCE MRI parameters, T1 maps were generated through the variable flip angle technique, employing angles of 2° and 15°. MRF was conducted twice, first before the injection of contrast material and then immediately following the completion of DCE MRI.
MRF has been integrated into the prebiopsy prostate MRI protocol for patients for patients with the clinical suspicion of prostate cancer. MRF data were obtained using a hybrid radial/echo-planar imaging (EPI) trajectory [19]. This involved a golden-angle rotating radial acquisition in the kxy domain, combined with simultaneous EPI acquisition in the slice encoding direction (kz), employing a sinusoidal flip angle to achieve high-resolution MRF data. The scan time of each MRF was 3 min 48 s. For both NE and CE MRF, the same parameters were used: sinusoidal 320 flip angles, TR = 16 ms, TE = 4 ms, resolution = 0.6 × 0.6 × 3 mm3, FOV = 160 × 160 × 72 mm3 and scan time = 3 min 48 s. The dictionary was generated based on the Bloch equation in MATLAB (The MathWorks, Natick, MA). The T1 range of the dictionary was 50 msec to 3000 msec with a 10-msec step size and was 3050 msec to 4000 msec with a 50-msec step size. The T2 range of the dictionary was 5 msec to 250 msec with a 1-msec step size, 252 msec to 350 msec with a 2-msec step size, and 355 msec to 400 msec with a 5-msec step size. Dictionary matching using the inner-product method was performed to acquire quantitative T1 and T2 maps from NE and CE MRF.

2.3. Image Analysis

Two radiologists with 10 and 23 years of experience (each having read over 1000 cases) independently analyzed the DCE MRI and MRF images without access to each others’ results. We used commercial software (Syngo.via VB70B, Siemens Healthineers) to analyze DCE MRI and open-source software (ITK-SNAP version 3.8.0 [www.itksnap.org [accessed on 30 November 2023]]) to analyze the MRF maps. Four parameters were calculated from the DCE MRI: Ktrans (volume transfer constant that represents the leakage of contrast from the vascular to the extravascular component); Ve (fractional volume of extravascular extracellular space [EES] per unit tissue volume); Kep (reflux rate constant that describes contrast reflux from the EES back into the vascular component); and the initial area under the time-to-signal intensity curve (iAUC) measured during the first 60 s [22]. T1 and T2 values were acquired from the NE MRF maps, and CE T1 and CE T2 values were acquired from the CE MRF maps. We calculated T1 change (%) and T2 change (%) as [(NE value − CE value)/NE value] × 100.
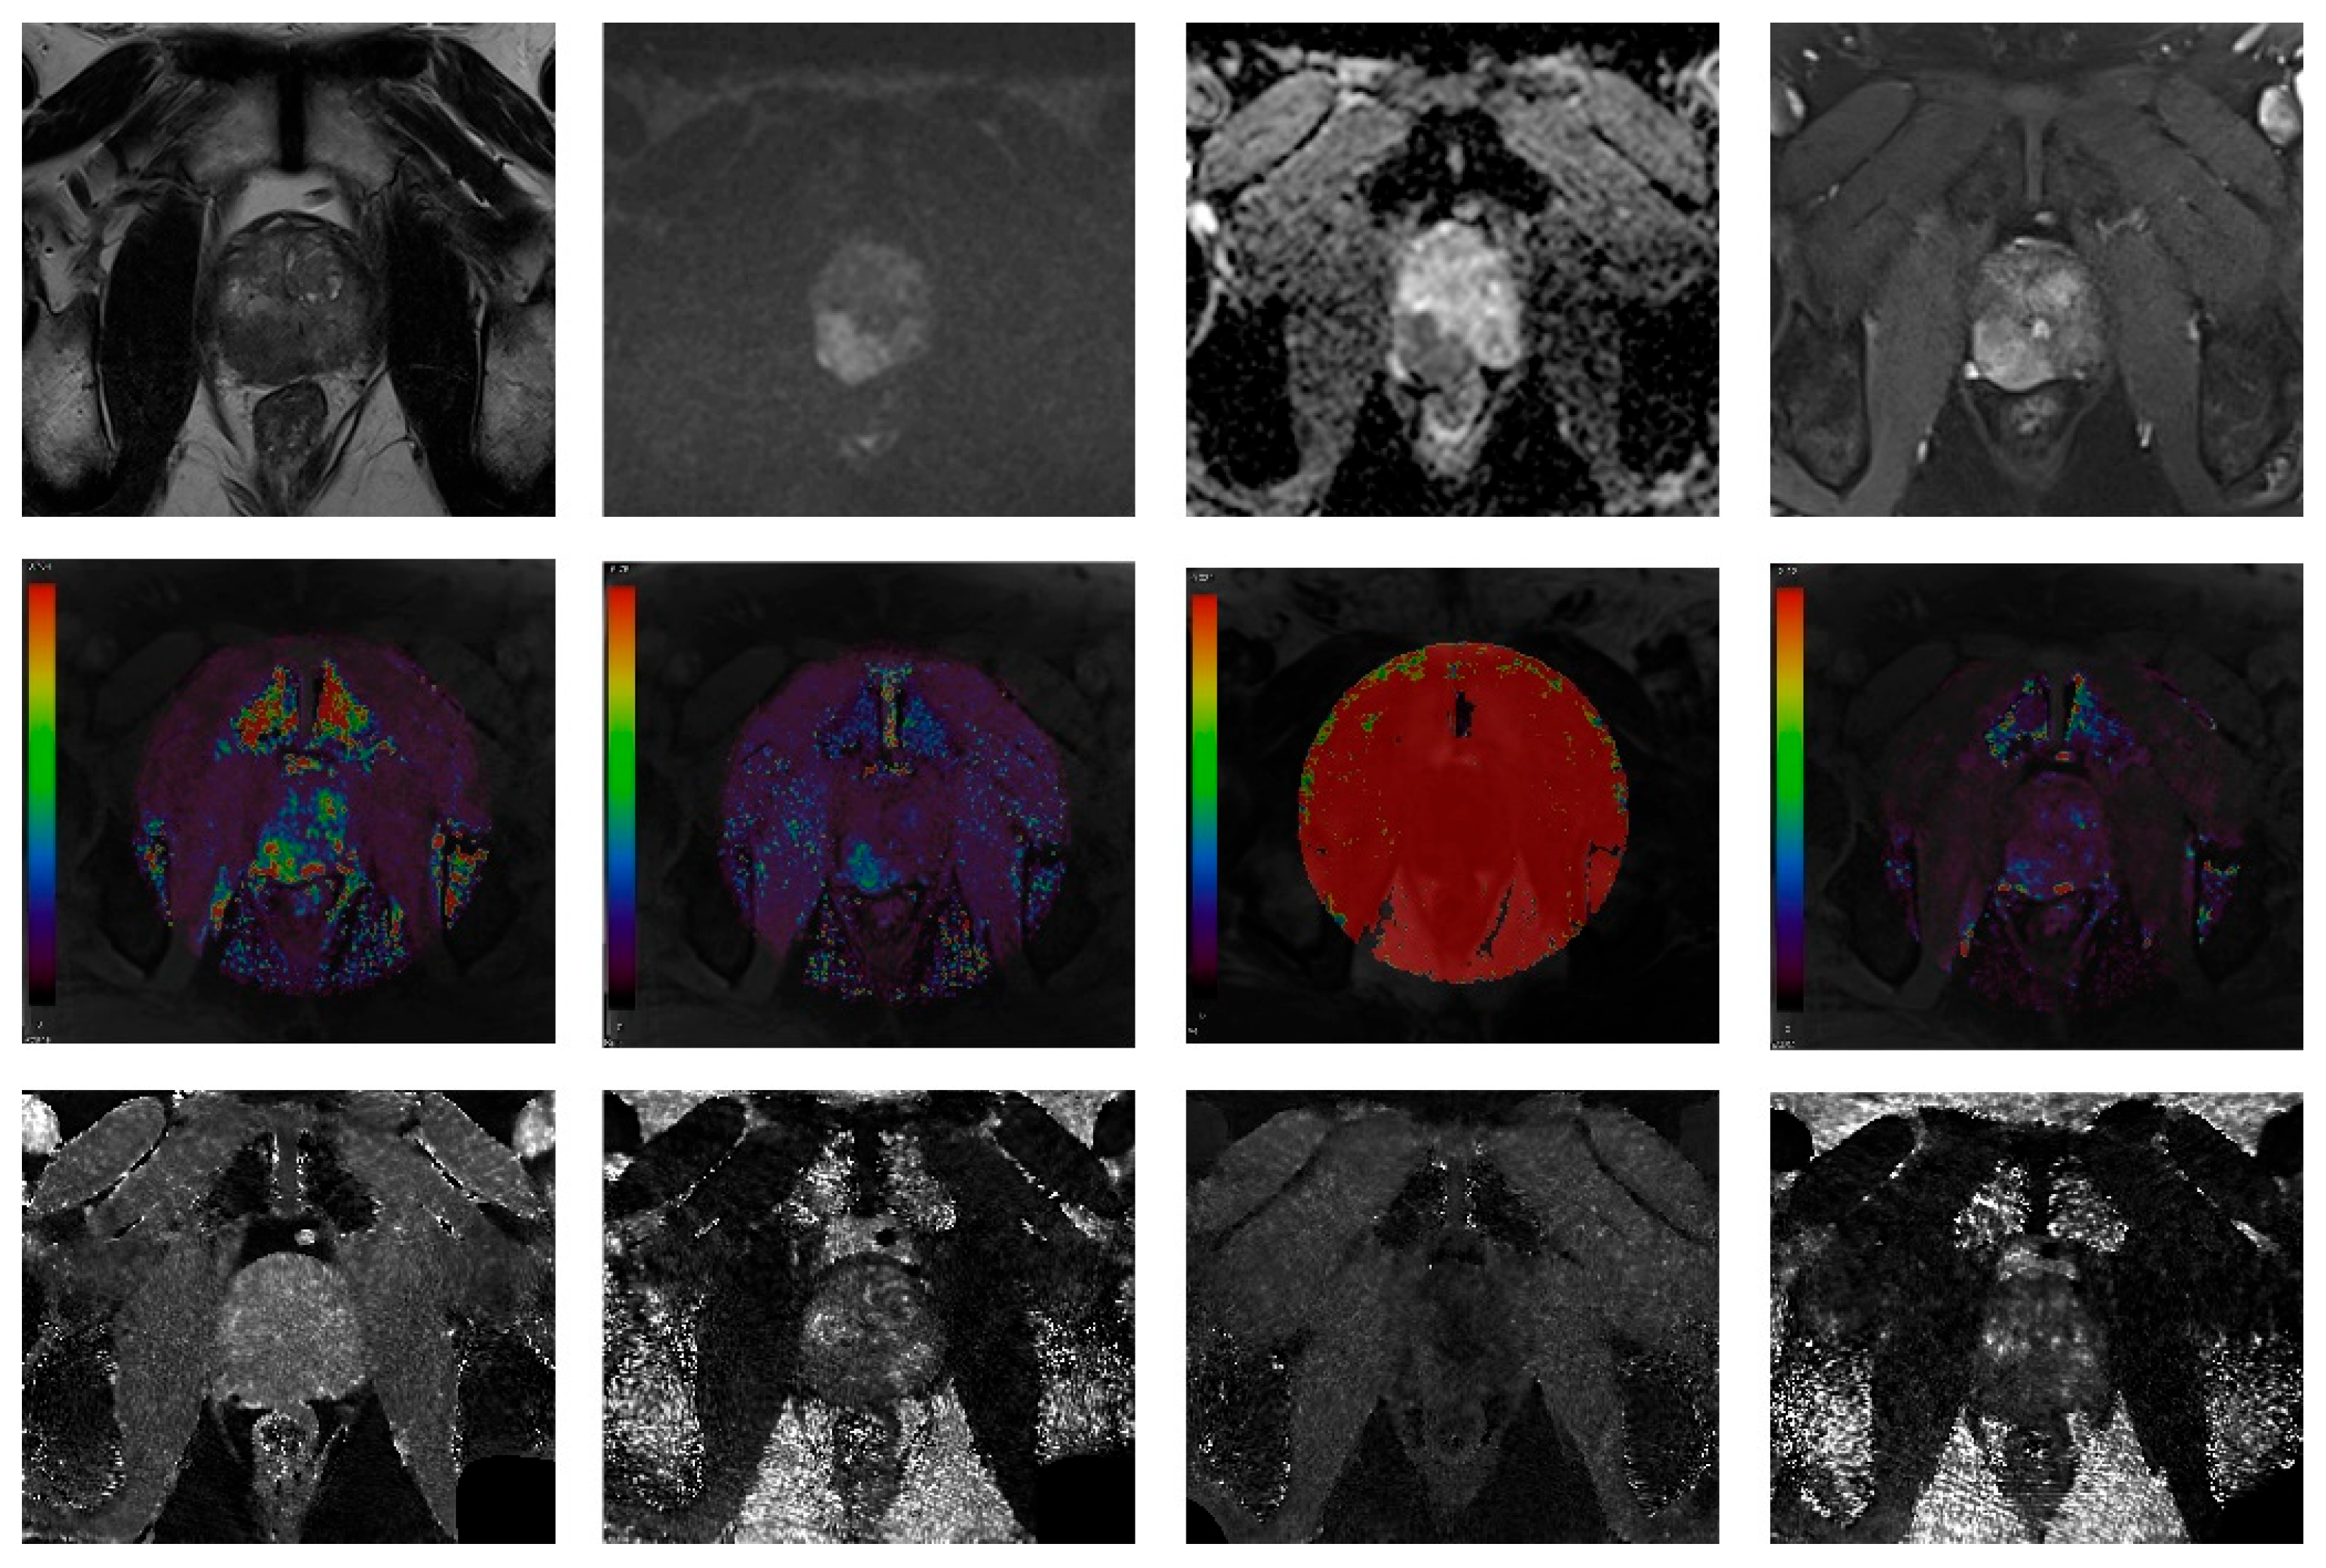
Rough information about the location of the most severe prostate focal lesion (right or left, peripheral zone or transition zone) that was reported in the clinical MRI report was provided to the radiologists. However, they were unaware of the biopsy results. They independently drew a region-of-interest (ROI) covering the abnormal focal lesion on the axial image that contained the largest diameter of the lesion. The average values of the parameters were extracted from the ROIs. The images of a representative case are presented in Figure 2.
A 2.5 cm hypointense bulging lesion was detected in the right peripheral zone on the T2-weighted image (T2WI) with a high signal intensity on the B = 1500 mm2/s diffusion-weighted image (DWI), a low value on the apparent diffusion coefficient (ADC) map, and early enhancement on the dynamic contrast-enhanced (DCE) MRI (T2WI, DWI, ADC map and DCE MRI in order from left, top row). The DCE parametric maps (Ktrans, Kep, Ve, and iAUC in order, middle row) and MRF maps (nonenhanced [NE] T1, NE T2, contrast-enhanced [CE] T1, and CE T2 maps in order, bottom row) are presented.

2.4. Statistical Analysis

The characteristics of the patients were summarized by presenting the mean and standard deviation for continuous variables, and the frequency and percentage for categorical variables.
Inter-reader agreement for all image parameters was assessed with an intraclass correlation coefficient (ICC). The ICC was interpreted as <0.5, poor; 0.5–0.75, moderate; 0.75–0.9, good; and >0.9, excellent agreement.
Prostate focal lesions were classified into prostate cancer and noncancer according to the biopsy results. We compared the clinical characteristics and quantitative parameters between prostate cancer and noncancer by lesions using Student’s t tests. The analysis of the correlations between the DCE MRI parameters and MRF values was conducted through Pearson’s correlation tests. For statistical analysis, SPSS software version 24.0 (IBM, Armonk, NY, USA) and GraphPad Prism version 8.0 (GraphPad Software, Inc., La Jolla, CA, USA) were used. A p value below 0.05 was regarded as statistically significant.

3. Results

Table 2 shows the characteristics of the patients. The mean PSA of the patients was 37.7 ± 112.2 ng/mL. The prostate focal lesion was located in the peripheral zone in 46 patients (67.6%). More than half of the lesions (51.5%) were classified as PI-RADS 5. Prostate cancer was diagnosed in 51 patients (75.0%), and prostate cancer with Gleason grade group 1 was diagnosed in 4 patients.
Inter-reader agreement for the CE T1 values and the iAUC was excellent; that for the T2 change was moderate; and that for the rest of the variables was good (Table 3).
Patients with prostate cancer were significantly older than patients without prostate cancer (71.8 ± 9.2 versus 64.6 ± 10.8, p = 0.009), but the PSA level was not different between the two groups. The PI-RADS classification was higher in prostate cancer (4.63 ± 0.49) than noncancer lesions (4.12 ± 0.49) (p = 0.001).
Table 4 shows the differences in the image parameters between noncancer and prostate cancer in the peripheral zone for reader 1 and reader 2. For both readers, the CE T2 values were significantly lower in prostate cancer than in noncancer. The T1 and T2 values were lower in prostate cancer than in noncancer without statistical significance. Among the DCE parameters, Ktrans, Kep, and iAUC were significantly higher in prostate cancer than in noncancer. In the transition zone, only the CE T2 value was significantly lower in prostate cancer than in noncancer for both readers, although the CE T1 value was significantly higher in prostate cancer than in noncancer by reader 2 (Table 5). No DCE parameter was significantly different between cancer and noncancer.
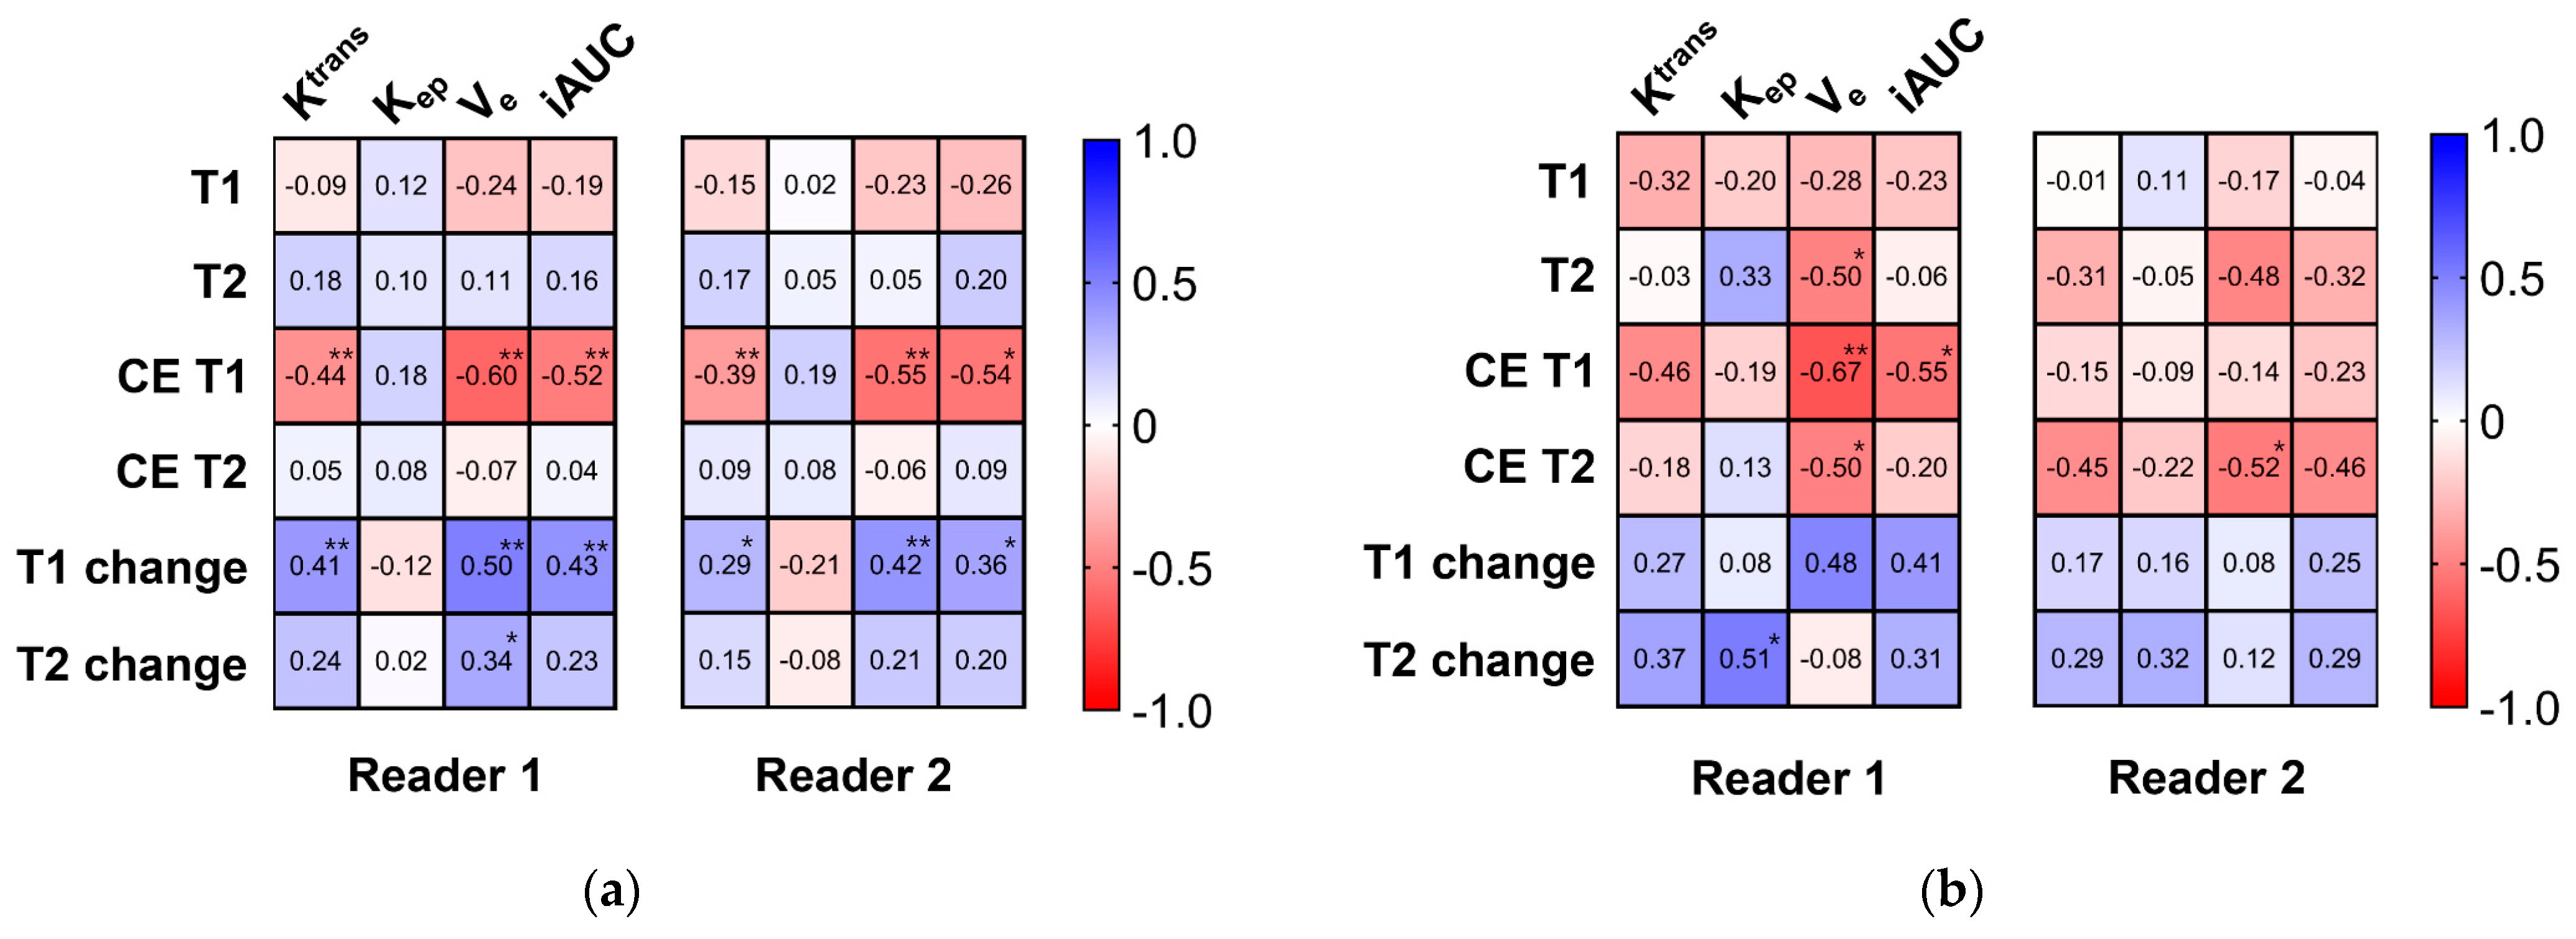
Correlation coefficients between the MRF parameters and DCE MRI parameters are presented in Figure 3. In prostate cancer, the CE T1 value was negatively correlated, and the T1 change was positively correlated with three DCE parameters (Ktrans, Ve, and iAUC). The T1 value was not correlated with any DCE parameters. In noncancer, a significant correlation was commonly noted only between the CE T2 value and Ve for both readers. The correlation between the CE T1 value and DCE parameters in the peripheral zone lesions is presented in Figure 4. The CE T1 value was significantly correlated with Ktrans, Ve, and iAUC in prostate cancer. In contrast, no DCE parameter showed a significant correlation with the CE T1 value in noncancer.

4. Discussion

In this study, we acquired NE MRF and CE MRF as well as DCE MRI as a part of prebiopsy prostate MRI in patients who underwent prostate biopsy. We evaluated the parameters from MRF to DCE MRI in prostate focal lesions with PI-RADS classification ≥ 3, and the lesions were divided into prostate cancer and noncancer according to the biopsy results. Therefore, we could evaluate the differences in the MRI parameters between prostate cancer and noncancer lesions in the peripheral zone and the transition zone. Additionally, we investigated the correlations amongst the T1 and T2 values from NE MRF and CE MRF with the DCE MRI parameters in prostate cancer and noncancer lesions.
Among DCE parameters, Ve was not different between prostate cancer and noncancer lesions. Ktrans, Kep, and iAUC were significantly higher in prostate cancer than in noncancer lesions in the peripheral zone but not in the transition zone. Our study agreed with many studies that showed similar results. A previous study showed that Ktrans, Kep, and AUC for 90 s after injection were significantly higher in prostate cancer than in the normal peripheral zone or in prostate cancer than in benign lesions [14,23]. Other studies showed that Ktrans and iAUC were significantly higher in low-grade cancer than in high-grade cancer in the peripheral zone, but not in the transition zone [7,13]. No DCE parameter was significantly different between tumor and benign nodules in the transition zone [24]. Ve was not different between prostate cancer and benign tissue or between clinically significant cancer and clinically insignificant cancer in the studies [14,25,26].
We evaluated T1 and T2 values from NE and CE MRF values and the changes in T1 and T2 values. The differences in MRF-derived CE T1 and CE T2 values between prostate focal lesions (including cancer) and the normal peripheral zone or transition zone have been reported previously [20,21]. The differences in CE MRF values between noncancer and prostate cancer have not been evaluated. For both readers, only the CE T2 value was significantly lower in prostate cancer than in noncancer lesions in the peripheral zone and transition zone. As no study has evaluated CE T1 or T2 values between prostate cancer and noncancer, a further evaluation is necessary to validate the results. We interpret this result based on the same context as a previous study; the CE T2 value was significantly lower in prostate cancer than the normal peripheral zone or transition zone [21]. However, the CE T1 value was not significantly different between cancer and noncancer lesions. These results were not expected because we usually use T1WI to evaluate CE MRI. Obtaining CE MRF more than 3 min after contrast injection may be the reason why the CE T1 value was not different between prostate cancer and noncancer. The absolute T1 value of the focal lesion in the delayed phase may not be related to the enhancement pattern in the early phase when prostate cancer commonly shows early enhancement and rapid washout [10,27]. The amount of contrast that is retained in prostate cancer may not be enough to make a significant difference compared to noncancer in the delayed phase.
Regarding NE MRF, both readers’ results commonly showed that T1 and T2 values were not different between prostate cancer and noncancer lesions in the peripheral zone and transition zone. Some previous studies showed significantly lower T1 and T2 values in prostate cancer than in noncancer lesions in both the peripheral zone and transition zone [17,18]. In another study that analyzed prostate focal lesions regardless of location, the T2 value was significantly lower in prostate cancer with Gleason grade group ≥ 2 than in noncancer. In the current study, the T2 value of peripheral zone cancer was lower than that of noncancer, but it did not reach statistical significance. Additionally, there was no significant difference in the T1 and T2 values between prostate cancer and noncancer lesions in the transition zone. The differences in the results between the current study and previous studies may be due to the small number of patients in each zone and the noncancer group in this study.
Correlations between CE MRF values and DCE parameters have not been evaluated. The CE T1 value was negatively correlated with Ktrans, Ve, and iAUC in prostate cancer but not in noncancer lesions. The same results were observed in the peripheral zone. As Ktrans represents the permeability of the vasculature, a higher Ktrans means a larger amount of contrast leakage into the EES that causes a greater decrease in the T1 value. Among DCE MRI parameters, Ve showed the strongest correlation with the CE T1 value in prostate cancer. Tissue with a larger Ve, which is the fractional volume of the EES per unit tissue volume, may retain more contrast material, leading to a greater reduction in the T1 value on CE MRF. We noted that Kep, which describes contrast reflux from the EES back into the vascular component, was not correlated with any MRF parameters in prostate cancer and noncancer. CE MRF was acquired after DCE MRI and may represent the characteristics of the tissue in the delayed phase. Therefore, Kep may not affect the CE T1 value in the delayed phase. Thus, this study proved that CE MRF values have different meanings from the DCE parameters; this is understandable because CE MRF values are absolute values measured at a certain time point and DCE parameters are used to measure the pharmacokinetic effects of the contrast material.
There are several limitations in this study. First, this study is a retrospective study. Although all patients underwent MRI-ultrasound fusion biopsy, it was difficult to assure that the focal lesion on prebiopsy MRI was successfully targeted. However, we believe that MRI-ultrasound fusion biopsy is the best clinically available method. Second, the number of patients, especially the number of patients with transition zone lesions, was relatively small. This study evaluated patients who underwent prebiopsy CE MRI, including NE and CE MRF and biopsy. The inclusion criteria for this study were stringent, resulting in a limited number of participants. Despite this constraint on sample size, the findings offer valuable insights. Future research with larger patient cohorts will be pivotal in confirming and enhancing the understanding gained from this study. Third, image analysis was performed on a single axial image that may not reflect the characteristics of the entire lesion. The high inter-reader agreement between the two readers in this study may compensate for the limitation of the single-section image analysis. However, it is noteworthy that despite the high inter-reader agreement between the two readers, the significance of the statistical analyses showed slight variations between them. This could be attributed to the relatively small size of prostate lesions, as including a slightly different number of pixels could lead to minor yet significant alterations in the measurements. Fourth, while statistically significant correlations were identified between MRF-derived values and DCE parameters, these findings did not hold sufficient clinical relevance to routinely substitute DCE-MRI with CE MRF from a quantitative standpoint. Nonetheless, considering that correlations between DCE parameters and MRF values have not been explored previously, presenting these results appears to be meaningful.

5. Conclusions

Some CE MRF values are different between prostate cancer and noncancer tissues and correlated with DCE-MRI parameters. Prostate cancer and noncancer tissues may have different characteristics regarding contrast enhancement.

Author Contributions

Conceptualization, D.-H.K. and Y.-J.L.; methodology, M.-H.C.; software, D.H.; validation, M.-H.C. and Y.-J.L.; formal analysis, M.-H.C.; investigation, M.-H.C.; resources, D.H.; data curation, M.-H.C. and Y.-J.L.; writing—original draft preparation, M.-H.C.; writing—review and editing, M.-H.C., Y.-J.L., D.-H.K. and D.H.; visualization, M.-H.C.; supervision, Y.-J.L.; project administration, Y.-J.L.; funding acquisition, M.-H.C. All authors have read and agreed to the published version of the manuscript.

Funding

This work was supported by the Catholic Medical Center Research Foundation made in the program year 2022, and by the National Research Foundation of Korea (NRF) grant funded by the Korean government (No. NRF-2022R1F1A1069476).

Institutional Review Board Statement

The study was conducted in accordance with the Declaration of Helsinki and approved by the Institutional Review Board of Eunpyeong St. Mary’s hospital (PC21RISI0213, 15 December 2021).

Informed Consent Statement

Patient consent was waived due to retrospective study design.

Data Availability Statement

The datasets generated or analyzed during the study are not publicly available due to privacy protection for patients but are available from the corresponding author on reasonable request.

Conflicts of Interest

Dongyeob Han is an employee of Siemens Healthineers, Ltd. Moon Hyung Choi is currently receiving a research grant from Siemens Healthineers, but the research was not related to prostate MRF. The funders had no role in the design of the study; in the collection, analyses, or interpretation of the data; in the writing of the manuscript; or in the decision to publish the results.

References

  1. Weinreb, J.C.; Barentsz, J.O.; Choyke, P.L.; Cornud, F.; Haider, M.A.; Macura, K.J.; Margolis, D.; Schnall, M.D.; Shtern, F.; Tempany, C.M.; et al. PI-RADS Prostate Imaging-Reporting and Data System: 2015, Version 2. Eur. Urol. 2016, 69, 16–40. [Google Scholar] [CrossRef]
  2. Tamada, T.; Kido, A.; Yamamoto, A.; Takeuchi, M.; Miyaji, Y.; Moriya, T.; Sone, T. Comparison of Biparametric and Multiparametric MRI for Clinically Significant Prostate Cancer Detection With PI-RADS Version 2.1. J. Magn. Reson. Imaging 2021, 53, 283–291. [Google Scholar] [CrossRef] [PubMed]
  3. Kuhl, C.K.; Bruhn, R.; Kramer, N.; Nebelung, S.; Heidenreich, A.; Schrading, S. Abbreviated Biparametric Prostate MR Imaging in Men with Elevated Prostate-specific Antigen. Radiology 2017, 285, 493–505. [Google Scholar] [CrossRef] [PubMed]
  4. Di Campli, E.; Delli Pizzi, A.; Seccia, B.; Cianci, R.; d’Annibale, M.; Colasante, A.; Cinalli, S.; Castellan, P.; Navarra, R.; Iantorno, R.; et al. Diagnostic accuracy of biparametric vs multiparametric MRI in clinically significant prostate cancer: Comparison between readers with different experience. Eur. J. Radiol. 2018, 101, 17–23. [Google Scholar] [CrossRef]
  5. Stabile, A.; Giganti, F.; Rosenkrantz, A.B.; Taneja, S.S.; Villeirs, G.; Gill, I.S.; Allen, C.; Emberton, M.; Moore, C.M.; Kasivisvanathan, V. Multiparametric MRI for prostate cancer diagnosis: Current status and future directions. Nat. Rev. Urol. 2020, 17, 41–61. [Google Scholar] [CrossRef]
  6. Berman, R.M.; Brown, A.M.; Chang, S.D.; Sankineni, S.; Kadakia, M.; Wood, B.J.; Pinto, P.A.; Choyke, P.L.; Turkbey, B. DCE MRI of prostate cancer. Abdom. Radiol. 2016, 41, 844–853. [Google Scholar] [CrossRef] [PubMed]
  7. Barentsz, J.O.; Richenberg, J.; Clements, R.; Choyke, P.; Verma, S.; Villeirs, G.; Rouviere, O.; Logager, V.; Fütterer, J.J. ESUR prostate MR guidelines 2012. Eur. Radiol. 2012, 22, 746–757. [Google Scholar] [CrossRef]
  8. Ziayee, F.; Ullrich, T.; Blondin, D.; Irmer, H.; Arsov, C.; Antoch, G.; Quentin, M.; Schimmöller, L. Impact of qualitative, semi-quantitative, and quantitative analyses of dynamic contrast-enhanced magnet resonance imaging on prostate cancer detection. PLoS ONE 2021, 16, e0249532. [Google Scholar] [CrossRef]
  9. Afshari Mirak, S.; Mohammadian Bajgiran, A.; Sung, K.; Asvadi, N.H.; Markovic, D.; Felker, E.R.; Lu, D.; Sisk, A.; Reiter, R.E.; Raman, S.S. Dynamic contrast-enhanced (DCE) MR imaging: The role of qualitative and quantitative parameters for evaluating prostate tumors stratified by Gleason score and PI-RADS v2. Abdom. Radiol. 2020, 45, 2225–2234. [Google Scholar] [CrossRef]
  10. Hansford, B.G.; Peng, Y.; Jiang, Y.; Vannier, M.W.; Antic, T.; Thomas, S.; McCann, S.; Oto, A. Dynamic Contrast-enhanced MR Imaging Curve-type Analysis: Is It Helpful in the Differentiation of Prostate Cancer from Healthy Peripheral Zone? Radiology 2015, 275, 448–457. [Google Scholar] [CrossRef]
  11. Franiel, T.; Hamm, B.; Hricak, H. Dynamic contrast-enhanced magnetic resonance imaging and pharmacokinetic models in prostate cancer. Eur. Radiol. 2011, 21, 616–626. [Google Scholar] [CrossRef] [PubMed]
  12. Yuan, Q.; Costa, D.N.; Senegas, J.; Xi, Y.; Wiethoff, A.J.; Rofsky, N.M.; Roehrborn, C.; Lenkinski, R.E.; Pedrosa, I. Quantitative diffusion-weighted imaging and dynamic contrast-enhanced characterization of the index lesion with multiparametric MRI in prostate cancer patients. J. Magn. Reson. Imaging 2017, 45, 908–916. [Google Scholar] [CrossRef] [PubMed]
  13. Vos, E.K.; Litjens, G.J.; Kobus, T.; Hambrock, T.; Hulsbergen-van de Kaa, C.A.; Barentsz, J.O.; Huisman, H.J.; Scheenen, T.W. Assessment of prostate cancer aggressiveness using dynamic contrast-enhanced magnetic resonance imaging at 3 T. Eur. Urol. 2013, 64, 448–455. [Google Scholar] [CrossRef] [PubMed]
  14. Cho, E.; Chung, D.J.; Yeo, D.M.; Sohn, D.; Son, Y.; Kim, T.; Hahn, S.-T. Optimal cut-off value of perfusion parameters for diagnosing prostate cancer and for assessing aggressiveness associated with Gleason score. Clin. Imaging 2015, 39, 834–840. [Google Scholar] [CrossRef] [PubMed]
  15. Cristel, G.; Esposito, A.; Damascelli, A.; Briganti, A.; Ambrosi, A.; Brembilla, G.; Brunetti, L.; Antunes, S.; Freschi, M.; Montorsi, F.; et al. Can DCE-MRI reduce the number of PI-RADS v.2 false positive findings? Role of quantitative pharmacokinetic parameters in prostate lesions characterization. Eur. J. Radiol. 2019, 118, 51–57. [Google Scholar] [CrossRef] [PubMed]
  16. Ma, D.; Gulani, V.; Seiberlich, N.; Liu, K.; Sunshine, J.L.; Duerk, J.L.; Griswold, M.A. Magnetic resonance fingerprinting. Nature 2013, 495, 187–192. [Google Scholar] [CrossRef] [PubMed]
  17. Panda, A.; O’Connor, G.; Lo, W.C.; Jiang, Y.; Margevicius, S.; Schluchter, M.; Ponsky, L.E.; Gulani, V. Targeted Biopsy Validation of Peripheral Zone Prostate Cancer Characterization With Magnetic Resonance Fingerprinting and Diffusion Mapping. Investig. Radiol. 2019, 54, 485–493. [Google Scholar] [CrossRef]
  18. Panda, A.; Obmann, V.C.; Lo, W.C.; Margevicius, S.; Jiang, Y.; Schluchter, M.; Patel, I.J.; Nakamoto, D.; Badve, C.; Griswold, M.A.; et al. MR Fingerprinting and ADC Mapping for Characterization of Lesions in the Transition Zone of the Prostate Gland. Radiology 2019, 292, 685–694. [Google Scholar] [CrossRef]
  19. Han, D.; Choi, M.H.; Lee, Y.J.; Kim, D.H. Feasibility of Novel Three-Dimensional Magnetic Resonance Fingerprinting of the Prostate Gland: Phantom and Clinical Studies. Korean J. Radiol. 2021, 22, 1332–1340. [Google Scholar] [CrossRef]
  20. Sushentsev, N.; Kaggie, J.D.; Buonincontri, G.; Schulte, R.F.; Graves, M.J.; Gnanapragasam, V.J.; Barrett, T. The effect of gadolinium-based contrast agent administration on magnetic resonance fingerprinting-based T1 relaxometry in patients with prostate cancer. Sci. Rep. 2020, 10, 20475. [Google Scholar] [CrossRef]
  21. Lee, Y.S.; Choi, M.H.; Lee, Y.J.; Han, D.; Kim, D.H. Magnetic resonance fingerprinting in prostate cancer before and after contrast enhancement. Br. J. Radiol. 2022, 95, 20210479. [Google Scholar] [CrossRef] [PubMed]
  22. Cuenod, C.A.; Balvay, D. Perfusion and vascular permeability: Basic concepts and measurement in DCE-CT and DCE-MRI. Diagn. Interv. Imaging 2013, 94, 1187–1204. [Google Scholar] [CrossRef] [PubMed]
  23. Ocak, I.; Bernardo, M.; Metzger, G.; Barrett, T.; Pinto, P.; Albert, P.S.; Choyke, P.L. Dynamic contrast-enhanced MRI of prostate cancer at 3 T: A study of pharmacokinetic parameters. AJR Am. J. Roentgenol. 2007, 189, 849. [Google Scholar] [CrossRef] [PubMed]
  24. Chesnais, A.L.; Niaf, E.; Bratan, F.; Mege-Lechevallier, F.; Roche, S.; Rabilloud, M.; Colombel, M.; Rouvière, O. Differentiation of transitional zone prostate cancer from benign hyperplasia nodules: Evaluation of discriminant criteria at multiparametric MRI. Clin. Radiol. 2013, 68, e323–e330. [Google Scholar] [CrossRef] [PubMed]
  25. Oto, A.; Kayhan, A.; Jiang, Y.; Tretiakova, M.; Yang, C.; Antic, T.; Dahi, F.; Shalhav, A.L.; Karczmar, G.; Stadler, W.M.; et al. Prostate cancer: Differentiation of central gland cancer from benign prostatic hyperplasia by using diffusion-weighted and dynamic contrast-enhanced MR imaging. Radiology 2010, 257, 715–723. [Google Scholar] [CrossRef] [PubMed]
  26. Meyer, H.J.; Wienke, A.; Surov, A. Can dynamic contrast enhanced MRI predict gleason score in prostate cancer? A systematic review and meta analysis. Urol. Oncol. 2021, 39, 784.e17–784.e25. [Google Scholar] [CrossRef] [PubMed]
  27. Noworolski, S.M.; Henry, R.G.; Vigneron, D.B.; Kurhanewicz, J. Dynamic contrast-enhanced MRI in normal and abnormal prostate tissues as defined by biopsy, MRI, and 3D MRSI. Magn. Reson. Med. 2005, 53, 249–255. [Google Scholar] [CrossRef]
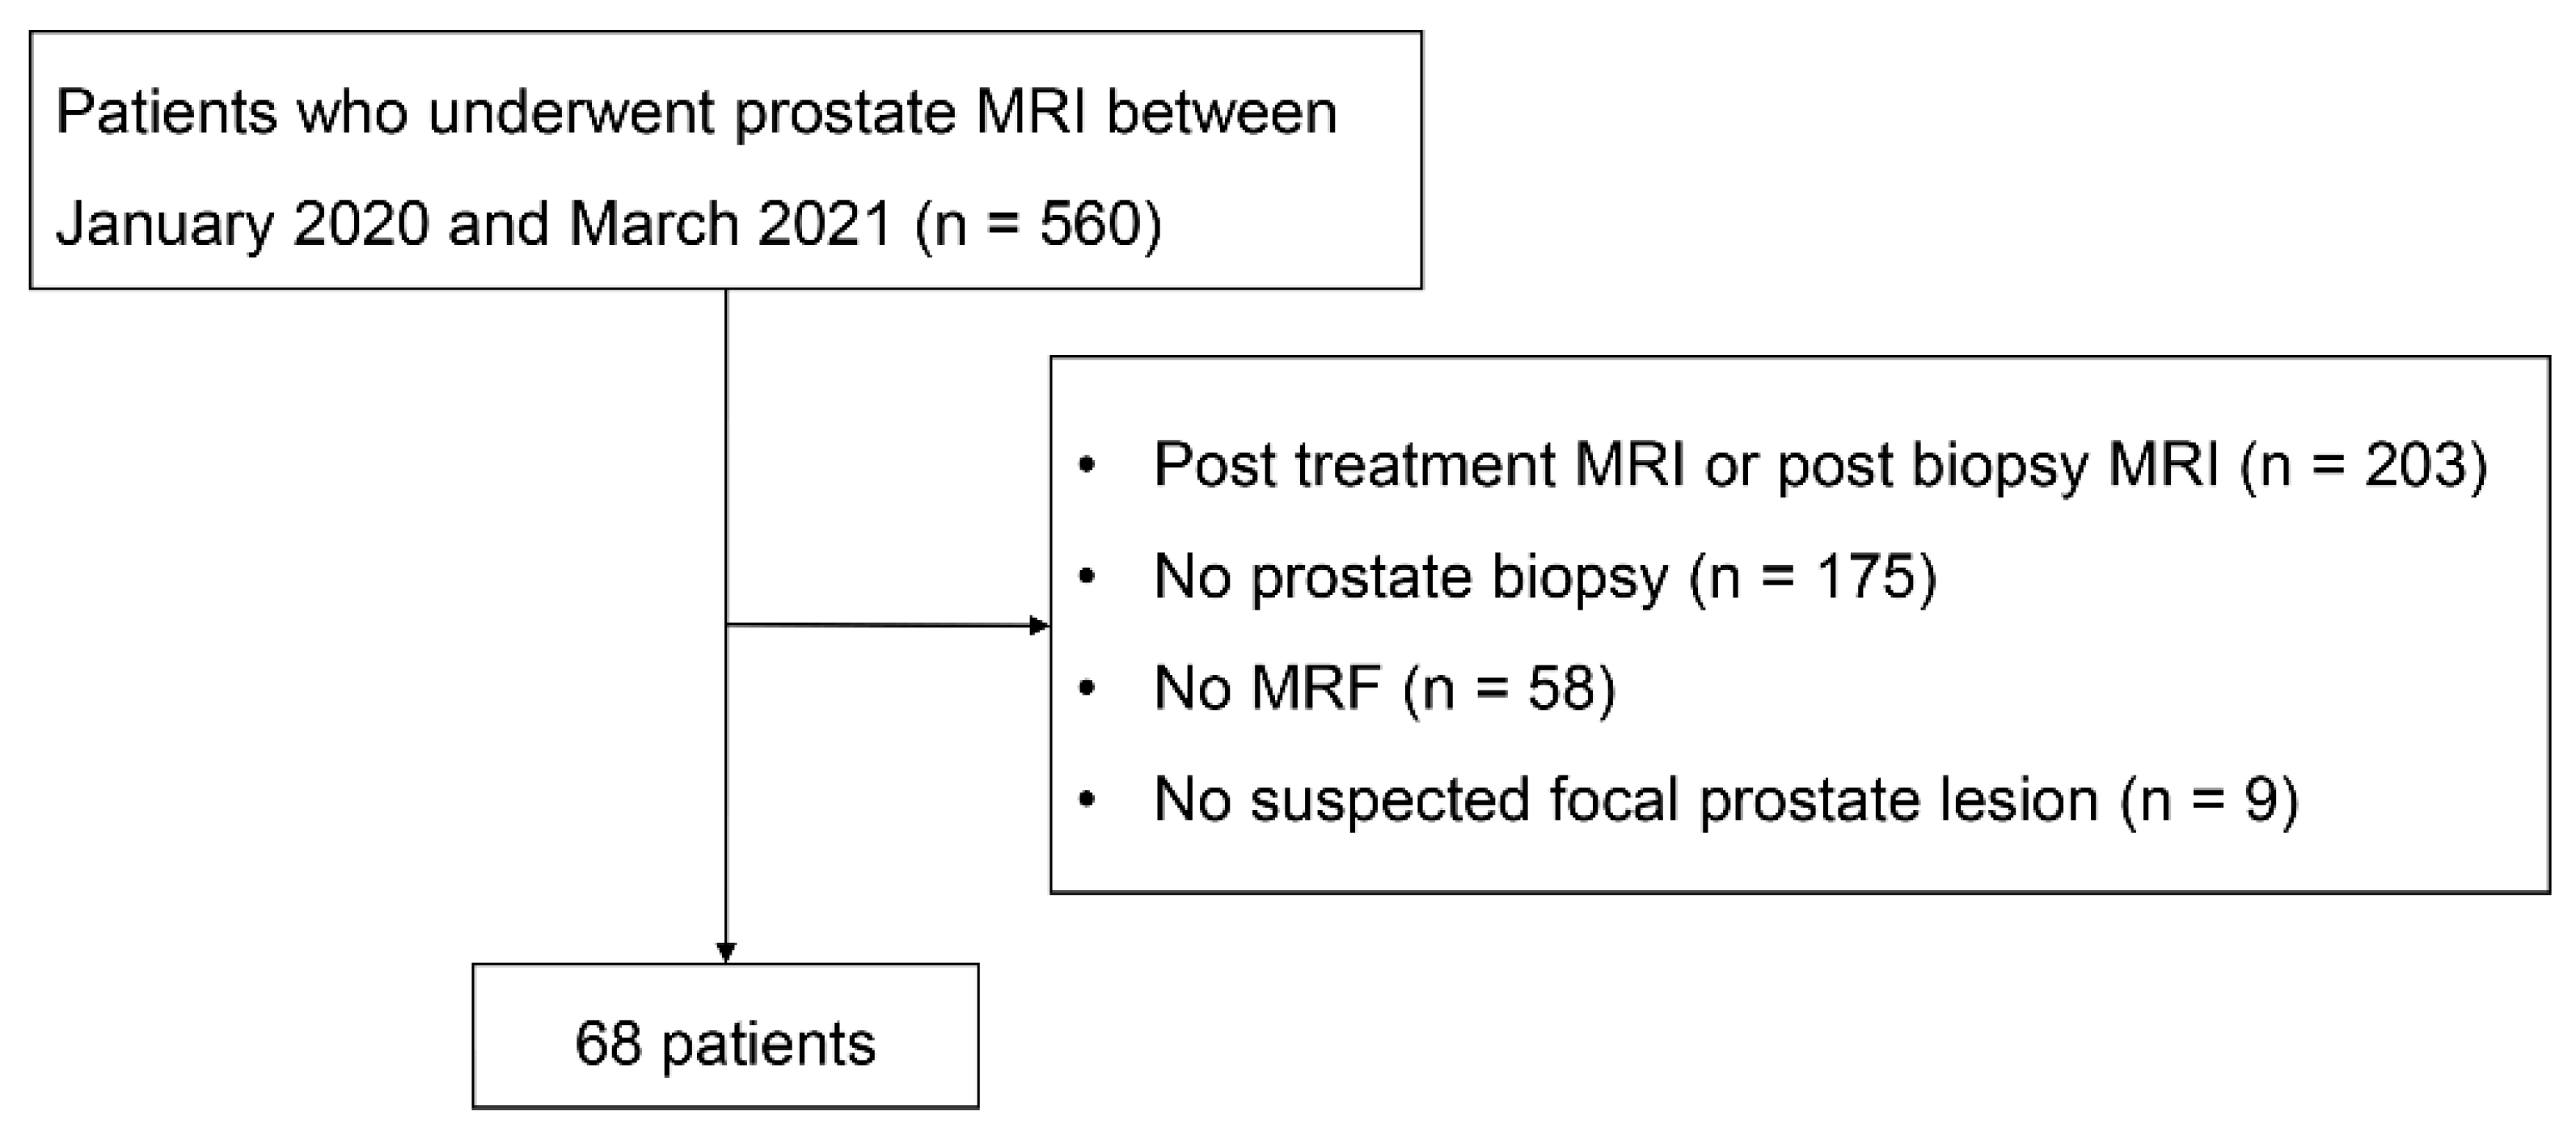
Figure 1. Flowchart of the patient inclusion process.
Curroncol 30 00750 g001
Figure 2. A 66-year-old patient with elevated prostate-specific antigen (15.5 ng/mL).
Curroncol 30 00750 g002
Figure 3. Correlation matrix between MR fingerprinting and DCE MRI parameters. Correlation matrices between MR fingerprinting parameters (T1 value, T2 value, CE T1 value, CE T2 value, T1 change, and T2 change) and DCE MRI parameters (Ktrans, Kep, Ve, and iAUC) are presented for reader 1’s result (left) and reader 2’s results (right) in cancer (a) and noncancer (b). * p < 0.05, ** p < 0.01.
Curroncol 30 00750 g003
Figure 4. Correlation between CE T1 map and DCE parameters in peripheral zone lesions. Scatter plots show the correlation between the CE T1 value and DCE parameters in prostate cancer and noncancer for reader 1 (a,c) and reader 2 (b,d). * p < 0.05, ** p < 0.01.
Curroncol 30 00750 g004
Table 1. MRI parameters.
Axial T2WI
(TSE)
Coronal T2WI
(TSE)
Sagittal T2WI
(TSE)
3D T2WI
(CS 3D SPACE)
T1WI
(TSE)
DWIMRFDCE MRI
(GRASP)
TR (ms)2500–3000251042201800500–7005200–6000164
TE (ms)10310310010497642
Field of views (mm)180 × 180180 × 180180 × 180200 × 200180 × 180200 × 180160 × 160200 × 200
Matrix320 × 320640 × 640640 × 640577 × 577320 × 320120 × 108256 × 256224 × 224
Resolution (mm)0.6 × 0.60.3 × 0.30.3 × 0.30.3 × 0.30.6 × 0.61.7 × 1.70.6 × 0.60.9 × 0.9
Flip angle (degrees)13613612013512090Sinusoidal flip angle12
Slice thickness (mm)3330.63333
Gap00000000
NEX226222, 2, 9, 911
B values (s/mm2)-----0, 100, 1000, 1500--
Acquisition time (min:s)3:323:173:174:553:355:583:483:41
TR, repetition time; TE, echo time; T2WI, T2-weighted image; TSE, Turbo spin echo; CS, compressed sensing; SPACE, sampling perfection with application-optimized contrasts using different flip angle evolution; T1WI, T1-weighted image; DWI, diffusion-weighted image; MRF, magnetic resonance fingerprinting; DCE MRI, dynamic contrast-enhanced MRI; GRASP, Golden-angle RAdial Sparse Parallel MRI; NEX, number of excitations.
Table 2. Baseline characteristics of patients.
CharacteristicsValue
Number of patients68
Age (years)70.0 ± 10.0
PSA (ng/mL)37.7 ± 112.2
PI-RADS classification (n [%])
  31 (1.5)
  432 (47.1)
  535 (51.5)
Location of the focal lesion (n, [%])
  Peripheral zone46 (67.6)
  Transition zone22 (32.4)
Prostate cancer (n, [%])51 (75.0)
  Peripheral zone35 (68.6)
  Transition zone16 (31.4)
Gleason grade group (n, [%])
  14 (5.9)
  214 (20.6)
  318 (26.5)
  410 (14.7)
  55 (7.4)
PSA, prostate-specific antigen; PI-RADS, Prostate Imaging—Reporting and Data System.
Table 3. Inter-reader agreement in MRF and DCE parameters.
ParametersICCp Value
MRF
  T1 value (,)0.825<0.001
  T2 value (ms)0.898<0.001
  CE T1 value (ms)0.968<0.001
  CE T2 value (ms)0.859<0.001
  T1 change (%)0.892<0.001
  T2 change (%)0.708<0.001
DCE MRI
  Ktrans0.870<0.001
  Kep0.854<0.001
  Ve0.854<0.001
  iAUC0.904<0.001
ICC, intraclass correlation coefficient; ADC, apparent diffusion coefficient; MRF, magnetic resonance fingerprinting; CE, contrast-enhanced; DCE MRI, dynamic contrast-enhanced magnetic resonance imaging; iAUC, initial area under the curve.
Table 4. Differences in parameters between cancer and noncancer in peripheral zone.
ParametersReader 1Reader 2
Noncancer
(n = 11)
Prostate Cancer
(n = 35)
p ValueNoncancer
(n = 11)
Prostate Cancer
(n = 35)
p Value
MRF
  T1 value (ms)1626.1 ± 171.11488.2 ± 137.00.0091622.4 ± 169.51489.7 ± 210.90.064
  T2 value (ms)99.6 ± 27.783.1 ± 12.60.08195.17 ± 22.8479.62 ± 11.700.051
  CE T1 value (ms)624.9 ± 77.7593.3 ± 96.70.330640.1 ± 125.6608.4 ± 101.20.397
  CE T2 value (ms)95.04 ± 26.5874.9 ± 11.20.03296.41 ± 26.5571.93 ± 10.510.019
  T1 change (%)61.41 ± 4.2960.0 ± 6.340.49160.76 ± 4.8558.83 ± 6.790.386
  T2 change (%)3.999 ± 8.7719.424 ± 7.3490.047−1.935 ± 16.8636.904 ± 5.7860.116
DCE MRI
  Ktrans0.209 ± 0.1000.332 ± 0.1010.0010.241 ± 0.1040.328 ± 0.1070.021
  Kep0.857 ± 0.3821.181 ± 0.3580.0130.857 ± 0.2601.146 ± 0.4020.031
  Ve0.242 ± 0.0560.298 ± 0.1070.1050.279 ± 0.0890.307 ± 0.1220.489
  iAUC0.196 ± 0.0590.301 ± 0.0780.0010.227 ± 0.0910.299 ± 0.0840.018
ADC, apparent diffusion coefficient; MRF, magnetic resonance fingerprinting; CE, contrast-enhanced; DCE MRI, dynamic contrast-enhanced magnetic resonance imaging; iAUC, initial area under the curve.
Table 5. Differences in parameters between cancer and noncancer in transition zone.
ParametersReader 1Reader 2
Noncancer
(n = 6)
Prostate Cancer
(n = 16)
p ValueNoncancer
(n = 6)
Prostate Cancer
(n = 16)
p Value
MRF
  T1 value (ms)1596.0 ± 115.11575.8 ± 143.70.7621608.9 ± 141.81547.9 ± 188.70.483
  T2 value (ms)81.77 ± 15.2276.61 ± 7.930.30676.32 ± 11.4474.19 ± 9.520.662
  CE T1 value (ms)519.87 ± 72.06591.62 ± 94.440.109490.1 ± 48.8607.5 ± 103.80.016
  CE T2 value (ms)80.32 ± 9.9470.02 ± 8.130.02172.02 ± 5.5665.00 ± 7.370.048
  T1 change (%)67.15 ± 6.0562.48 ± 4.670.06869.32 ± 4.2960.79 ± 4.26<0.001
  T2 change (%)0.003 ± 14.2618.629 ± 4.6790.2024.107 ± 14.59512.138 ± 4.9570.061
DCE MRI
  Ktrans0.372 ± 0.1650.376 ± 0.1390.9540.322 ± 0.1730.384 ± 0.1180.342
  Kep1.042 ± 0.4641.247 ± 0.3720.2920.998 ± 0.5271.313 ± 0.4200.159
  Ve0.356 ± 0.0630.306 ± 0.0790.1780.318 ± 0.0550.302 ± 0.0760.650
  iAUC0.320 ± 0.1370.340 ± 0.1160.7300.286 ± 0.154 0.343 ± 0.1000.317
ADC, apparent diffusion coefficient; MRF, magnetic resonance fingerprinting; CE, contrast-enhanced; DCE MRI, dynamic contrast-enhanced magnetic resonance imaging; iAUC, initial area under the curve.
Disclaimer/Publisher’s Note: The statements, opinions and data contained in all publications are solely those of the individual author(s) and contributor(s) and not of MDPI and/or the editor(s). MDPI and/or the editor(s) disclaim responsibility for any injury to people or property resulting from any ideas, methods, instructions or products referred to in the content.