A Novel Deep Learning-Based (3D U-Net Model) Automated Pulmonary Nodule Detection Tool for CT Imaging

 ,
, 
Abstract
1. Introduction
2. Materials and Methods
2.1. Variables
2.2. Definitions
2.3. Study Methodology
2.4. Datasets
2.5. Stages of AI Pipeline
2.6. Training
3. Results
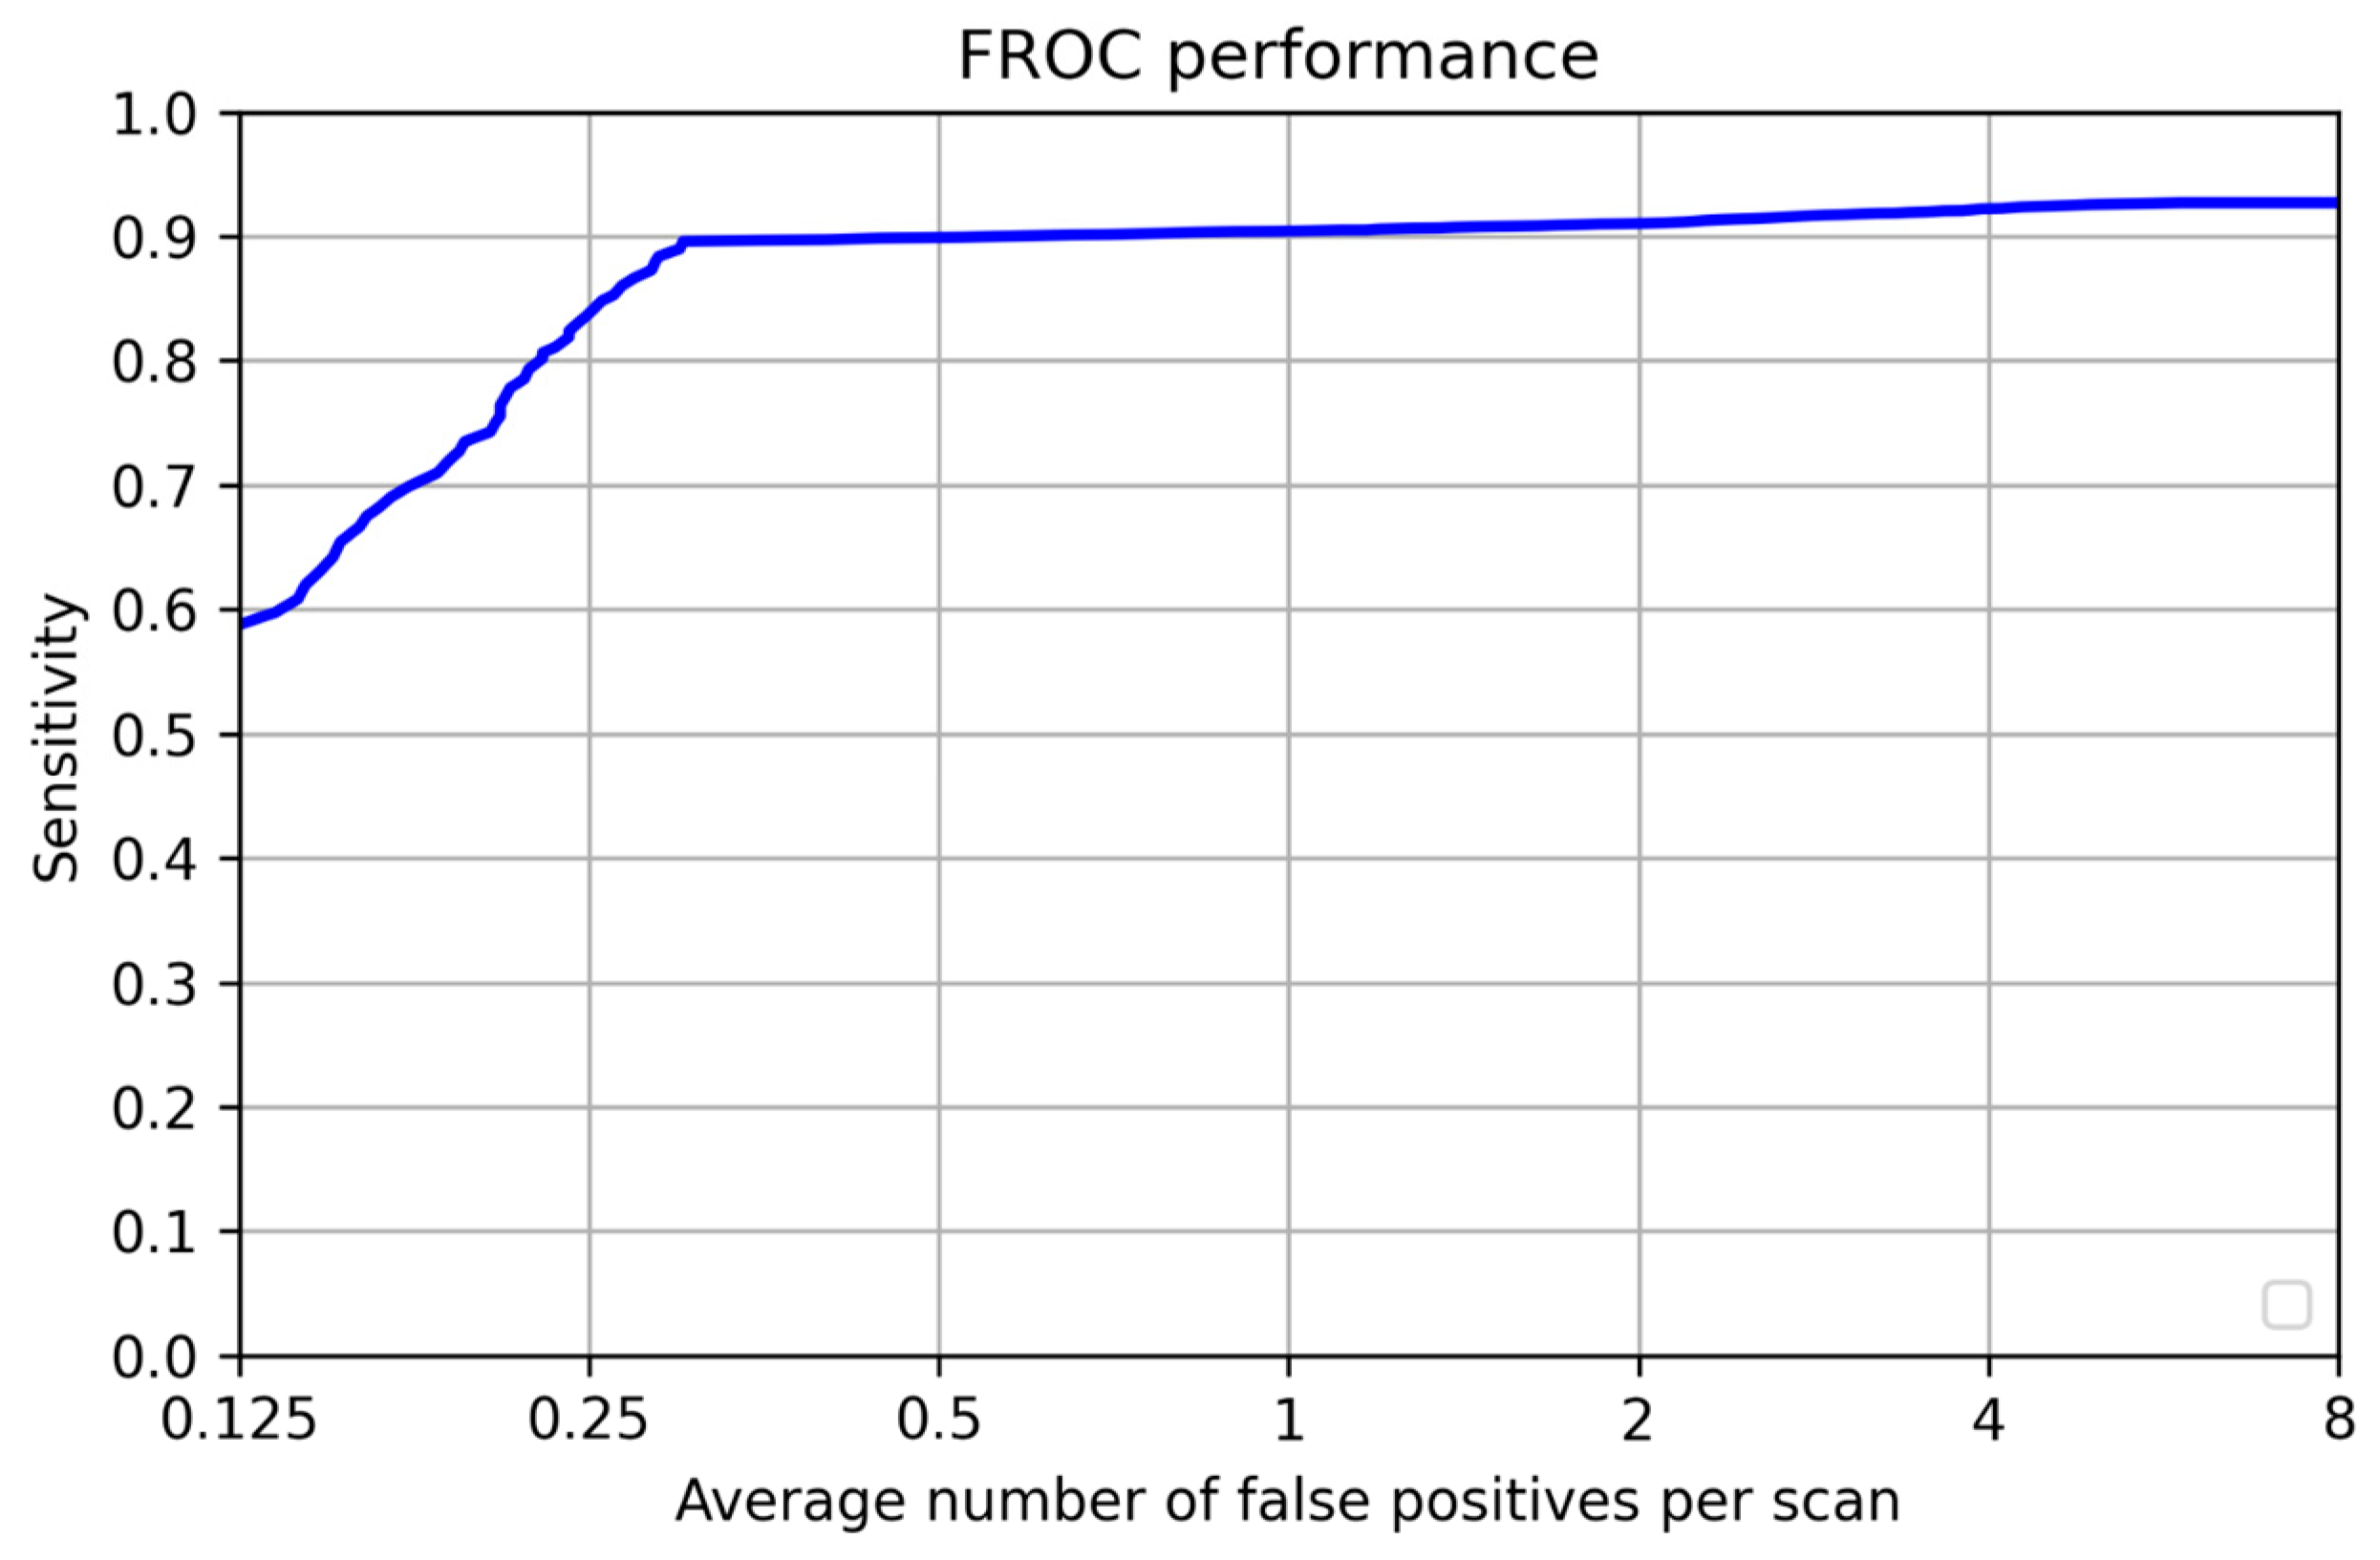
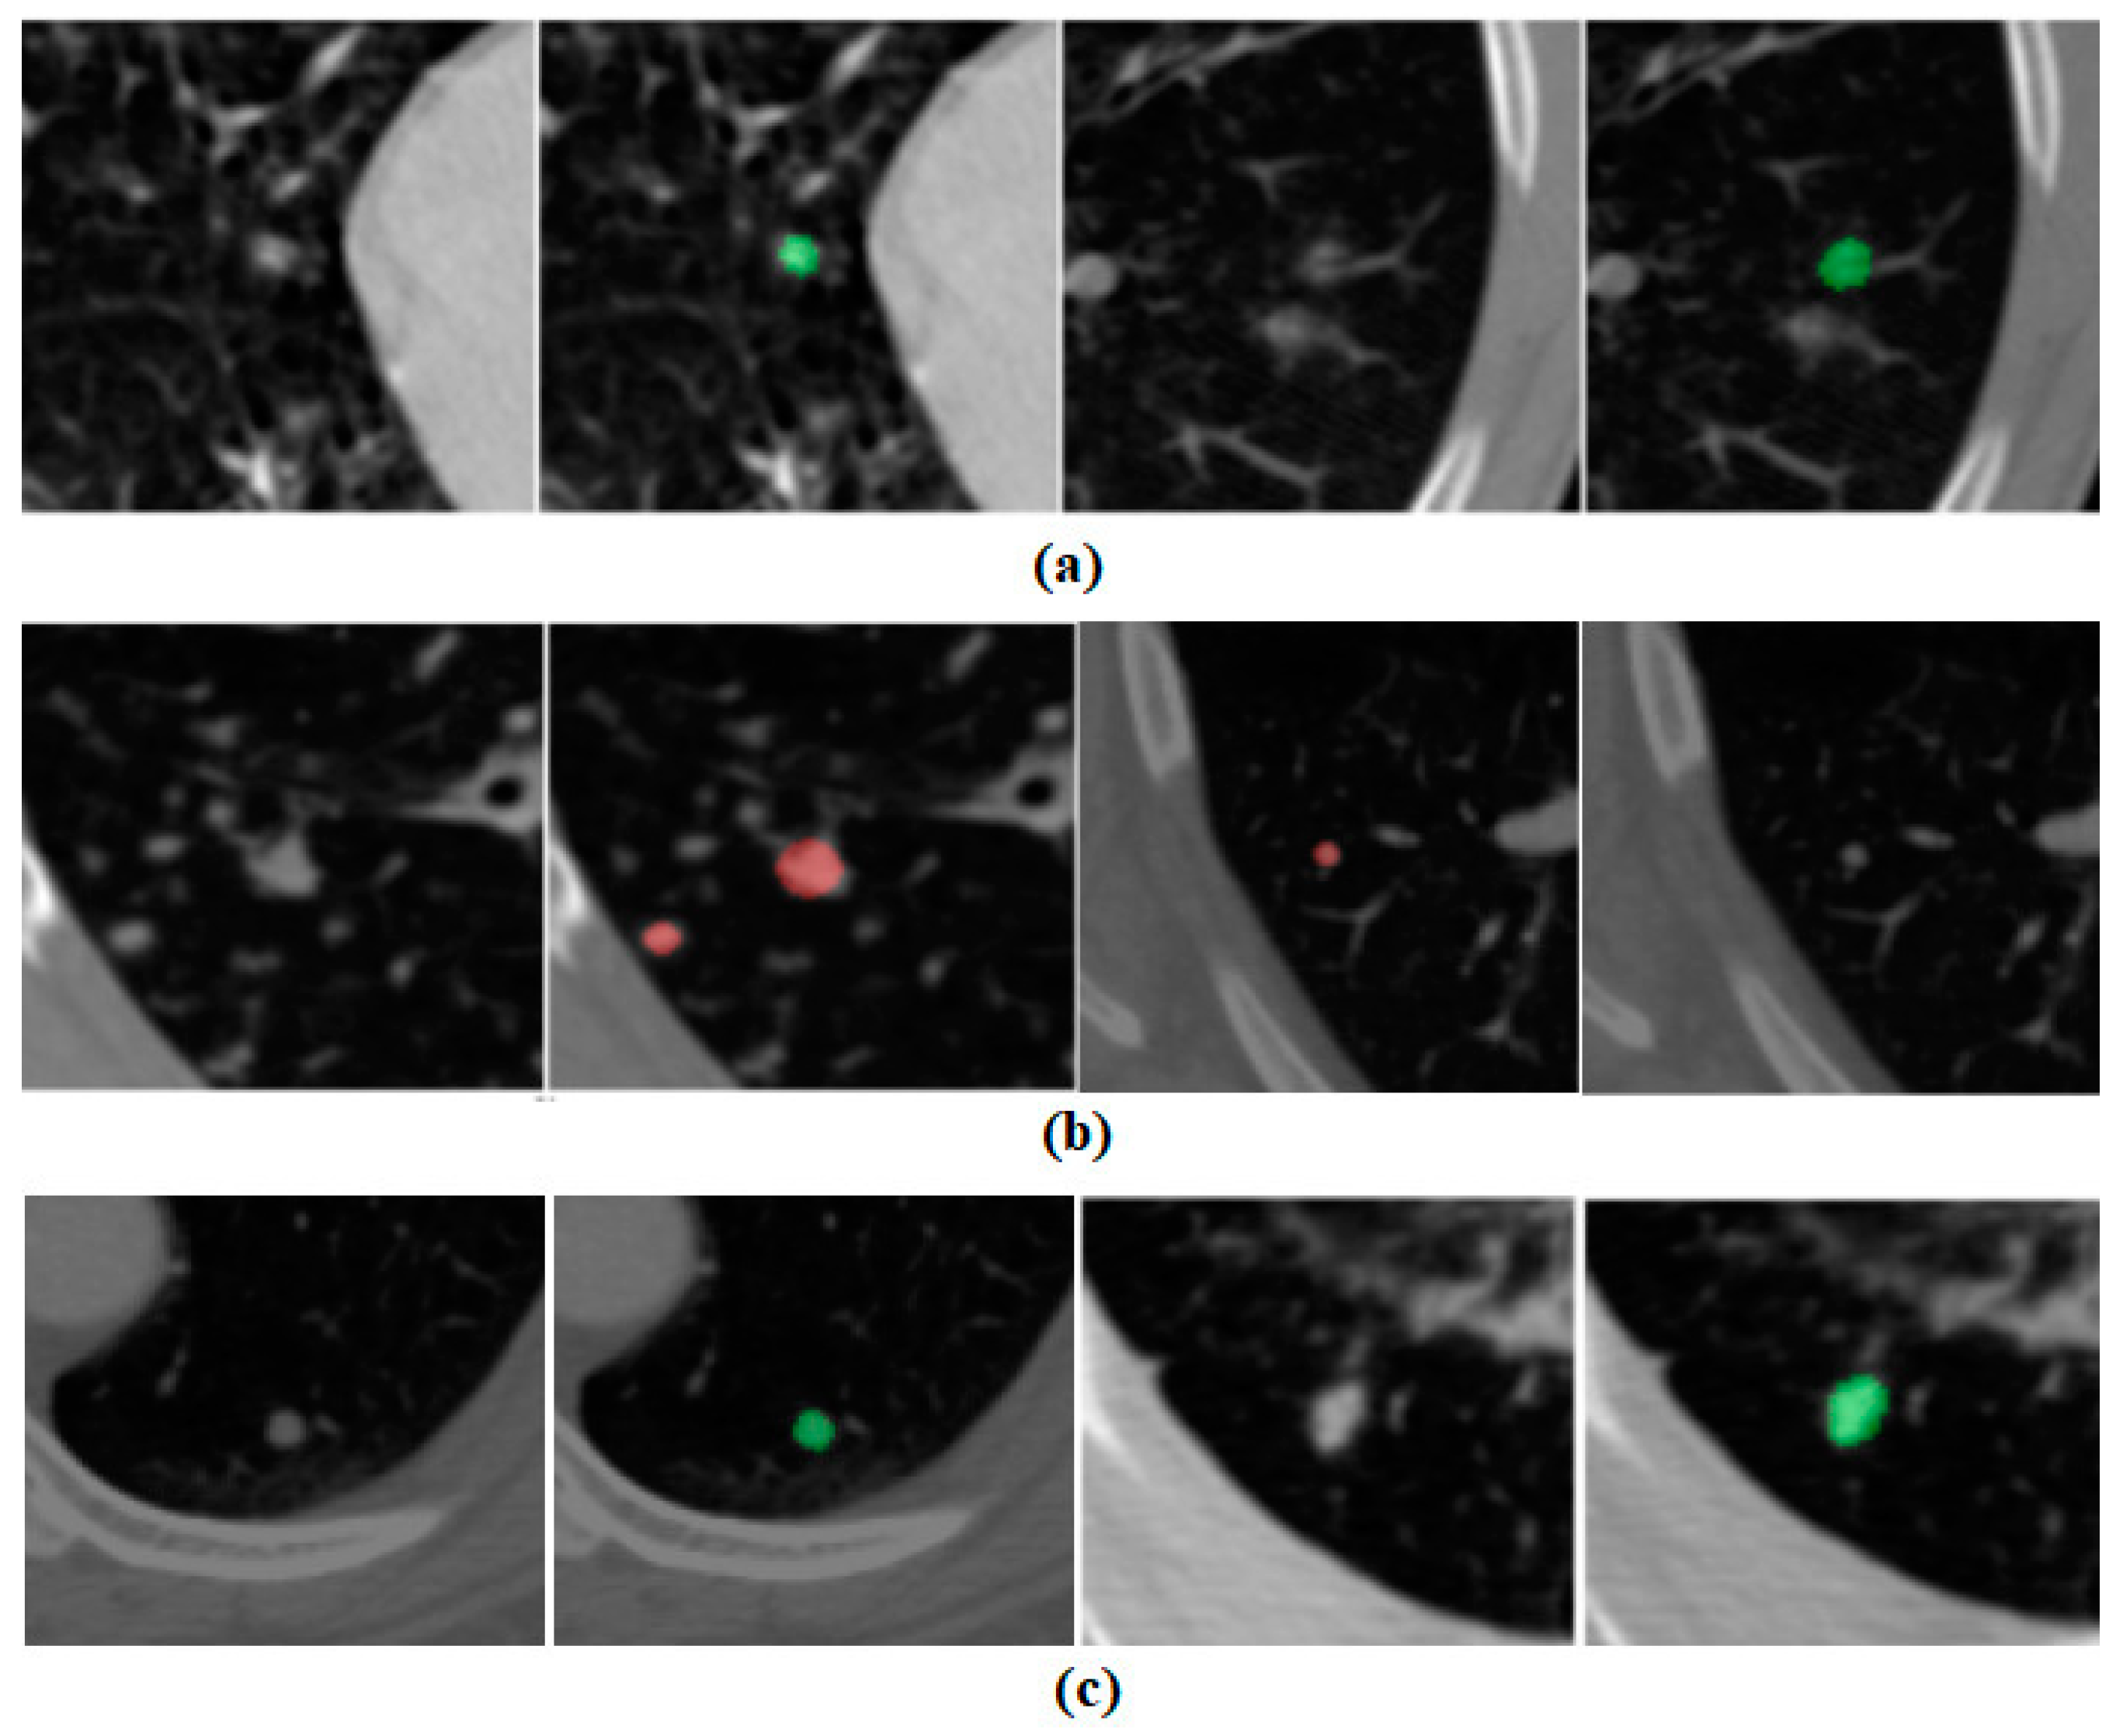
3.1. Per-Lesion Performance
3.2. Patient-Wise Performance
4. Discussion
Retraining Without Public Dataset
5. Conclusions
Author Contributions
Funding
Institutional Review Board Statement
Informed Consent Statement
Data Availability Statement
Conflicts of Interest
Appendix A

| FP per Scan | Sensitivity (%) | Dataset | No. of Nodules | Total Scans | Year | Source |
|---|---|---|---|---|---|---|
| 0.3 | 90 | LIDC, Private | 7683 | 1599 | 2021 | Our Study |
| 4 | 93.6 | LIDC | 1186 | 888 | 2019 | Fu et al. [27] |
| 4 | 90.7 | LIDC | 1186 | 888 | 2017 | Chen et al. [28] |
| 4 | 88.9 | LIDC | 698 | 502 | 2017 | Ma et al. [29] |
| 4 | 87.9 | LIDC | 1186 | 888 | 2016 | Arinda et al. [30] |
| 3.1 | 85.2 | LIDC | 631 | 98 | 2015 | Lu et al. [31] |
| 6.8 | 97.5 | LIDC | 148 | 84 | 2014 | Choi et al. [32] |
| 2 | 75 | LIDC | 68 | 108 | 2014 | Brown et al. [33] |
| 4.2 | 80 | LIDC | 103 | 84 | 2013 | Teramoto et al. [34] |
| 6.1 | 97 | LIDC | 148 | 84 | 2012 | Cascio et al. [27] |
| 4 | 87.5 | LIDC | 80 | 125 | 2011 | Tan et al. [35] |
| 4.2 | 80 | Private | 1518 | 813 | 2009 | Murphy et al. [25] |
| 5.6 | 76 | LIDC, Private | 241 | 85 | 2009 | Sahiner et al. [36] |
| NA | 94.7 | Private | 34 | 29 | 2009 | Guo et al. [23] |
| 4.6 | 93.7 | Private | 33 | 32 | 2009 | Liu et l. [24] |
| 0.4 | 848 | Private | 33 | NA | 2010 | Sousa et al. [37] |
| 4.8 | 80.3 | Private | 121 | 63 | 2003 | Suzuki et al. [38] |
| 8 | 80 | LIDC | 1749 | 949 | 2015 | Torres et al. [39] |
| 2 | 97 | Private | NA | 12 | 2012 | Mabrouk et al. [40] |
| 2.27 | 95.2 | LIDC | 151 | 58 | 2013 | Choi et al. [32] |
| NA | 95.3 | LIDC | 50 | 47 | 2016 | Akram et al. [41] |
| 3 | 95.7 | LIDC | 673 | 1010 | 2020 | Wang et al. [42] |
| 4 | 90.1 | LIDC | 1186 | 888 | 2016 | Setio et al. [30] |
| 10 | 80 | SPIE-AAPM LUNG | NA | 67 | 2016 | Anirudh et al. [43] |
| 4 | 94.4 | LIDC | 1186 | 888 | 2017 | Ding et al. [44] |
| 0.7 | 89.2 | LIDC | 1186 | 888 | 2018 | Gruetzemac-her et al. [45] |
| 2 | 95.2 | LIDC | 1166 | 888 | 2019 | Kim et al. [46] |
| 4 | 98.2 | LIDC | 1186 | 888 | 2019 | Qin et al. [26] |
References
- Barta, J.A.; Powell, C.A.; Wisnivesky, J.P. Global Epidemiology of Lung Cancer. Ann. Glob. Health 2019, 85, 8. [Google Scholar] [CrossRef]
- Prabhash, K.; Noronha, V.; Dikshit, R.; Raut, N.; Joshi, A.; Pramesh, C.; George, K.; Agarwal, J.; Munshi, A. Epidemiology of lung cancer in India: Focus on the differences between non-smokers and smokers: A single-centre experience. Indian J. Cancer 2012, 49, 74–81. [Google Scholar] [CrossRef] [PubMed]
- Mok, T.; Camidge, D.; Gadgeel, S.; Rosell, R.; Dziadziuszko, R.; Kim, D.-W.; Pérol, M.; Ou, S.-H.; Ahn, J.; Shaw, A.; et al. Updated overall survival and final progression-free survival data for patients with treatment-naive advanced ALK-positive non-small-cell lung cancer in the ALEX study. Ann. Oncol. 2020, 31, 1056–1064. [Google Scholar] [CrossRef]
- National Lung Screening Trial Research Team; Aberle, D.R.; Adams, A.M.; Berg, C.D.; Black, W.C.; Clapp, J.D.; Fagerstrom, R.M.; Gareen, I.F.; Gatsonis, C.; Marcus, P.M.; et al. Reduced Lung-Cancer Mortality with Low-Dose Computed Tomographic Screening. N. Engl. J. Med. 2011, 365, 395–409. [Google Scholar] [CrossRef]
- Manser, R.L.; Irving, L.B.; Byrnes, G.; Abramson, M.J.; A Stone, C.; A Campbell, D. Screening for lung cancer: A systematic review and meta-analysis of controlled trials. Thorax 2003, 58, 784–789. [Google Scholar] [CrossRef]
- Pinsky, P.F. Lung cancer screening with low-dose CT: A world-wide view. Transl. Lung Cancer Res. 2018, 7, 234–242. [Google Scholar] [CrossRef] [PubMed]
- Gierada, D.S.; Black, W.C.; Chiles, C.; Pinsky, P.F.; Yankelevitz, D.F. Low-Dose CT Screening for Lung Cancer: Evidence from 2 Decades of Study. Radiol. Imaging Cancer 2020, 2, e190058. [Google Scholar] [CrossRef]
- Liang, M.; Tang, W.; Xu, D.M.; Jirapatnakul, A.C.; Reeves, A.P.; Henschke, C.I.; Yankelevitz, D. Low-Dose CT Screening for Lung Cancer: Computer-aided Detection of Missed Lung Cancers. Radiology 2016, 281, 279–288. [Google Scholar] [CrossRef] [PubMed]
- Christe, A.; Leidolt, L.; Huber, A.; Steiger, P.; Szucs-Farkas, Z.; Roos, J.; Heverhagen, J.; Ebner, L. Lung cancer screening with CT: Evaluation of radiologists and different computer assisted detection software (CAD) as first and second readers for lung nodule detection at different dose levels. Eur. J. Radiol. 2013, 82, e873–e878. [Google Scholar] [CrossRef]
- Thrall, J.H.; Li, X.; Li, Q.; Cruz, C.; Do, S.; Dreyer, K.; Brink, J. Artificial Intelligence and Machine Learning in Radiology: Opportunities, Challenges, Pitfalls, and Criteria for Success. J. Am. Coll. Radiol. 2018, 15, 504–508. [Google Scholar] [CrossRef] [PubMed]
- Frontiers | Human, All Too Human? An All-Around Appraisal of the “Artificial Intelligence Revolution” in Medical Imaging. Available online: https://www.frontiersin.org/journals/psychology/articles/10.3389/fpsyg.2021.710982/full (accessed on 12 January 2025).
- Miotto, R.; Wang, F.; Wang, S.; Jiang, X.; Dudley, J.T. Deep learning for healthcare: Review, opportunities and challenges. Briefings Bioinform. 2017, 19, 1236–1246. [Google Scholar] [CrossRef] [PubMed]
- Litjens, G.; Kooi, T.; Bejnordi, B.E.; Setio, A.A.A.; Ciompi, F.; Ghafoorian, M.; van der Laak, J.A.W.M.; van Ginneken, B.; Sánchez, C.I. A survey on deep learning in medical image analysis. Med. Image Anal. 2017, 42, 60–88. [Google Scholar] [CrossRef] [PubMed]
- Gilbert, F.J.; Lemke, H. Computer-Aided Diagnosis. Br. J. Radiol. 2005, 78, S1–S2. [Google Scholar] [CrossRef]
- Jin, H.; Li, Z.; Tong, R.; Lin, L. A deep 3D residual CNN for false-positive reduction in pulmonary nodule detection. Med. Phys. 2018, 45, 2097–2107. [Google Scholar] [CrossRef] [PubMed]
- Yuan, H.; Fan, Z.; Wu, Y.; Cheng, J. An efficient multi-path 3D convolutional neural network for false-positive reduction of pulmonary nodule detection. Int. J. Comput. Assist. Radiol. Surg. 2021, 16, 2269–2277. [Google Scholar] [CrossRef]
- Polat, H.; Danaei Mehr, H. Classification of Pulmonary CT Images by Using Hybrid 3D-Deep Convolutional Neural Network Architecture. Appl. Sci. 2019, 9, 940. [Google Scholar] [CrossRef]
- Zhao, Y.; Zhao, L.; Yan, Z.; Wolf, M.; Zhan, Y. A Deep-Learning Based Automatic Pulmonary Nodule Detection System. In Medical Imaging 2018: Computer-Aided Diagnosis; SPIE: Houston, TX, USA, 2018. [Google Scholar] [CrossRef]
- Schilham, A.M.; van Ginneken, B.; Loog, M. A computer-aided diagnosis system for detection of lung nodules in chest radiographs with an evaluation on a public database. Med. Image Anal. 2005, 10, 247–258. [Google Scholar] [CrossRef]
- Setio, A.A.A.; Traverso, A.; de Bel, T.; Berens, M.S.; Bogaard, C.v.D.; Cerello, P.; Chen, H.; Dou, Q.; Fantacci, M.E.; Geurts, B.; et al. Validation, comparison, and combination of algorithms for automatic detection of pulmonary nodules in computed tomography images: The LUNA16 challenge. Med. Image Anal. 2016, 42, 1–13. [Google Scholar] [CrossRef] [PubMed]
- Ronneberger, O.; Fischer, P.; Brox, T. U-Net: Convolutional Networks for Biomedical Image Segmentation. In Proceedings of the Medical Image Computing and Computer-Assisted Intervention—MICCAI 2015, Munich, Germany, 5–9 October 2015; Navab, N., Hornegger, J., Wells, W.M., Frangi, A.F., Eds.; Springer International Publishing: Cham, Switzerland, 2015; pp. 234–241. [Google Scholar]
- Pehrson, L.M.; Nielsen, M.B.; Lauridsen, C.A. Automatic Pulmonary Nodule Detection Applying Deep Learning or Machine Learning Algorithms to the LIDC-IDRI Database: A Systematic Review. Diagnostics 2019, 9, 29. [Google Scholar] [CrossRef] [PubMed]
- Orozco, H.M.; Villegas, O.O.V.; Domínguez, H.d.J.O.; Sánchez, V.G.C. Lung Nodule Classification in CT Thorax Images Using Support Vector Machines. In Proceedings of the 2013 12th Mexican International Conference on Artificial Intelligence, Mexico City, Mexico, 24–30 November 2013; pp. 277–283. [Google Scholar]
- Lu, L.; Liu, W. A Method of Pulmonary Nodules Detection with Support Vector Machines. In Proceedings of the 2008 Eighth International Conference on Intelligent Systems Design and Applications 2008, Taiwan, China, 26–28 November 2008; Volume 1, p. 35. [Google Scholar]
- Murphy, K.; van Ginneken, B.; Schilham, A.; de Hoop, B.; Gietema, H.; Prokop, M. A large-scale evaluation of automatic pulmonary nodule detection in chest CT using local image features and k-nearest-neighbour classification. Med. Image Anal. 2009, 13, 757–770. [Google Scholar] [CrossRef]
- Qin, Y.; Zheng, H.; Zhu, Y.-M.; Yang, J. Simultaneous Accurate Detection of Pulmonary Nodules and False Positive Reduction Using 3D CNNs. In Proceedings of the 2018 IEEE International Conference on Acoustics, Speech and Signal Processing (ICASSP), Calgary, AB, Canada, 15–20 April 2018; pp. 1005–1009. [Google Scholar]
- Cascio, D.; Magro, R.; Fauci, F.; Iacomi, M.; Raso, G. Automatic detection of lung nodules in CT datasets based on stable 3D mass–spring models. Comput. Biol. Med. 2012, 42, 1098–1109. [Google Scholar] [CrossRef] [PubMed]
- Dou, Q.; Chen, H.; Yu, L.; Qin, J.; Heng, P.-A. Multilevel Contextual 3-D CNNs for False Positive Reduction in Pulmonary Nodule Detection. IEEE Trans. Biomed. Eng. 2016, 64, 1558–1567. [Google Scholar] [CrossRef]
- Ma, J.; Zhou, Z.; Ren, Y.; Xiong, J.; Fu, L.; Wang, Q.; Zhao, J. Computerized detection of lung nodules through radiomics. Med. Phys. 2017, 44, 4148–4158. [Google Scholar] [CrossRef]
- Setio, A.A.; Ciompi, F.; Litjens, G.; Gerke, P.; Jacobs, C.; van Riel, S.J.; Wille, M.M.; Naqibullah, M.; Sanchez, C.I.; van Ginneken, B. Pulmonary Nodule Detection in CT Images: False Positive Reduction Using Multi-View Convolutional Networks. IEEE Trans. Med. Imaging 2016, 35, 1160–1169. [Google Scholar] [CrossRef] [PubMed]
- Lu, L.; Tan, Y.; Schwartz, L.H.; Zhao, B. Hybrid detection of lung nodules on CT scan images. Med. Phys. 2015, 42, 5042–5054. [Google Scholar] [CrossRef] [PubMed]
- Choi, W.-J.; Choi, T.-S. Automated pulmonary nodule detection based on three-dimensional shape-based feature descriptor. Comput. Methods Programs Biomed. 2014, 113, 37–54. [Google Scholar] [CrossRef]
- Brown, M.S.; Lo, P.; Goldin, J.G.; Barnoy, E.; Kim, G.H.J.; McNitt-Gray, M.F.; Aberle, D.R. Toward clinically usable CAD for lung cancer screening with computed tomography. Eur. Radiol. 2014, 24, 2719–2728. [Google Scholar] [CrossRef]
- Teramoto, A.; Fujita, H. Fast lung nodule detection in chest CT images using cylindrical nodule-enhancement filter. Int. J. Comput. Assist. Radiol. Surg. 2012, 8, 193–205. [Google Scholar] [CrossRef] [PubMed]
- Tan, M.; Deklerck, R.; Jansen, B.; Bister, M.; Cornelis, J. A novel computer-aided lung nodule detection system for CT images. Med. Phys. 2011, 38, 5630–5645. [Google Scholar] [CrossRef]
- Sahiner, B.; Chan, H.-P.; Hadjiiski, L.M.; Cascade, P.N.; Kazerooni, E.A.; Chughtai, A.R.; Poopat, C.; Song, T.; Frank, L.; Stojanovska, J.; et al. Effect of CAD on Radiologists’ Detection of Lung Nodules on Thoracic CT Scans: Analysis of an Observer Performance Study by Nodule Size. Acad. Radiol. 2009, 16, 1518–1530. [Google Scholar] [CrossRef]
- Sousa, J.R.F.d.S.; Silva, A.C.; de Paiva, A.C.; Nunes, R.A. Methodology for automatic detection of lung nodules in computerized tomography images. Comput. Methods Programs Biomed. 2009, 98, 1–14. [Google Scholar] [CrossRef]
- Suzuki, K.; Armato, S.G.; Li, F.; Sone, S.; Doi, K. Massive training artificial neural network (MTANN) for reduction of false positives in computerized detection of lung nodules in low-dose computed tomography. Med. Phys. 2003, 30, 1602–1617. [Google Scholar] [CrossRef]
- Torres, E.L.; Fiorina, E.; Pennazio, F.; Peroni, C.; Saletta, M.; Camarlinghi, N.; Fantacci, M.E.; Cerello, P. Large scale validation of the M5L lung CAD on heterogeneous CT datasets. Med. Phys. 2015, 42, 1477–1489. [Google Scholar] [CrossRef]
- Mabrouk, M.; Karrar, A.; Sharawy, A. Computer Aided Detection of Large Lung Nodules Using Chest Computer Tomography Images. IJAIS 2012, 3, 12–18. [Google Scholar]
- Akram, S.; Javed, M.Y.; Akram, M.U.; Qamar, U.; Hassan, A. Pulmonary Nodules Detection and Classification Using Hybrid Features from Computerized Tomographic Images. J. Med. Imaging Health Inform. 2016, 6, 252–259. [Google Scholar] [CrossRef]
- Wang, B.; Si, S.; Zhao, H.; Zhu, H.; Dou, S. False positive reduction in pulmonary nodule classification using 3D texture and edge feature in CT images. Technol. Health Care 2021, 29, 1071–1088. [Google Scholar] [CrossRef]
- Anirudh, R.; Thiagarajan, J.J.; Bremer, T.; Kim, H. Lung nodule detection using 3D convolutional neural networks trained on weakly labeled data. In Proceedings of the Medical Imaging 2016: Computer-Aided Diagnosis, San Diego, CA, USA, 24 March 2016. [Google Scholar] [CrossRef]
- Ding, J.; Li, A.; Hu, Z.; Wang, L. Accurate Pulmonary Nodule Detection in Computed Tomography Images Using Deep Convolutional Neural Networks. In Medical Image Computing and Computer Assisted Intervention−MICCAI 2017; Descoteaux, M., Maier-Hein, L., Franz, A., Jannin, P., Collins, D., Duchesne, S., Eds.; Springer International Publishing: Cham, Switzerland, 2017; Volume 10435. [Google Scholar] [CrossRef]
- Gruetzemacher, R.; Gupta, A.; Paradice, D. 3D deep learning for detecting pulmonary nodules in CT scans. J. Am. Med. Inform. Assoc. 2018, 25, 1301–1310. [Google Scholar] [CrossRef]
- Kim, B.-C.; Yoon, J.S.; Choi, J.-S.; Suk, H.-I. Multi-scale gradual integration CNN for false positive reduction in pulmonary nodule detection. Neural Netw. 2019, 115, 1–10. [Google Scholar] [CrossRef]


| OUR INSTITUTE | LUNA16 | Total Cases | |
|---|---|---|---|
| Training | 176 | 710 | 886 |
| Validation | 44 | 178 | 222 |
| Test | 491 | - | 491 |
| Total | 711 | 888 | 1599 |
| OUR INSTITUTE | LUNA16 | Total Cases | ||||
|---|---|---|---|---|---|---|
| #Nodules | #Patients with Nodules | #Nodules | #Patients with Nodules | #Nodules | #Patient with Nodules | |
| Training | 743 | 144 | 929 | 484 | 1672 | 628 |
| Validation | 85 | 22 | 257 | 117 | 342 | 139 |
| Test | 5669 | 401 | - | - | 5669 | 401 |
| Per-Lesion Performance | Patient-Wise Performance | |
|---|---|---|
| Total | 5669 | 491 |
| True Positive | 5079 | 388 |
| False Negative | 590 | 13 |
| False Positive | 148 | 0 |
| True Negative | - | 90 |
| FP per scan | 0.3 | - |
| Sensitivity | 0.9 | 0.95 |
| Specificity | - | 1 |
| Nodule Count | Number of Patients | Sensitivity | FP | FN | TP |
|---|---|---|---|---|---|
| 1–6 | 152 | 0.87 | 24 | 58 | 396 |
| 7–8 | 249 | 0.9 | 124 | 532 | 4683 |
| 9–10 | 227 | 0.88 | 44 | 126 | 932 |
| 11–19 | 87 | 0.88 | 68 | 147 | 1040 |
| 20–29 | 48 | 0.89 | 13 | 128 | 1020 |
| 30–39 | 8 | 0.92 | 2 | 22 | 261 |
| 40–49 | 9 | 0.93 | 7 | 29 | 383 |
| 50–59 | 7 | 0.89 | 8 | 43 | 338 |
| 60–59 | 4 | 0.94 | 4 | 16 | 246 |
| 70–79 | 3 | 0.88 | 2 | 26 | 192 |
| 80–89 | 6 | 0.95 | 0 | 24 | 480 |
| 90–99 | 1 | 0.85 | 0 | 16 | 90 |
| ≥100 | 1 | 0.88 | 0 | 13 | 97 |
| - | 0.125 | 0.25 | 0.5 | 1 | 2 | 4 | 8 | Mean |
|---|---|---|---|---|---|---|---|---|
| Test | 0.58 | 0.84 | 0.9 | 0.9 | 0.91 | 0.92 | 0.92 | 0.85 |
| Validation | 0.63 | 0.72 | 0.83 | 0.86 | 0.87 | 0.87 | 0.87 | 0.807 |
| Total True Nodules | 5669 |
|---|---|
| True Positive | 4696 |
| False Negative | 973 |
| False Positive | 150 |
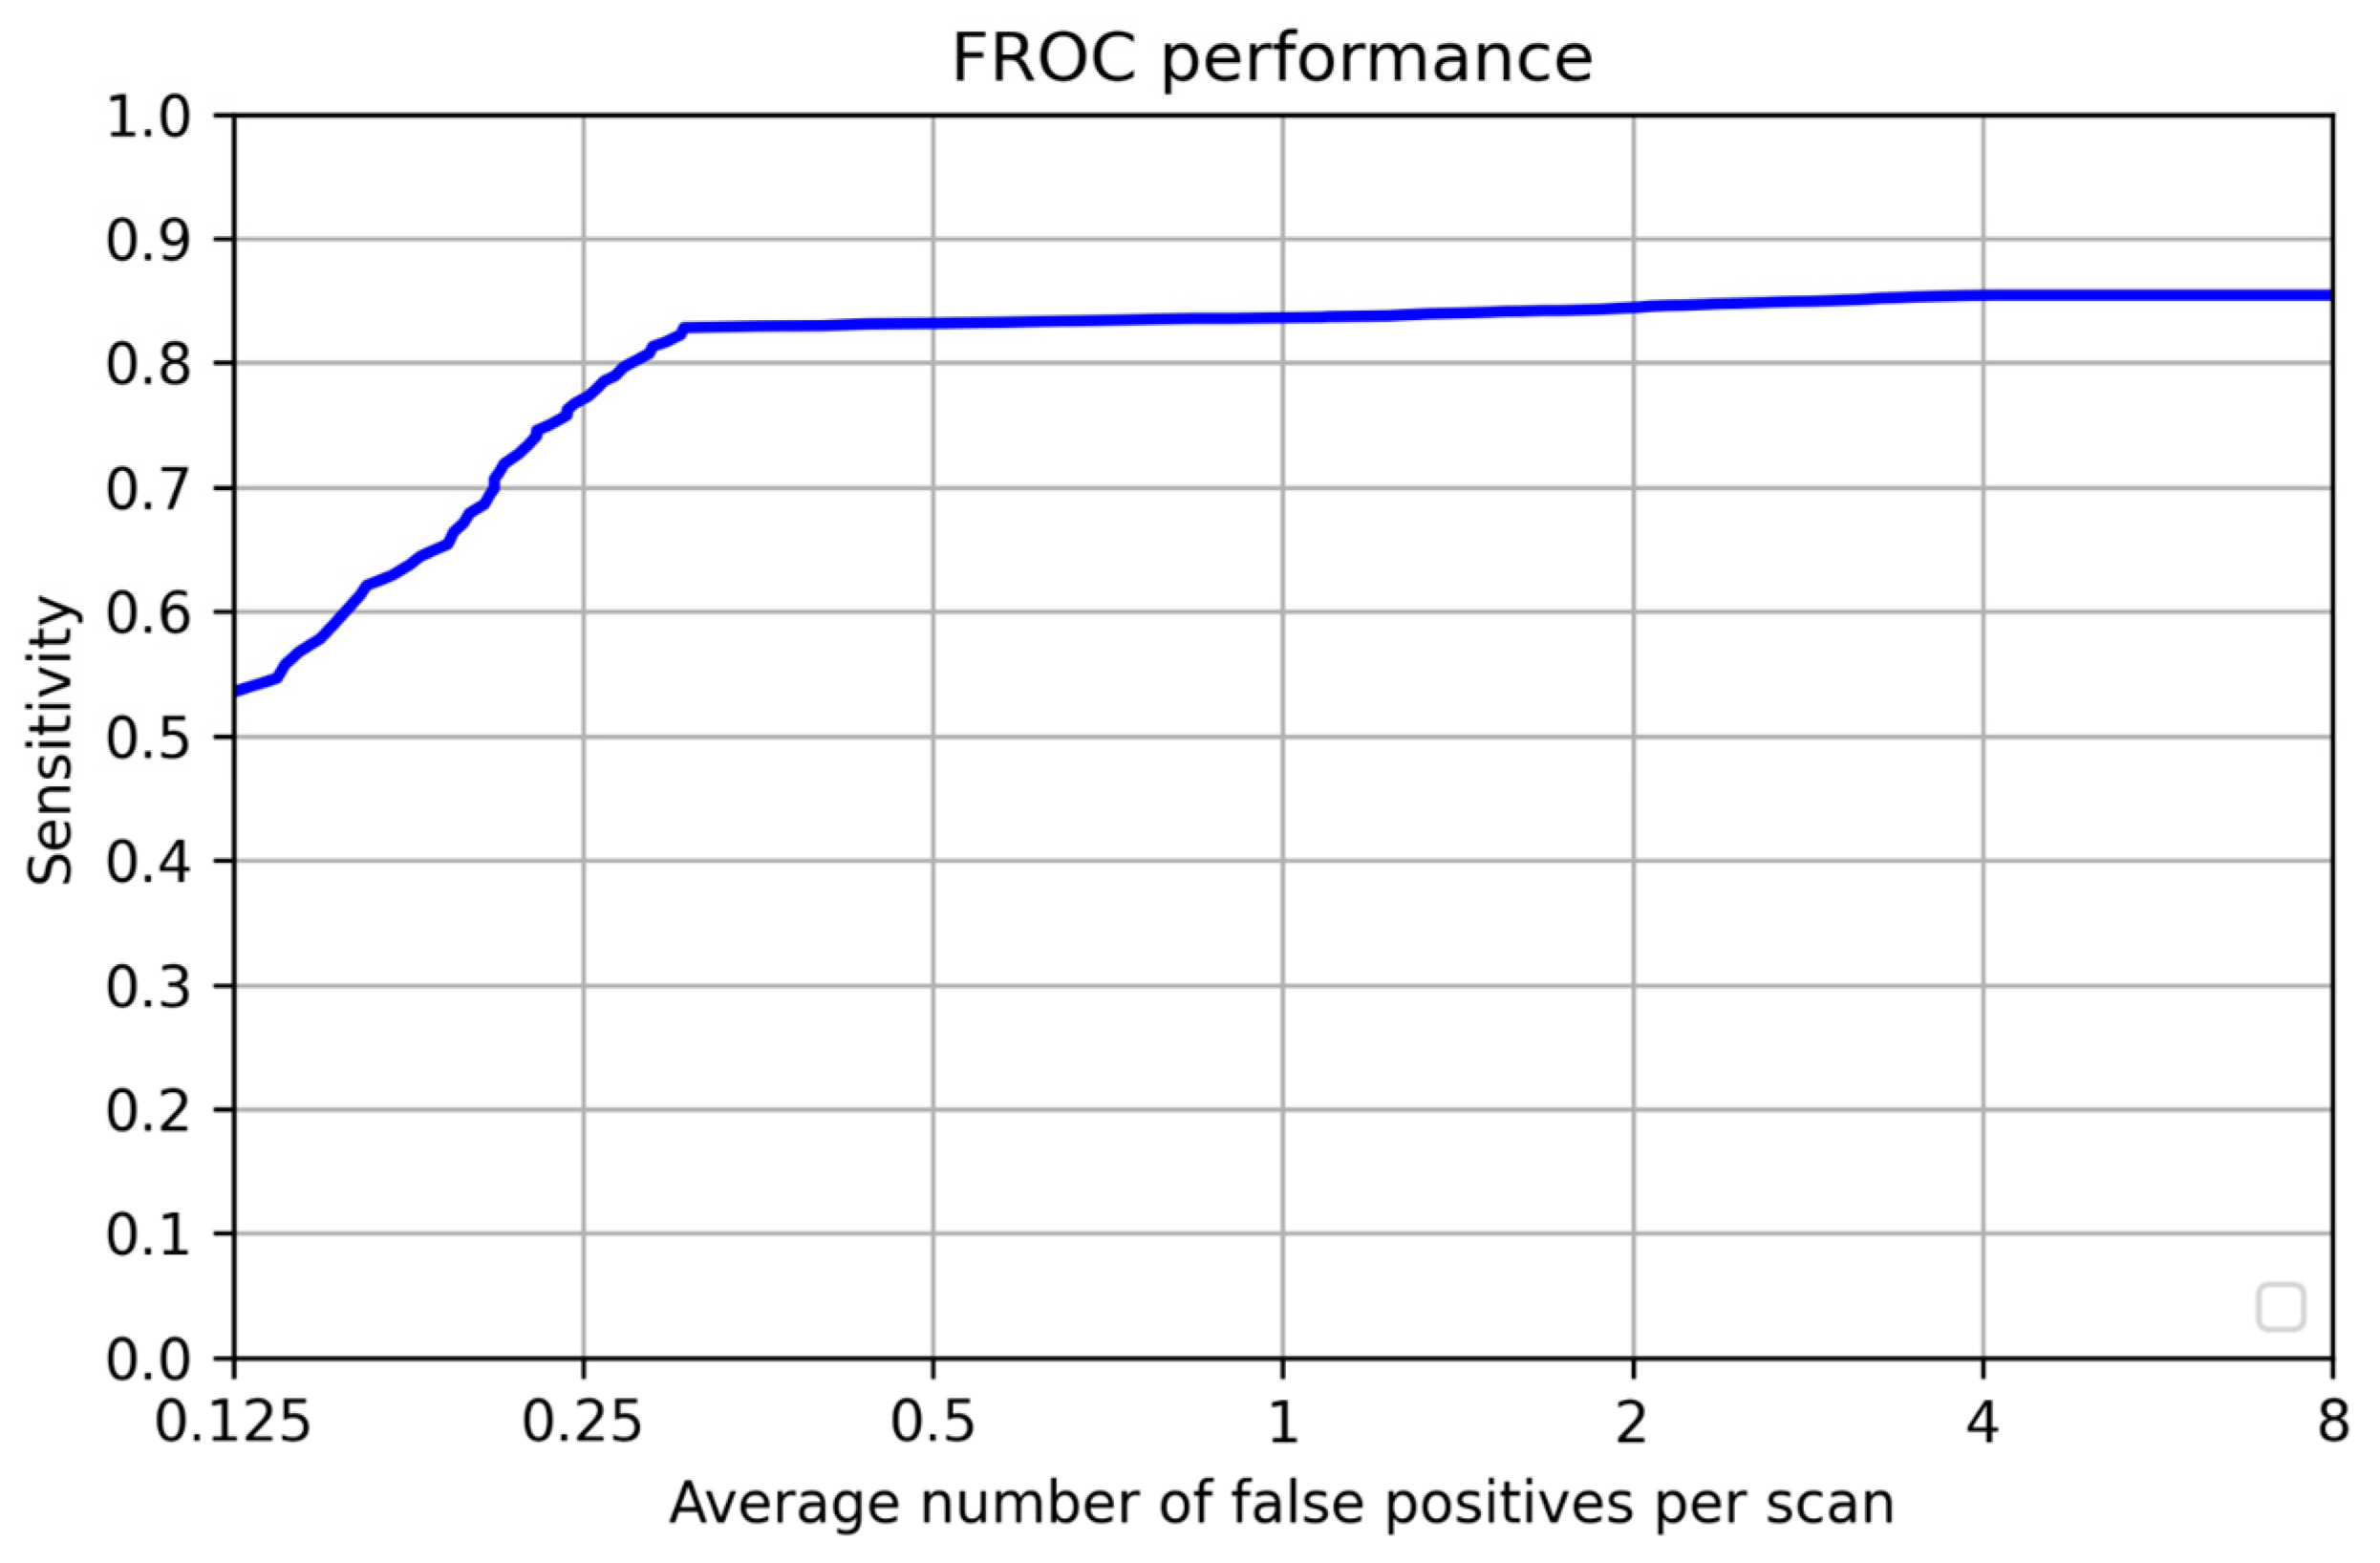
| Sensitivity | 0.828 |
| FP per scan | 0.3 |
| - | 0.125 | 0.25 | 0.5 | 1 | 2 | 4 | 8 | Mean |
|---|---|---|---|---|---|---|---|---|
| Test | 0.53 | 0.77 | 0.83 | 0.836 | 0.84 | 0.85 | 0.857 | 0.787 |
Disclaimer/Publisher’s Note: The statements, opinions and data contained in all publications are solely those of the individual author(s) and contributor(s) and not of MDPI and/or the editor(s). MDPI and/or the editor(s) disclaim responsibility for any injury to people or property resulting from any ideas, methods, instructions or products referred to in the content. |
© 2025 by the authors. Licensee MDPI, Basel, Switzerland. This article is an open access article distributed under the terms and conditions of the Creative Commons Attribution (CC BY) license (https://creativecommons.org/licenses/by/4.0/).
Share and Cite
Mahajan, A.; Agarwal, R.; Agarwal, U.; Ashtekar, R.M.; Komaravolu, B.; Madiraju, A.; Vaish, R.; Pawar, V.; Punia, V.; Patil, V.M.; et al. A Novel Deep Learning-Based (3D U-Net Model) Automated Pulmonary Nodule Detection Tool for CT Imaging. Curr. Oncol. 2025, 32, 95. https://doi.org/10.3390/curroncol32020095
Mahajan A, Agarwal R, Agarwal U, Ashtekar RM, Komaravolu B, Madiraju A, Vaish R, Pawar V, Punia V, Patil VM, et al. A Novel Deep Learning-Based (3D U-Net Model) Automated Pulmonary Nodule Detection Tool for CT Imaging. Current Oncology. 2025; 32(2):95. https://doi.org/10.3390/curroncol32020095
Chicago/Turabian StyleMahajan, Abhishek, Rajat Agarwal, Ujjwal Agarwal, Renuka M. Ashtekar, Bharadwaj Komaravolu, Apparao Madiraju, Richa Vaish, Vivek Pawar, Vivek Punia, Vijay Maruti Patil, and et al. 2025. "A Novel Deep Learning-Based (3D U-Net Model) Automated Pulmonary Nodule Detection Tool for CT Imaging" Current Oncology 32, no. 2: 95. https://doi.org/10.3390/curroncol32020095
APA StyleMahajan, A., Agarwal, R., Agarwal, U., Ashtekar, R. M., Komaravolu, B., Madiraju, A., Vaish, R., Pawar, V., Punia, V., Patil, V. M., Noronha, V., Joshi, A., Menon, N., Prabhash, K., Chaturvedi, P., Rane, S., Banwar, P., & Gupta, S. (2025). A Novel Deep Learning-Based (3D U-Net Model) Automated Pulmonary Nodule Detection Tool for CT Imaging. Current Oncology, 32(2), 95. https://doi.org/10.3390/curroncol32020095