Article

The Influence of Poverty and Rurality on Colorectal Cancer Survival by Race/Ethnicity: An Analysis of SEER Data with a Census Tract-Level Measure of Persistent Poverty

by
Steven S. Coughlin
1,*,
Meng-Han Tsai
2,3,
Jorge Cortes
4,
Malcolm Bevel
3 and
Marlo Vernon
2,3
1
Department of Biostatistics, Data Science and Epidemiology, Augusta University, Augusta, GA 30912, USA
2
Georgia Prevention Institute, Augusta University, Augusta, GA 30912, USA
3
Cancer Prevention, Control, & Population Health Program, Georgia Cancer Center, Augusta University, Augusta, GA 30912, USA
4
Georgia Cancer Center, Augusta University, Augusta, GA 30912, USA
*
Author to whom correspondence should be addressed.
Curr. Oncol. 2025, 32(5), 248; https://doi.org/10.3390/curroncol32050248
Submission received: 17 March 2025 / Revised: 15 April 2025 / Accepted: 21 April 2025 / Published: 23 April 2025
(This article belongs to the Section Gastrointestinal Oncology)

Abstract

:
Purpose: Because of shared mechanisms such as decreased access to health care, rurality and poverty may act synergistically to decrease colorectal cancer (CRC) survival. Methods: We conducted a retrospective cohort analysis of SEER data (22 registries) with census tract-level measures of poverty/rurality for the period 2006–2015. Multivariable Cox proportional hazard regressions were applied to examine the independent and intersectional associations of persistent poverty and rurality on 5-year cause-specific CRC survival across five racial/ethnic groups. Results: Among 532,868 CRC patients, non-Hispanic Blacks (NHB) demonstrated lower 5-year survival probability (64.2% vs. 68.3% in non-Hispanic Whites [NHW], 66.5% in American Indian/Alaska Natives [AI/AN], 72.1% in Asian/Pacific Islanders, and 68.7% in Hispanic groups) (p-value < 0.001). In adjusted analysis, CRC patients living in rural areas with poverty were at a 1.2–1.6-fold increased risk of CRC death than those who did not live in these areas in five racial/ethnic groups. In particular, AI/AN patients living in rural areas with poverty were 66% more likely to die from CRC (95% CI, 1.32, 2.08). Conclusions: CRC patients who live in rural or poverty areas in SEER areas in the U.S. have a poorer survival compared with those who do not live in such areas regardless of race/ethnicity. Significantly greater risk of CRC death was observed in AI/ANs. Impact: Patient navigators, community education or screening, and other health care system interventions may be helpful to address these disparities by socioeconomic status, race, and geographic residence. Multi-level interventions aimed at institutional racism and medical mistrust may also be helpful.

1. Introduction

Colorectal cancer (CRC) is the third leading cause of cancer-related death among individuals in the U.S. [1,2]. Socioeconomic factors such as household income are well established factors associated with CRC mortality patterns [3]. Several studies have shown that low income is associated with an increased risk of poorer survival [4,5,6,7,8]. Disparities in CRC survival by socioeconomic status may be due to a lack of health insurance, lack of transportation, and other structural factors [9,10].
Rural residence has also been associated with increased risk of CRC mortality [11,12,13]. Several factors may explain the disparities in CRC survival by rural residence, including a later stage at diagnosis and lesser access to specialized centers and clinical trials [11]. Compared to urban areas, rural communities face higher poverty rates, lower educational attainment, a lack of transportation, and a lack of access to health care services [14,15]. Shared mechanisms such as decreased access to health care, rurality, and poverty may also act synergistically to decrease CRC survival.
Significant disparities in colorectal cancer mortality exist in the U.S. according to race and Hispanic ethnicity. For example, colorectal cancer mortality rates are 44% higher in Black men and 31% higher in Black women than in Whites [2]. Racial and ethnic disparities in colorectal cancer mortality may be due to several factors including decreased access to health care services, institutional racism, and medical mistrust [16,17,18]. Prior research has shown that people in some racial and ethnic groups are less likely to receive a recommendation for CRC screening from their doctor [19].
To further explore these associations, we analyzed SEER data with a census tract-level measure of persistent poverty for the period 2006–2015. We extended previously reported studies by using more recent data and by examining the independent and intersectional associations of persistent poverty and rurality with 5-year cause-specific CRC survival across five racial/ethnic groups (non-Hispanic White [NHW], non-Hispanic Black [NHB], American Indian/Alaska Native [AI/AN], Asian/Pacific Islander [PI], and Hispanic). We also compared the 5-year survival rates by persistent poverty and rurality within these five racial/ethnic groups. Such research is vital for informing interventions tailored to specific racial/ethnic groups, who live in low-resource communities.

2. Materials and Methods

2.1. Study Design and Data Sources

We conducted a retrospective cohort analysis using data from the 2006–2015 Incidence Data with Census Tract Attributes from Surveillance, Epidemiology, and End Results (SEER) Program (22 registries, November 2022 submission). SEER data include patient demographics, primary tumor site, tumor morphology and stage at diagnosis, first course of treatment, and vital status, as well as information on persistent poverty and rurality. The eligible study population included patients diagnosed with CRC as defined by the SEER Site Recode ICD-O-3/WHO 2008 definition of colon cancer (C180–C189), rectosigmoid junction cancer (C199), and rectal cancer (C209). The extracted data were publicly available, de-identified, and thus exempt from institutional review board (IRB) review. A STROBE statement for cohort studies is included in the Appendix A.

2.2. Study Participants

A total of 835,907 CRC patients were included in the SEER program. To obtain a more homogeneous eligible study sample, we excluded CRC patients aged under 20 years (n = 1600), duplicate records of the same patients (n = 11,338), missing information on rurality (n = 22) and persistent poverty (n = 248), CRC diagnosed after 2015 due to limited follow-up time (less than five years) (n = 275,291), missing survival time (n = 5913), missing vital status (n = 18), missing race (n = 2095), and missing information on surgery (n = 6514). A five-year interval, which is a common indicator for cancer survival research, was used as one of the sample selection criteria because it provides a consistent follow-up time for all patients. These sample selections were based on prior publications that focused on CRC mortality using the SEER program. As a result, 532,868 eligible CRC patients were included in the full analyses.

2.3. Measures: Outcome, Exposure, and Covariates

Cause-specific CRC survival was the outcome of interest, and race/ethnicity (NHW, NHB, AI/AN, Asian/PI, and Hispanic), persistent poverty (yes or no), and rurality (yes or no) were our exposures of interest. Both the definition of poverty and rurality were incorporated at the time of cancer diagnosis. The definition of persistent poverty was based on 1990 and 2000 decennial censuses and 2007–2011 and 2015–2019 American Community Survey 5-year estimates, and it was defined as when 20% or more of the population has lived below the poverty level for a period spanning about 30 years. Poverty information may be mismatched due to time differences in the information. Further, rurality was defined by using the 2010 U.S. Department of Agriculture’s (USDA’s) Rural Urban Commuting Area (RUCA) codes. RUCA codes 1.0, 1.1, 2.0, 2.1, 3.0, 4.1, 5.1, 7.1, 8.1, and 10.1 were considered as urban areas (termed as no) and all other codes were classified as rural areas (termed as yes). Further, we defined poverty and rurality as a four-category variable (poverty alone, rurality alone, poverty and rural, and non-poverty and rural), which are not mutually exclusive categories. Other covariates of interest were demographic characteristics, tumor characteristics, and initial treatment modalities. Those covariates were adjusted in multivariable models and evaluated for their impact on cause-specific CRC survival. Demographic characteristics included age at diagnosis (20–39, 40–59, 60–79, or 80+ years), gender (male or female), marital status (single, married, others, or unknown), and year of diagnosis (2006–2010 or 2011–2015). We also included tumor grade (grade 1, 2, 3, 4, or unknown), SEER summary stage at diagnosis (localized, regionalized, distant, or unknown), and primary site (right or left). Tumor grade and stage at diagnosis were included as ordinal categorical variables with grade 4 and distant disease considered as advanced diagnoses. The patients’ initial treatment modality, surgery (yes or no), chemotherapy (yes or no/unknown), and radiation (yes or no/unknown) were also included.

2.4. Statistical Analysis

Descriptive statistics were used to describe the distribution of CRC patients according to persistent poverty, rurality, demographic characteristics, tumor characteristics, and initial treatment modality. We compared bivariate differences in poverty, rurality, demographic characteristics, tumor characteristics, and initial treatment modalities across five racial/ethnic groups using the chi-square test for categorical variables. Survival analysis was performed using the Kaplan–Meier method. The log-rank test was used to compare the survival rates within persistent poverty and rurality across different racial and ethnic groups. Further, we performed Cox proportional hazard regression to examine the impact of race/ethnicity, persistent poverty, and rurality on 5-year cause-specific CRC survival in the US. Four sequential models were developed to examine this association. The crude model included race/ethnicity, persistent poverty, and rurality. Model 1 was further adjusted for demographic characteristics (age at diagnosis, gender, race, marital status, and year of diagnosis); model 2 was further adjusted for tumor characteristics (grade, SEER summary stage, primary site); and model 3 was further adjusted for initial treatment modality (surgery, radiation, chemotherapy). Additional analysis was performed to further examine the mentioned association when excluding tumor grade and SEER summary stage at diagnosis were unknown to reduce the concerns regarding unknown information being included. Finally, we examined the interaction between persistent poverty and rurality on cause-specific CRC survival across five racial/ethnic groups, adjusting for demographic characteristics, tumor characteristics, and initial treatment modality. We measured CRC patients’ survival time in months from the date of diagnosis up to 60 months of follow-up, censored at the end of the study observation period (31 December 2020) or death due to all other causes. The goal of this study was to report 5-year cause-specific mortality and use approaches appropriate for the 5-year binary outcome. The use of traditional methods (e.g., log-rank or Cox models) provides the relative risk of the event of interest. To elucidate potential bias, we also performed competing risk models to evaluate whether race/ethnicity, rurality, and persistent poverty were associated with CRC death.
The level of statistical significance was set at an alpha level of 0.05, and p-values were based on two-sided probability tests. We used SAS Version 9.4, SAS Institute Inc., Cary, NC, USA, and SPSS version 28.0 to perform analyses.

2.5. Data Availability

The datasets generated during the current study are available in the Surveillance, Epidemiology, and End Results Program (data can be requested through https://seer.cancer.gov/).

3. Results

3.1. Patient Demographics, Tumor Characteristics, and Initial Treatment Modality

As shown in Table 1, the majority of CRC patients lived in non-persistent poverty (89.5%) and non-rural (86.2%) areas. Many were aged 60–79 years (47.6%), male (52.1%), married (42.7%), diagnosed with CRC during 2006–2010 (50.6%), had a grade 2 diagnosis (57.3%), localized disease (39.2%), left-sided CRC (59.2%), receipt of surgery (81.7%), no radiation therapy (89%), or no chemotherapy (65.1%). When examining racial/ethnic differences, a sizeable percentage of patients living in persistent-poverty areas were NHB (27.9%), followed by Hispanic (23%) (p-value < 0.001). In contrast, 29.1% of the patients living in rural areas were AI/AN, followed by NHW (16.8%) and NHB (8.5%) (p-value < 0.001).

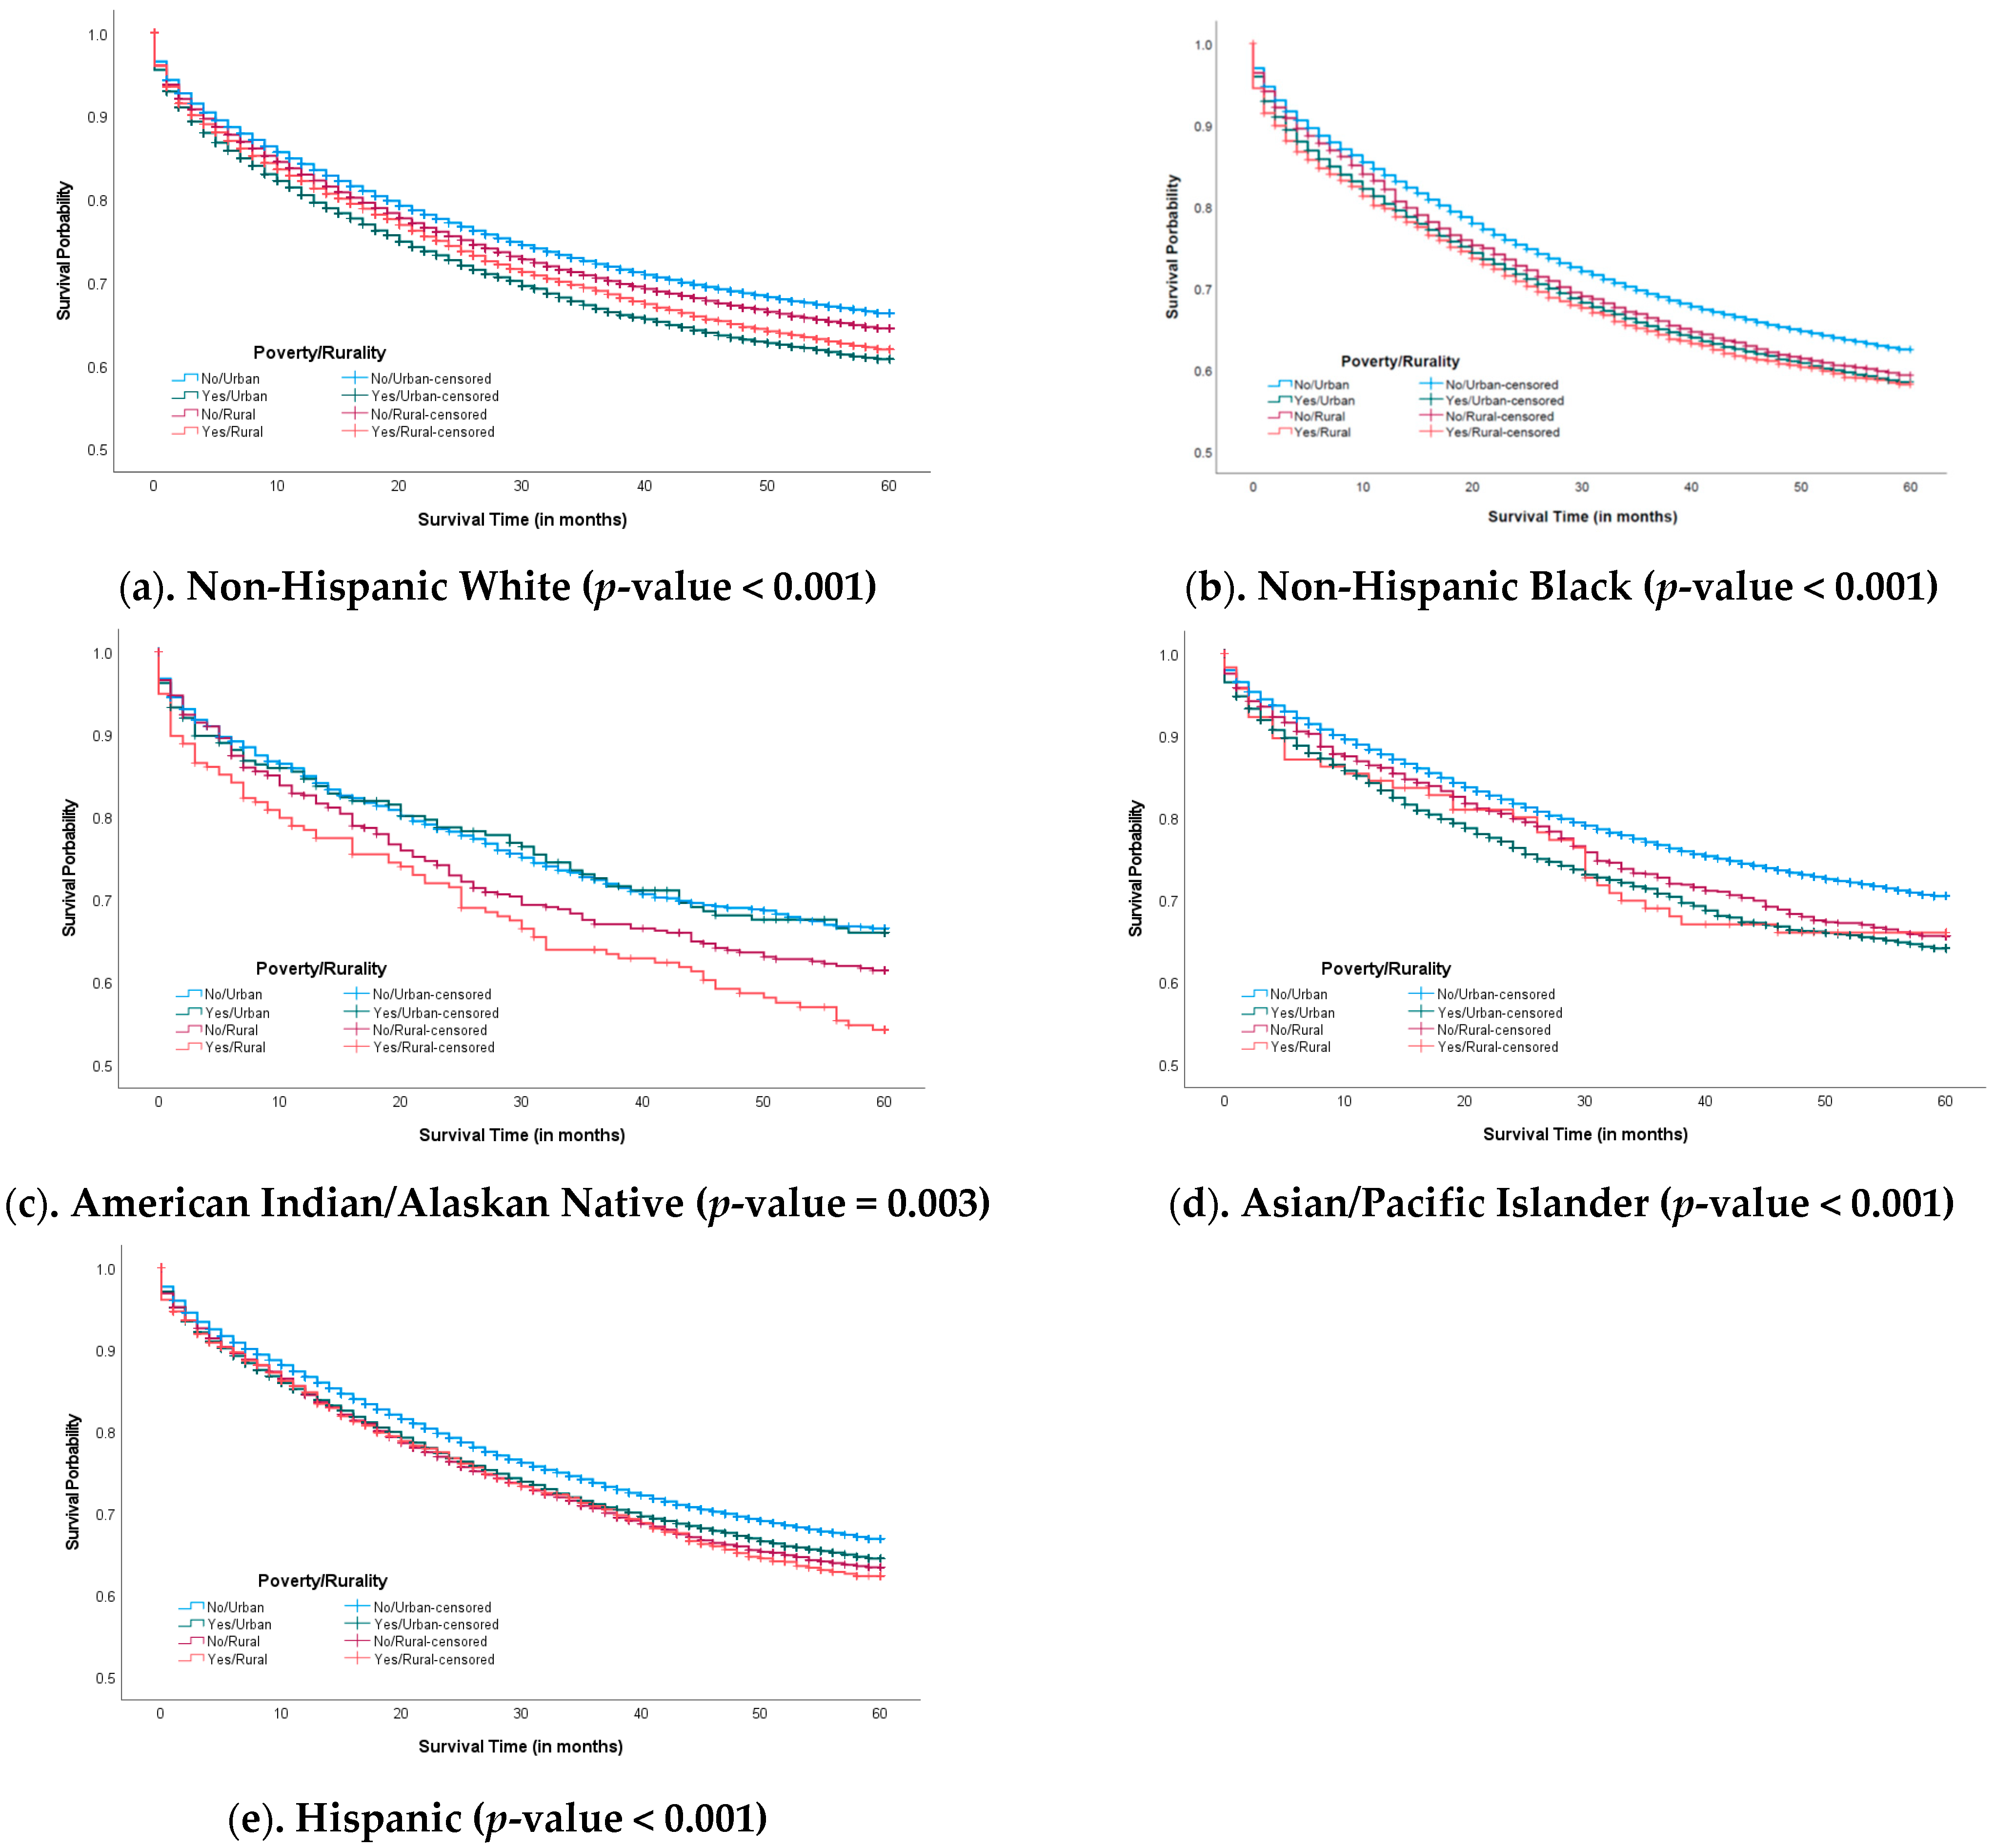
3.2. Five-Year Survival Probability

The mean duration of follow-up time since CRC diagnosis was 40.9 months (SD, 23.4 months). The overall five-year survival rate was 68.1% among CRC patients in the U.S. Based on race and ethnicity, the corresponding probabilities were 68.3% for NHW, 64.2% for NHB, 66.5% for AI/AN, 72.1% for Asian/PI, and 68.7% for Hispanic groups (p-value < 0.001). Further, we used the KM approach to evaluate the PH assumption in our three exposures of interest (race/ethnicity, rurality, poverty) separately. The survival curves followed similar trends without crossing, which met the PH assumption [20]. When exploring the survival probability according to persistent poverty and rurality, the five-year survival probability for those living in urban areas with persistent poverty was 64.6% (vs. 65.1% in rural/persistent poverty, 67.1% in rural but not persistent poverty, 68.8% in urban but not persistent poverty, respectively; p-value < 0.001) among NHW (Figure 1a) and 67.6% (vs. 67.8% in rural/persistent poverty, 68.2% in rural but not persistent poverty, 72.6% in urban but not persistent poverty, respectively; p-value < 0.001) among Asian/PI patients (Figure 1d). In Figure 1b,c,e the survival curves overlapped somewhat. Among non-NHW patients, those living in rural and persistent-poverty areas had a lower 5-year survival probability than those living in areas with persistent poverty alone, rurality alone, or neither.

3.3. Association Between Race/Ethnicity, Persistent Poverty, Rurality, and Cause-Specific CRC Survival

As shown in Table 2, results from the four models were similar when adjusting for different covariates. In the full model, we found that NHB patients had a 1.1-fold increased risk of CRC death (hazard ratio [HR], 1.12; 95% CI, 1.10–1.13) in comparison to NHW patients. However, Asian/PI and Hispanic patients were 9% (HR, 0.91; 95% CI, 0.89–0.93) and 3% (HR, 0.97; 95% CI, 0.96–0.99) less likely to die from CRC, respectively, compared to NHW patients. More importantly, CRC patients living in areas designated as persistent poverty (HR, 1.10; 95% CI, 1.08–1.12) and rural (HR, 1.11; 95% CI, 1.10–1.13) had a 1.1-fold increased risk of CRC death compared with those who did not live in these areas. Similar results were also observed from competing risk models. In the full adjusted analysis, NHB patients were 1.1-fold more likely to die from CRC (HR, 1.1; 95% CI, 1.09–1.12). Asian/PI and Hispanic patients were 15% (HR, 0.85; 95% CI, 0.83–0.87) less likely to die from CRC; however, no significant difference was observed for Hispanic patients. CRC patients living in areas designated as persistent poverty (HR, 1.06; 95% CI, 1.05–1.08) and rural (HR, 1.09; 95% CI, 1.07–1.10) also had 1.1-fold increased risk of CRC death. Finally, we examined the association when adjusting for all covariates by excluding unknown tumor grade and SEER summary stage. Results from the full model and reduced model were similar (Supplementary Table S1).
As shown in Table 3, CRC patients living in persistent poverty and rural areas had a 1.2–1.6-fold increased risk of CRC death compared to those living in non-persistent poverty and non-rural areas (NHW: HR, 1.26, 95% CI, 1.21–1.31; NHB: HR, 1.2, 95% CI, 1.12–1.28; AI/AN: HR, 1.66, 95% CI, 1.32–2.08; Hispanic: HR, 1.18, 95% CI, 1.09–1.29, all p-values < 0.001). A 66% higher risk of cause-specific death for CRC was observed in AI/ANs. Higher estimate was also observed for AI/ANs when conducting a competing risk model (HR, 1.45; 95% CI, 1.08–1.94). Further, CRC patients living in non-rural, persistent-poverty areas were about 11% more likely to die from CRC for NHWs, NHBs, Asian/PIs, and Hispanics (NHW: HR, 1.13, 95% CI, 1.10–1.17; NHB: HR, 1.10, 95% CI, 1.07–1.14; AI/AN: HR, 1.11, 95% CI, 1.03–1.19; Hispanic: HR, 1.05, 95% CI, 1.01–1.09, all p-values < 0.001). Similarly, we found that CRC patients living in rural, non-persistent-poverty areas were about 1.1–1.2-times more likely to die from CRC for NHWs, NHBs, Asian/PIs, and Hispanics (NHW: HR, 1.10, 95% CI, 1.08–1.12; NHB: HR, 1.11, 95% CI, 1.05–1.18; AI/AN: HR, 1.17, 95% CI, 1.05–1.31; Hispanic: HR, 1.15, 95% CI, 1.09–1.22, all p-values < 0.05).

4. Discussion

To our knowledge, this is the first study to examine the intersectional associations between persistent poverty and rurality and cause-specific CRC survival using the SEER incidence data with census tract attributes. We found that CRC patients living in rural areas or areas with persistent poverty had a slightly increased risk of CRC death compared to those not living in a rural or persistent-poverty area. When examining racial/ethnic differences, regardless of racial/ethnic groups, CRC patients living in rural areas with persistent poverty were at a 1.2–1.6-fold increased risk of CRC death, with a higher estimate for AI/ANs. Findings from our study indicate that the intersectional associations between persistent poverty and rurality may be an important determinant of cause-specific CRC survival when considering diverse racial/ethnic groups.
Overall, the results of this study indicate that CRC patients living in persistent poverty and rural areas have an increased risk of CRC death compared to those not living in these areas regardless of race/ethnicity. Several factors may account for this finding, including a lack of access to quality health care, a decreased supply of health care providers, a lack of transportation, and institutional racism [15,21]. Access to timely quality care is an important mediator of CRC mortality [11]. Patient factors such as medical distrust or health illiteracy may also play a role. Compared to urban areas, rural communities have higher poverty rates, lower educational attainment, a lack of transportation, and a lack of access to health care services [14,15]. The disparities in CRC survival may be partly due to a lack of colonoscopy services in rural and persistent-poverty areas [11]. Social determinants of health (e.g., poverty, rurality, food deserts, food swamps) are complex and interconnected, requiring a more comprehensive approach to analyze and intervene. Possible solutions must consider the entire spectrum of social factors that influence outcomes across the cancer continuum (primary prevention, early detection, treatment, and survivorship). This may be particularly true for AI/ANs as we found that AI/AN patients living in persistent poverty and rural areas had a higher risk of CRC mortality. Lower awareness of CRC among AI men may explain the CRC mortality disparities in these groups [20]. Because of limited research on this topic, more studies are needed to elucidate the specific barriers that impact CRC outcomes among AI/ANs.
When examining 5-year survival probability across different racial/ethnic groups, Black patients with CRC had the worst 5-year survival of any of the five racial/ethnic groups we examined, which is consistent with the prior literature [1]. In an analysis of data from the National Cancer Database from 2004 to 2018, Tobin et al. [12] found that both rurality and Black race negatively affect the survival of patients with stage II-III CRC and that they may act synergistically to worsen outcomes. Moss et al. [21] found that Black residents of rural, persistent-poverty counties had the highest mortality rates for six out of eight cancer outcomes. We found that NHB patients who live in rural areas with persistent poverty were at a 1.2-fold increased risk of CRC death compared with those who did not live in these areas. Several factors may account for this disparity, including a lack of access to timely and quality care, differences in disease management and treatment, cultural factors, discrimination, medical distrust, and provider bias [7,22].
The associations between living in a persistent-poverty area and decreased CRC survival may differ according to race and ethnicity, as found in the literature [5]. Barriers to access to care, including financial barriers, environmental barriers such as lack of transportation and nearby facilities, and social environment barriers such as social and cultural factors, may explain these disparities [7].
Social norms, such as community standards, group expectations, common practices, and shared beliefs, can also influence a community’s intention to access cancer screening and treatment. In previous research, sociodemographic differences observed in CRC screening were mediated through social cognitive factors, supporting the findings of this project for a multi-dimensional approach that includes addressing social norms [23].
The strengths of the current study include the large sample size, geographic coverage, and the availability of a census tract-level measure of persistent poverty as well as rurality. In particular, we considered the intersectional associations between persistent poverty and rurality and cause-specific CRC survival, which may reflect the actual impact of health resources on cause-specific survival for CRC. Our findings are critical to inform health system policies for health-related investments in rural and persistent-poverty areas. Health resources may include specialized health care professionals and screening facilities to promote early detection and treatment of CRC [24].
With respect to the generalizability of the current study findings, our results may be applicable to other population groups with similar structural characteristics (e.g., persistent poverty, rural residence, limited access to health care, systemic marginalization). The current study should be replicated in other geographic and sociocultural contexts—such as Indigenous communities in Canada or rural areas of Central and Eastern Europe. This would allow for the verification of the broader validity of the findings and support the development of relevant public health strategies aimed at reducing inequalities in cancer survival. With respect to other limitations, first, individual-level data for lifestyle factors were not available as cancer registries usually do not collect this information. For example, physical inactivity, obesity, current smoking behaviors, pro-inflammatory dietary habits, and heavy alcohol use may greatly increase the risk of CRC mortality [3]. The absence of these covariates in SEER data may have resulted in residual confounding which could bias risk estimates. The presence of chronic disease conditions was also not available for evaluation because of unavailable information from the SEER program. Second, ecological fallacy is a possibility because of the use of census tract-level measures of persistent poverty and rurality. Additional information about structural barriers related to poverty or rurality at the individual and community-level (e.g., lack of transportation, lack of treatment or screening facilities) may be needed to further elucidate CRC mortality. However, that information was not available in the SEER program. Evidence has shown that addressing structural barriers at different levels may enhance CRC survival through timely cancer care [25]. More research integrating the multifactorial factors is needed to further elucidate the relationship between our findings and CRC survival in rural areas with persistent poverty. Fourth, although initial treatment was included as covariates, the analysis did not explore differences in treatment quality, timing, or completion. Fifth, poverty and rurality information may mismatch due to time differences in the information, which may have overestimated the effect of poverty and/or rurality on cause-specific survival for CRC. The definition of poverty and rurality may also vary across different timeframes. Thus, more research using different timeframes of poverty and rurality definition may be helpful. Finally, although treatment modality is not our exposure of interest, future research using this factor should be cautious due to the completeness of the variables. Future research examining the intersecting relationship of poverty and rurality should consider the stage at diagnosis in greater detail.

5. Conclusions

In conclusion, CRC patients who live in a rural or persistent-poverty area in SEER areas in the U.S. have poorer cause-specific survival for CRC compared with those who do not live in such areas regardless of racial/ethnic groups, with significant higher risk for AI/AN patients. Patient navigators, community education on screening, access to various screening opportunities, and health care system interventions may be helpful in addressing these disparities by socioeconomic status, race, Hispanic ethnicity, and geographic residence [3]. Policies that increase the supply of health care providers in rural and persistent-poverty areas may also help to alleviate these disparities. In particular, multi-level interventions are needed to alleviate these disparities in cause-specific CRC survival [21].

Supplementary Materials

The following supporting information can be downloaded at: https://www.mdpi.com/article/10.3390/curroncol32050248/s1. Supplementary Table S1. Results from proportional hazards models. Association between race/ethnicity, persistent poverty, and rurality on the risk of CRC death (unknown tumor grade and SEER summary stage were removed).

Author Contributions

S.S.C. conceptualized the analysis and drafted the manuscript. M.-H.T. completed the statistical analysis and also helped draft the manuscript. All coauthors (S.S.C., M.-H.T., J.C., M.B. and M.V.) reviewed and edited the draft manuscript; made substantial contributions to the conception or design of the work, interpretation of data, drafting of the work, or reviewing it for important intellectual content; approved the final version to be published; and agree to be accountable for all aspects of the work in ensuring that questions related to the accuracy or integrity of any part of the work are appropriately investigated and resolved. All authors have read and agreed to the published version of the manuscript.

Funding

This research was supported at least in part through the Georgia Cancer Center Paceline funding mechanism at Augusta University (principal investigator: Meng-Han Tsai, MCGFD01060).

Institutional Review Board Statement

The study was conducted in accordance with the Declaration of Helsinki. The extracted data were publicly available, de-identified, and thus exempt from institutional review board (IRB) review. Data extracted for this study were publicly available and de-identified, and thus they were considered exempt from IRB review at Augusta University.

Informed Consent Statement

Informed consent was waived as only routinely collected cancer surveillance data were used in the analysis. There were no personal identifiers in the public use data used for this study.

Data Availability Statement

The data used for this study are available from the U.S. National Cancer Institute website.

Conflicts of Interest

The authors have no competing interests to report.

Appendix A. STROBE Statement—Checklist of Items That Should Be Included in Reports of Cohort Studies

Item NoRecommendationPage No
Title and abstract1(a) Indicate the study’s design with a commonly used term in the title or the abstract
(b) Provide in the abstract an informative and balanced summary of what was done and what was found1
Introduction
Background/rationale2Explain the scientific background and rationale for the investigation being reported1, 2
Objectives3State specific objectives, including any prespecified hypotheses2
Methods
Study design4Present key elements of study design early in the paper1, 2
Setting5Describe the setting, locations, and relevant dates, including periods of recruitment, exposure, follow-up, and data collection2
Participants6(a) Give the eligibility criteria, and the sources and methods of selection of participants. Describe methods of follow-up
(b) For matched studies, give matching criteria and number of exposed and unexposed2, 3
Variables7Clearly define all outcomes, exposures, predictors, potential confounders, and effect modifiers. Give diagnostic criteria, if applicable3
Data sources/measurement8 * For each variable of interest, give sources of data and details of methods of assessment (measurement). Describe comparability of assessment methods if there is more than one group2, 3
Bias9Describe any efforts to address potential sources of bias3, 4
Study size10Explain how the study size was arrived at2, 3
Quantitative variables11Explain how quantitative variables were handled in the analyses. If applicable, describe which groupings were chosen and why3
Statistical methods12(a) Describe all statistical methods, including those used to control for confounding
(b) Describe any methods used to examine subgroups and interactions
(c) Explain how missing data were addressed3, 4
(d) If applicable, explain how loss to follow-up was addressed
(e) Describe any sensitivity analyses
Results
Participants13 *(a) Report numbers of individuals at each stage of study—eg numbers potentially eligible, examined for eligibility, confirmed eligible, included in the study, completing follow-up, and analysed2, 3
(b) Give reasons for non-participation at each stage
(c) Consider use of a flow diagram
Descriptive data14 *(a) Give characteristics of study participants (eg demographic, clinical, social) and information on exposures and potential confounders
(b) Indicate number of participants with missing data for each variable of interest4, 5
(c) Summarise follow-up time (eg, average and total amount)
Outcome data15 *Report numbers of outcome events or summary measures over time5, 6
Main results16(a) Give unadjusted estimates and, if applicable, confounder-adjusted estimates and their precision (eg, 95% confidence interval). Make clear which confounders were adjusted for and why they were included
(b) Report category boundaries when continuous variables were categorized4, 9
(c) If relevant, consider translating estimates of relative risk into absolute risk for a meaningful time period
Other analyses17Report other analyses done—eg analyses of subgroups and interactions, and sensitivity analyses9
Discussion
Key results18Summarise key results with reference to study objectives9
Limitations19Discuss limitations of the study, taking into account sources of potential bias or imprecision. Discuss both direction and magnitude of any potential bias10,11
Interpretation20Give a cautious overall interpretation of results considering objectives, limitations, multiplicity of analyses, results from similar studies, and other relevant evidence10
Generalisability21Discuss the generalisability (external validity) of the study results10
Other information
Funding22Give the source of funding and the role of the funders for the present study and, if applicable, for the original study on which the present article is based11
* Give information separately for exposed and unexposed groups. Note: An Explanation and Elaboration article discusses each checklist item and gives methodological background and published examples of transparent reporting. The STROBE checklist is best used in conjunction with this article (freely available on the Web sites of PLoS Medicine at http://www.plosmedicine.org/, Annals of Internal Medicine at http://www.annals.org/, and Epidemiology at http://www.epidem.com/). Information on the STROBE Initiative is available at http://www.strobe-statement.org (accessed on 20 April 2025).

References

  1. American Cancer Society. Cancer Facts & Figures 2024; American Cancer Society: Atlanta, GA, USA, 2023. [Google Scholar]
  2. American Cancer Society. Cancer Facts & Figures for African American/Black People 2022–2024; American Cancer Society: Atlanta, GA, USA, 2022. [Google Scholar]
  3. Coughlin, S.S.; Blumenthal, D.S.; Jordan Seay, S.; Smith, S.A. Toward the elimination of colorectal cancer disparities among African Americans. J. Racial Ethn. Health Disparities 2016, 3, 555–564. [Google Scholar] [CrossRef] [PubMed]
  4. Hines, R.; Markossian, T.; Johnson, A.; Dong, F.; Bayakly, R. Geographic residency status and census tract socioeconomic status as determinants of colorectal cancer outcomes. Am. J. Public Health 2014, 104, e63–e71. [Google Scholar] [CrossRef]
  5. Steinbrecher, A.; Fish, K.; Clarke, C.A.; West, D.W.; Gomez, S.L.; Cheng, I. Examining the association between socioeconomic status and invasive colorectal cancer incidence and morality in California. Cancer Epidemiol. Biomark. Prev. 2012, 21, 1814–1822. [Google Scholar] [CrossRef]
  6. Enewold, L.; Horner, M.-J.; Shriver, C.D.; Zhu, K. Socioeconomic disparities in colorectal cancer mortality in the United States, 1990–2007. J. Community Health 2014, 39, 760–766. [Google Scholar] [CrossRef] [PubMed]
  7. Tsai, M.-H.; Vernon, M.; Su, S.; Coughlin, S.S.; Dong, Y. Racial disparities in the relationship of regional socioeconomic status and colorectal cancer survival in the five regions of Georgia. Cancer Med. 2024, 13, e6954. [Google Scholar] [CrossRef] [PubMed]
  8. Du, X.L.; Fang, S.; Vernon, S.W.; El-Serag, H.; Shih, Y.T.; Davila, J.; Rasmus, M.L. Racial disparities and socioeconomic status in association with survival in a large population-based cohort of elderly patients with colon cancer. Cancer 2007, 110, 660–669. [Google Scholar] [CrossRef]
  9. Balan, N.; Petrie, B.A.; Chen, K.T. Racial disparities in colorectal cancer care for Black patients: Barriers and solutions. Am. Surg. 2022, 88, 2823–2830. [Google Scholar] [CrossRef]
  10. Moralez, E.A.; Rao, S.P.; Livaudais, J.C.; Thompson, B. Improving knowledge and screening for colorectal cancer among Hispanics: Overcoming barriers through a PROMOTORA-led home-based educational intervention. Cancer Educ. 2012, 27, 533–539. [Google Scholar] [CrossRef]
  11. Adams, S.A.; Zahnd, W.E.; Ranganathan, R.; Hung, P.; Brown, M.J.; Truman, S.; Biesecker, C.; Kirksey, V.C.; Eberth, J.M. Rural and racial disparities in colorectal cancer incidence and mortality in South Carolina, 1996–2016. J. Rural Health 2022, 38, 34–39. [Google Scholar] [CrossRef]
  12. Tobin, E.C.; Nolan, N.; Thompson, S.; Elmore, M.; Richmond, B.K. The intersection of race and rurality and its effect on colorectal cancer survival. Am. Surg. 2023, 89, 3163–3170. [Google Scholar] [CrossRef]
  13. Andrilla, C.H.; Moore, T.E.; Wong, K.M.; Evans, D.V. Investigating the impact of geographic location on colorectal cancer stage at diagnosis: A national study of the SEER cancer registry. J. Rural Health 2020, 36, 316–325. [Google Scholar] [CrossRef] [PubMed]
  14. Coughlin, S.S.; Clary, C.; Johnson, J.A.; Berman, A.; Heboyan, V.; Benevides, T.; Moore, J.; George, V. Continuing challenges in rural health in the United States. J. Environ. Health Sci. 2019, 5, 90–92. [Google Scholar]
  15. Ricketts, T.C. The changing nature of rural health care. Annu. Rev. Public Health 2000, 21, 639–657. [Google Scholar] [CrossRef] [PubMed]
  16. Tammana, V.S.; Laiyemo, A.O. Colorectal cancer disparities: Issues, controversies and solutions. World J. Gastroenterol. 2014, 20, 869–876. [Google Scholar] [CrossRef]
  17. Adams, L.B.; Richmond, J.; Corbie-Smith, G.; Powell, W. Medical mistrust and colorectal cancer screening among African Americans. Community Health 2017, 42, 1044–1061. [Google Scholar] [CrossRef]
  18. Aspiras, O.; Lucas, T.; Thompson, H.S.; Manning, M.A. Medical mistrust, culturally targeted message framing, and colorectal cancer screening among African Americans. J. Behav. Med. 2023, 46, 871–881. [Google Scholar] [CrossRef]
  19. Lee, J.; Ewing, B.; Holmes, D. Barriers and Facilitators to Colorectal Cancer Screening in South Asian Immigrants: A Systematic Review. Asian Pac. J. Cancer Prev. 2023, 24, 1463–1475. [Google Scholar] [CrossRef] [PubMed]
  20. James, A.S.; Filippi, M.K.; Pacheco, C.M.; Cully, L.; Perdue, D.; Choi, W.S.; Greiner, K.A.; Daley, C.M. Barriers to colorectal cancer screening among American Indian men aged 50 or older, Kansas and Missouri, 2006–2008. Prev. Chronic Dis. 2013, 10, E170. [Google Scholar] [CrossRef]
  21. Moss, J.L.; Pinto, C.N.; Srinivasan, S.; Cronin, K.A.; Croyle, R.T. Enduring cancer disparities by persistent poverty, rurality, and race: 1990–1992 to 2014–2018. J. Natl. Cancer Inst. 2022, 114, djac038. [Google Scholar] [CrossRef]
  22. Ellis, L.; Canchol, J.; Spiegel, D.; Ladabaum, U.; Haile, R.; Gomez, S.L. Racial and ethnic disparities in cancer survival: The contribution of tumor, sociodemographic, institutional, and neighborhood characteristics. J. Clin. Oncol. 2018, 36, 25–33. [Google Scholar] [CrossRef]
  23. Lo, S.H.; Waller, J.; Vrinten, C.; Kobayashi, L.; von Wagner, C. Social cognitive mediators of sociodemographic differences in colorectal cancer screening uptake. BioMed Res. Int. 2015, 2015, 165074. [Google Scholar] [CrossRef] [PubMed]
  24. Obrochta, C.A.; Murphy, J.D.; Tsou, M.H.; Thompson, C.A. Disentangling racial, ethnic, and socioeconomic disparities in treatment for colorectal cancer. Cancer Epidemiol. Biomark. Prev. 2021, 30, 1546–1553. [Google Scholar] [CrossRef] [PubMed]
  25. Dixit, N.; Rugo, H.; Burke, N.J. Navigating a path to equity in cancer care: The role of patient navigation. Am. Soc. Clin. Oncol. Educ. Book. 2021, 41, 3–10. [Google Scholar] [CrossRef] [PubMed]
Figure 1. Kaplan–Meier colorectal cancer survival curves. Survival by poverty and rurality. In Figure 1, colorectal cancer survival was different when comparing poverty and rurality across different race/ethnicity groups.
Curroncol 32 00248 g001
Table 1. Characteristics of study population. Distribution of persistent poverty, rurality, demographic characteristics, tumor features, and treatment modality by race/ethnicity.
Total
(n = 532,868)
NHW
(n = 363,505)
NHB
(n = 63,537)
AI/AN
(n = 2236)
Asian/PI
(n = 35,453)
Hispanic
(n = 68,137)
p-Value
n (%)
Persistent poverty a <0.001
  No476,874 (89.5%)343,676 (94.6%)45,843 (72.2%)1782 (79.7%)33,113 (93.4%)52,460 (77.0%)
  Yes55,994 (10.5%)19,829 (5.5%)17,694 (27.9%)454 (20.3%)2340 (6.6%)15,677 (23.0%)
Rurality a <0.001
  No459,119 (86.2%)302,279 (83.2%)58,171 (91.6%)1585 (70.9%)34,273 (96.7%)62,811 (92.2%)
  Yes73,749 (13.8%)61,226 (16.8%)5366 (8.5%)651 (29.1%)1180 (3.3%)5326 (7.8%)
Poverty/Rurality <0.001
  Poverty alone43,550 (8.2%)11,749 (3.2%)15,376 (24.2%)238 (10.6%)2222 (6.3%)13,965 (20.5%)
  Rural alone61,305 (11.5%)53,146 (14.6%)3048 (4.8%)435 (19.5%)1062 (3.0%)3614 (5.3%)
  Poverty & Rural12,444 (2.3%)8080 (2.2%)2318 (3.7%)216 (9.7%)118 (0.3%)1712 (2.5%)
  Non-Poverty & Rural415,569 (78.0%)290,530 (79.9%)42,795 (67.4%)1347 (60.2%)32,051 (90.4%)48,846 (71.7%)
Demographic characteristics
Age <0.001
   20–39 years15,506 (2.9%)8412 (2.3%)1990 (3.1%)107 (4.5%)1317 (3.7%)3680 (5.4%)
   40–59 years147,500 (27.7%)88,534 (24.4%)22,665 (35.7%)773 (34.6%)11,543 (32.6%)23,985 (35.2%)
   60–79 years253,664 (47.6%)174,944 (48.1%)30,225 (47.6%)1097 (49.1%)16,537 (46.6%)30,861 (45.3%)
   80+ years116,198 (21.8%)91,615 (25.2%)8657 (13.6%)259 (11.6%)6056 (17.1%)9611 (14.1%)
Gender <0.001
  Male277,537 (52.1%)189,128 (52.0%)31,499 (49.6%)1157 (51.7%)18,520 (52.2%)37,233 (54.6%)
  Female255,331 (47.9%)174,377 (48.0%)32,038 (50.4%)1079 (48.3%)16,933 (47.8%)30,904 (45.4%)
Marital status <0.001
  Single69,090 (13.0%)39,019 (10.7%)15,307 (24.1%)417 (18.7%)4317 (12.2%)10,030 (14.7%)
  Married227,687 (42.7%)163,430 (45.0%)18,614 (29.3%)868 (38.8%)20,695 (58.4%)24,080 (35.3%)
  Other b122,132 (22.9%)90,017 (24.8%)14,268 (22.5%)546 (24.4%)6433 (18.2%)10,868 (16.0%)
  Unknown113,959 (21.4%)71,039 (19.5%)15,348 (24.2%)405 (18.1%)4008 (11.3%)23,159 (34.0%)
Year of diagnosis <0.001
   2006–2010269,396 (50.6%)188,606 (51.9%)31,641 (49.8%)972 (43.5%)16,760 (47.3%)31,417 (46.1%)
   2011–2015263,472 (49.4%)174,899 (48.1%)31,896 (50.2%)1264 (56.5%)18,693 (52.7%)36,720 (53.9%)
Tumor features
Grade c <0.001
  Grade 147,731 (9.0%)31,022 (8.5%)6472 (10.2%)206 (9.2%)3136 (8.9%)6895 (10.1%)
  Grade 2305,250 (57.3%)208,444 (57.3%)35,787 (56.3%)1283 (57.4%)21,136 (59.6%)38,600 (56.7%)
  Grade 3 79,249 (14.9%)57,303 (15.8%)7613 (12.0%)284 (12.7%)4740 (12.4%)9309 (13.7%)
  Grade 410,285 (1.9%)7841 (2.2%)882 (1.4%)40 (1.8%)506 (1.4%)1016 (1.5%)
  Unknown90,353 (17.0%)58,895 (16.2%)12,783 (20.1%)423 (18.9%)5935 (16.7%)12,317 (18.1%)
SEER Summary Stage <0.001
  Localized208,901 (39.2%)144,787 (39.8%)24,077 (37.9%)821 (36.7%)13,969 (39.4%)25,247 (37.1%)
  Regionalized185,436 (34.8%)127,683 (35.1%)20,304 (32.0%)772 (34.5%)12,705 (35.8%)23,972 (35.2%)
  Distant108,900 (20.4%)71,773 (19.7%)15,229 (24.0%)501 (22.4%)6788 (19.2%)14,609 (21.4%)
  Unknown29,631 (5.6%)19,262 (5.3%)3927 (6.2%)142 (6.4%)1991 (5.6%)4309 (6.3%)
Primary site d <0.001
  Right217,640 (40.8%)155,220 (42.7%)26,871 (42.3%)801 (35.8%)10,514 (29.7%)24,234 (35.6%)
  Left315,228 (59.2%)208,285 (57.3%)36,666 (57.7%)1435 (64.2%)24,939 (70.3%)43,903 (64.4%)
Treatment modality
Surgery <0.001
   No97,699 (18.3%)63,682 (17.5%)13,892 (21.9%)473 (21.2%)5971 (16.8%)13,681 (20.1%)
   Yes435,169 (81.7%)299,823 (82.5%)49,645 (78.1%)1763 (78.9%)29,482 (83.2%)54,456 (80.0%)
Radiation <0.001
   No474,252 (89.0%)323,109 (88.9%)57,807 (91.0%)1866 (83.5%)30,577 (86.3%)60,893 (89.4%)
   Yes58,616 (11.0%)40,396 (11.1%)5730 (9.0%)370 (16.6%)4876 (13.8%)7244 (10.6%)
Chemotherapy <0.001
   No346,719 (65.1%)239,971 (66.0%)41,370 (65.1%)1332 (59.6%)22,145 (62.5%)41,901 (61.5%)
   Yes186,149 (34.9%)123,534 (34.0%)22,167 (34.9%)904 (40.4%)13,308 (37.5%)26,236 (38.5%)
Abbreviations: CRC, colorectal cancer; NHW, non-Hispanic White; NHB, non-Hispanic Black; AI/AN, American Indian/Alaska Native; PI, pacific islander. a Persistent poverty was defined as when 20% or more of the population has lived below the poverty level for a period spanning about 30 years. Rurality was defined by using the U.S. Department of Agriculture’s (USDA) Rural Urban Commuting Area (RUCA) codes. RUCA codes 1.0, 1.1, 2.0, 2.1, 3.0, 4.1, 5.1, 7.1, 8.1, and 10.1 were considered as urban areas (termed as no) and all other codes were classified as rural areas (termed as yes). b Other includes divorced, separated, and widow. c Grade 1: well-differentiated; Grade 2: moderately differentiated; Grade 3: poorly differentiated; Grade 4: undifferentiated. d Right: cecum to transverse; left: splenic flexure to rectum.
Table 2. Results from proportional hazards models. Association between race/ethnicity, persistent poverty, and rurality on the risk of CRC death.
Crude Model aModel 1 aModel 2 aModel 3 a
HR (95% CI)p-ValueHR (95% CI)p-ValueHR (95% CI)p-ValueHR (95% CI)p-Value
Race/ethnicity <0.001 <0.001 <0.001 <0.001
   NHWReference Reference Reference Reference
   NHB1.13
(1.11, 1.15)
1.20
(1.18, 1.22)
1.16
(1.14, 1.18)
1.12
(1.10, 1.13)
   AI/AN1.02
(0.95, 1.09)
1.11
(1.03, 1.19)
1.09
(1.02, 1.17)
1.05
(0.97, 1.12)
   Asian/PI0.84
(0.82, 0.86)
0.92
(0.90, 0.94)
0.92
(0.90, 0.94)
0.91
(0.89, 0.93)
   Hispanic0.95
(0.93, 0.96)
1.04
(1.02, 1.05)
1.00
(0.98, 1.01)
0.97
(0.96, 0.99)
Persistent poverty b <0.001 <0.001 <0.001 <0.001
   NoReference Reference Reference Reference
   Yes1.15
(1.13, 1.16)
1.12
(1.10, 1.14)
1.11
(1.09, 1.13)
1.10
(1.08, 1.12)
Rurality b <0.001 <0.001 <0.001 <0.001
   NoReference Reference Reference Reference
   Yes1.07
(1.05, 1.08)
1.09
(1.07, 1.10)
1.10
(1.09, 1.12)
1.11 (1.10, 1.13)
Abbreviations: NA, non-applicable; CRC, colorectal cancer; HR, hazard ratio; NHW, non-Hispanic White; NHB, non-Hispanic Black; AI/AN, American Indian/Alaska Native; PI, Pacific Islander. Italicized text indicates statistically significant result. a Crude models included race/ethnicity, persistent poverty, and rurality; model 1 was further adjusted for demographic characteristics (age, gender, marital status) and year of diagnosis; model 2 was further adjusted for tumor characteristics (grade, SEER summary stage, primary site); model 3 was further adjusted for treatment modality (surgery, radiation, chemotherapy). b Persistent poverty was defined as when 20% or more of the population has lived below the poverty level for a period spanning about 30 years. Rurality was defined by using the U.S. Department of Agriculture’s (USDA) Rural Urban Commuting Area (RUCA) codes. RUCA codes 1.0, 1.1, 2.0, 2.1, 3.0, 4.1, 5.1, 7.1, 8.1, and 10.1 were considered as urban areas (termed as no) and all other codes were classified as rural areas (termed as yes).
Table 3. Predictors of CRC death. Intersectional relationship of persistent poverty and rurality on the risk of CRC death.
Rurality b
No
Rurality b
Yes
5-Year CRC Survival
Statusc
No/Yes
n (%)
HR (95% CI) a5-Year CRC Survival Status c
No/Yes
n (%)
HR (95% CI) aHR (95% CI) for Rurality Within Strata of Poverty
Persistent poverty b
Non-Hispanic White
  No (n = 343,676)90,702 (31.2%)/199,828 (66.8%)Reference17,491 (32.9%)/35,655 (67.1%)1.10 (1.08,1.12)1.10 (1.08, 1.12)
  Yes (n = 19,829)4160 (35.4%)/7589 (64.6%)1.13 (1.10, 1.17)2819 (34.9%)/5261 (65.1%)1.26 (1.21,1.31)1.12 (1.06, 1.17)
HR (95% CI) for poverty within strata of rurality1.13 (1.10, 1.17)1.15 (1.10, 1.19)
Non-Hispanic Black
  No (n = 45,843)14,859 (34.7%)/27,936 (65.3%)Reference1145 (37.6%)/1903 (62.4%)1.11 (1.05, 1.18)1.11 (1.05, 1.18)
  Yes (n = 17,694)5859 (38.1%)/9517 (61.9%)1.10 (1.07, 1.14)901 (38.9%)/1417 (61.1%)1.20 (1.12, 1.28)1.09 (1.01, 1.16)
HR (95% CI) for poverty within strata of rurality1.10 (1.07, 1.14)1.07 (0.98, 1.17)
AI/AN
  No (n = 1782)425 (31.6%)/922 (68.5%)Reference157 (36.1%)/278 (63.9%)1.19 (0.98, 1.43)1.19 (0.98, 1.43)
  Yes (n = 454)75 (31.5%)/163 (68.5%)0.99 (0.77, 1.27)93 (43.1%)/123 (56.9%)1.66 (1.32, 2.08)1.67 (1.23, 2.28)
HR (95% CI) for poverty within strata of rurality0.99 (0.77, 1.27)1.40 (1.08, 1.82)
Asian/PI
  No (n = 33,113)8787 (27.4%)/23,264 (72.6%)Reference338 (31.8%)/724 (68.2%)1.17 (1.05, 1.31)1.17 (1.05, 1.31)
  Yes (n = 2340)721 (32.5%)/1501 (67.6%)1.11 (1.03, 1.19)38 (32.2%)/80 (67.8%)1.19 (0.87, 1.64)1.08 (0.78, 1.50)
HR (95% CI) for poverty within strata of rurality1.11 (1.03, 1.19)1.02 (0.73, 1.42)
Hispanic
  No (n = 52,460)14,959 (30.6%)/33,887 (69.4%)Reference1219 (33.7%)/2395 (66.3%)1.15 (1.09, 1.22)1.15 (1.09, 1.22)
  Yes (n = 15,677)4546 (32.6%)/9419 (67.5%)1.05 (1.01, 1.09)586 (34.2%)/1126 (65.8%)1.18 (1.09, 1.29)1.12 (1.03, 1.23)
HR (95% CI) for poverty within strata of rurality1.05 (1.02, 1.09)1.03 (0.93, 1.14)
Abbreviations: CRC, colorectal cancer; HR, hazard ratio; NHW, non-Hispanic White; NHB, non-Hispanic Black; AI/AN, American Indian/Alaska Native; PI, Pacific Islander. Italicized text indicates statistically significant result. a All models were adjusted for demographic characteristics (age, gender, marital status), year of diagnosis, tumor characteristics (grade, SEER summary stage, primary site), and treatment modality (surgery, radiation, chemotherapy), including NHW, NHB, AI/AN, Asian/PI, and Hispanic patients. p-values for multiplicative interactions are <0.05 for NHW (<0.001), NHB (<0.001), Hispanic (<0.001), Asian/PI (0.002), and AI/AN (<0.001). b Persistent poverty was defined as when 20% or more of the population has lived below the poverty level for a period spanning about 30 years. Rurality was defined by using the U.S. Department of Agriculture’s (USDA) Rural Urban Commuting Area (RUCA) codes. RUCA codes 1.0, 1.1, 2.0, 2.1, 3.0, 4.1, 5.1, 7.1, 8.1, and 10.1 were considered as urban areas (termed as no) and all other codes were classified as rural areas (termed as yes). c Patients’ 5-year CRC survival status (no or yes) were provided using row percentage.
Disclaimer/Publisher’s Note: The statements, opinions and data contained in all publications are solely those of the individual author(s) and contributor(s) and not of MDPI and/or the editor(s). MDPI and/or the editor(s) disclaim responsibility for any injury to people or property resulting from any ideas, methods, instructions or products referred to in the content.

