
Prediction of Cultivation Areas for the Commercial and an Early Flowering Wild Accession of Salvia hispanica L. in the United States


Abstract
:1. Introduction
2. Materials and Methods
2.1. Temperature
2.2. Precipitation
- Daily precipitation (n = total rainfall days in either December or November for all years) was ranked (m = 1 being largest);
- Percentiles for each day were computed as
- Only grid cells less than the 10th percentile for 10 mm and 25 mm thresholds were retained.
2.3. Land Use/Land Cover
2.4. Analysis of Climate and Land Use
- Areas where temperatures are suitable based on either 28 °F (−2.2 °C) or 32 °F (0 °C);
- Areas where precipitation is suitable based on thresholds of 10 mm and 25 mm;
- Areas where land cover/land use is suitable based on cropland as the classifier (see Figure 1);
- Areas that are suitable based on a combination of temperature and precipitation results from (1) and (2) combined;
- Areas that are suitable based on a combination of temperature, precipitation, and land cover/land use results from (1), (2) and (3) combined.
3. Results
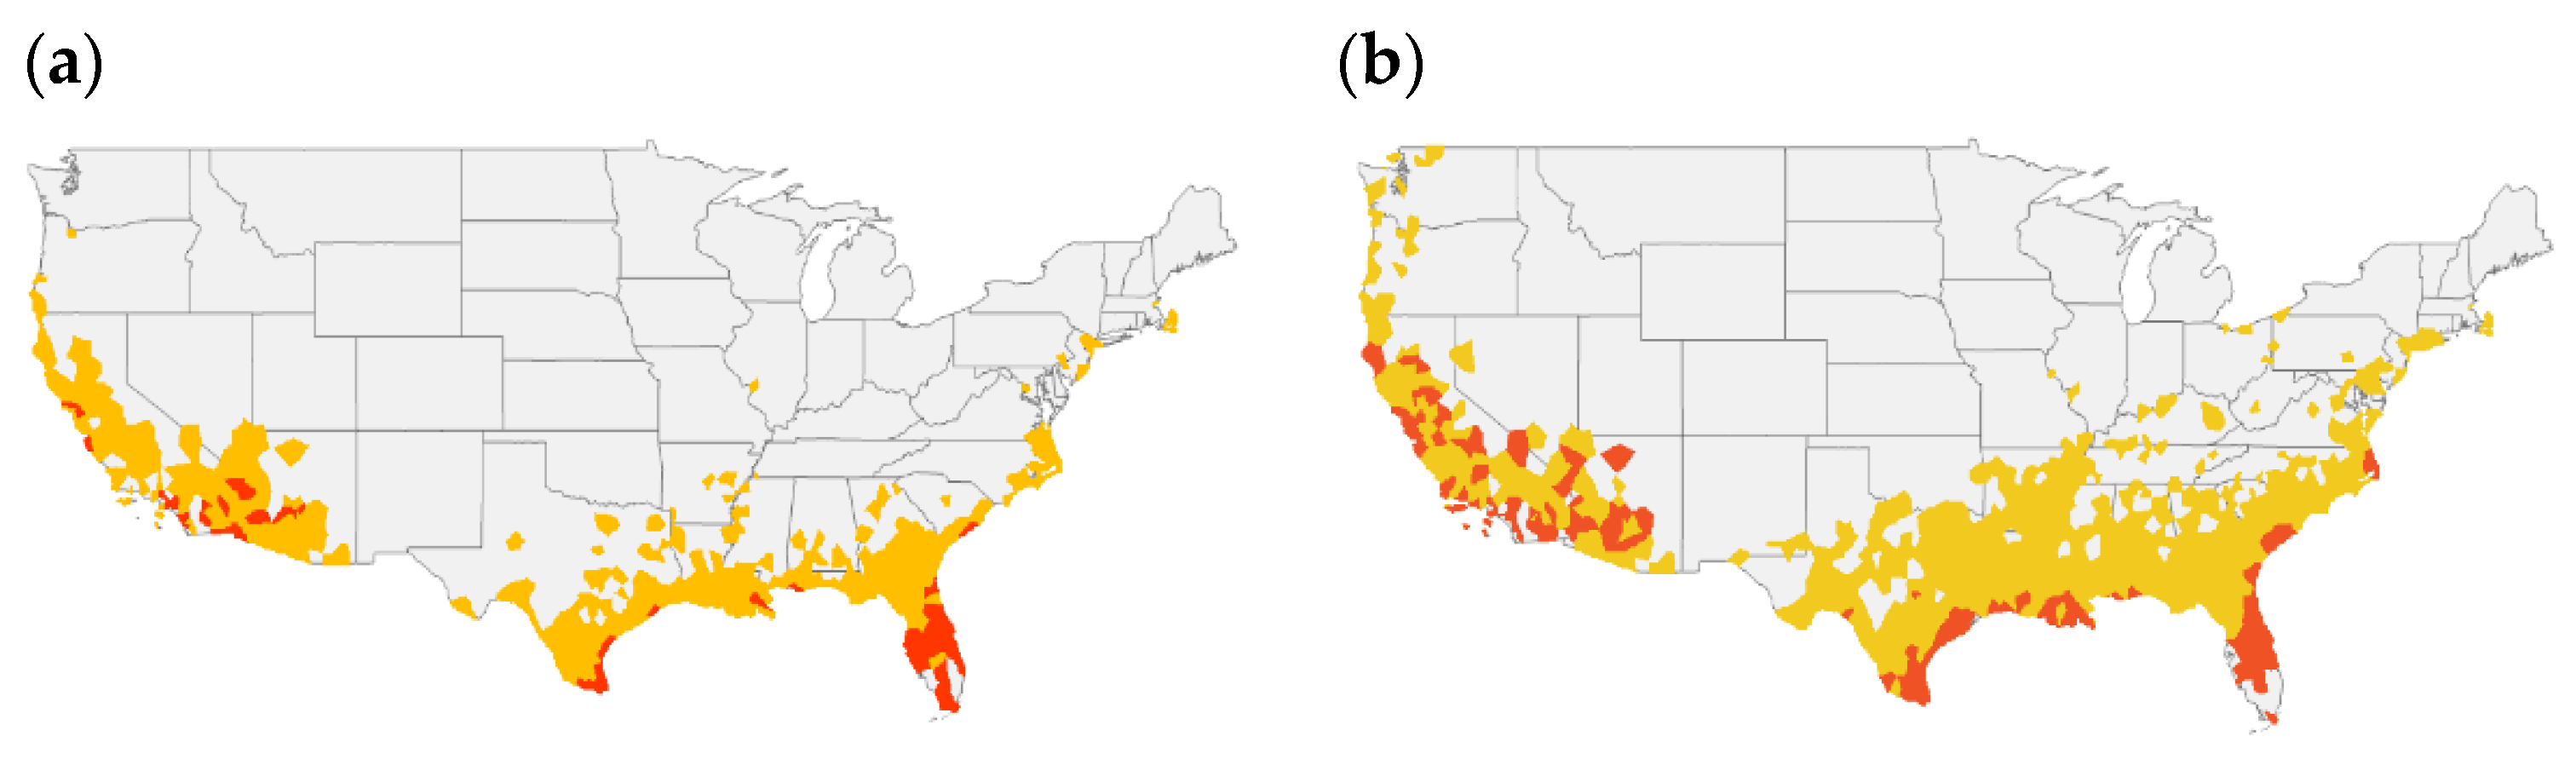
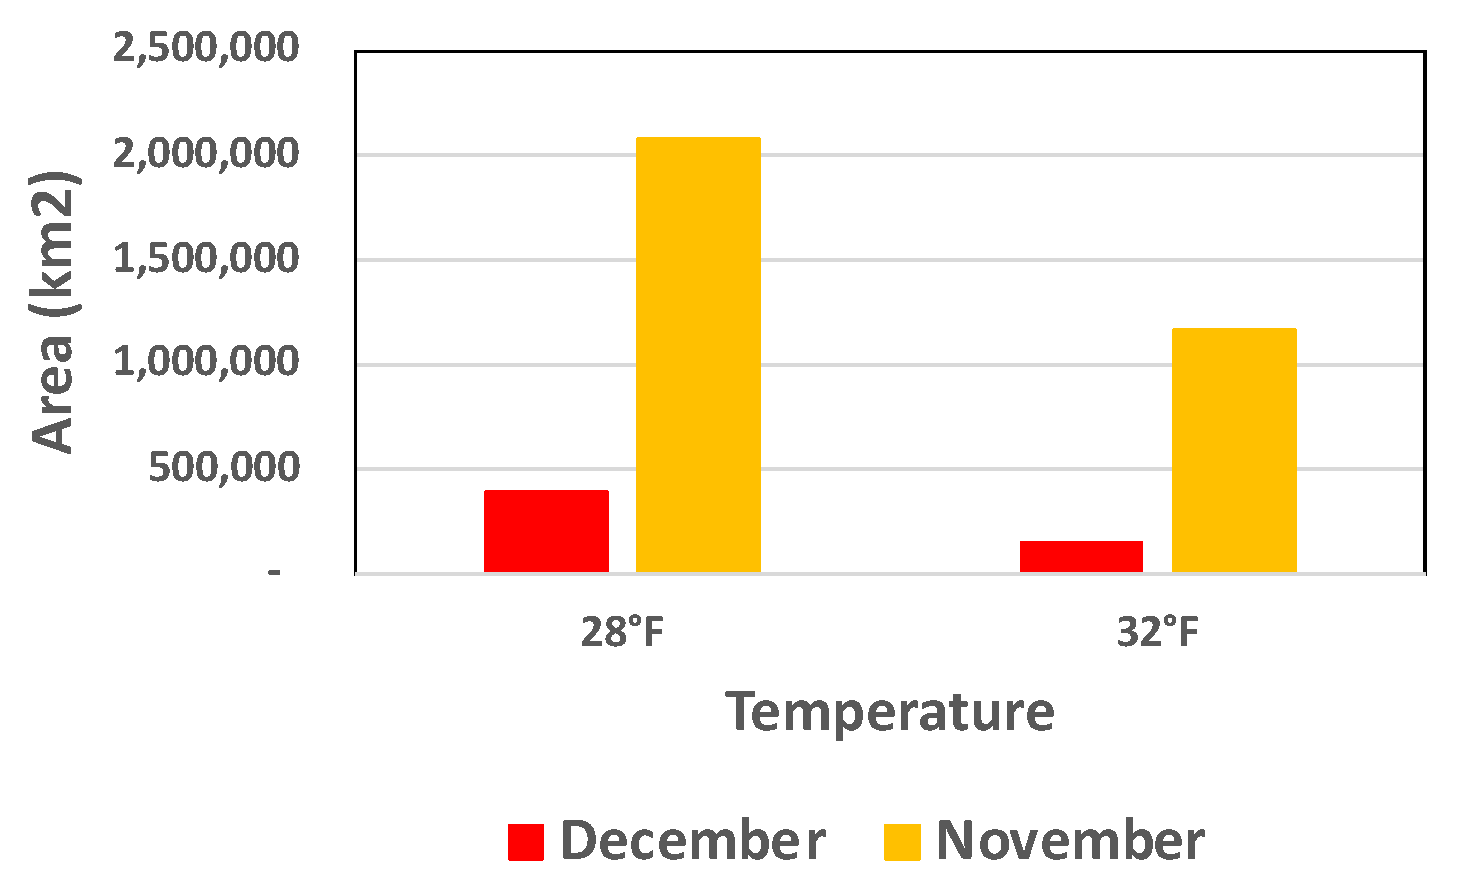
3.1. Temperature
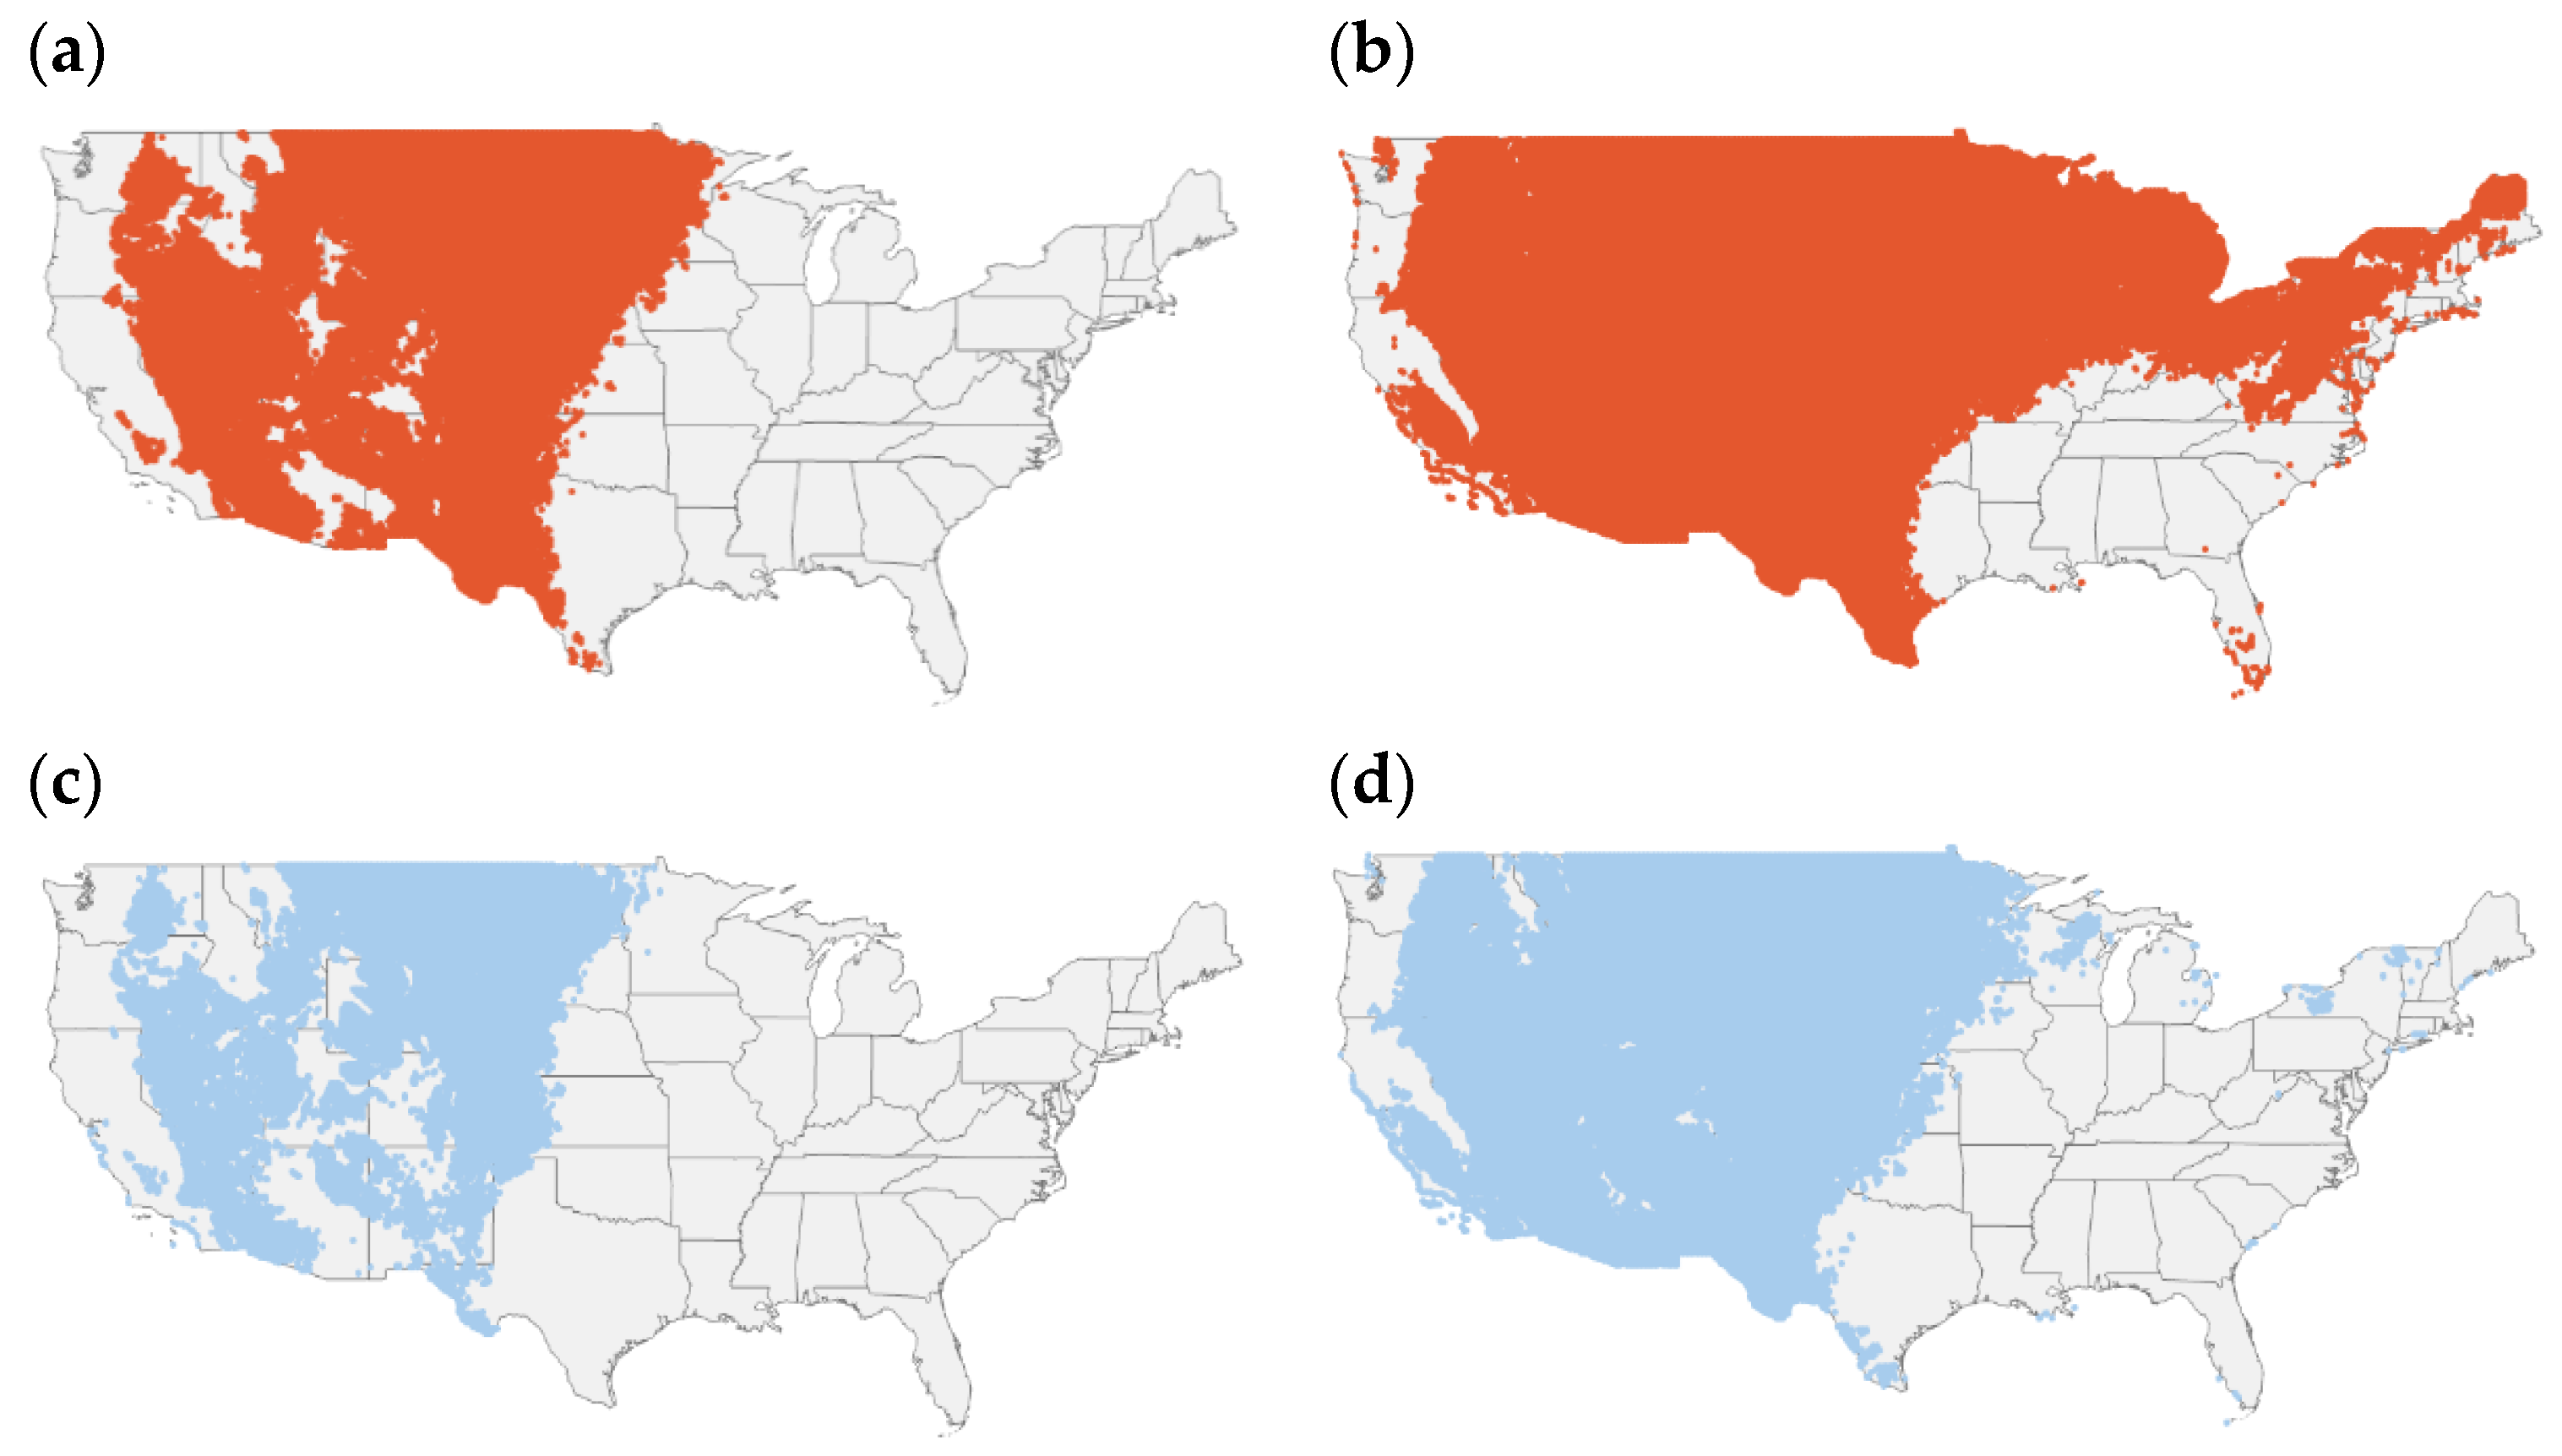
3.2. Precipitation
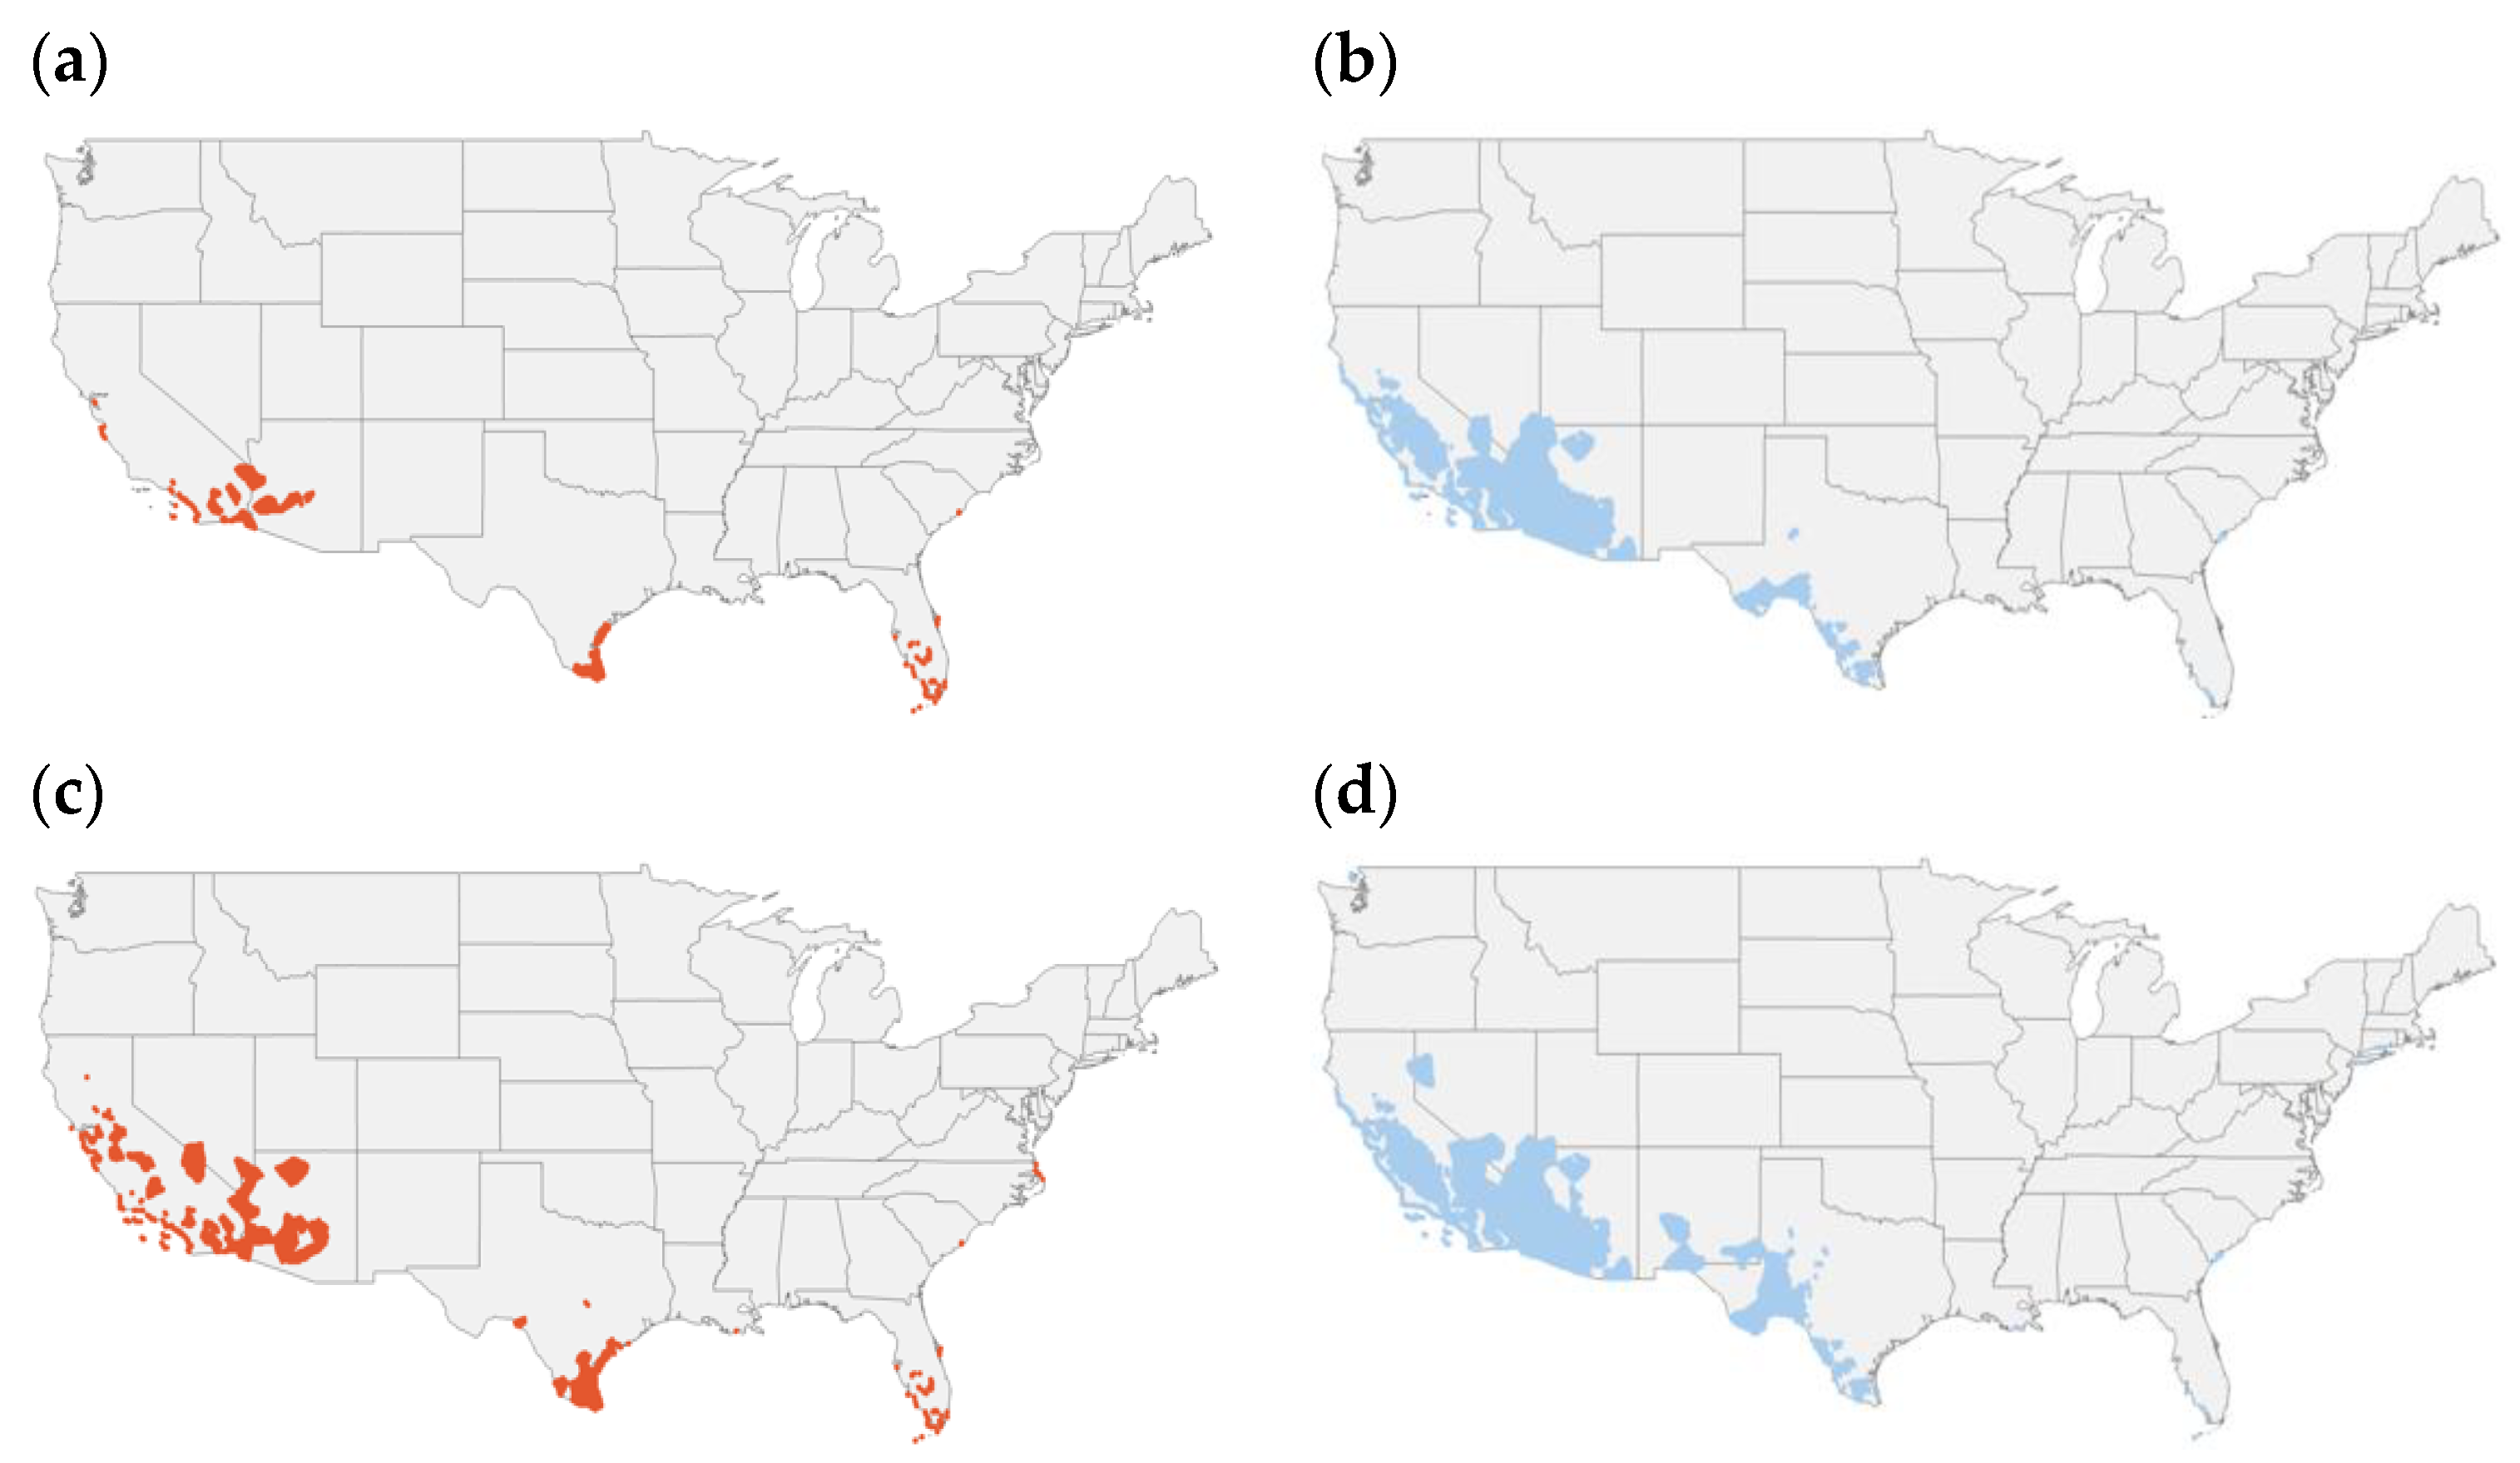
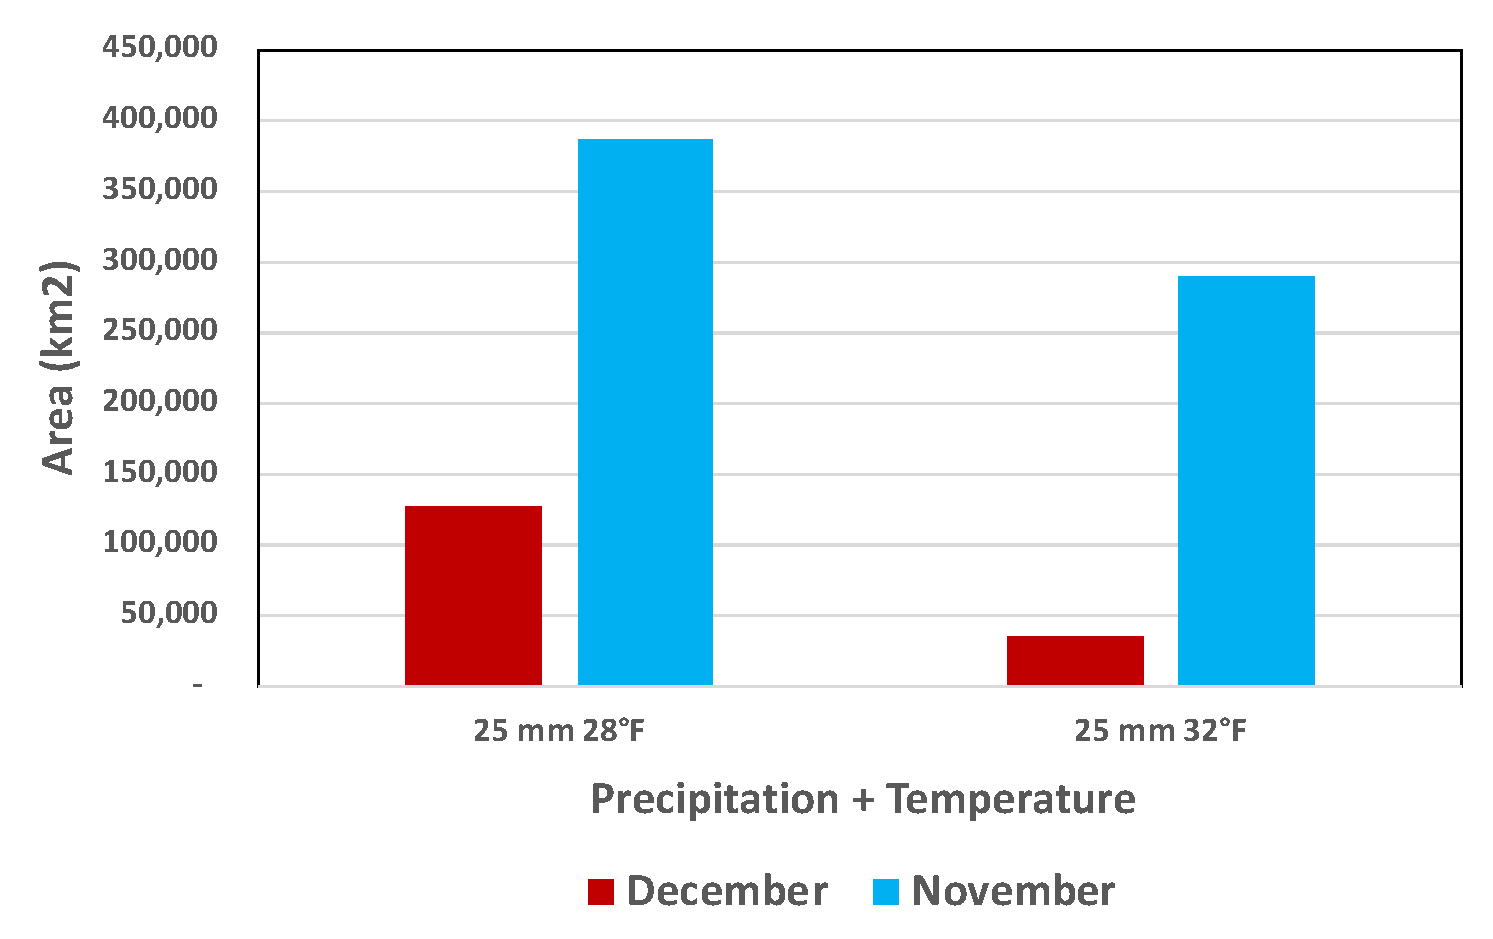
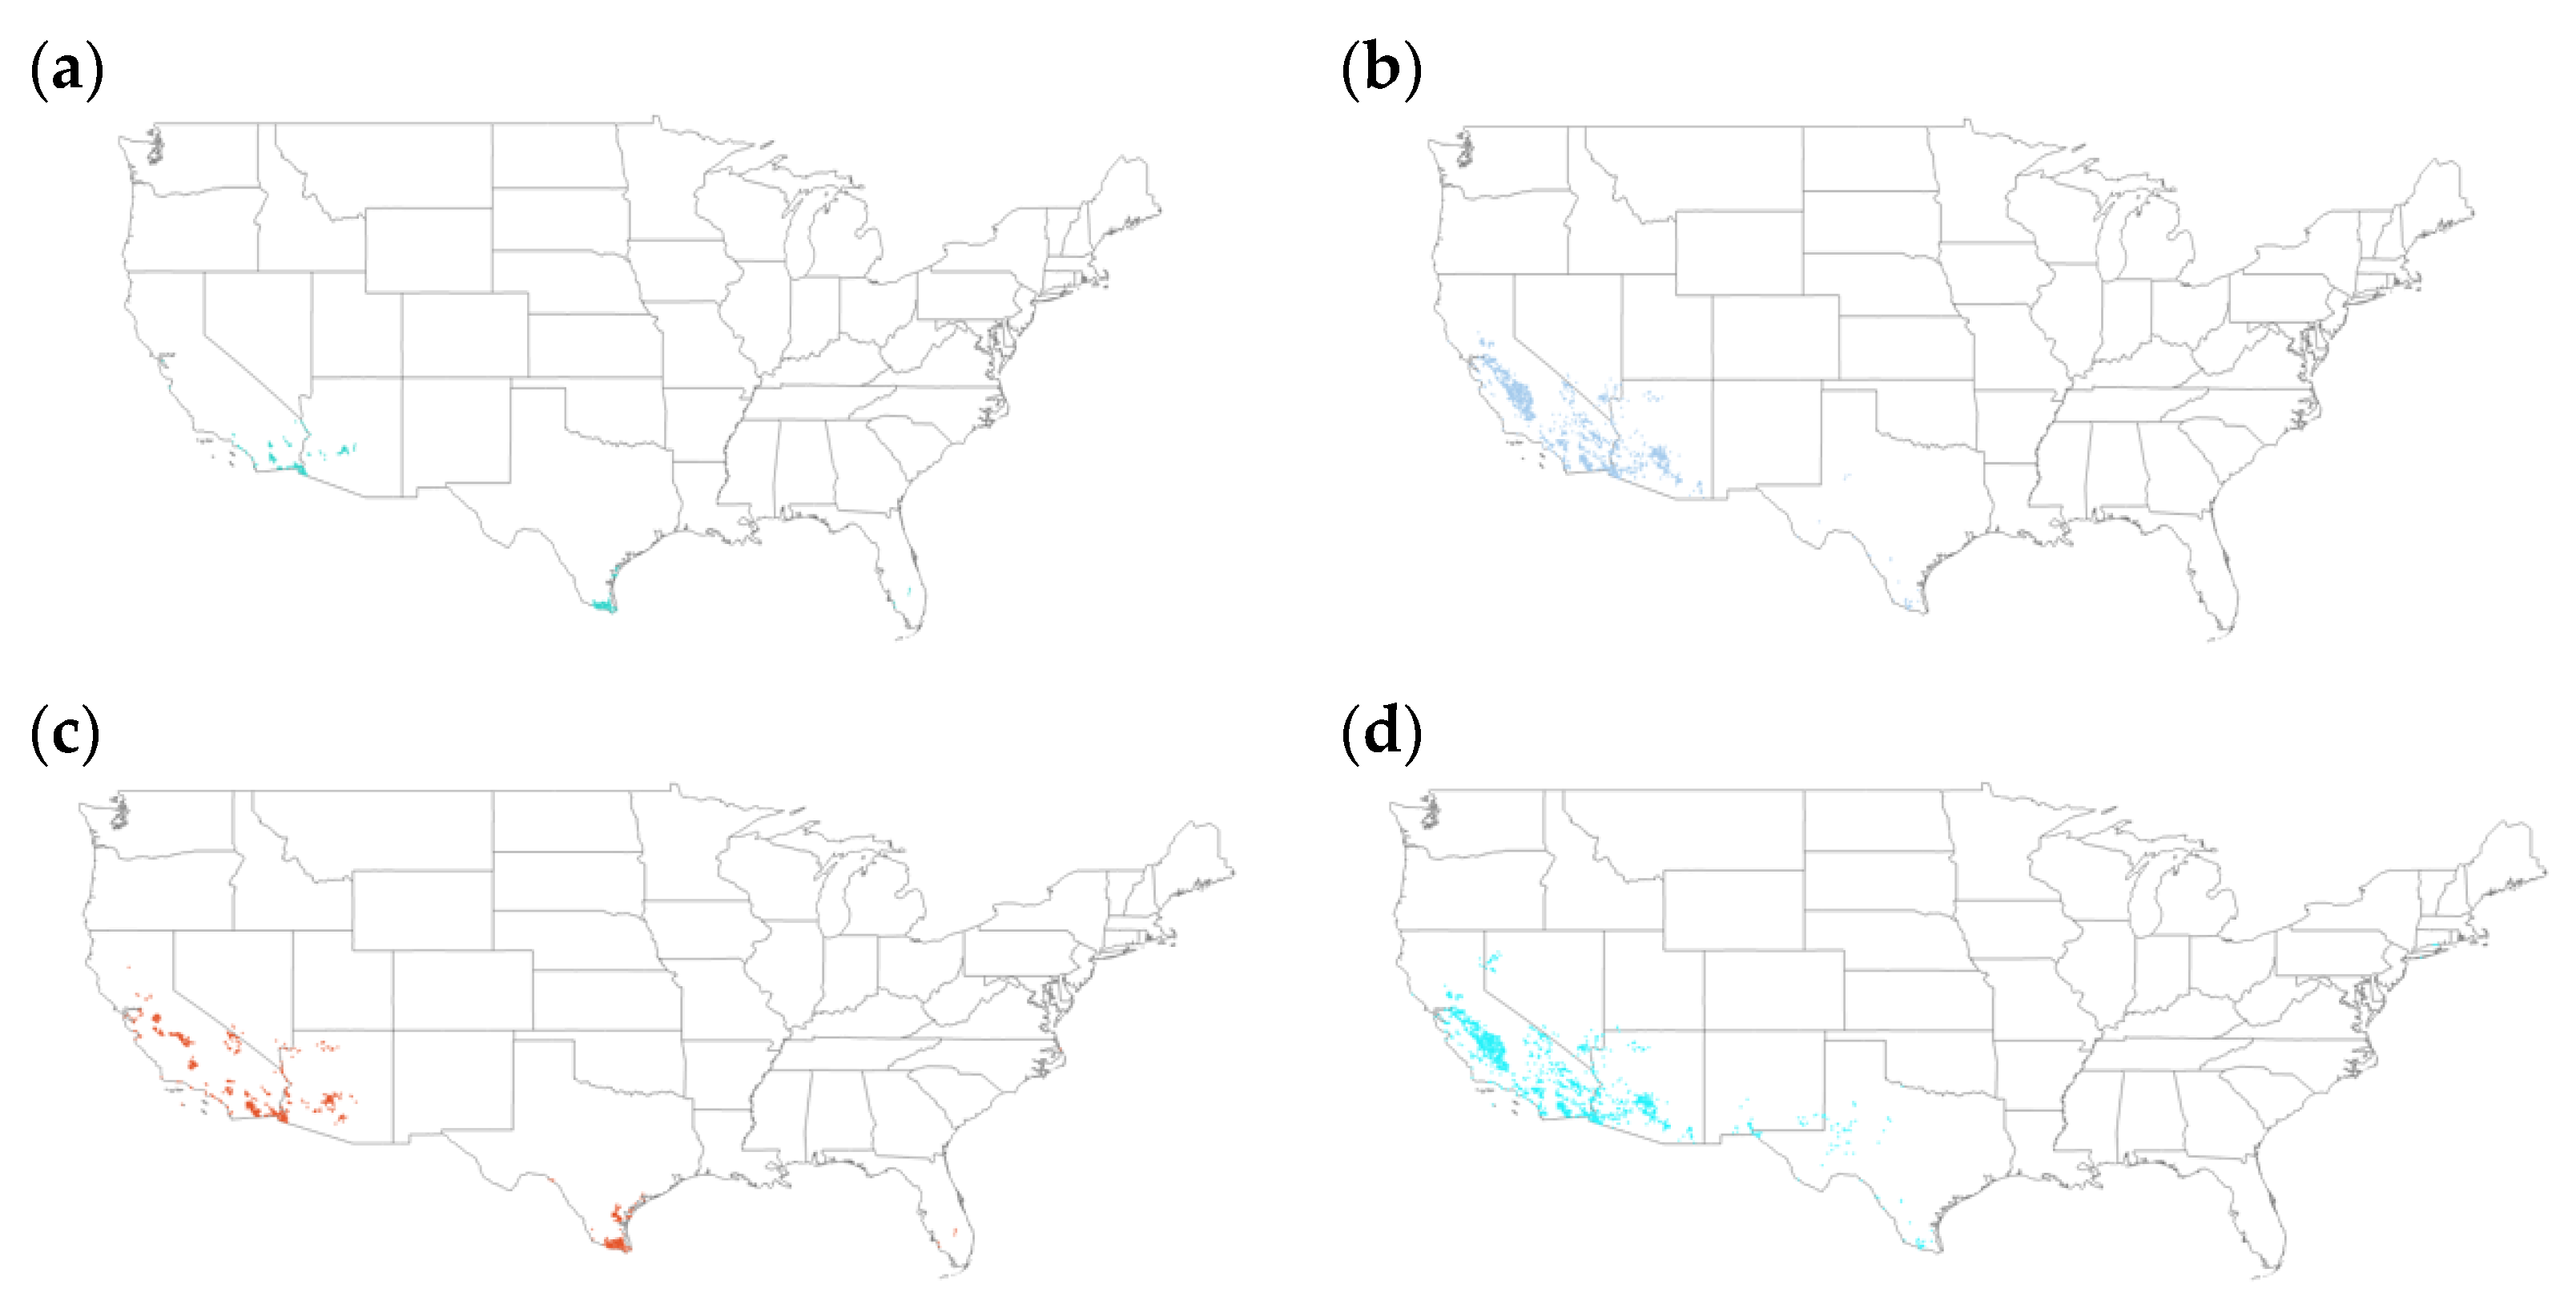
3.3. Precipitation and Temperature
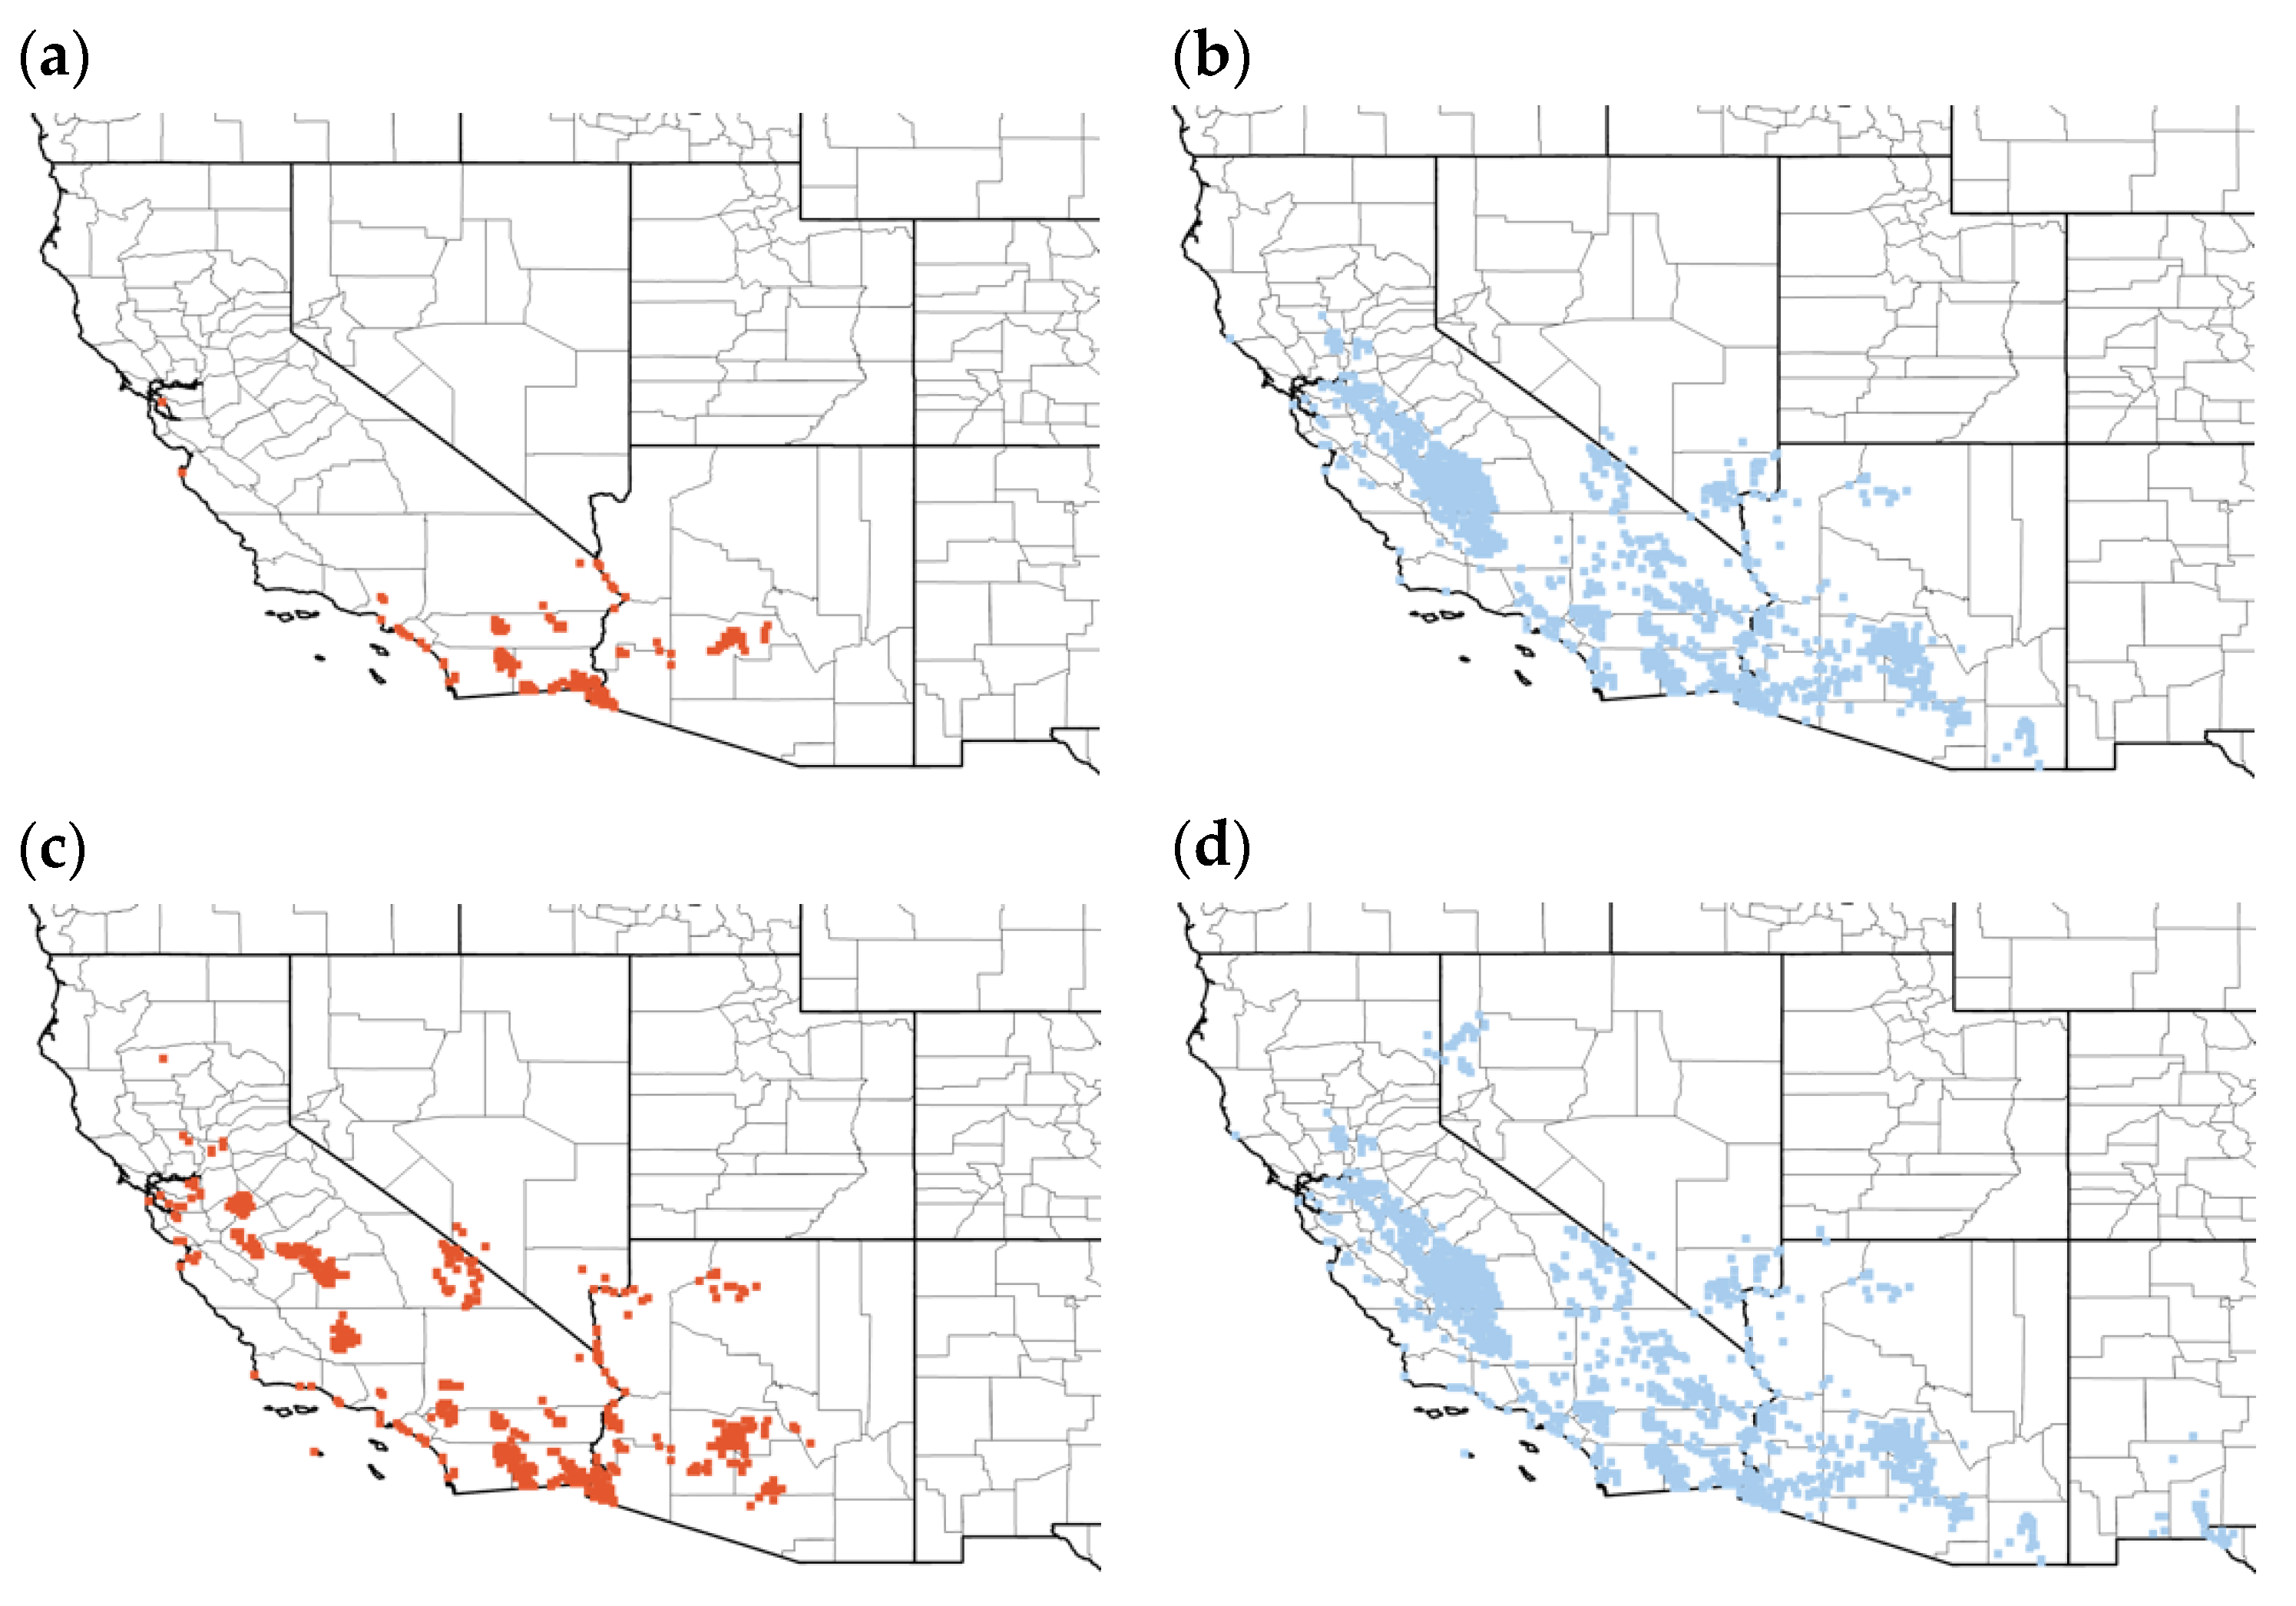
3.4. Precipitation, Temperature and Land Use/Land Cover
4. Discussion
5. Conclusions and Future Perspectives
Author Contributions
Funding
Data Availability Statement
Acknowledgments
Conflicts of Interest
References
- Ayerza, R.; Coates, W. Chia: Rediscovering a Forgotten Crop of the Aztecs; The Univrsity of Arizona Press: Tucson, AZ, USA, 2005. [Google Scholar]
- Martínez-Cruz, O.; Paredes-López, O. Phytochemical profile and nutraceutical potential of Chia seeds (Salvia hispanica L.) by ultra high performance liquid chromatography. J. Chromatogr. A 2014, 1346, 43–48. [Google Scholar] [CrossRef]
- Reyes-Caudillo, E.; Tecante, A.; Valdivia-Lopez, M.A. Dietary fibre content and antioxidant activity of phenolic compounds present in Mexican Chia (Salvia hispanica L.) seeds. Food Chem. 2008, 107, 656–663. [Google Scholar] [CrossRef]
- Sandoval-Oliveros, M.R.; Paredes-López, O. Isolation and characterization of proteins from Chia seeds (Salvia hispanica L.). J. Agric. Food Chem. 2013, 61, 193–201. [Google Scholar] [CrossRef] [PubMed]
- Basic Report: Seeds, Chia Seeds, Dried. Available online: https://fdc.nal.usda.gov/fdc-app.html#/food-details/170554/nutrients (accessed on 28 April 2022).
- Coates, W.; Ayerza, R. Commercial production of chia in Northwestern Argentina. J. Am. Oil Chem. Soc. 1998, 75, 1417–1420. [Google Scholar] [CrossRef]
- Katunzi-Kilewela, A.; Kaale, L.D.; Kibazohi, O.; Rweyemamu, L.M.P. Nutritional, health benefits and usage of chia seeds (Salvia hispanica): A review. Afr. J. Food Sci. 2021, 15, 48–59. [Google Scholar]
- Ramírez-Jaramillo, G.; Lozano-Contreras, M.G. Potential for growing Salvia hispanica L., areas under rainfed conditions in Mexico. Agric. Sci. 2015, 6, 1048–1057. [Google Scholar]
- Lopez, A.X.; Huerta, A.G.; Torrez, E.C.; Sangerman-Jarquín, D.M.; de Rosas, G.O.; Arriaga, M.R. Chia (Salvia hispanica L.) current situation and future trends. Rev. Mex. Cienc. Agríc. 2017, 8, 1619–1631. [Google Scholar]
- Cortés, D.; Silva, H.; Baginsky, C.; Morales, L. Climatic zoning of chia (Salvia hispanica L.) in Chile using a species distribution model. Span. J. Agric. Res. 2017, 15, e0302. [Google Scholar] [CrossRef] [Green Version]
- Peiretti, P.G.; Gai, F. Fatty acid and nutritive quality of chia (Salvia hispanica L.) seeds and plant during growth. Anim. Feed Sci. Technol. 2009, 148, 267–275. [Google Scholar] [CrossRef]
- Silva, H.; Garrido, M.; Baginsky, C.; Valenzuela, A.; Luis, M.; Valenzuela, C.; Pavez, S.; Alister, S. Effect of water availability on growth, water use efficiency and omega 3 (ALA) content in two phenotypes of chia (Salvia hispanica L.) established in the arid Mediterranean zone of Chile. Agric. Water Manag. 2016, 173, 67–75. [Google Scholar]
- Shahbandeh, M. Chia Seeds Import Value in 2020, by Leading Country. Available online: https://www.statista.com/statistics/1168799/leading-importers-of-chia-seed/ (accessed on 18 May 2022).
- Bochicchio, R.; Philips, T.D.; Lovelli, S.; Labella, R.; Galgano, F.; Di Marisco, A.; Perniola, M.; Amato, M. Innovative crop productions for healthy food: The case of chia (Salvia hispanica L.). In The Sustainability of Agro-Food and Natural Resource Systems in the Mediterranean Basin; Vastola, A., Ed.; Springer: Cham, Switzerland, 2015. [Google Scholar]
- Baginsky, C.; Arenas, J.; Escobar, H.; Garrido, M.; Valero, N.; Tello, D.; Pizarro, L.; Valenzuela, A.; Morales, L.; Silva, H. Growth and yield of chia (Salvia hispanica L.) in the Mediterranean and desert climates of Chile. Chil. J. Agric. Res. 2016, 76, 255–264. [Google Scholar] [CrossRef] [Green Version]
- Jamboonsri, W.; Phillips, T.D.; Geneve, R.L.; Cahill, J.P.; Hildebrand, D.F. Extending the range of an ancient crop, Salvia hispanica L.—A new x3 source. Genet. Resour. Crop Evol. 2012, 59, 171–178. [Google Scholar] [CrossRef]
- Yeboah, S.; Owusu Danquah, E.; Lamptey, J.N.L.; Mochiah, M.B.; Lamptey, S.; Oteng-Darko, P.; Adama, I.; Appiah-Kubi, Z.; Agyeman, K. Influence of planting methods and density on performance of chia (Salvia hispanica) and its suitability as an oilseed plant. Agric. Sci. 2014, 2, 14–26. [Google Scholar] [CrossRef] [Green Version]
- Cahill, J.P.; Ehdaie, B. Variation and heritability of seed mass in chia (Salvia hispanica L.). Genet. Resour. Crop Evol. 2005, 52, 201–207. [Google Scholar] [CrossRef]
- Peláez, P.; Orona-Tamayo, D.; Montes-Hernández, S.; Elena Valverde, M.; Paredes-López, O.; Cibrián-Jaramillo, A. Comparative transcriptome analysis of cultivated and wild seeds of Salvia hispanica (chia). Sci. Rep. 2019, 9, 9761. [Google Scholar] [CrossRef] [PubMed]
- Sorondo, A. Chia (Salvia hispanica L.) Variety Sahi Alba 914. US Patent 2014/0325694-A1, 30 April 2014. [Google Scholar]
- Gravé, G.; Mouloungui, Z.; Poujaud, F.; Cerny, M.; Pauthe, C.; Koumba, I.S.; Diakaridja, D.; Merah, O. Accumulation during fruit development of components of interest in seed of Chia (Salvia hispanica L.) cultivar Oruro© released in France. OCL 2019, 26, 50–56. [Google Scholar] [CrossRef] [Green Version]
- Cahill, J.P.; Atamian, H.S. Ventura Botanical Garden, Ventura, CA, USA.; Chapman University, Orange, CA, USA. 2021; in preparation. [Google Scholar]
- Cahill, J.P. Genetic diversity among varieties of chia (Salvia hispanica L.). Genet. Resour. Crop Evol. 2004, 51, 773–781. [Google Scholar]
- Midwestern Regional Climate Center. Available online: https://mrcc.purdue.edu/VIP/frz_maps/freeze_maps.html (accessed on 14 February 2022).
- Funk, C.; Peterson, P.; Landsfeld, M.; Pedreros, D.; Verdin, J.; Shukla, S.; Husak, G.; Rowland, J.; Harrison, L.; Hoell, A.; et al. The climate hazards infrared precipitation with stations—a new environmental record for monitoring extremes. Sci. Data 2015, 2, 150066. [Google Scholar] [CrossRef] [Green Version]
- USDA. National Agricultural Statistics Service Cropland Data Layer. Available online: https://nassgeodata.gmu.edu/CropScape/ (accessed on 1 March 2022).
- Bigelow, D. A Primer on Land Use in the United States. Available online: https://www.ers.usda.gov/amber-waves/2017/december/a-primer-on-land-use-in-the-united-states/ (accessed on 1 March 2022).
- ArcGIS Pro (Version 2.5). Available online: https://www.esri.com/en-us/arcgis/products/arcgis-pro/overview (accessed on 8 November 2021).
- Mozaffarian, D.; Ascherio, A.; Hu, F.B.; Stampfer, M.J.; Willett, W.C.; Siscovick, D.S.; Rimm, E.B. Interplay between different polyunsaturated fatty acids and risk of coronary heart disease in men. Circulation 2005, 111, 157–164. [Google Scholar] [CrossRef] [Green Version]
- Mozaffarian, D.; Wu, J.H.Y. Omega-3 fatty acids and cardiovascular disease: Effects on risk factors, molecular pathways, and clinical events. J. Am. Coll. Cardiol. 2011, 58, 2047–2067. [Google Scholar] [CrossRef] [Green Version]
- MacDonald, J.M.; Korb, P.; Hoppe, R.A. Farm Size and the Organization of U.S. Crop Farming. U.S. Department of Agriculture, Economic Research Service, Economic Research Report. 2013, 152. Available online: https://www.ers.usda.gov/webdocs/publications/45108/39359_err152.pdf (accessed on 23 May 2022).
- Wang, T.; Jin, H.; Fan, Y.; Obembe, O.; Li, D. Farmers’ adoption and perceived benefits of diversified crop rotations in the margins of U.S. Corn Belt. J. Environ. Manag. 2021, 293, 112903. [Google Scholar] [CrossRef] [PubMed]
- Ding, Y.; Shi, Y.; Yang, S. Advances and challenges in uncovering cold tolerance regulatory mechanisms in plants. New Phytol. 2019, 222, 1690–1704. [Google Scholar] [CrossRef] [PubMed] [Green Version]


| Type of Data | Source | Resolution | Time Scale |
|---|---|---|---|
| Precipitation | CHIRPS | 0.05° | 2000–2020 |
| Temperature | MRCC | 0.05° | 1990–2020 |
| Land Use/Land Cover | USDA | 30 m | 1997–2021 |
| December (km2) | November (km2) | November/December | |
|---|---|---|---|
| Temperature Only | |||
| 28 °F (10th percentile) | 393,048 | 2,074,239 | 5.3 |
| 32 °F (10th percentile) | 148,407 | 1,161,492 | 7.8 |
| Precipitation Only | |||
| 10 mm (10th percentile) | 2,998,632 | 1,739,201 | 0.6 |
| 25 mm (10th percentile) | 5,507,917 | 3,719,419 | 0.7 |
| Temperature and Precipitation | |||
| 10 mm and 28 °F (10th percentile) | 60,242 | 127,231 | 2.1 |
| 25 mm and 28 °F (10th percentile) | 126,948 | 386,552 | 3.0 |
| 10 mm and 32 °F (10th percentile) | 18,823 | 101,615 | 5.4 |
| 25 mm and 32 °F (10th percentile) | 35,193 | 289,655 | 8.2 |
| Temperature and Precipitation and Land Use | |||
| 25 mm and 28 °F (10th percentile) | 29,484 | 62,224 | 2.1 |
| 25 mm and 32 °F (10th percentile) | 10,379 | 54,393 | 5.2 |
Publisher’s Note: MDPI stays neutral with regard to jurisdictional claims in published maps and institutional affiliations. |
© 2022 by the authors. Licensee MDPI, Basel, Switzerland. This article is an open access article distributed under the terms and conditions of the Creative Commons Attribution (CC BY) license (https://creativecommons.org/licenses/by/4.0/).
Share and Cite
Hassani, M.; Piechota, T.; Atamian, H.S. Prediction of Cultivation Areas for the Commercial and an Early Flowering Wild Accession of Salvia hispanica L. in the United States. Agronomy 2022, 12, 1651. https://doi.org/10.3390/agronomy12071651
Hassani M, Piechota T, Atamian HS. Prediction of Cultivation Areas for the Commercial and an Early Flowering Wild Accession of Salvia hispanica L. in the United States. Agronomy. 2022; 12(7):1651. https://doi.org/10.3390/agronomy12071651
Chicago/Turabian StyleHassani, Mohammad, Thomas Piechota, and Hagop S. Atamian. 2022. "Prediction of Cultivation Areas for the Commercial and an Early Flowering Wild Accession of Salvia hispanica L. in the United States" Agronomy 12, no. 7: 1651. https://doi.org/10.3390/agronomy12071651