Article

Comparative Study into Microstructural and Mechanical Characterization of HVOF-WC-Based Coatings

by
Magdy M. El Rayes
1,*,
El-Sayed M. Sherif
2,3 and
Hany S. Abdo
2,4
1
Department of Mechanical Engineering, College of Engineering, King Saud University, Riyadh 11421, Saudi Arabia
2
Center of Excellence for Research in Engineering Materials (CEREM), King Saud University, Riyadh 11421, Saudi Arabia
3
Electrochemistry and Corrosion Laboratory, Department of Physical Chemistry, National Research Centre, El-Behoth St. 33, Dokki, Cairo 12622, Egypt
4
Mechanical Design and Materials Department, Faculty of Energy Engineering, Aswan University, Aswan 81521, Egypt
*
Author to whom correspondence should be addressed.
Crystals 2022, 12(7), 969; https://doi.org/10.3390/cryst12070969
Submission received: 19 June 2022 / Revised: 5 July 2022 / Accepted: 7 July 2022 / Published: 11 July 2022
(This article belongs to the Section Crystalline Metals and Alloys)

Abstract

:
The main objective of this work was to characterize and compare the microstructural and mechanical properties as well as erosion resistance of WC-12Co and WC-10Co-4Cr coatings. The High Velocity Oxy Fuel (HVOF) process was applied to carbon manganese steel API 2H typically used in oil and gas industries. Microstructural characterization of feedstock powder and coatings was conducted using scanning electron microscope (SEM), energy dispersive X-ray spectroscopic (EDS) analysis, X-ray diffraction (XRD) for phase determination, powder particle size distribution, and surface roughness measurement. The average particle size of the former powder was 13.7 µm whereas it was 28.1 µm for the latter. The results showed that the smaller particle size tends to melt easier than the larger one, as deduced from SEM images and surface roughness measurements. EDS and XRD results of both coatings indicated the occurrence of WC decomposition where the powder particle size plays a significant role in these results. Mechanical characterization was discussed through comparing hardness, erosion, and adhesion test results of both coatings. WC-10Co-4Cr coating exhibited higher hardness than WC-12Co as well as higher erosion resistance, due to the extent of decomposition of WC and also to carbide particle size within the coating layer; these are the same reasons for the superior adhesion strength of the former coating compared to the latter one as per ASTM Standard “C633- 13”.

1. Introduction

Offshore oil and gas production systems are permanently exposed to environments that share the same aggressive conditions in terms of erosion and corrosion. These systems include piping, pumps, valves, drilling and well service structures, and platform tubular joints all of which are exposed to sand-laden moving fluids such as seawater. Coatings are applied to surfaces in order to improve the surface characteristics over those of the bulk properties [1], thus minimizing failures leading to loss of production due to shutdowns and consequently economic losses because of the inflating maintenance costs. High Velocity Oxy-Fuel (HVOF) thermal spray coating process appeared in numerous researches that studied erosion and corrosion resistances as well as mechanical strength of coated layers. Cermet coating materials specially WC-Co and CrC-NiCr systems are usually applied in services involving high erosion and corrosion conditions, however, WC-Co is the most successful metallurgical product due to its superior properties compared to the CrC-NiCr system [2,3]. Richert et al. [4] compared several W and Cr carbides as well as composite NiCrSiB coatings where they reported that the hardness of the W coatings was higher than those of the chromium ones. Furthermore, results showed that WC-Co-Cr is harder than WC-Co coating due to the presence of Cr7C3, Cr23C6 carbides formed through the decarburization of carbides [4]. Schwetzke and Kreye [5] characterized WC-12Co and WC-10Co-4Cr coatings with different types of HVOF where they reported that the former coating type is softer and less wear-resistant than the latter one. This was related to the oxidation of WC followed by decarburization thus leading to the formation of W2C and W within the coating, whereas the reaction of WC with the Co or Co-Cr matrix leads to the solution of W and carbide in the matrix, hence to the formation of mixed carbides (η-phase). Furthermore, Wang et al. [6] compared the same types of coatings for which results showed that the formation of Cr7C3 and Cr23C6 carbide phases, as well as η-phase, promoted the hardness of WC-10Co-4Cr hardness compared to WC-12Co. From the aforementioned literature, it is noticed that there is a limited number of publications that focus on the comparison between tungsten carbide cermet coatings with different compositions, hence the objective of the present work is to characterize and compare two types of commercial powders from the microstructural and mechanical point of view. In this work, the selected powders, namely, WC-12Co and WC-10Co-4Cr, are extensively used in offshore applications that are deposited in multi-layer coats on API 2H-steel substrate using high velocity oxygen fuel (HVOF) thermal spraying.

2. Materials and Methods

2.1. Spray Powders

Two types of commercial tungsten carbide-based powders were selected; namely, WC-12Co and WC-10Co-4Cr, which are usually applied in the HVOF coating process with trade name Metco AE7923 and Amdry 5843, Sulzer Metco, Westbury, NY, USA respectively.

2.2. Substrate and Preparation

The selected substrate in this work was carbon-manganese steel type API 2H Grade 50 steel, usually used in tubular joints in offshore structures. The steel sheets were cut into strips of 500 mm-long × 300 mm-wide × 6 mm-thick. The chemical composition and mechanical properties of this steel are presented in Table 1.
In order to improve the adhesion of the coating powder [7,8], the steel strips were grit-blasted at a distance of about 100 mm, blasting angle of 90°, and at a pressure of 0.3 MPa for 5 min using 30 mesh size aluminum oxide (Al2O3) powder. The grit-blasted strips were further cut into smaller rectangular samples [L:100 × W:50 × T:6 mm] for easier manipulation during cleaning and coating processes. These samples were then thoroughly rinsed in acetone for 3 min. resulting in the surface shown in Figure 1. The surface roughness of these strips was measured 5 times using a Tesa-Rougossurf-90G (Tesa-Bugnon-Renens, Switzerland) roughness tester which gave an average surface roughness of Ra = 51.46 ± 0.7 µm.

2.3. Coating Procedure and Equipment
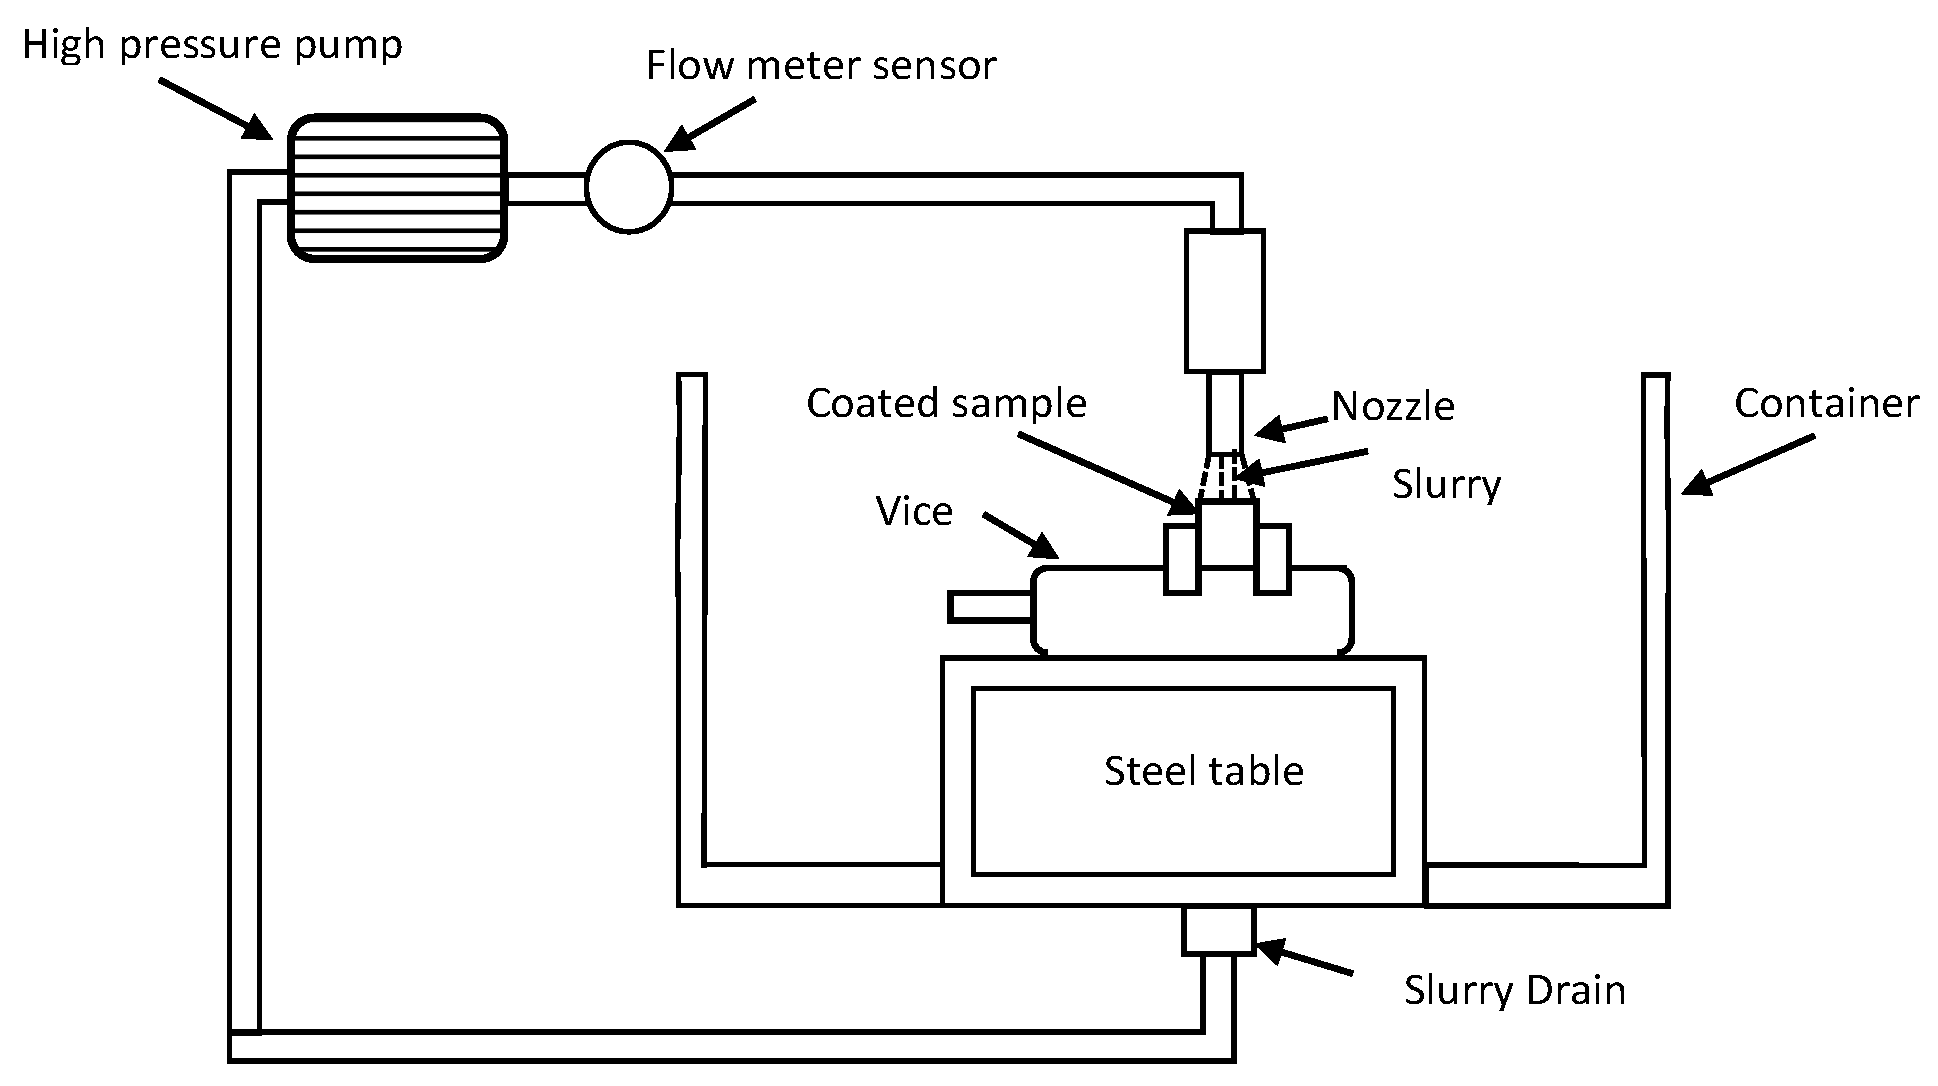
The coating process was conducted in M/S Metallizing Equipment Co. Pvt. Ltd., Jodhpur, India [9], by using a commercial HVOF thermal spray system MEC HIPOJET-2700 M including spray gun as well as a control console; MP-2100 attached to it three pressure gauges for oxygen, fuel gas (LPG) and air. A powder feeder; PF-700 as well as an LPG vaporizer are attached to the system. The vaporizer is used to convert the liquefied fuel into the vaporized state to obtain the combustion required. All of the process parameters, presented in Table 2, were maintained constant throughout the coating runs. After multi-layer spraying, the coated samples were left to cool in still air.
The coated samples were further cut using a diamond saw cutter under cooling in order to produce precise samples for erosion, hardness, microstructural, and adhesion tests. These samples were further ground and polished at their thickness side according to the standard microstructure sample preparation procedures.

2.4. Erosion Test

Slurry jet erosion tests were conducted using the test rig shown schematically in Figure 2. The test variables were as follows: 100 g erosive silica (SiO2) sand particles (36 mesh size) per every liter of water at a discharge of 4.5 m3/h (≈75 L/min) at room temperature of 20 ± 3 °C and impinging angle of 90° all of which were maintained constant within the experiments. The tests were carried out at four different time durations; 0.5, 1, 2, and 3 h.
The nominal impact velocity of slurry was 11.6 m/s and the nozzle-specimen distance of 20 mm was maintained constant through the entire test. To eliminate the slurry deterioration and to maintain a similar erosive effect fresh slurry was prepared for each batch tested. Eroded samples were rinsed thoroughly with water then dried followed by ultrasonic rinsing in acetone for cleaning then dried. The total material loss for each sample was determined by weight loss measurements by weighing the samples before and after testing 5 times using a balance with a sensitivity of 0.0001 g.

3. Results and Discussion

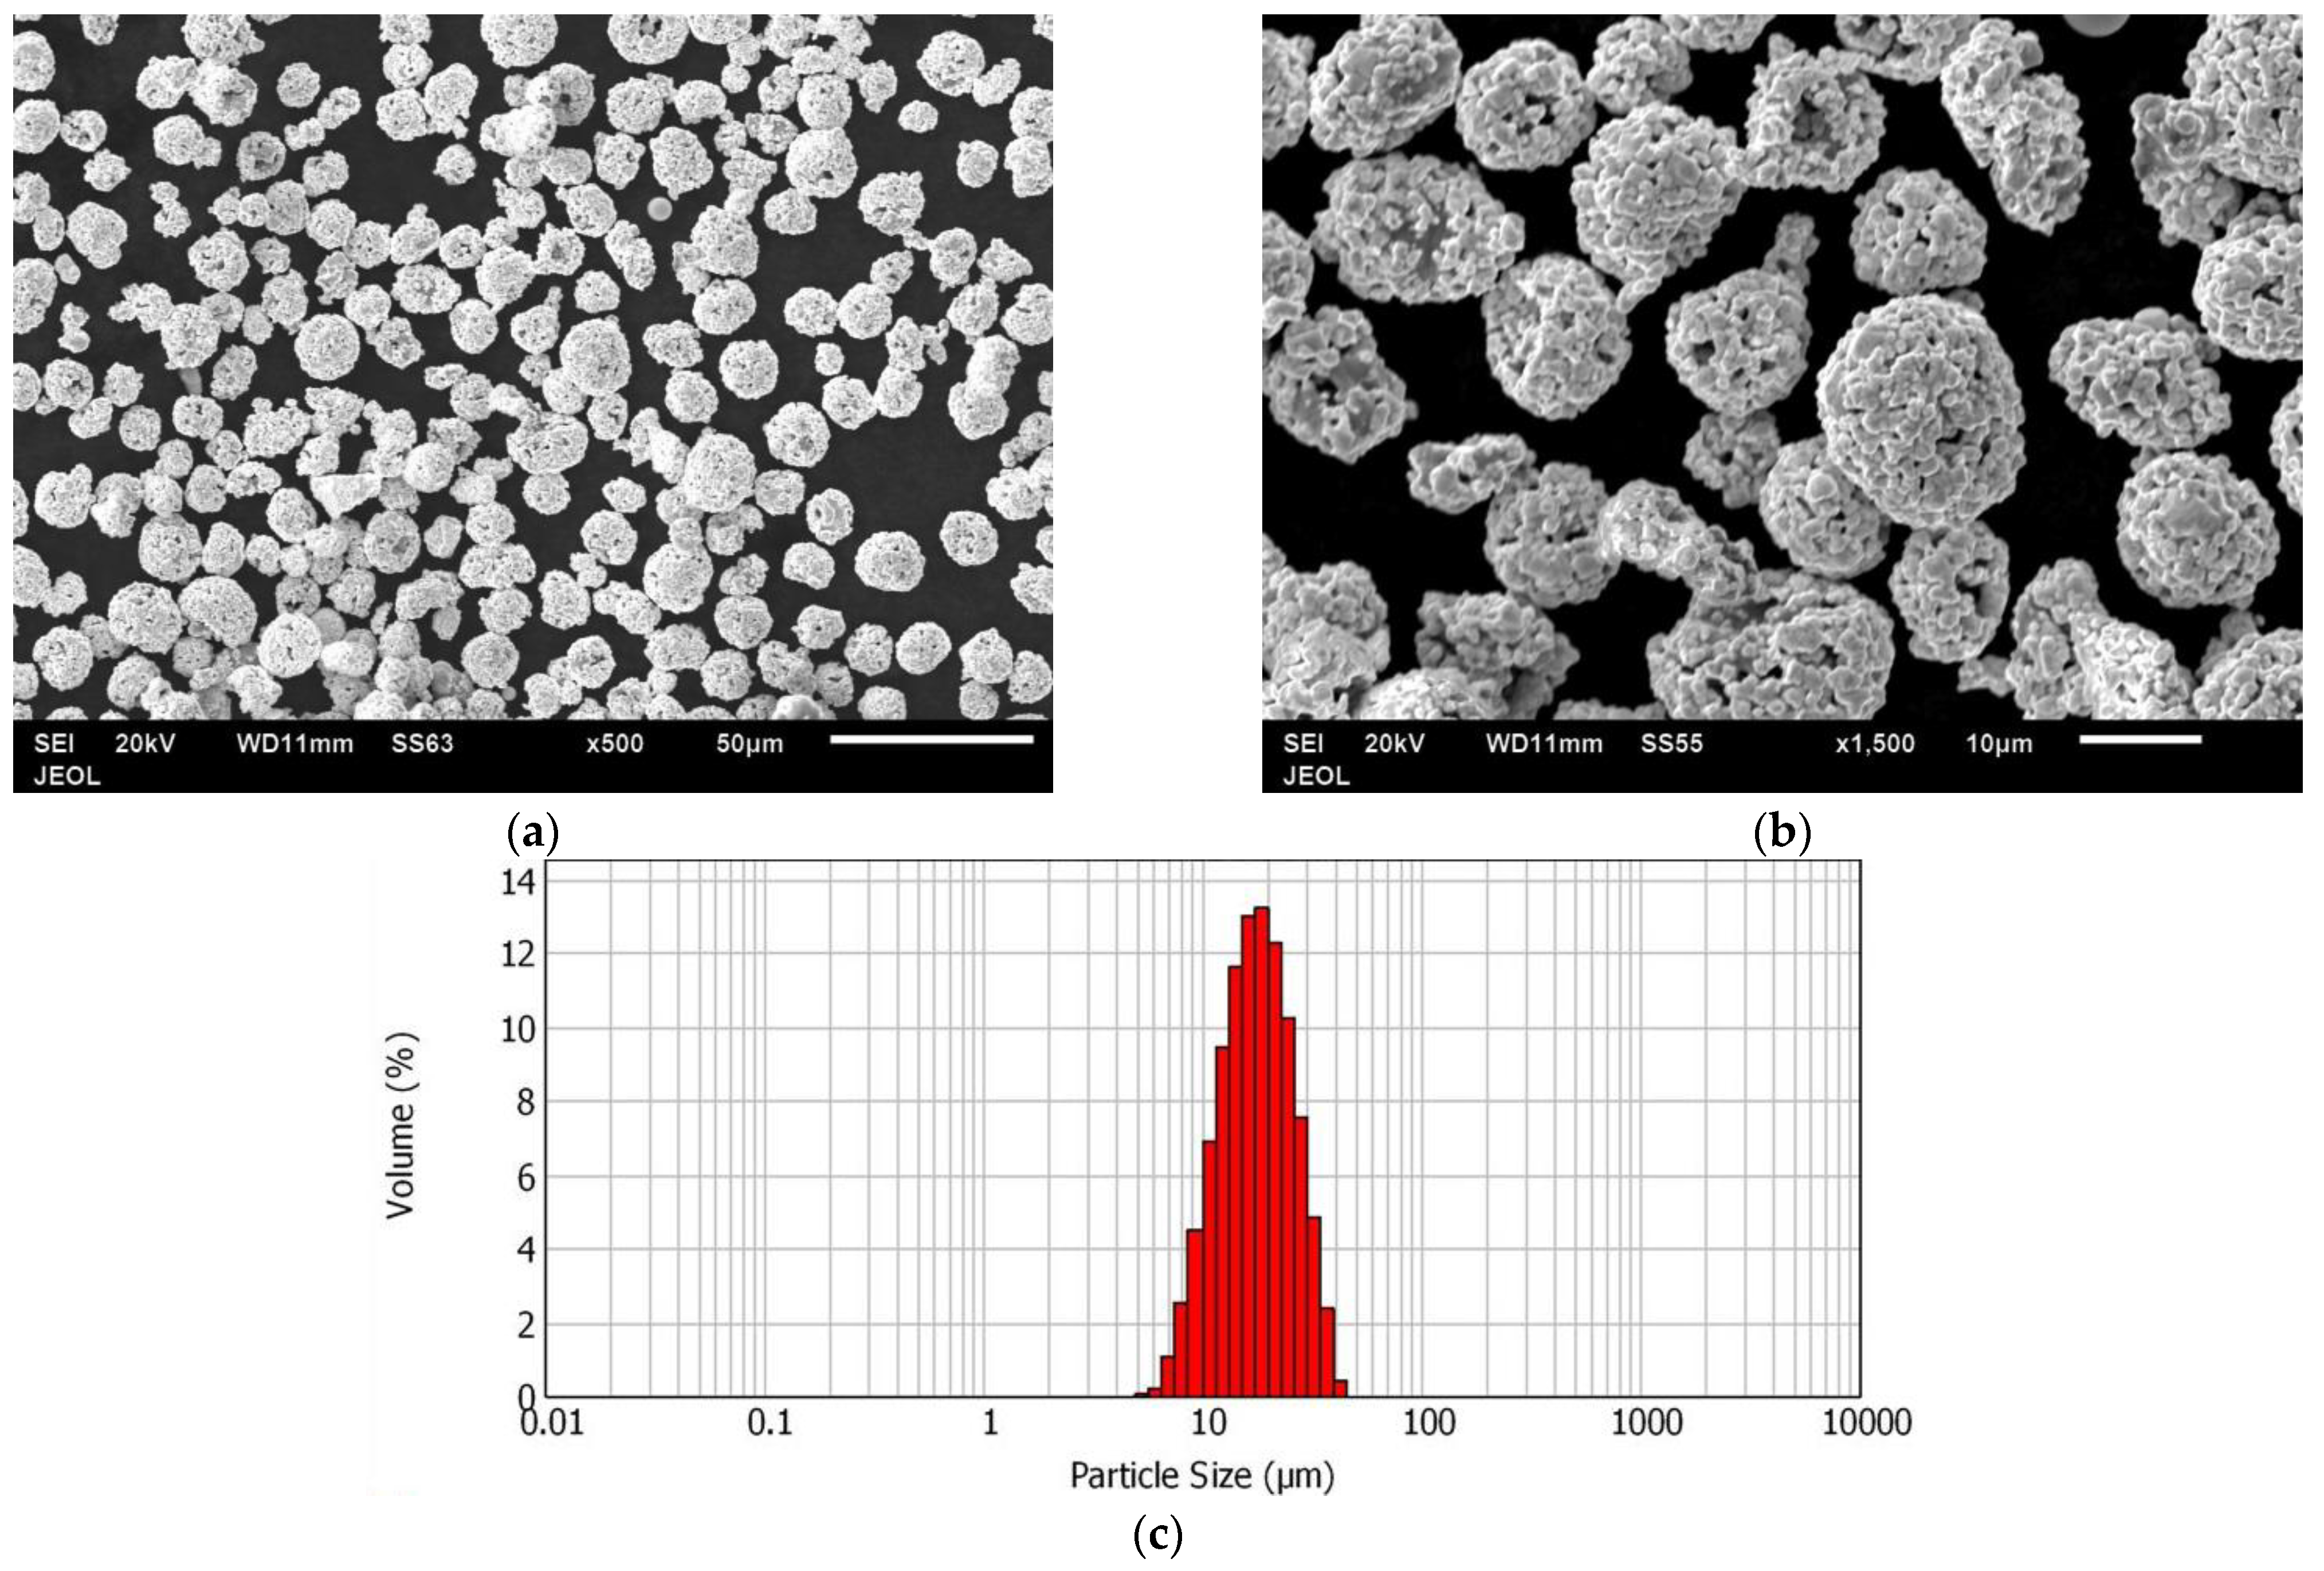
3.1. Powders Characterization

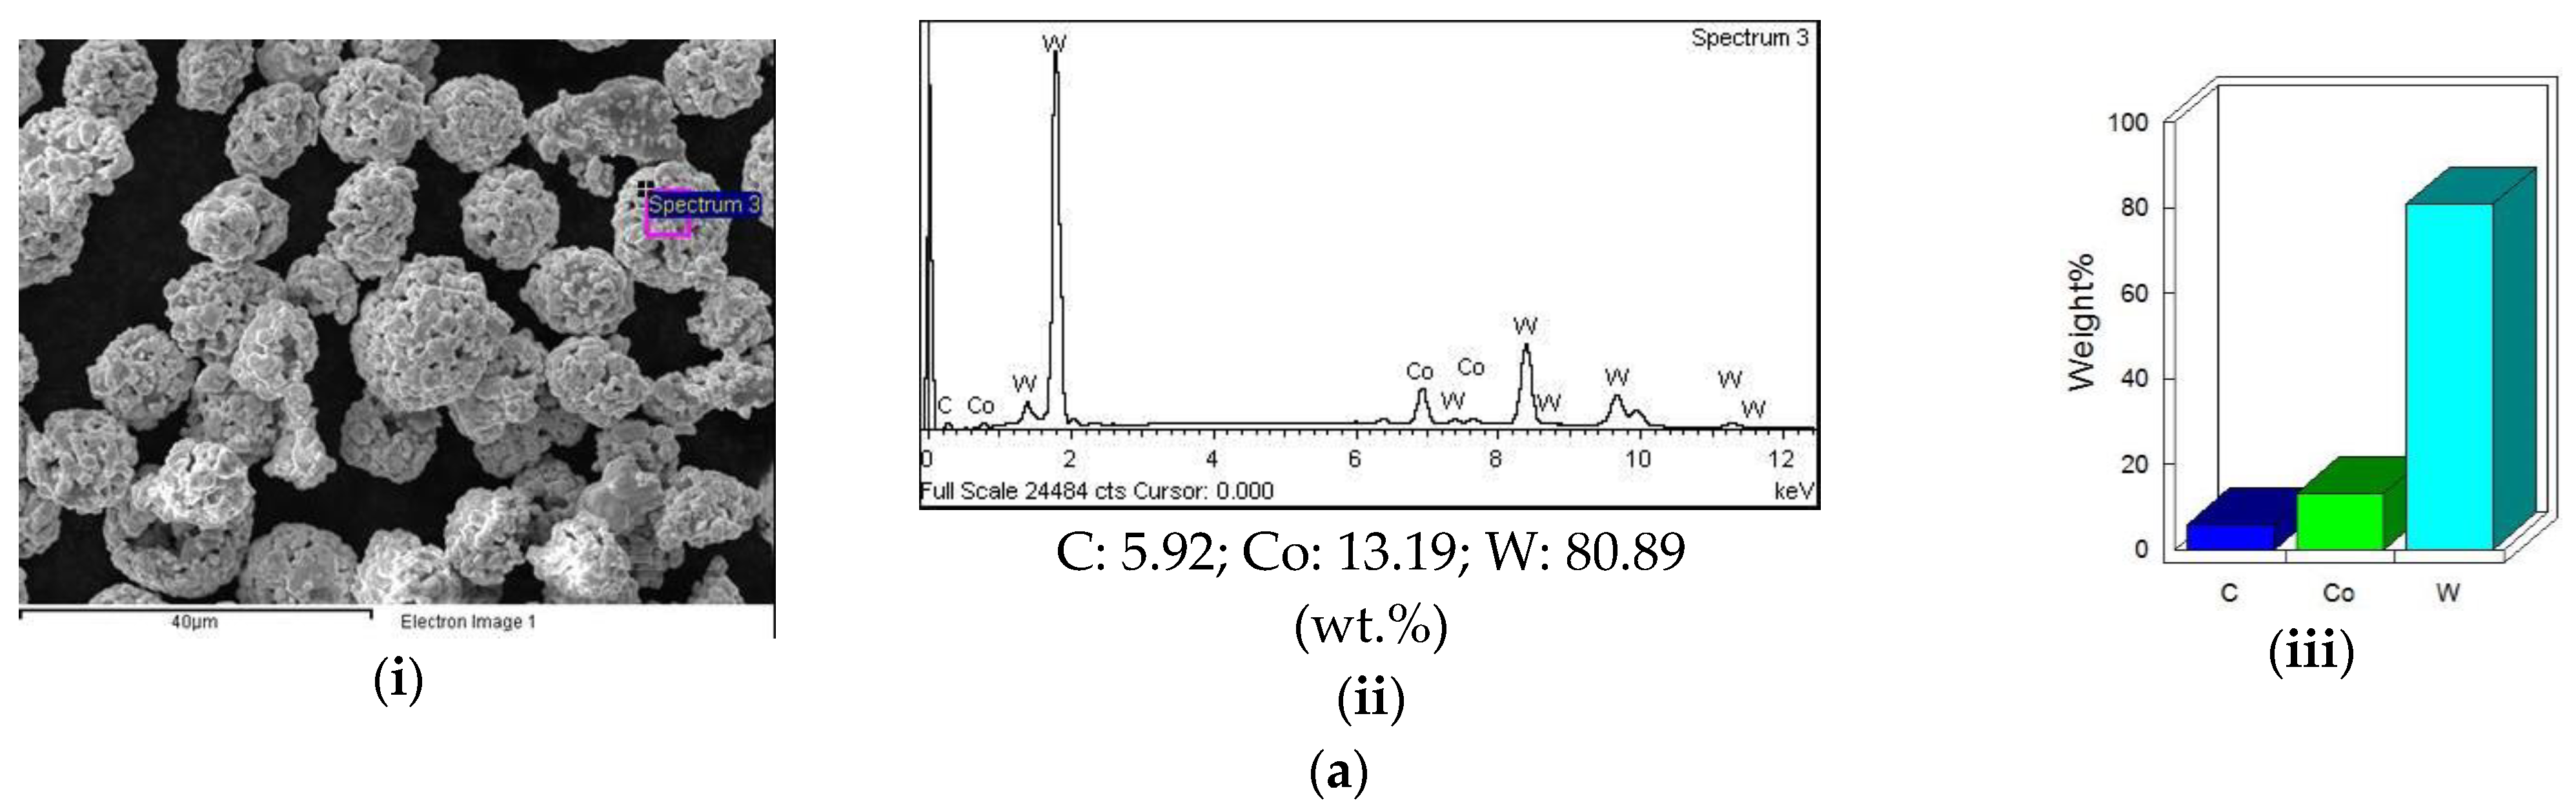
3.1.1. WC-12Co Powder

Figure 3a,b show SEM images at two magnifications of agglomerated and sintered WC-12Co particles which were seen to be porous [5,10], and had a spherical morphology with an aspect ratio (dmin/dmax) 0.79. The particle size was measured using (Malvern-Scirosse-Mastersizer 2000) and gave an average size of 13.7 ± 6 µm as seen in Figure 3c. Such type and morphology of this powder are typically found elsewhere [10,11].

3.1.2. WC-10Co-4Cr Powder

On the other hand, Figure 4a,b shows SEM images at two magnifications of agglomerated and sintered WC-10Co-4Cr powder having also spherical morphology with an aspect ratio of 0.87 and were noted to be slightly porous, which are identical features found in earlier work using the same type of powder [12]. This powder had an average size of 28.1 ± 8 µm, as seen in Figure 4c.

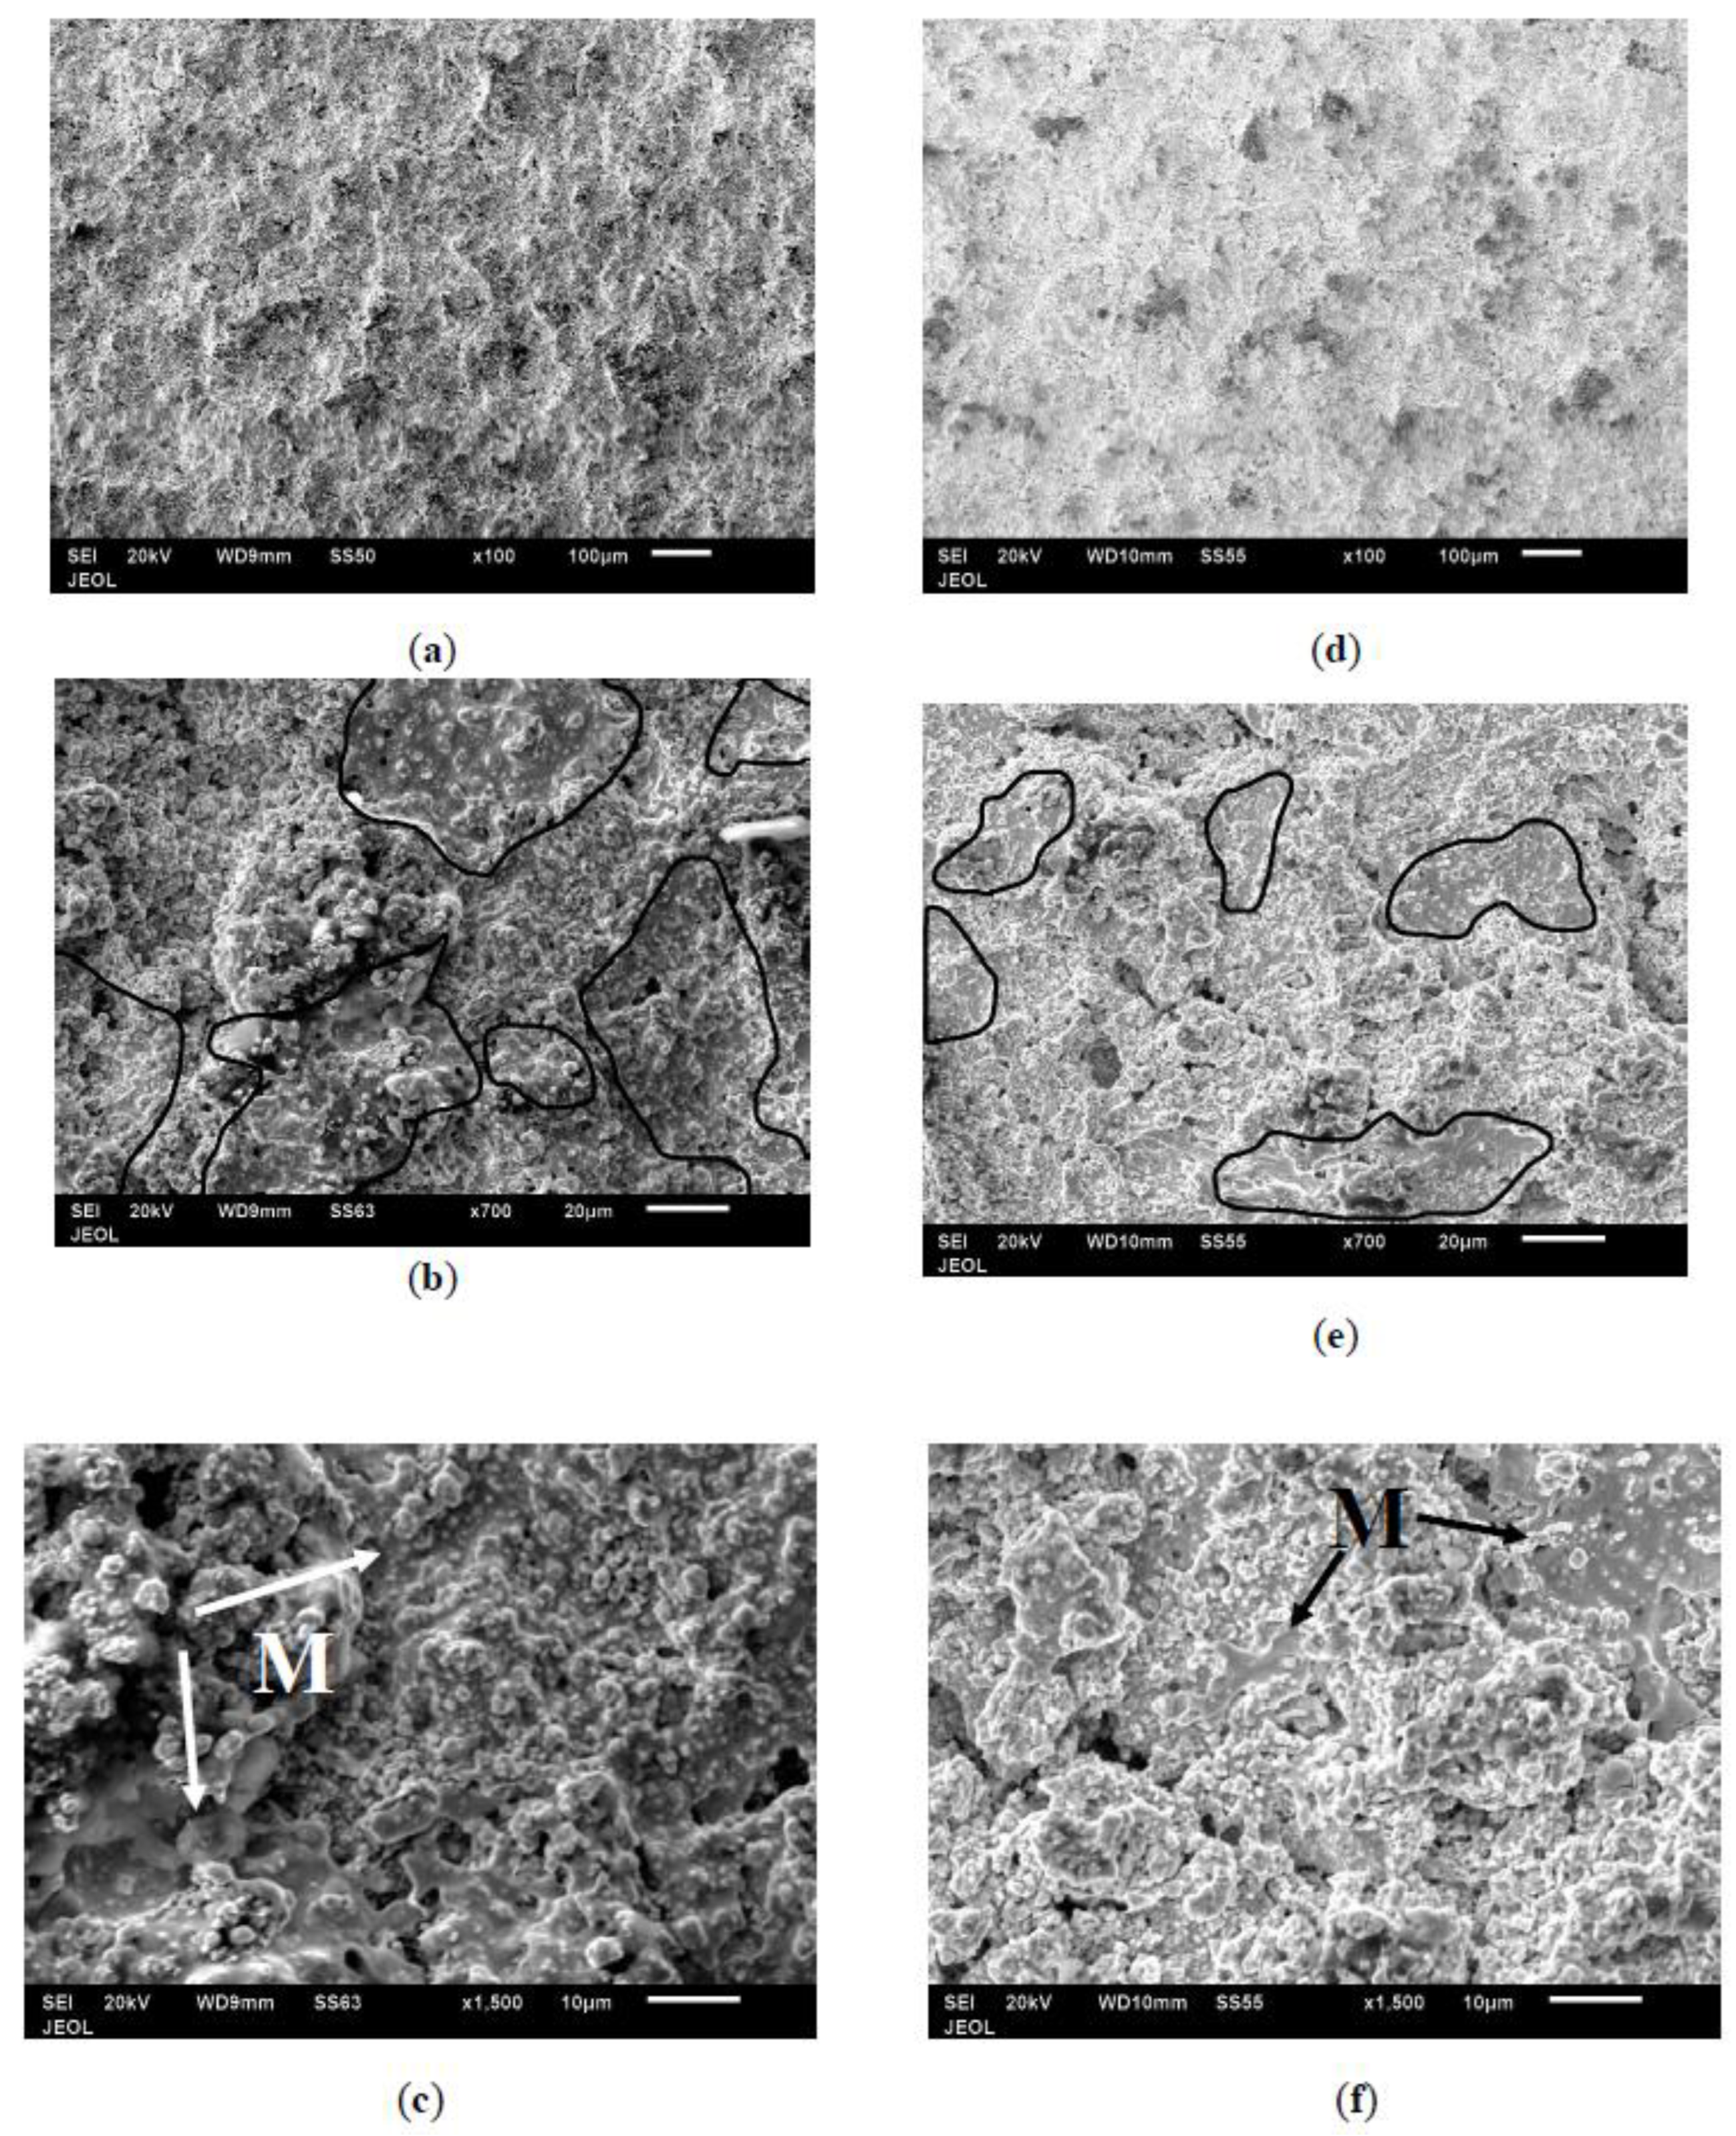
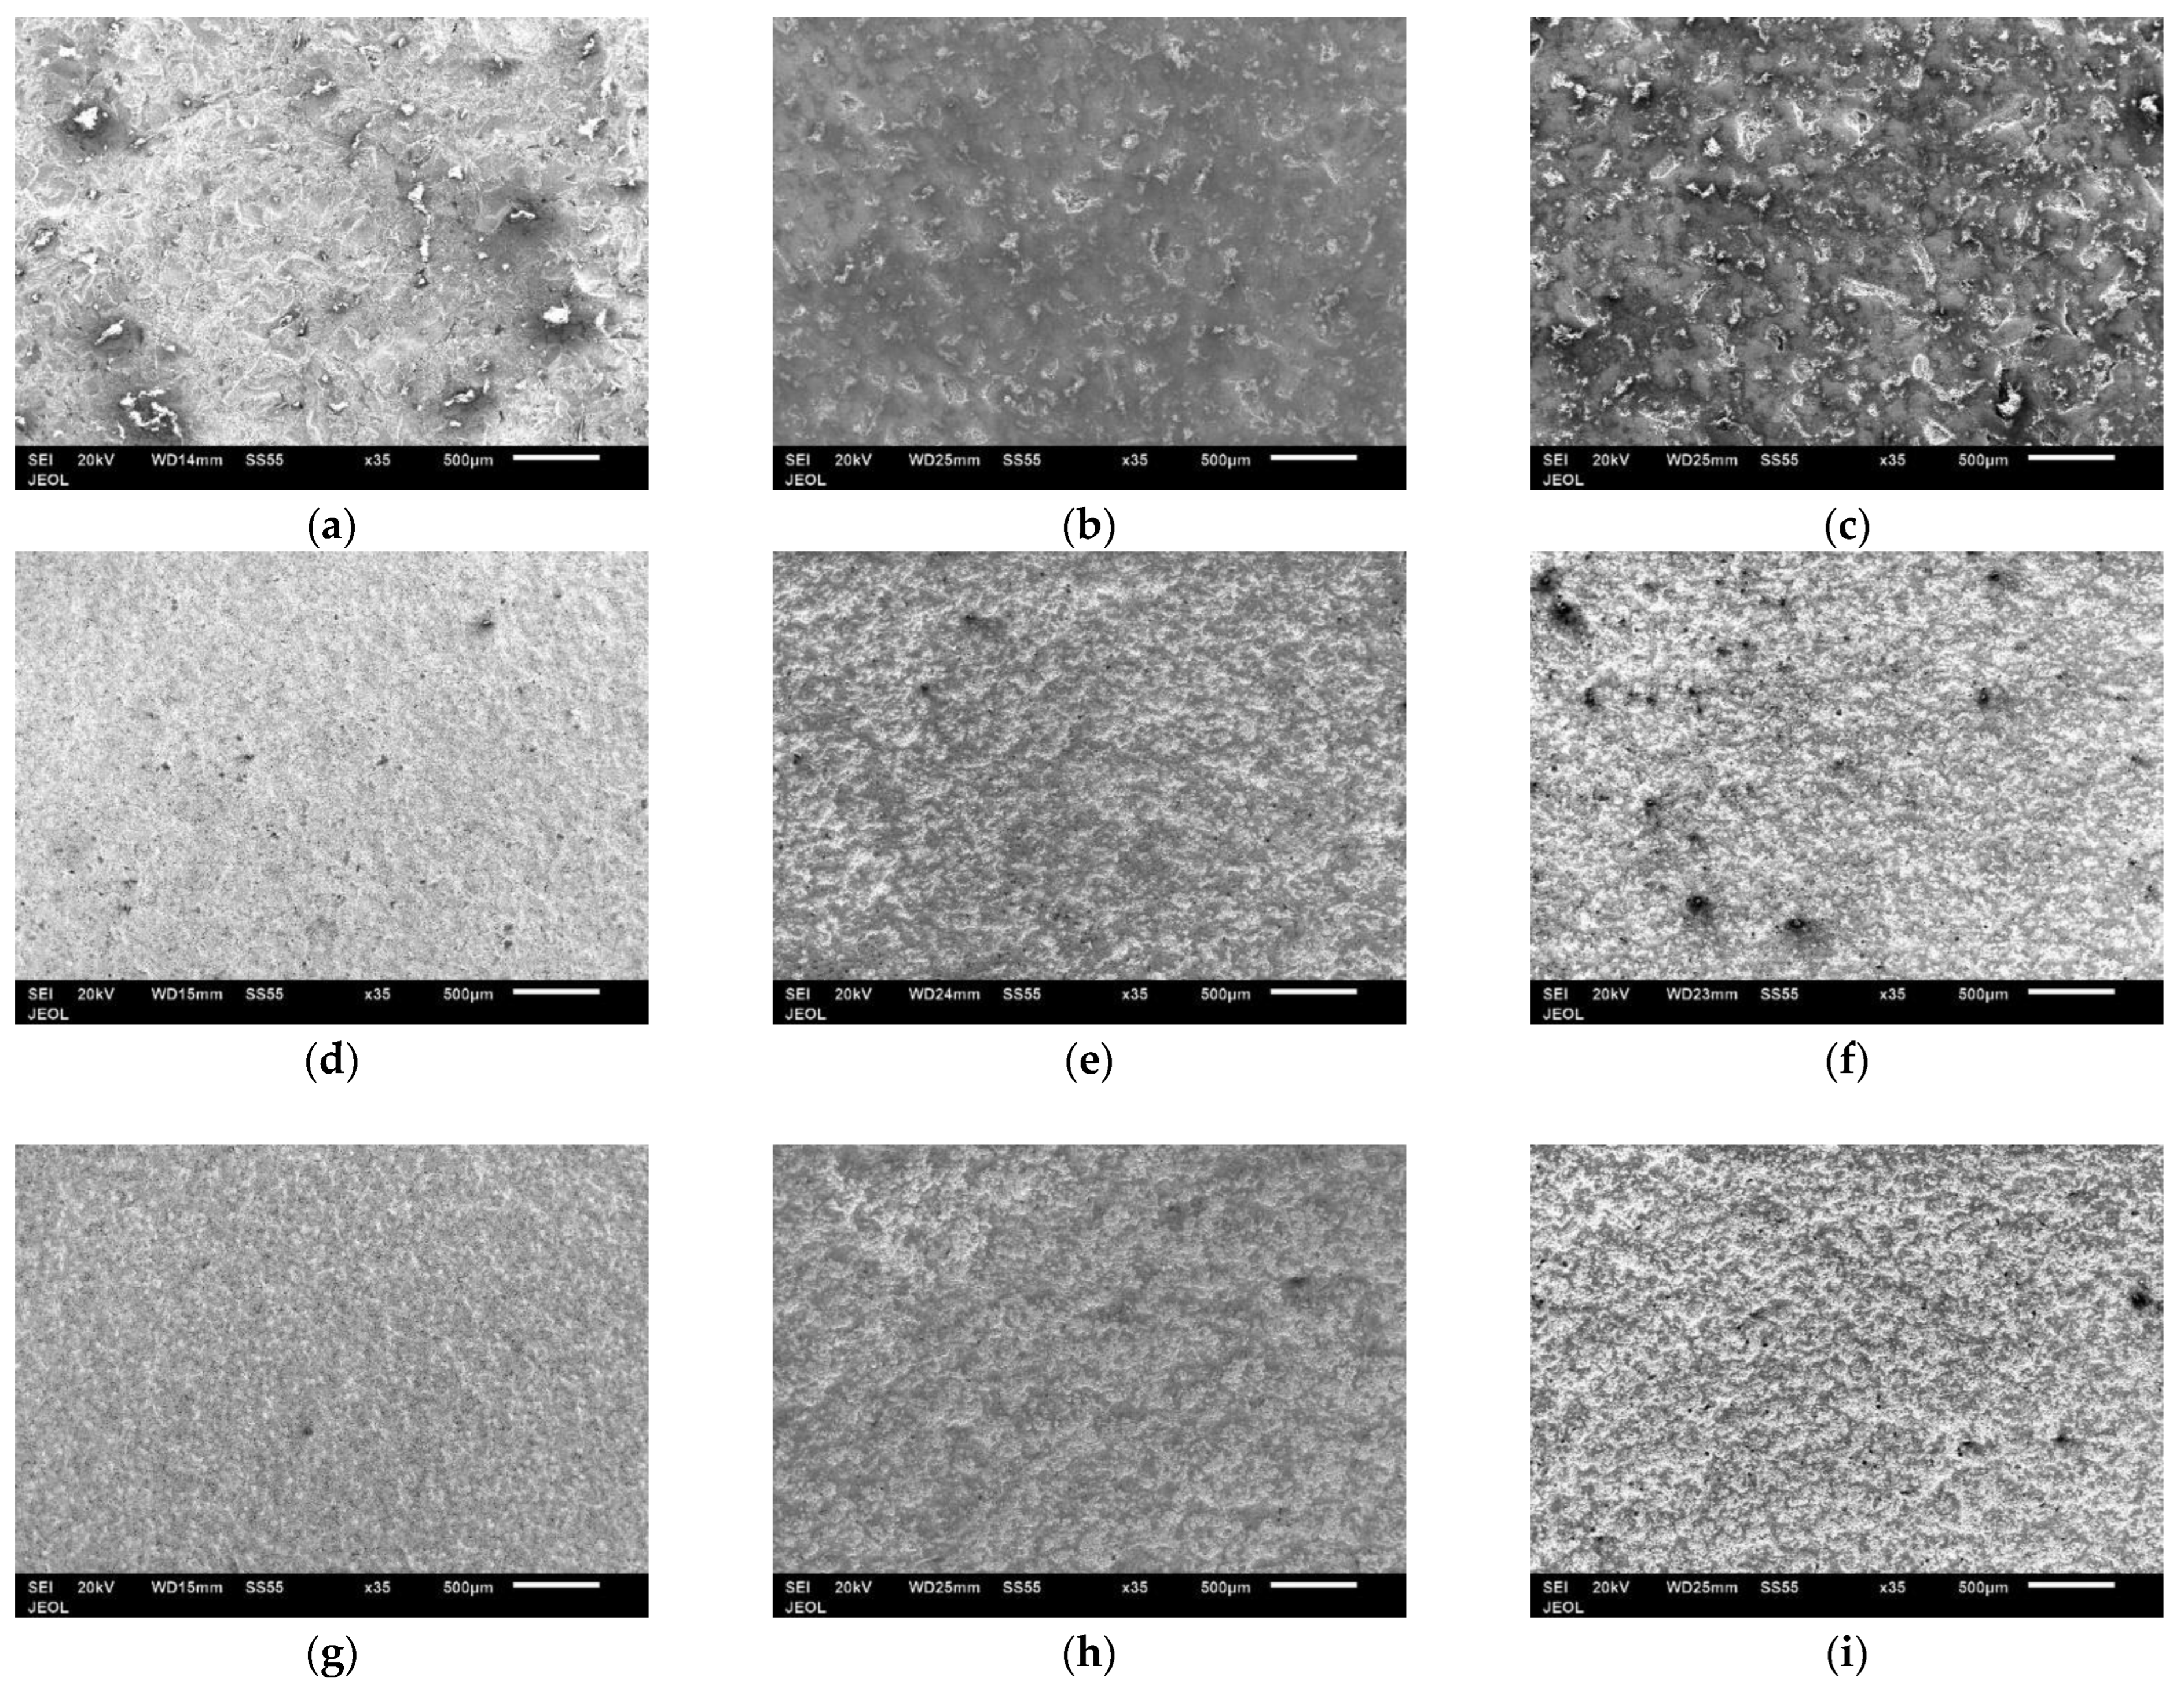
3.2. Surface Characterization of As-Sprayed Coatings

The morphology of the as-sprayed surfaces of both powders WC-12Co and WC-10Co-4Cr at different magnifications are shown in Figure 5 in the left and right columns and respectively. They share common features such as homogeneous morphology as well as occasional zones at which melting/partial melting of powders occurred. Free-hand black lines were drawn to surround these zones as shown in Figure 5b,e and at higher magnification designated by letter “M” and black arrow as in Figure 5c,f. The areas of the melted zone were measured 10 times at different locations and the same magnification where the average percentage of these areas was calculated with respect to the total area which gave 30.3 ± 0.6% and 14.5 ± 0.4% for WC-12Co and WC-10Co-4Cr coatings respectively. The reaforn to this difference is related to the smaller particle size with the former powder compared to the latter one [13]. The smaller particle size is more susceptible to overheating due to its lower mass which may dissolve more readily in the molten binder due to its higher surface area-to-volume ratio compared to the coarse one [14]. Furthermore, smaller particle size possesses larger amount of high-energy particle boundary area than that with bigger particle, assuming other related factors such as viscosity are constant. Hence, particles with a larger amount of high-energy particle boundary area tend to melt easier [15].

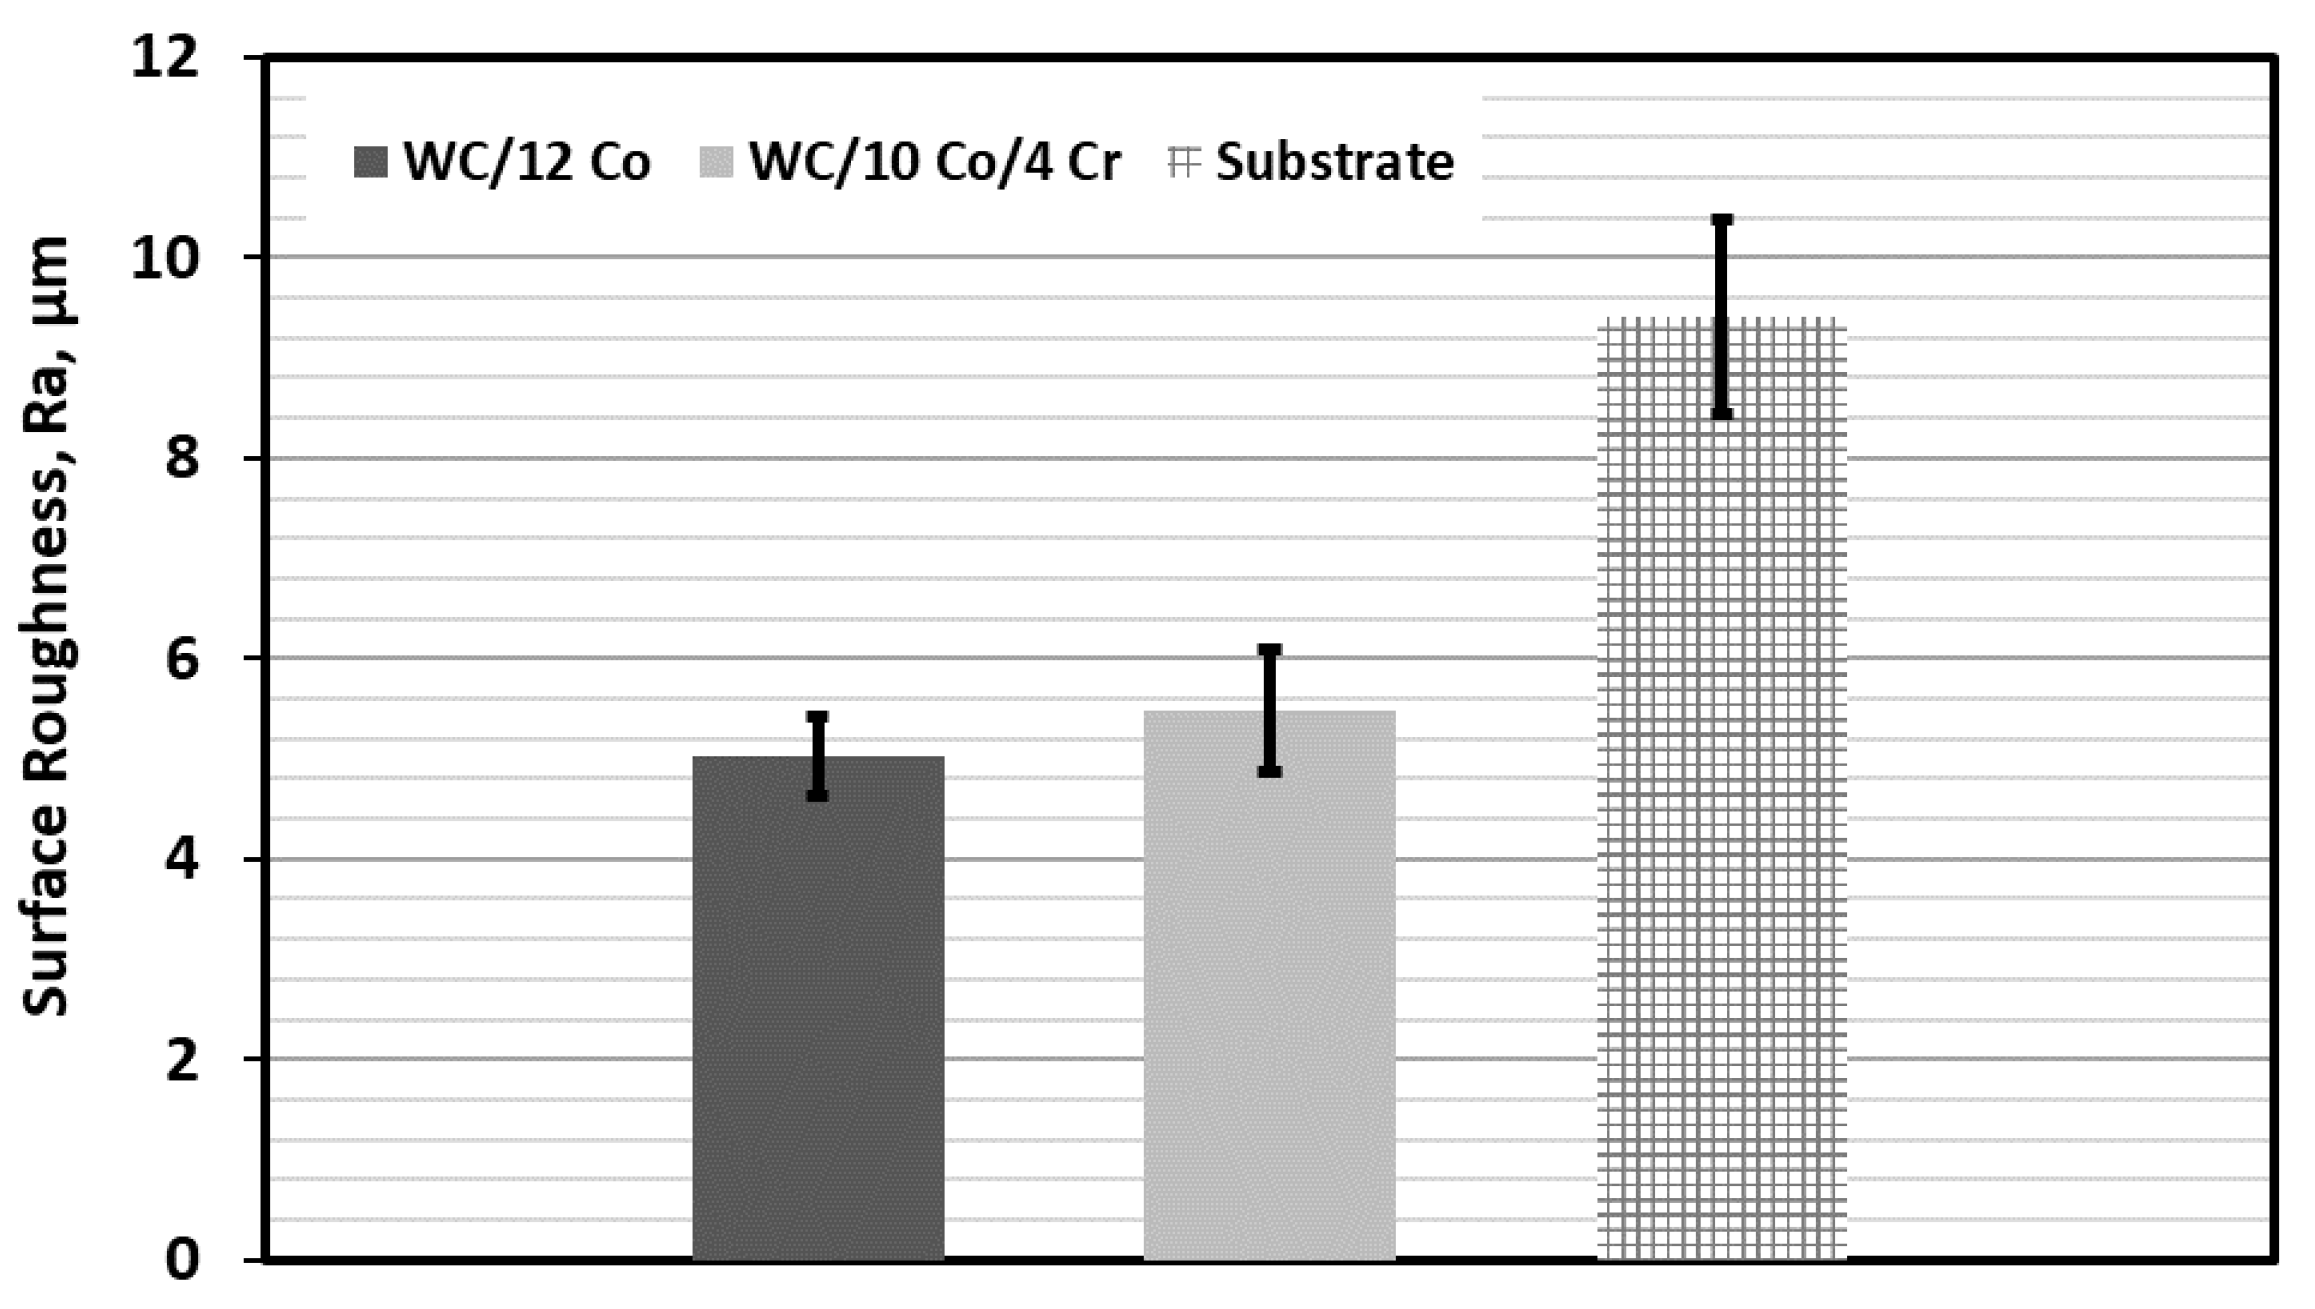
3.3. Surface Roughness

The surface roughness (expressed in Ra) of WC-12Co and WC-10Co-4Cr coatings as well as the substrate (for comparison), were measured 10 times at different locations and gave an average of 5.02 ± 0.41, 5.48 ± 0.63, and 9.41 ± 0.98 µm respectively as presented in Figure 6. This result can be related to the particle size, where smoother surface roughness is obtained from smaller particles, as well as the higher percentage of melted zones playing a role in smoother surfaces [13]. On the other hand, the high roughness of the substrate is due to the shot blasting process using Al2O3 grit used as surface preparation for coating.

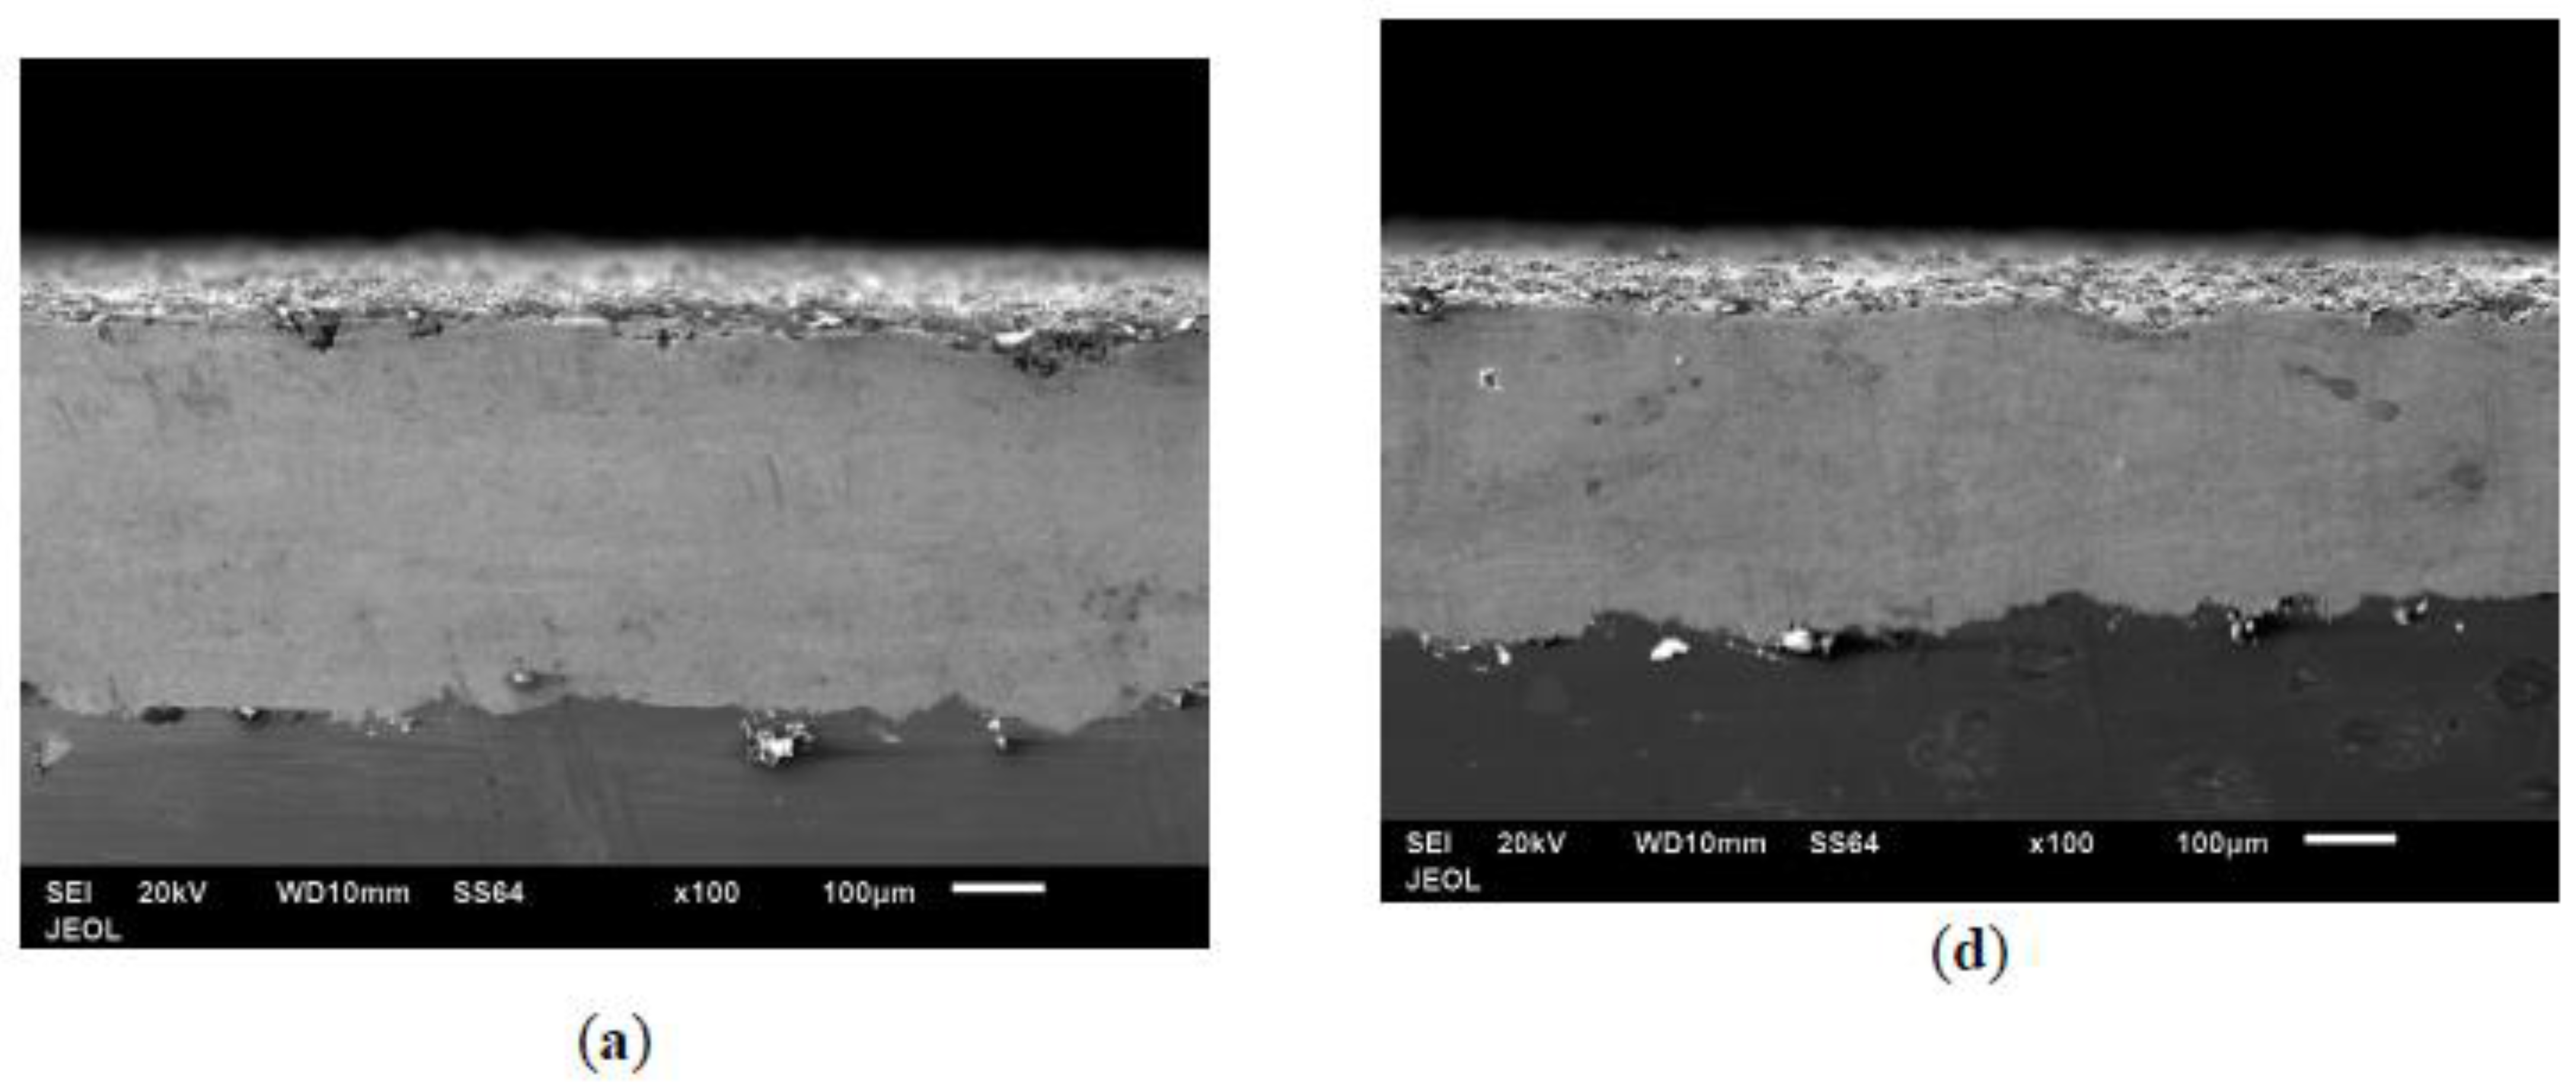
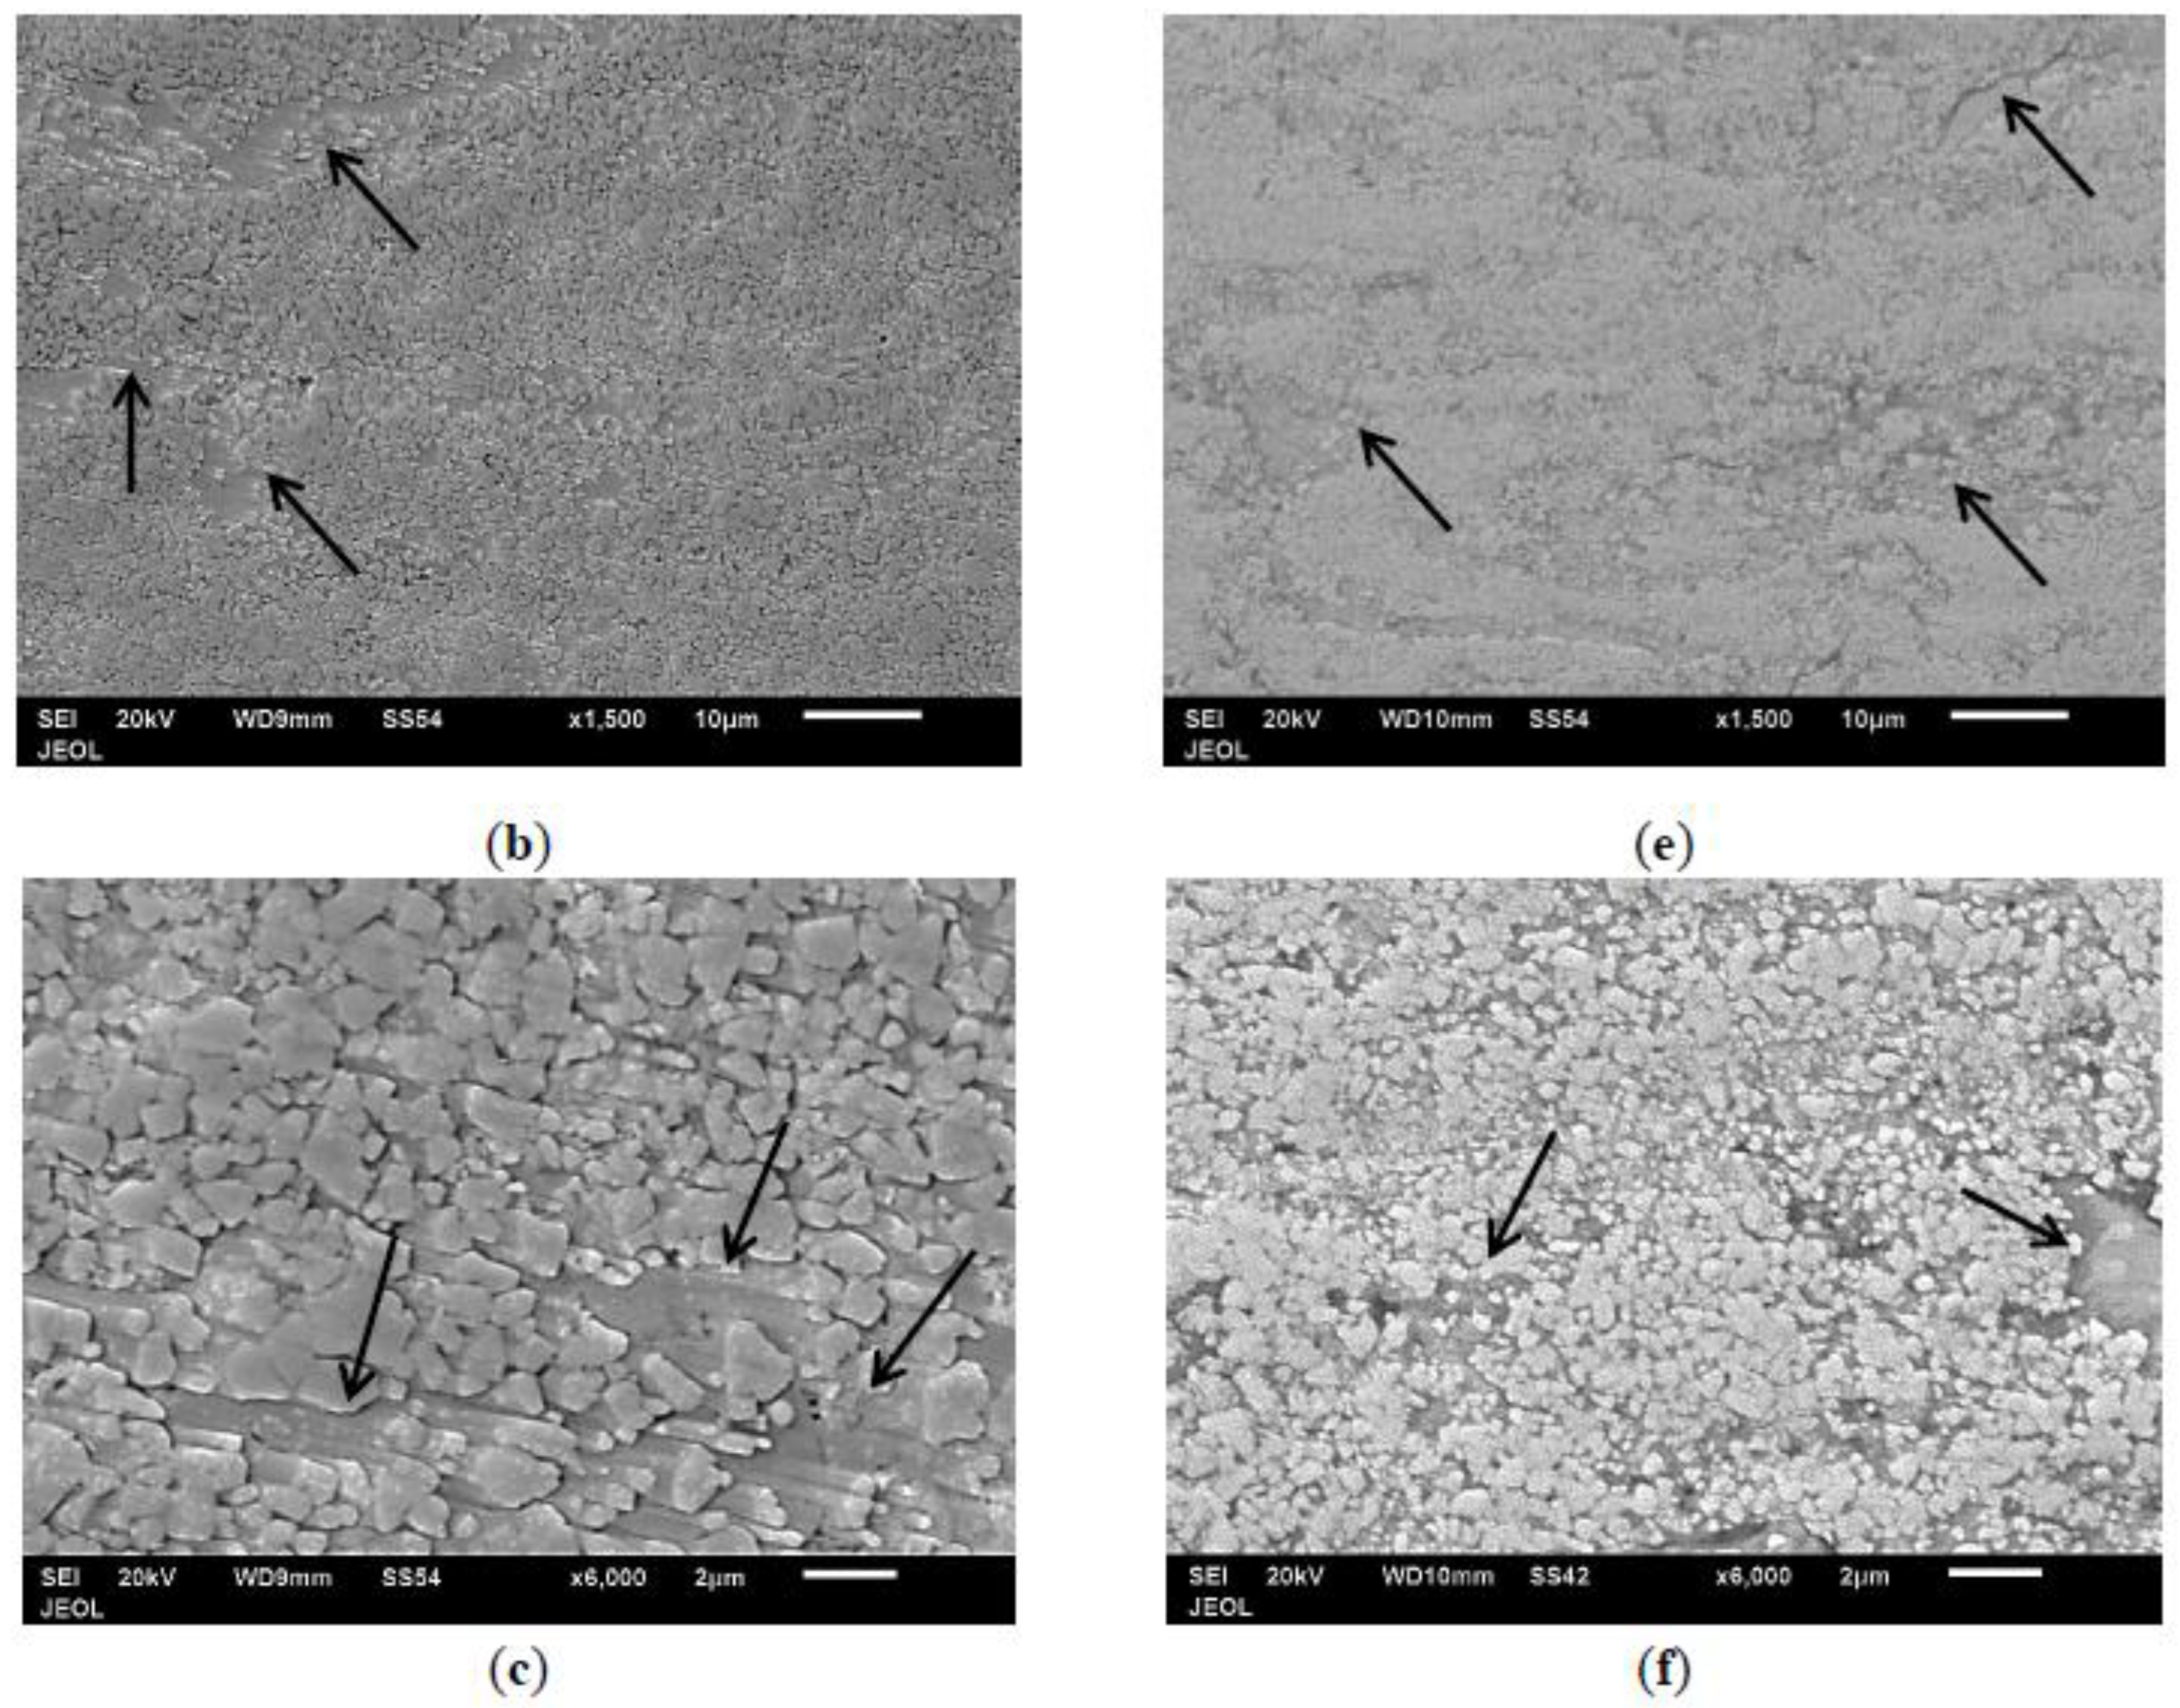
3.4. Morphology of Coating Layer

SEM was used to visualize in detail the coating layer sections as well as to measure the coating thickness for both coating types. The coating layer of WC-12Co and WC-10Co-4Cr are shown in Figure 7 left and right columns and respectively, where they were built up to a thickness of around 330 ± 60 µm [16]. Figure 7a,d show that both coating layers were dense with no cracks and good contact with the substrate. This is due to the high velocity and impact of the sprayed powder particles that have similar appearance in which carbide grains were homogenously distributed and embedded in the binder matrix, as shown in Figure 8b,e. However, some locations (indicated by a black arrow) in which the WC particles were pulled out [10,17] from the binder due to the grinding and polishing processes applied to reveal the coating layer, the substrate, and their interface. The carbide grain size within the coating layer was measured 10 times using the linear intercept method with each coating which gave an average value of 0.875 ± 0.061 µm and 0.287 ± 0.014 µm corresponding to WC-12Co and WC-10Co-4Cr coatings respectively. Comparing these values with that of the as-received powder shows that a significant reduction in particle size has occurred due to the fragmentation resulting from the bombardment at high velocity of the molten or partially molten powders on the rough substrate. However, it should be noted that the smaller particle size of WC-12Co in the powder condition (13.7 µm) gave a larger carbide grain size (0.875 µm) in the coating when compared to (28.1 µm) of WC-10Co-4Cr which gave (0.287 µm).

3.5. EDS Analysis of Feed Stock Powders and Coating Layers

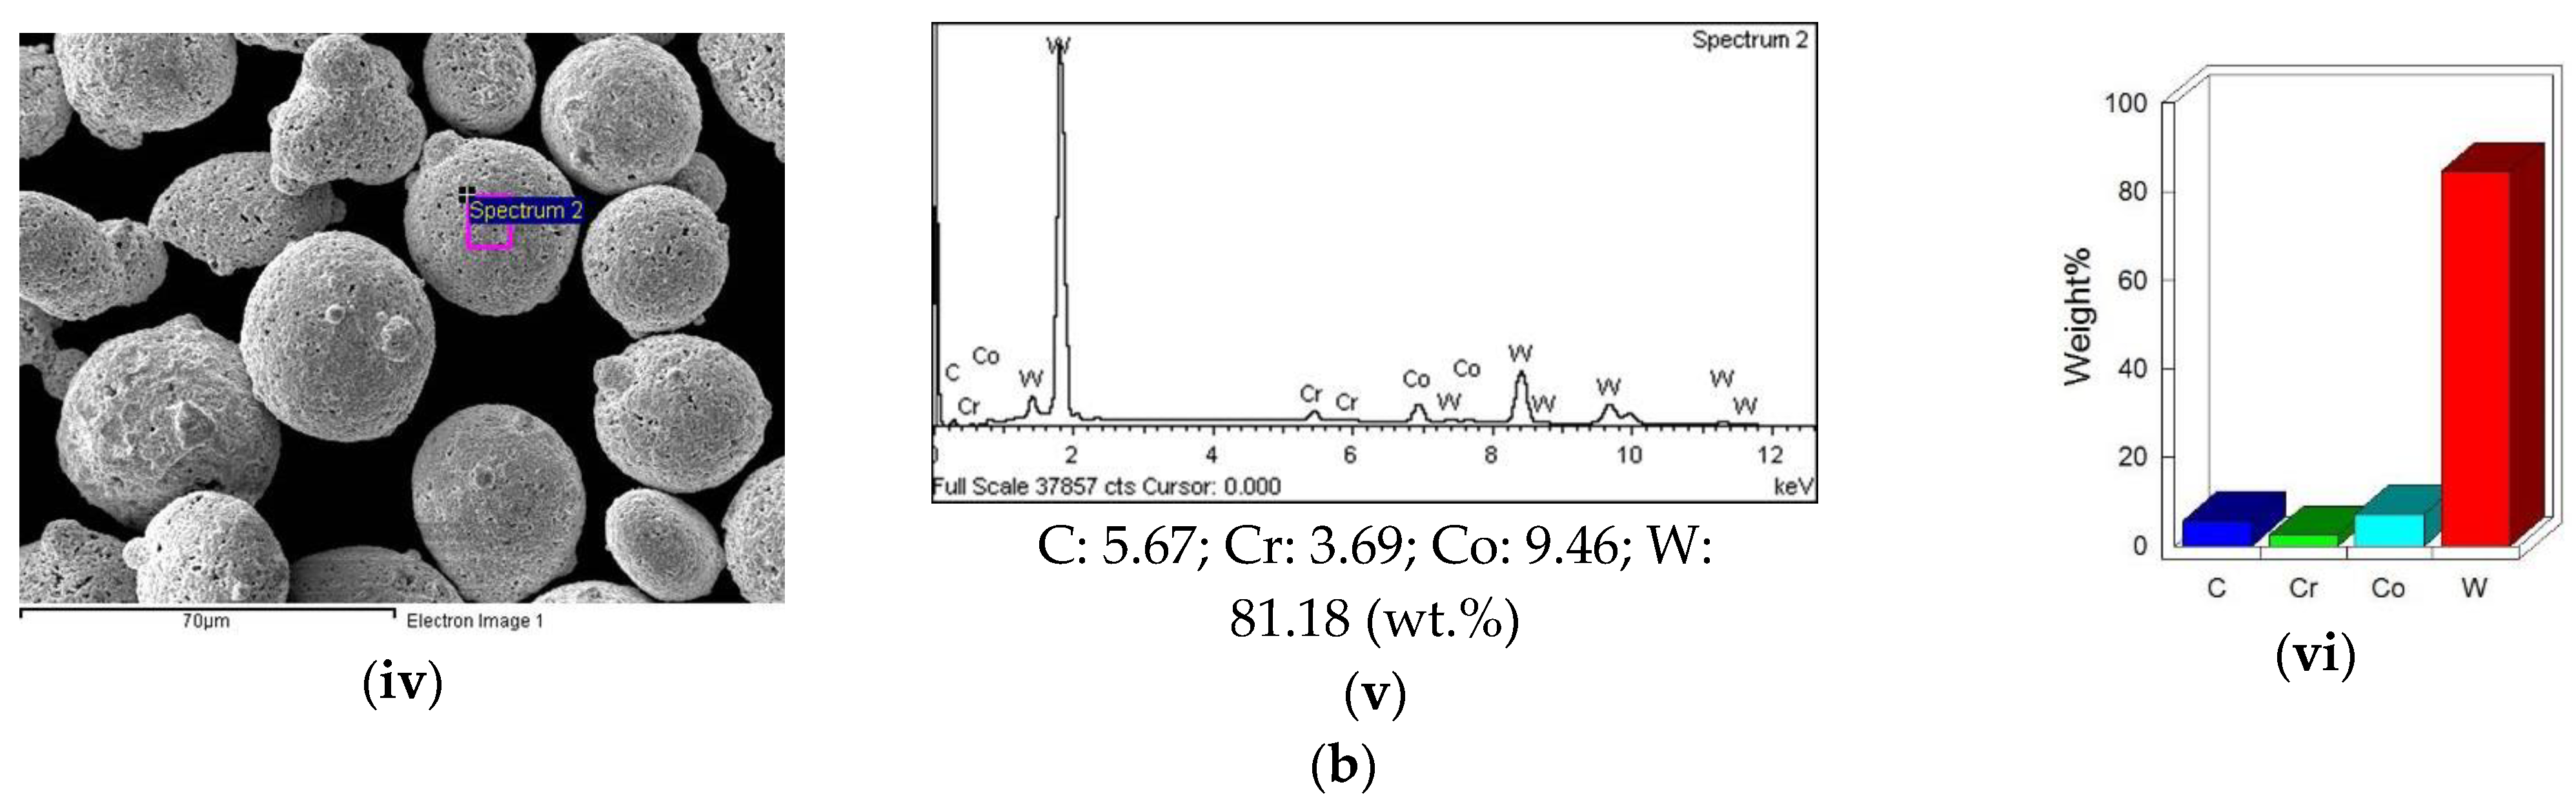
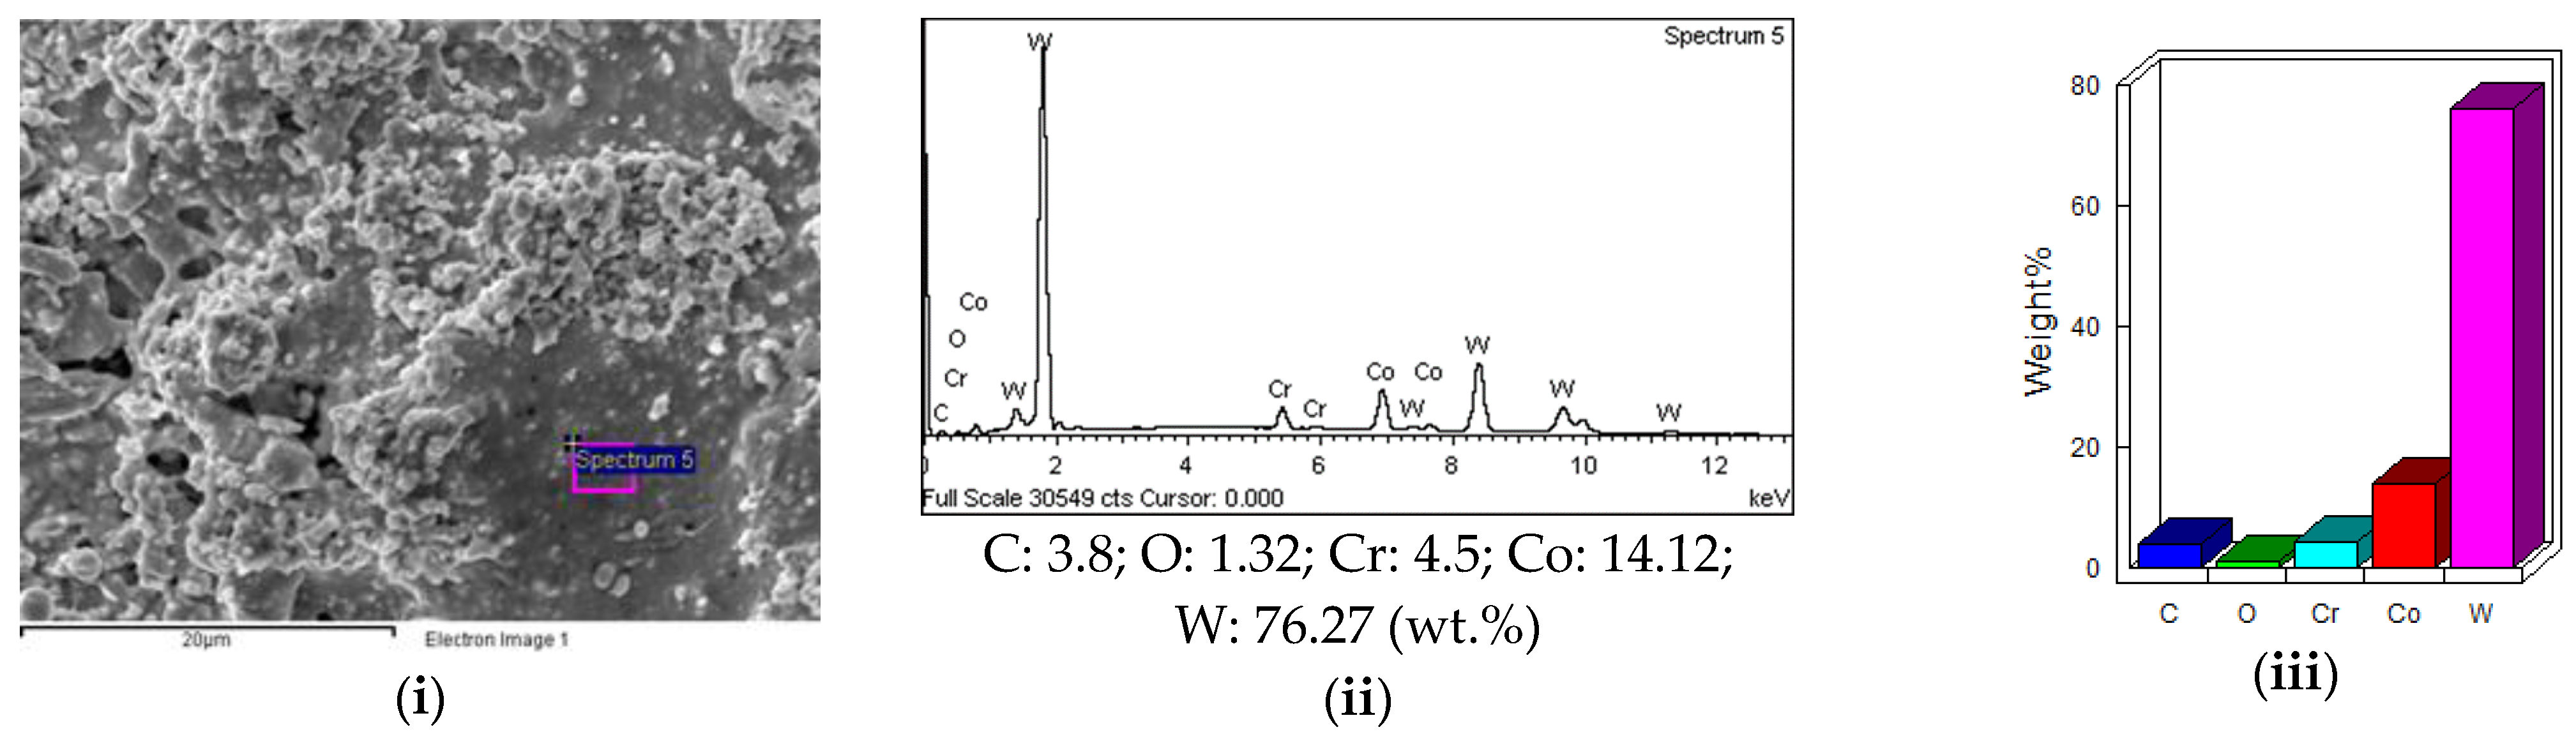
3.5.1. EDS Analysis of Feed Stock Powders

The quantitative elemental composition of both types of feed stock powders in the as-received condition was determined using Energy Dispersive Spectroscopy (EDS) which was conducted 5 times per sample in order to ascertain the consistency of the chemical analysis results. Figure 8 shows the EDS analysis of the as-received powder WC-12Co and WC-10Co-4Cr respectively. It can be noted that the elemental analysis obtained from the elemental histogram and quantitative results of both types of powder closely match that of the manufacturer, which is: C: 5.25 max; Co: 11.0–13.0; W: 81 min; Fe: 1.5 max; others: 1.0 max. (wt.%) for the former powder, whereas: W: Bal.; Co: 9.0–11.0; C: 5.00–5.5; Cr: 3.5–4.5; Others: 1.0 max (wt.%) for the later one.

3.5.2. EDS Analysis of the Coating

EDS of WC-12Co Coating

In order to ensure the results consistency and repeatability, five random locations were taken for EDS measurements. Figure 9 shows the EDS results of the WC-12Co coating which indicates that there is some increase in the C, reduction in W and Co contents, and presence of oxygen when compared to powder composition.
The reason for these changes can be related to the decomposition mechanism of WC that was suggested in several works [14,18,19]. This mechanism is divided into four stages namely; (a) binder melting, (b) dissolution of WC in the binder phase, (c) decarburization and (d) solidification of the molten binder upon bombarding the substrate. When the WC-12 Co powder particles are sprayed, they are exposed during their flight to high-temperature flame leading to melting the Co metallic binder phase due to its lower melting temperature of 1350 °C [16,18,20]. As a consequence, the WC particles dissolve/dissolute in the liquid Co-binder phase causing it to increase in volume whereas the solid WC phases decrease as well as an enrichment in C and W contents in the metallic matrix all of which are promoted with increasing temperature [18]. This is shown schematically in Figure 10.
The following reactions explain the decarburization mechanism [13,19,21,22]:
2WC → 2W2C + C    W2C → 2W + C
Because O2 is involved in this process it diffuses within the liquid phase and reacts with the dissolved C forming CO2. Finally, decarburization ends with rapid solidification probably when particles bombard the relatively cold substrate. This rapid cooling causes the molten phase to be supersaturated, hence releasing W2C and simultaneously forming an amorphous supersaturated solid Co and W2C which will be shown later in the XRD test results [14].

EDS of WC-10Co-4Cr Coating

The EDS elemental analysis of WC-10Co-4Cr coating is shown in Figure 11, where it can be noted that C content was reduced, W, Co, and Cr were marginally increased and the presence of oxygen in comparison to the feed stock powder. The reason for these variations may be similarly referred to as the stages of the WC decomposition mechanism leading to decarburization as mentioned earlier.

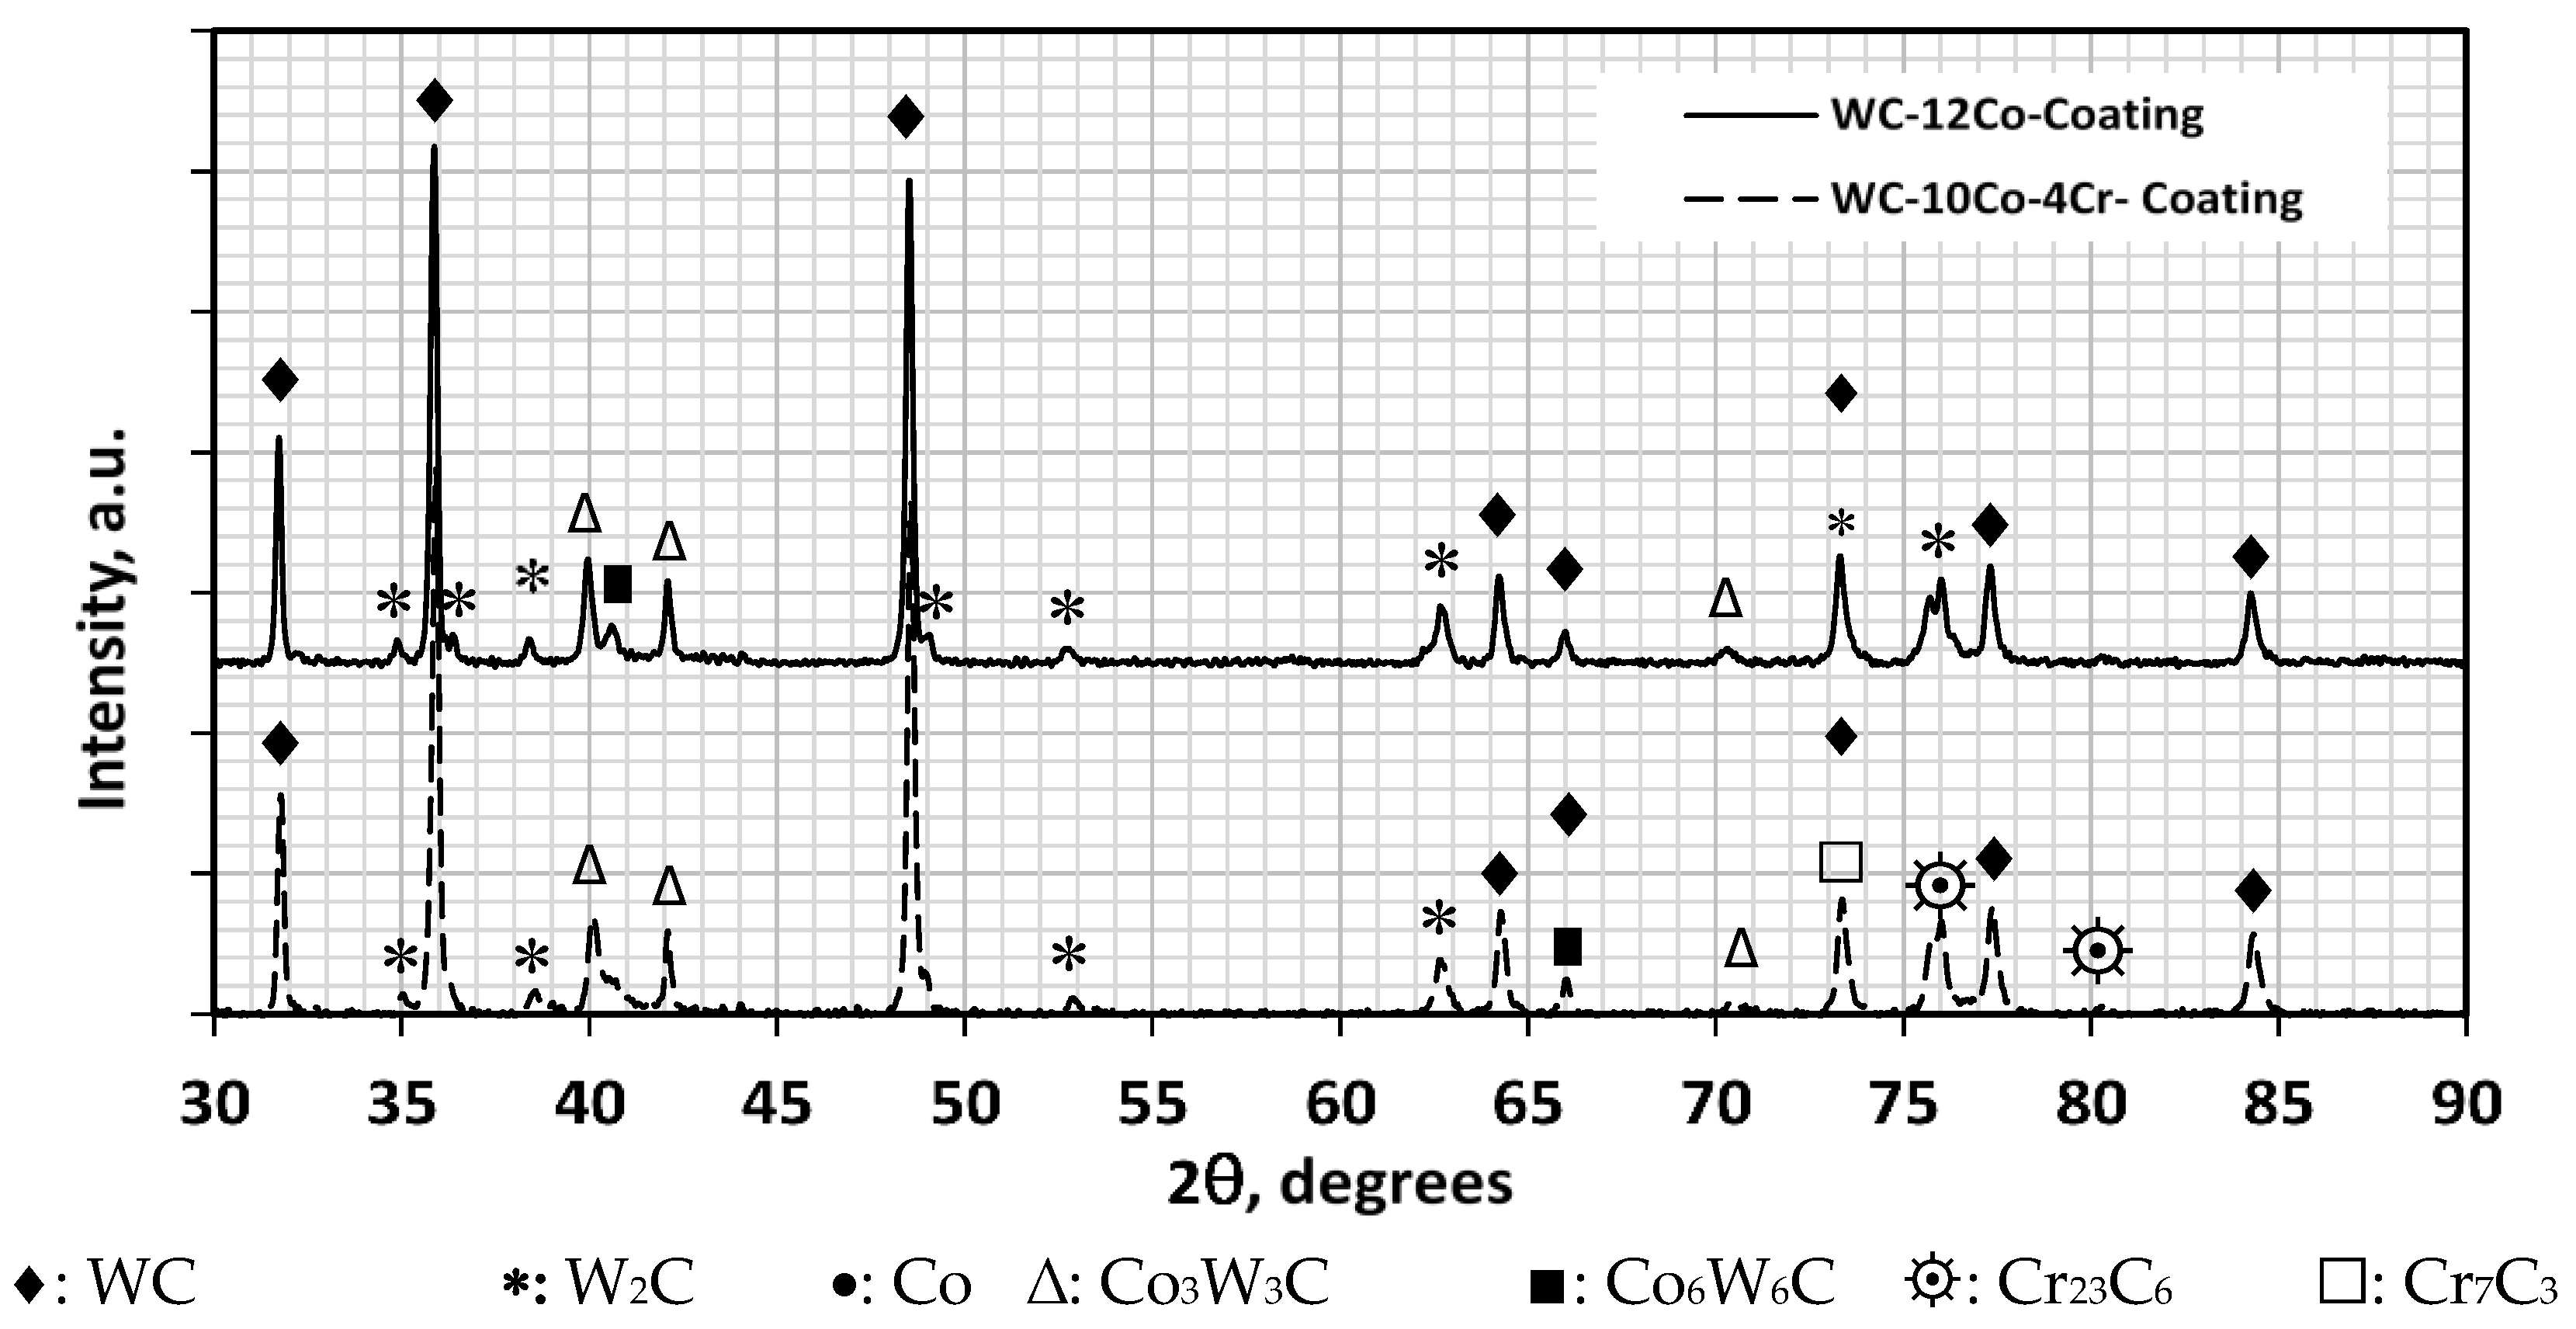
3.6. XRD of WC-12Co in Powder and Coating Conditions

The phase composition of the coatings was measured using X-ray Diffractometer (Shimadzu-XRD 7000-X Ray Diffractometer Maxima) was employed to detect the phases of the samples at a scanning rate of 0.1° s−1 between 30~90° using monochromatic Cu-Kα radiation operated at 40 kV. Figure 12 shows the XRD diffraction patterns of WC-12Co in its powder and coated conditions. It can be noted that all WC-phase peaks which were detected at specific Bragg (i.e., 2θ) angles in the powder condition were identical to that occurring in the coating due to the presence of carbide particles in both conditions even with smaller size in the coating [13]. On the other hand, the WC peaks in the coated condition had less intensity compared to that of powder due to the decarburization of WC into tungsten semi-carbide W2C [16], which appeared as well as new peaks in the coating diffraction pattern. In addition, new peaks of Co3W3C and Co6W6C (η-phase) [6] were indexed in the coating as in Figure 13. Worth noting that the Co minute peak was detected in the powder condition [16] at 44°; Figure 13, whereas it was absent in the coated one. This is due to the fast cooling taking place when the molten/partially molten sprayed particles bombard the relatively cold substrate [12] which upon solidification can partly transform into amorphous supersaturated solid Co (tungsten, carbide) solution or an η-phase upon solidification as reported earlier [5,12] and/or evaporation during spraying, both of which can lead to the absence of Co peaks.

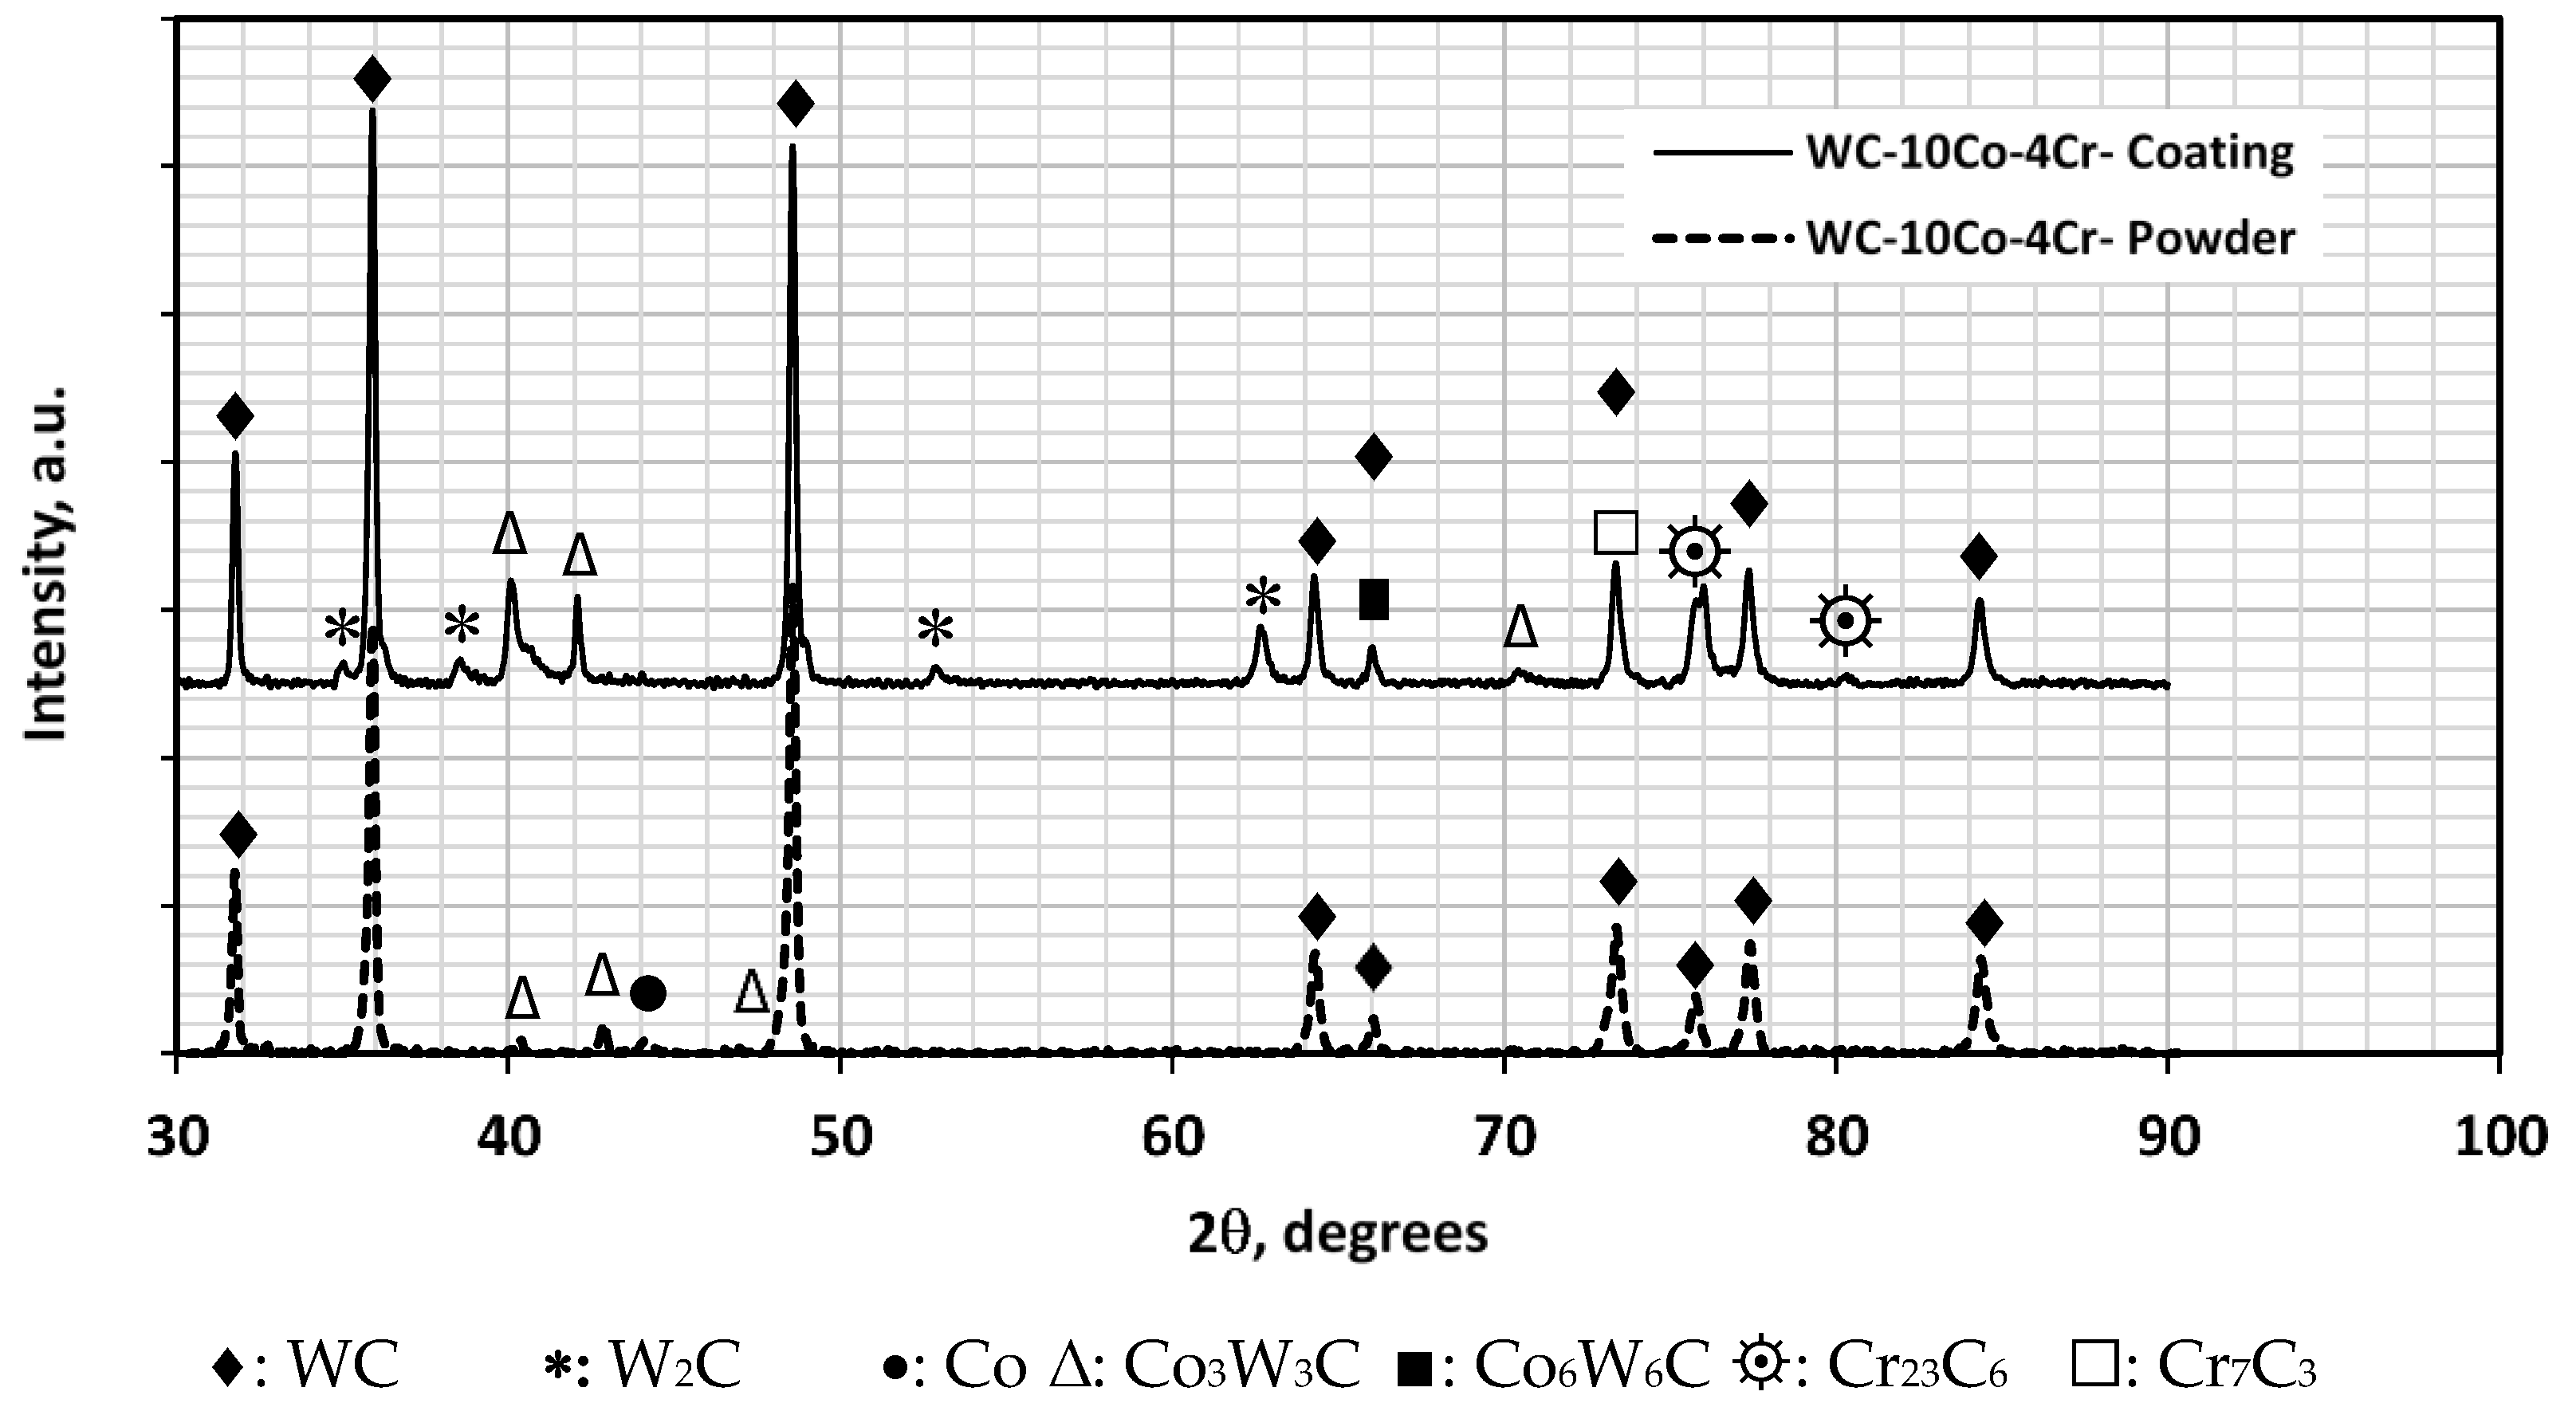
3.7. XRD of WC-10Co-4Cr in Powder and Coating Conditions

The XRD diffraction pattern of WC-10Co-4Cr in its powder and coating conditions is shown in Figure 14. WC peaks were detected in both the powder and coated conditions and also two weak peaks (traces) of metastable Co3W3C were noticed in the initial powder condition [12]. The presence of Co3W3C is attributed to the insufficient carbon element balance in certain areas, where Cr (having a high affinity to C) reacts with C hence forming chromium carbide during the powder sintering process [6,12,23]. Furthermore, the diffraction pattern of the coated condition exhibited other phases such as W2C, η (Co3W3C) as well as the hard chromium carbides Cr23C6 and Cr7C3 which resulted from the decarburization of WC leading to free Cr and C hence promoting the formation of these carbides [6]. Worth noting that a minute Co peak was identified in the powder condition whereas it was absent in the coated one and appeared instead a broad peak of Co3W3C within a diffraction angle of 37~45° [20,24], which is similar to that reported earlier in several works [12,24,25]. The reason for this broadening is the amorphous phase that resulted from the rapid cooling of the molten Co-Cr binder upon impacting the cold substrate [6,12].
Figure 14 shows the XRD patterns of WC-12Co and WC-10Co-4Cr coatings sprayed by HVOF. The peak numbers of WC with both coatings were almost the same whereas, the peak intensities of the later coating were slightly higher, whereas W2C was lower, which proves; as stated in the EDS section, that WC decarburization extent into W2C was higher with the former coating than that with the later one [6]. It should be also noted that WC-10Co-4Cr coating exhibits some new chromium carbide phases such as Cr23C6, Cr7C3, whereas η-carbide phase (Co3W3C, Co6W6C) detected with both coatings was almost similar. The formation of the hard phases Cr23C6, Cr7C3 were generated due to the free Cr and C resulting from the decarburization of the WC.

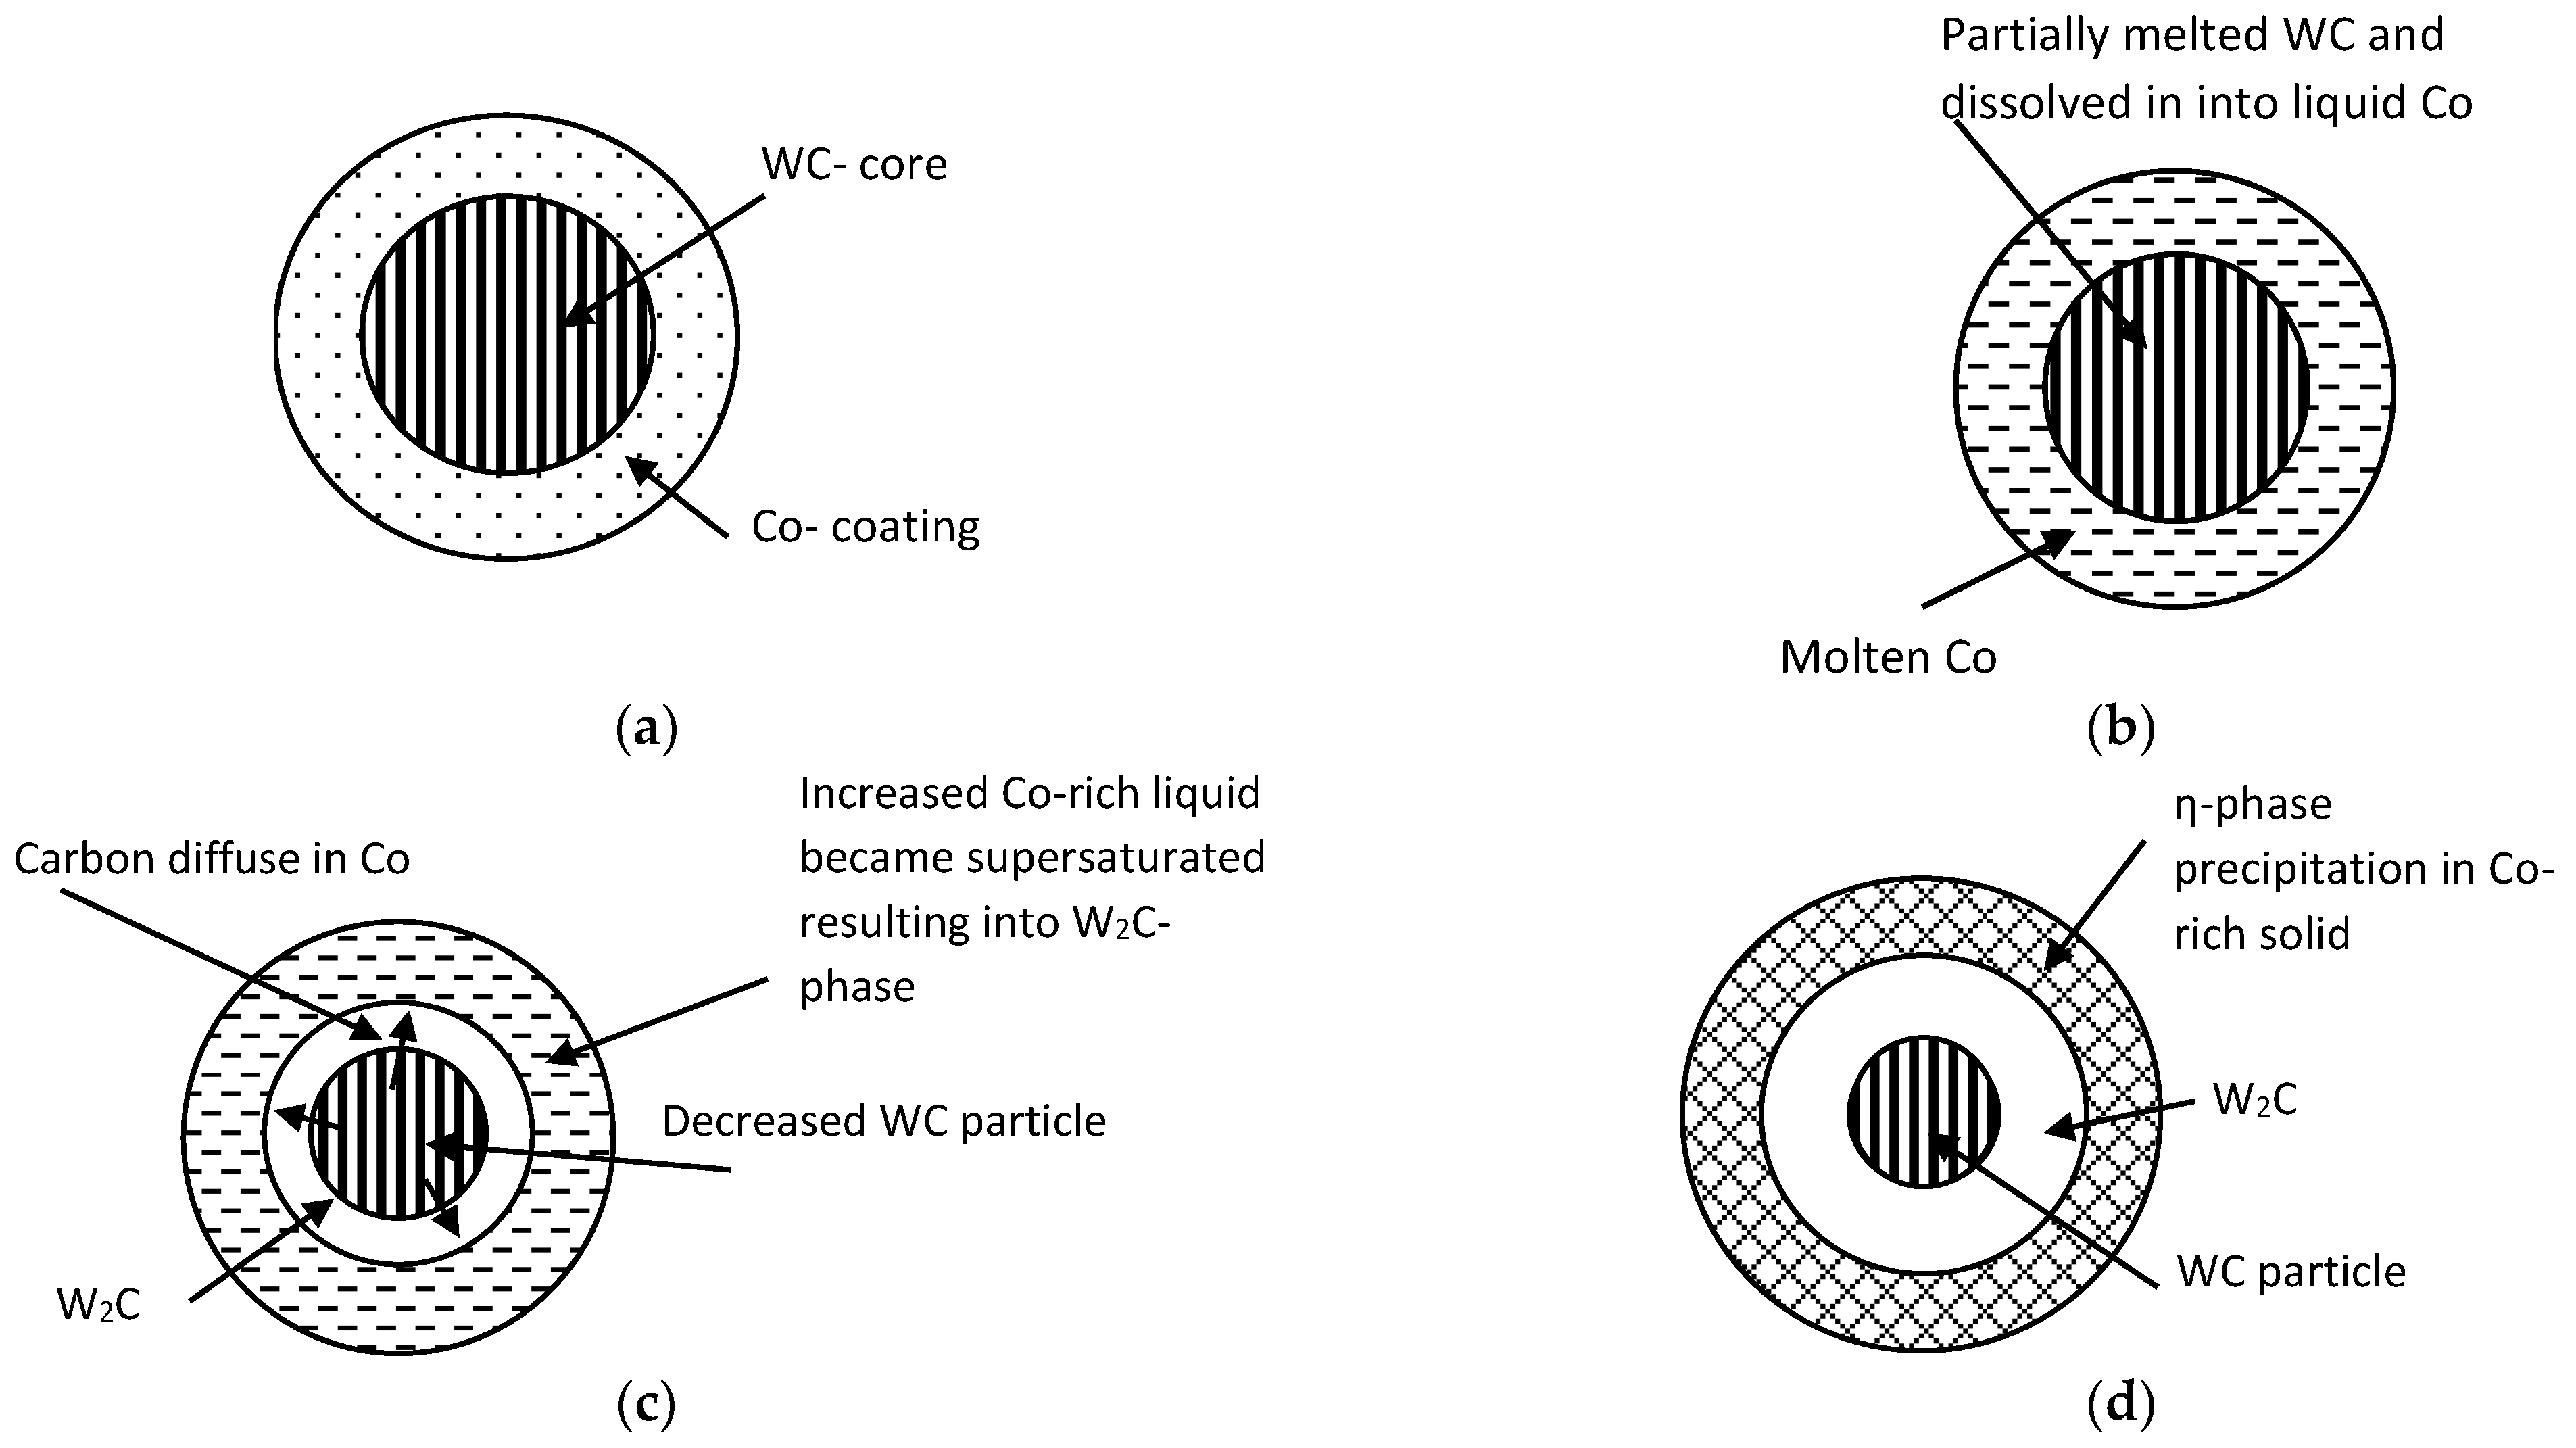
Effect of Particle Size on Decarburization

The effect of the particle size of the feed stock powder on the resulting phases after decarburization which occurred during and after deposition can be summarized as follows: the smaller particle size of powder WC-12Co (13.7 µm) compared to WC-10Co-4Cr (28.1 µm) is possesses higher surface area-to-volume ratio which when exposed to heating becomes more prone for dissolving in the molten binder [14,15] thus leading to an increased likelihood of decarburization compared to the larger particle size [13,20,25]. This is noticed from the W2C peak intensities detected in XRD patterns of both types of coating, which are summarized in Table 3 where it can be seen that W2C peak intensities are slightly higher with WC-12Co than with WC-10Co-4Cr at all diffraction angles giving evidence that the former powder is more decarburized than the later one [14].

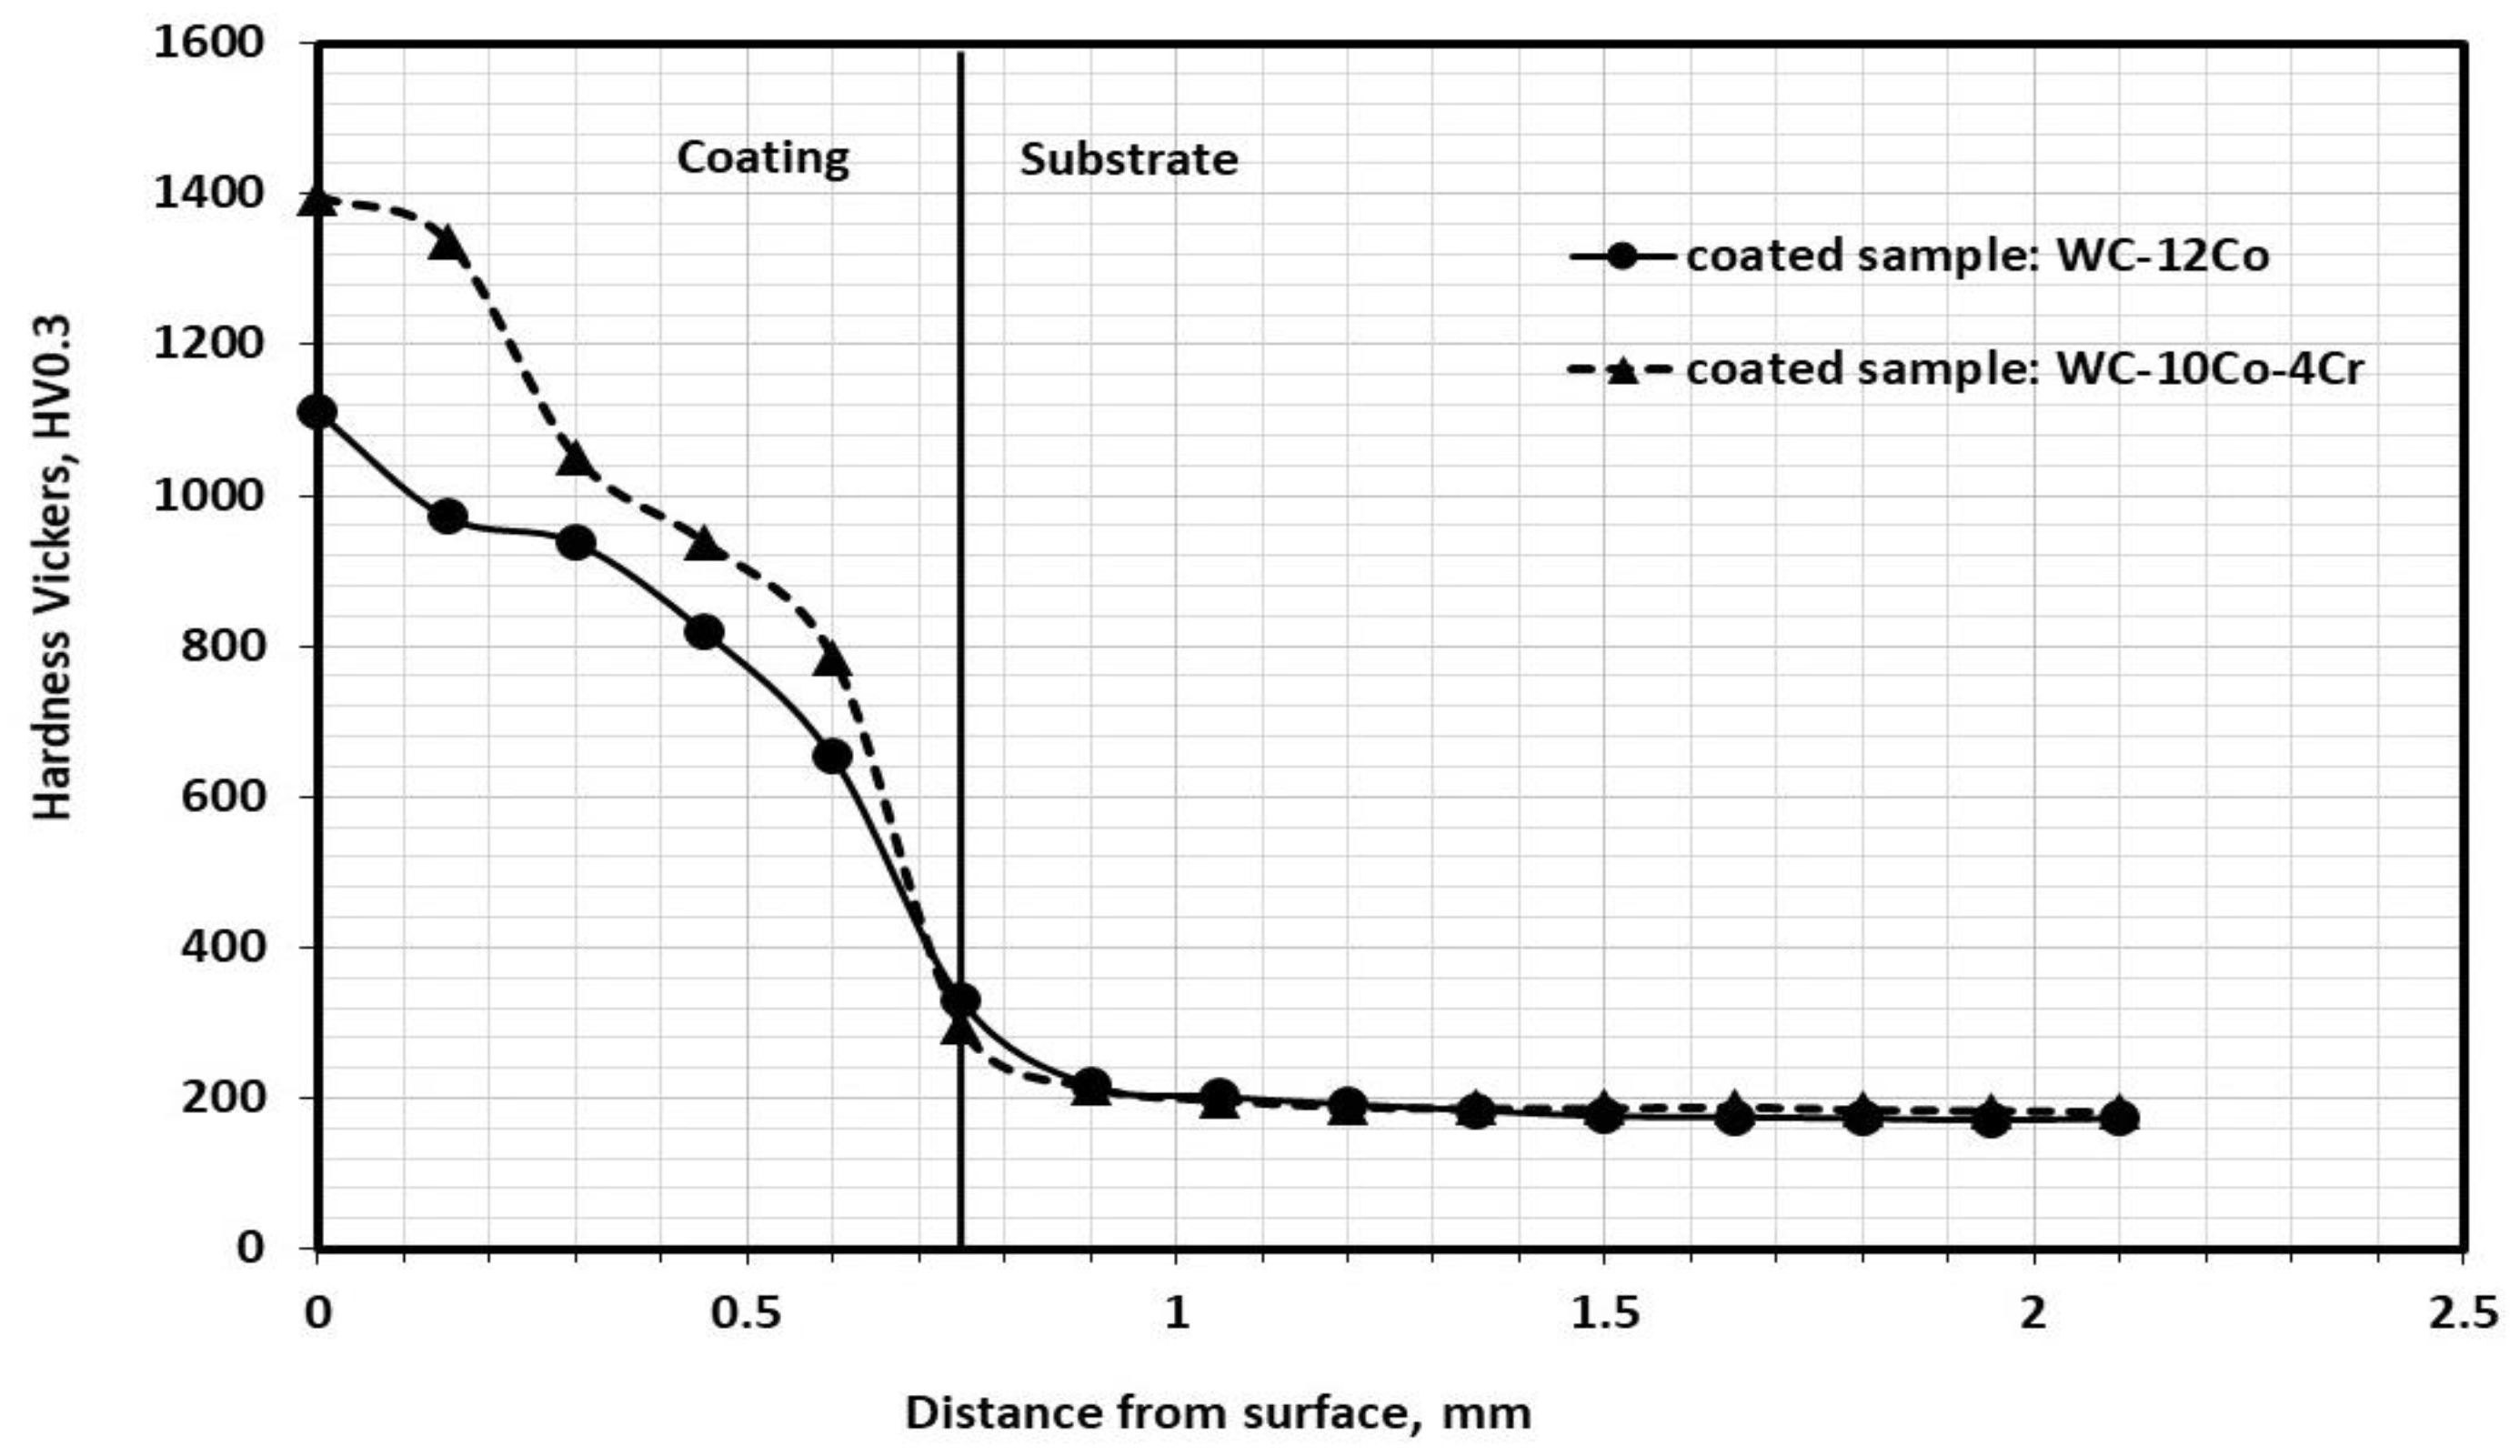
3.8. Microhardness Testing
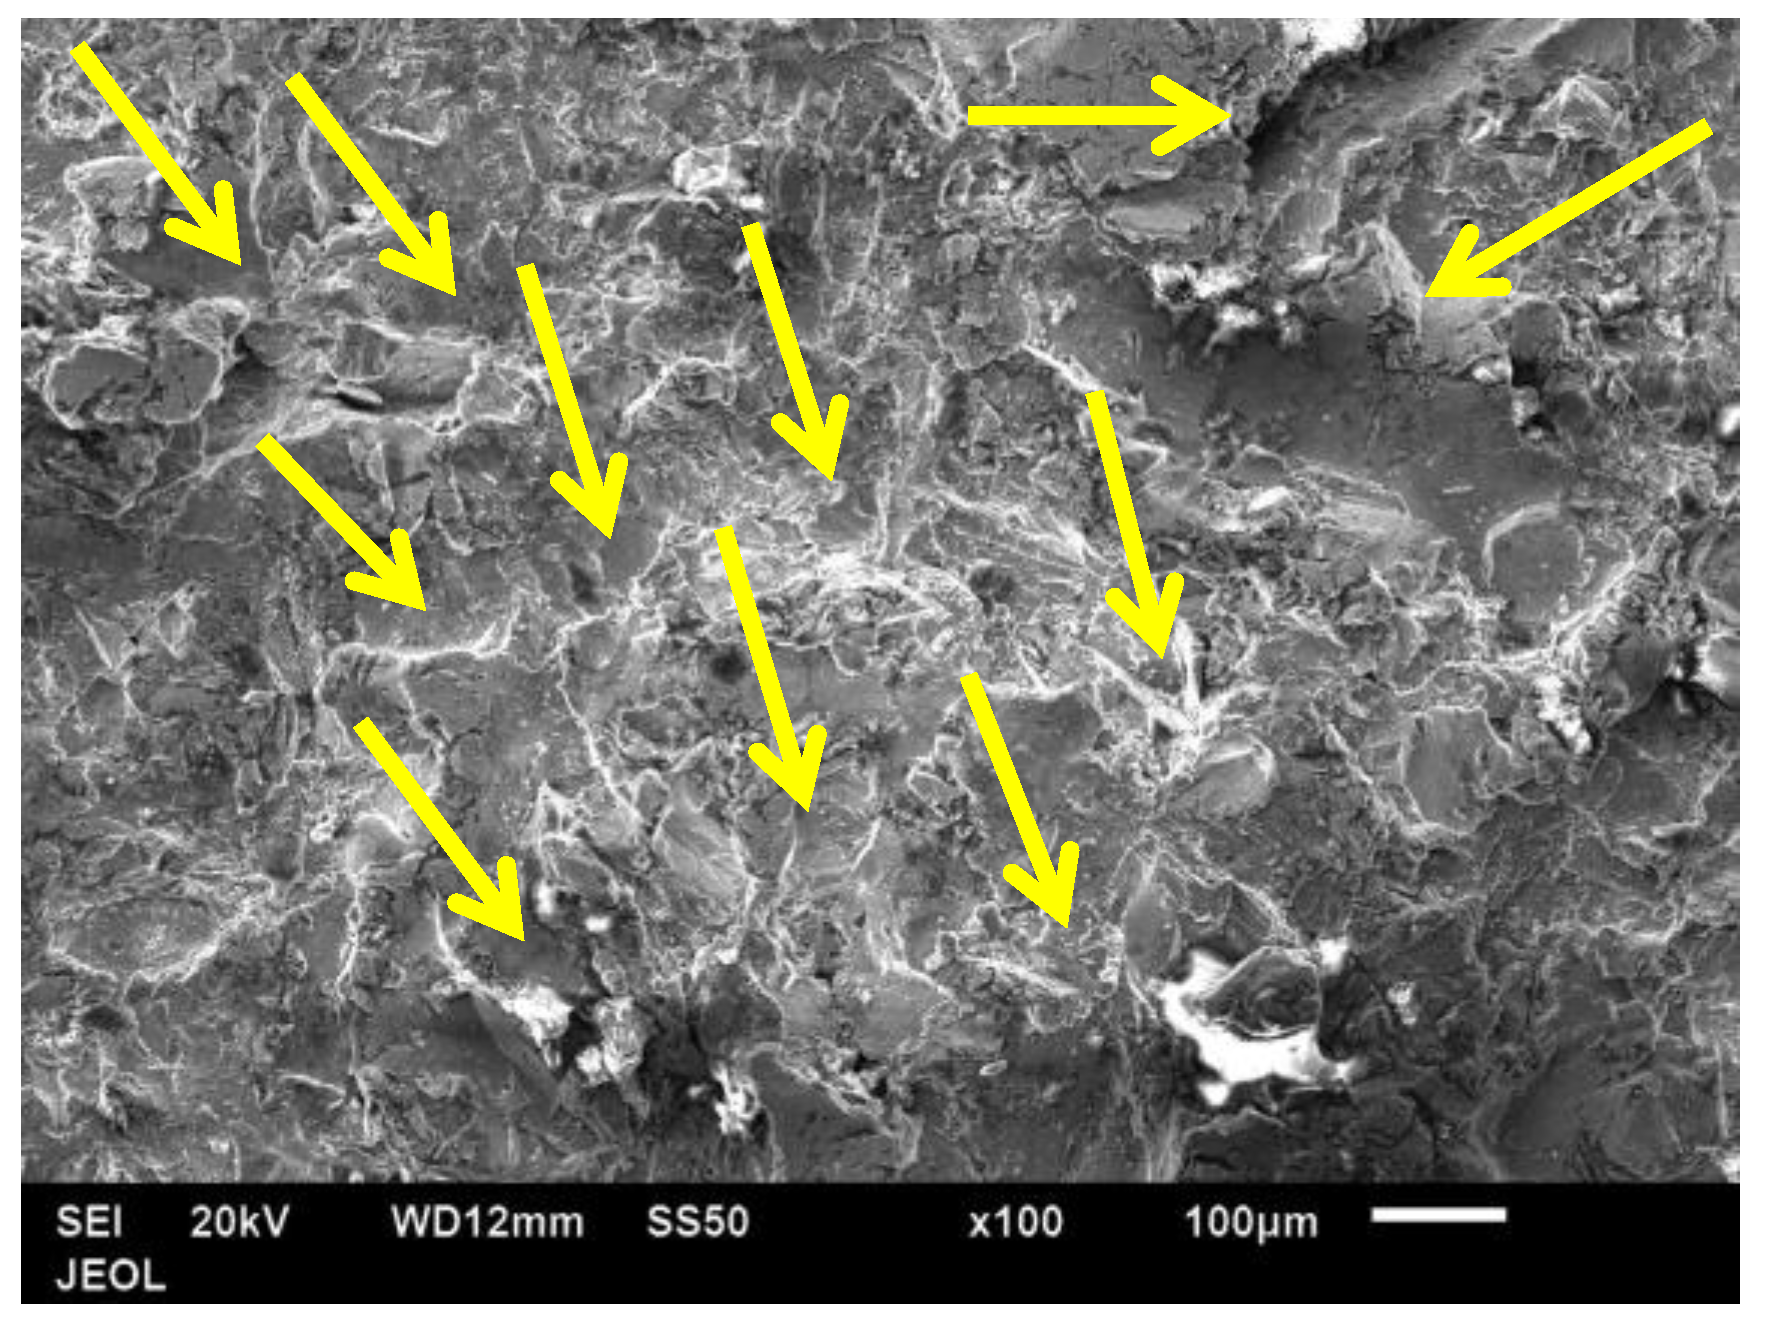
Microhardness measurements were conducted five times at a load of 300 g, 15 s dwell time, and 0.15 mm pitch between two consecutive indentations. Hardness variation along the coating thickness and the substrate is shown in Figure 15. The substrate average hardness was found to be within the range of 180 to 290 ± 6 HV0.3; values corresponding to the unaffected base metal to immediately just below the coating layer respectively. This is due to the fast cooling effects occurring after spraying in which the substrate material hardness is higher close to the substrate/coating interface than that in further locations [26]. The hardness variation of both coating layers gave the same behavior where the coating becomes softer towards the coating/substrate interface as seen in Figure 15, a similar result which was reported in earlier work [27] due to the difference in the cooling rates and the decarburization extent at the top and bottom of the coating layers. With both types of coatings, the coating process was performed several times [between 3–4 times] resulting in multi-layer coating. It is proposed [27] that decarburization is less at the top layer which accounts for higher hardness. This is due to the fact that lower layers close to the substrate are subjected to multiple heating effects due to the deposition of multiple layers leading to more decarburization than that with top layers. Furthermore, within the entire coating layer the WC-10Co-4Cr coating was harder (1396 HV0.3 ± 31) than the WC-12Co (1112 HV0.3 ± 19) especially at the top surface. This superiority in hardness can be mainly related to the lower extent of decarburization; proven above, exhibited with WC-10Co-4Cr than with WC-12Co due to the smaller particle size of the starting powder of the latter than the former one. The smaller particle size is more susceptible to heating than the larger one leading to the WC phase melting and dissolving easier in the molten binder [14], thus reaching higher dissolution rates and consequently more decarburization. This facilitates the decomposition of higher amounts of WC particles into W2C [13] causing the WC-12Co coating to be softer than WC-10Co-4Cr one. Another possible reason is the size of the carbide grain embedded in the binder after coating and the corresponding binder matrix-free path as shown earlier in Figure 7c,f, in which a smaller free path present with the latter coating gives higher hardness than that present with the former coating. [25] Decreasing the carbide grain size and binder mean free path hinders slipping hence suppression of dislocation propagation and consequently increasing the hardness [14]. Furthermore, the presence of Cr23C6, Cr7C3 uniquely in WC-10Co-4Cr is a significant reason for the higher hardness than that in WC-12Co coating [6].

3.9. Erosion Test

Plots of average weight loss versus testing period are shown in Figure 16 where it can be seen that all samples have similar behavior. Increasing the testing duration is accompanied by an increase in the average weight loss due to erosion. The blank uncoated substrate (bare) obviously suffered the highest weight loss (i.e., has the lowest erosion resistance) due to the absence of coating. On the other hand, comparing both types of coatings show that WC-10Co-4Cr coating possessed higher erosion resistance (i.e., lower weight loss) than WC-12Co one. This is due to the higher average hardness value possessed by the former than the latter as shown earlier in the hardness testing results. It was concluded [23] that hardness is utilized as the primary parameter for correlating wear/erosion resistance. Another reason for the higher erosion resistance may be due to the smaller carbide particle size of 0.287 µm measured in coating WC-10Co-4Cr compared to the larger one of 0.875 µm with WC-12Co. This leads to a smaller mean free path of binder matrix thus possessing higher erosion resistance [11], based on the fact that the abrasive erodes preferentially larger volume fraction of binder than carbide particles [25]. Therefore, it can be stated that this effect is aggravated when the smaller particle size is embedded in a harder binding matrix compared to the larger particle size in the softer WC-Co matrix [11]. Therefore, it can be stated that the effect of smaller particle size which is embedded in the harder binding matrix is aggravated compared to larger particle size in the softer WC-Co matrix [11].
Low-magnification SEM images were taken for the eroded surfaces resulting from slurry exposure times of 2 and 3 h testing in which considerable weight loss occurred as shown in Figure 17. The images of the surfaces in the shot blasted, WC-12Co and WC-10Co-4Cr coated samples in their as-sprayed condition are shown in Figure 17, which is divided horizontally according to to sample type and vertically according to erosion test exposure duration. The first left column shows the samples before erosion test whereas the second and third columns show the same sample types after exposure to erosion test for 2 and 3 h respectively. Generally, the common feature of these samples is that rough surface topographies shown in the first column of Figure 17a,d,g have changed into a relatively smoother surface (dark-grey) through partially removing the surface peaks as shown in Figure 17b,e,h. Worth noting that the light-grey zones in the coated samples are valleys in which the erosive slurry did not effectively erode them during this specific time (i.e., 2 h). On the other hand, with longer exposure times (i.e., 3 h) as in Figure 17c,f,i, the effect of slurry was more erosive where more material at peaks was removed and more valleys were revealed (light-grey zones).
For a closer view, higher magnification was used as in Figure 18a–c which shows the dark and light-grey zones for the 2 and 3 h testing times respectively. Similarly, it can be noted that with both types of coating the dark-grey zones increased with increasing the testing time from 2 to 3 h indicating that more coating is removed leaving behind the valleys (light-grey zones) as shown in Figure 18. These results confirm that one’s obtained from the weight loss results shown in Figure 16.

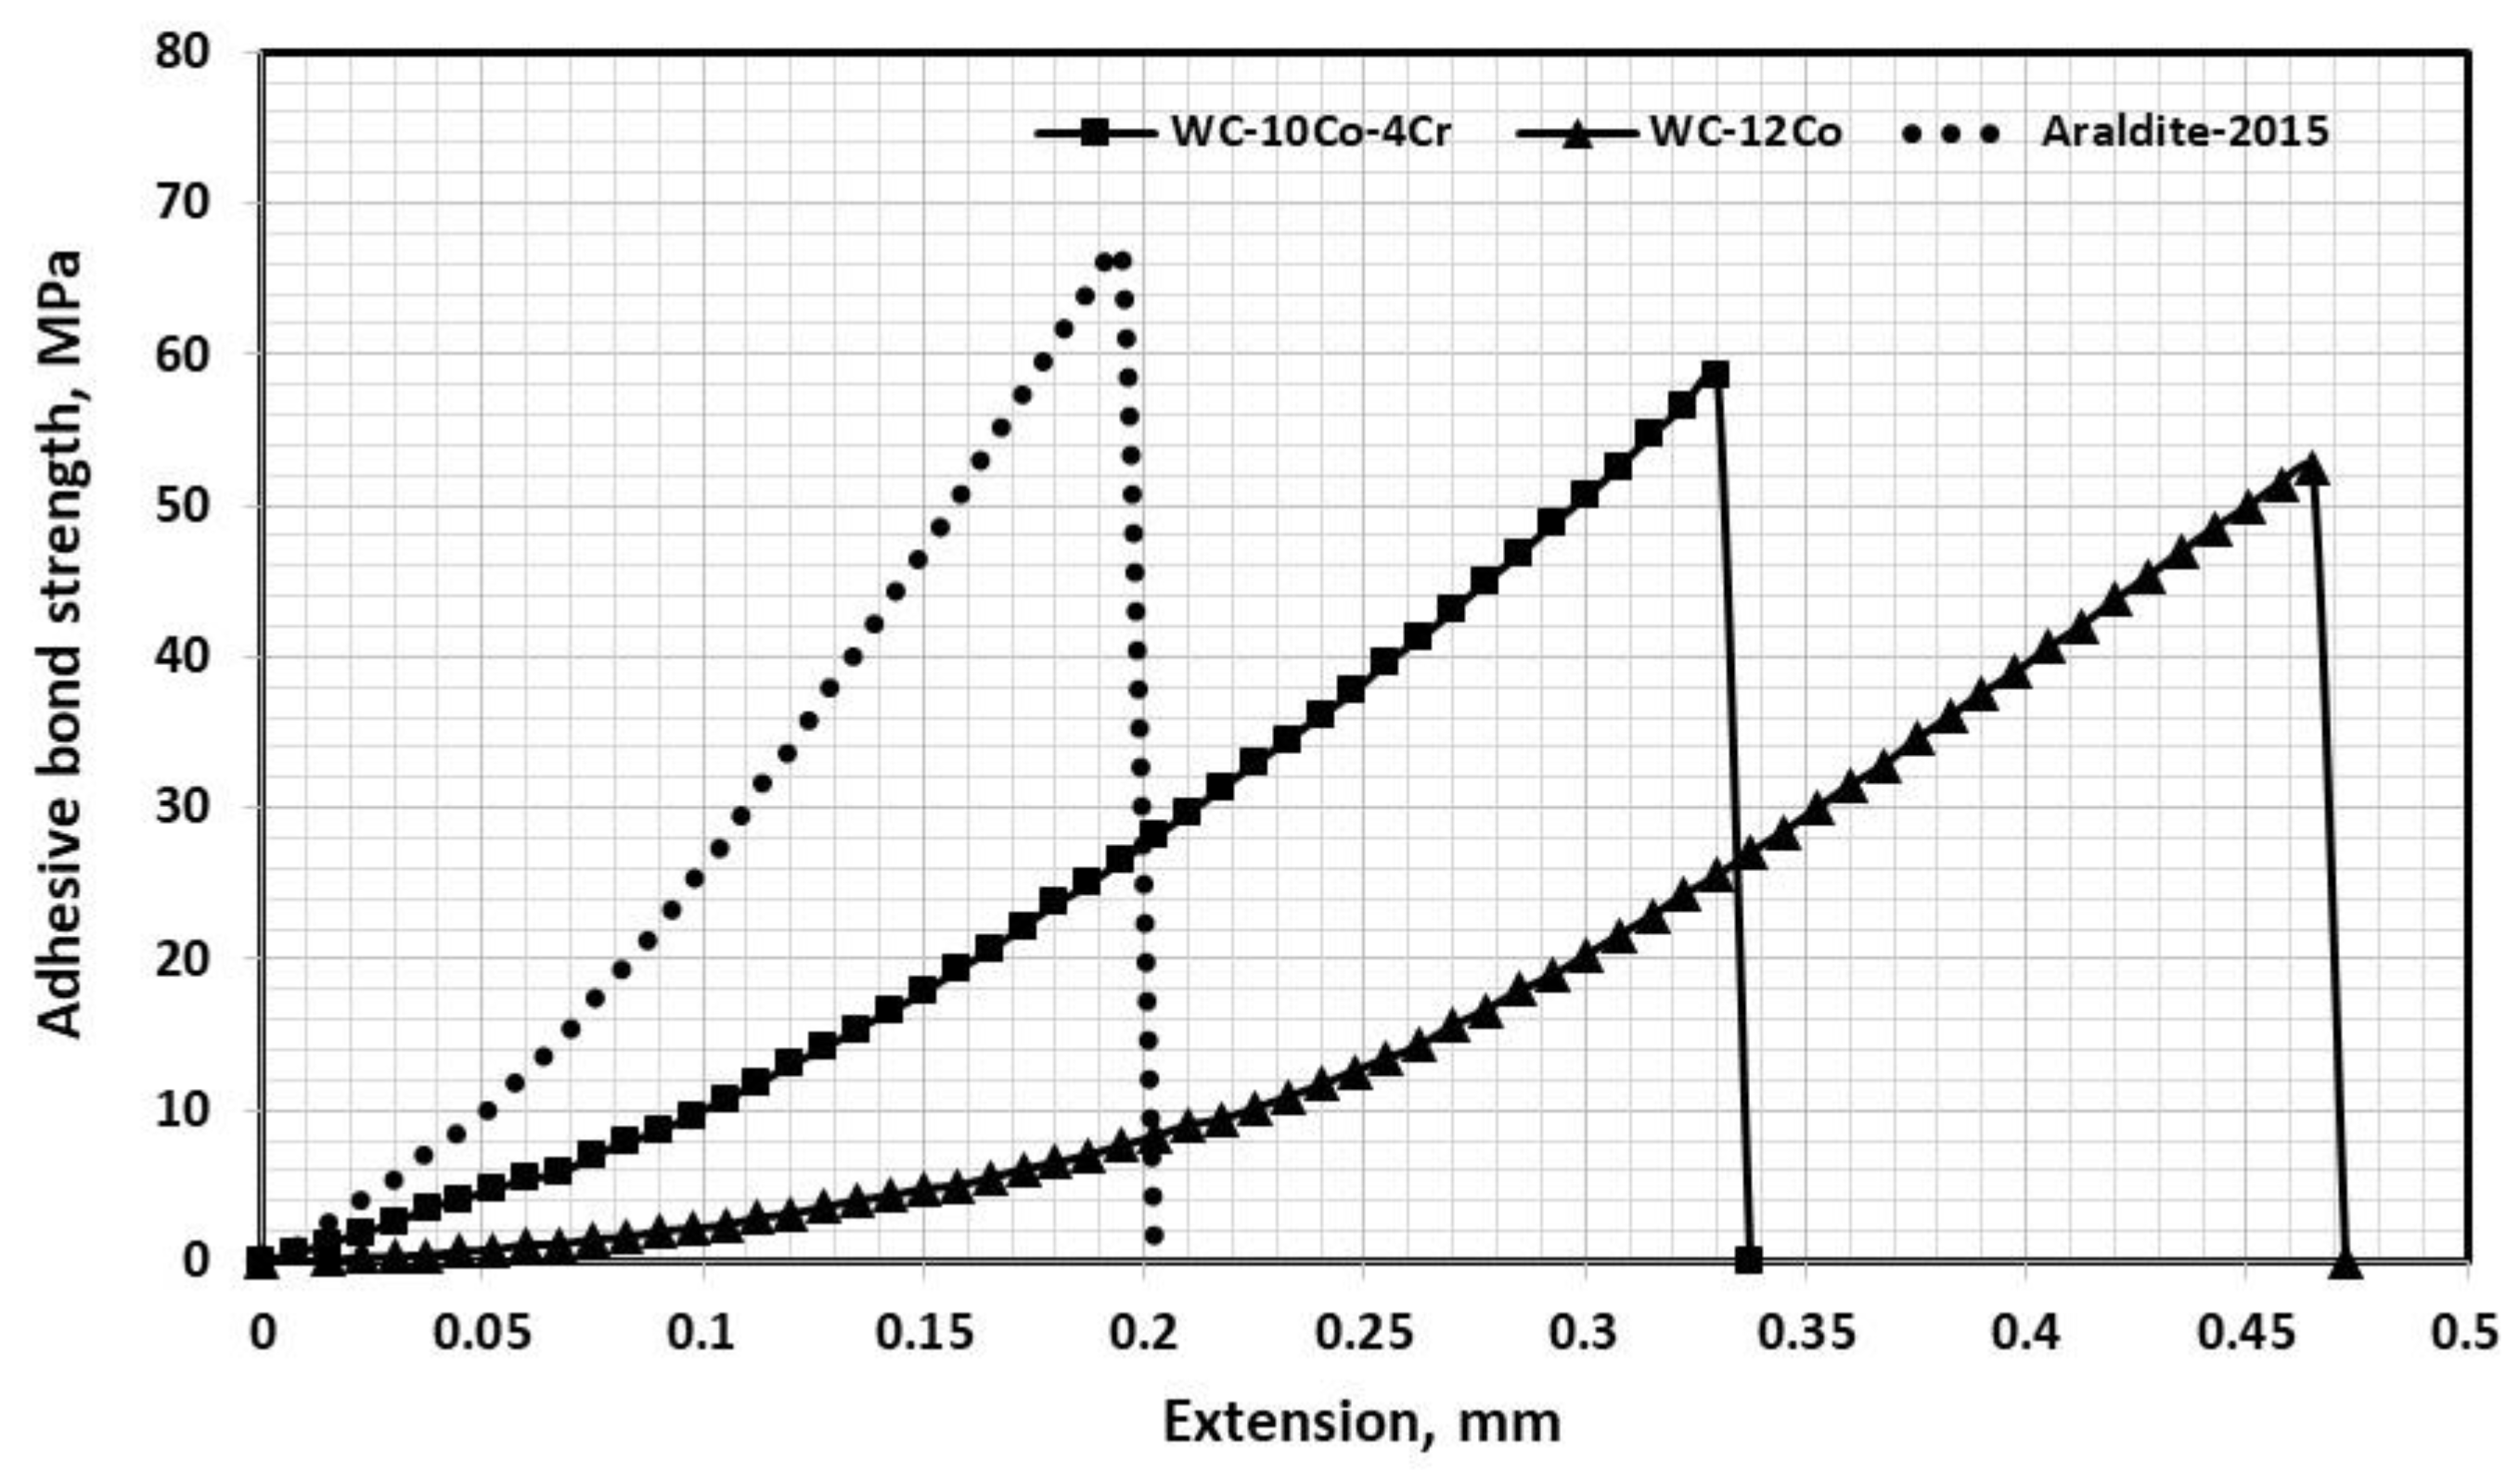
3.10. Tensile Adhesion/Bond Strength

In order to measure the adhesion/bonding strength between the coating layer and the substrate, ASTM “C633- 13” [28] was applied in which the bonded samples that were attached to a self-aligning loading device and subjected to tensile loading using a universal tensile testing machine; INSTRON 8835 at a constant speed of 1.00 mm/min according to standard. Araldite-2015 adhesive having 67 MPa tensile strength was used to bond both coating sides in the adhesion test. Here it should be noted that ASTM-C633-13 defined the adhesion strength of the coating given if failure is entirely at the coating-substrate interface, whereas, the cohesion strength of the coating is given if rupture is only within the coating. Figure 19 shows the adhesion bond strength of the two coatings investigated along with the tensile strength of the adhesive material. The adhesion strength and extension values of both types of coatings were close to each other but still slightly weaker than the adhesive material. The coating WC-10Co-4Cr, however, possessed higher adhesion bond strength and less extension (58.61 MPa, 0.34 mm) compared to the WC-12Co one (52.14 MPa, 0.47 mm). The adhesive bond strength/cohesion strength was calculated [28] as follows:
Adhesion or cohesion strength = maximum load/cross − sectional area.
The reason for this higher strength may be related to the smaller carbide particle size resulting from fragmentation due to their bombardment with the substrate giving the values of 0.875 and 0.287 µm for coatings WC-12Co and WC-10Co-4Cr respectively thus increasing the true surface area between carbide particles/binder with the rough substrate. The smaller particles are more able to lodge themselves with the molten binder into the substrate valleys compared to larger ones [29] hence creating a stronger bond. SEM images were taken at low magnifications for coated samples WC-12Co and WC-10Co-4Cr as shown in Figure 20a,d respectively. These figures show the surfaces at which failure occurred and whether the failure was at the coating/substrate interface or within the adhesive or coating material as stated in ASTM “C633- 13”. Generally, it can be noted from Figure 20a that the WC-12Co coated sample failed partially in the adhesive material and at the coating/substrate interface, whereas the WC-10Co-4Cr sample mainly failed at the coating/substrate interface as in Figure 20d. Furthermore, Figure 20b,c,e,f show images taken from the same samples (within circle) but at higher magnification. The failure location of WC-12Co coating occurred partially within the adhesive material as seen in Figure 20b,c constituting about 31% of the entire cross-section area. Sample WC-10Co-4Cr failed within the coating/substrate interface where one side still maintained the carbide particles in the binder matrix, whereas the other was the substrate as seen in Figure 20e,f, which may be the reason for having the higher adhesion strength with this coating type. Hence, based on the failure location it can be stated that the adhesion strength of WC-12Co coating is a result of a combined failure within the adhesive material and at the coating substrate via the coating layer itself, whereas WC-10Co-4Cr failed almost entirely at the coating/substrate interface giving the actual adhesion strength which indicates the superior cohesion between the Co-Cr matrix with WC particles compared to Co matrix with WC ones.

4. Conclusions

The following conclusions can be drawn based on the experimental results:
(1)
Microstructural testing showed that powder with smaller particles size was more prone to melting than the larger one leading to a smoother coating surface.
(2)
Some compositional variations were noticed from EDS test results between powder and coating due to decomposition, whereas, XRD indicated the occurrence of decarburization and showed that the extent of decarburization was more pronounced with the smaller particle size powder WC-12Co than with larger one WC-10C0-4Cr.
(3)
XRD tests of WC-12Co coating identified the presence of W2C and Co3W3C and Co6W6C (η-phase), whereas the same phases were present with WC-10C0-4Cr coating with the addition of Cr23C6 and Cr7C3 causing the former powder to be softer than the later one.
(4)
WC-10C0-4Cr coating is more erosion resistant than WC-12Co one due to its superior hardness as well as possessing less matrix free-path that erodes faster than carbide particles.
(5)
Adhesion strength between WC-10C0-4Cr coating layer and substrate was higher than that of WC-12Co due to the smaller carbide size in conjunction with the molten metallic binder being able to lodge itself within the substrate’s rough surface.

Author Contributions

M.M.E.R.: Conceptualization, Methodology, Investigation, Resources, Writing—original draft, Writing—review and editing, Funding acquisition. E.-S.M.S.: Methodology, Investigation, Writing—review and editing, Project administration, Supervision. H.S.A.: Methodology, Investigation, Writing—review and editing, Project administration. All authors have read and agreed to the published version of the manuscript.

Funding

This research was funded by the National Plan for Science, Technology and Innovation (MARRIFAH), King Abdulaziz City for Science and Technology, Kingdom of Saudi Arabia grant number (10-ADV1033-02).

Institutional Review Board Statement

Not applicable.

Informed Consent Statement

Not applicable.

Data Availability Statement

Not applicable.

Conflicts of Interest

The authors declare that they have no known competing financial interest or personal relationships that could have appeared to influence the work reported in this paper.

References

  1. Xie, M.; Zhang, S.; Li, M. Comparative investigation on HVOF sprayed carbide-based coatings. Appl. Surf. Sci. 2013, 273, 799–805. [Google Scholar] [CrossRef]
  2. Bulnes, A.G.; Fuentes, V.A.; Cano, I.G.; Dosta, S. Understanding the Influence of High Velocity Thermal Spray Techniques on the Properties of Different Anti-Wear WC-Based Coatings. Coatings 2020, 10, 1157. [Google Scholar] [CrossRef]
  3. Toma, D.; Brandl, W.; Marginean, G. Wear and corrosion behavior of thermally sprayed cermet coatings. Surf. Coat. Technol. 2001, 138, 149–158. [Google Scholar] [CrossRef]
  4. Richert, M.W.; Mikułowski, B.; Pałka, P.; Hotloś, A.; Perek-Nowak, M. The Effect of Chemical Composition and Thermal Sprayed Method on the Chromium and Tungsten Carbides Coatings Microstructure. J. Surf. Eng. Mater. Adv. Technol. 2013, 3, 1–5. [Google Scholar] [CrossRef] [Green Version]
  5. Schwetzke, R.; Kreye, H. Microstructure and Properties of Tungsten Carbide Coatings Sprayed with Various High- Velocity Oxygen Fuel Spray Systems. J. Therm. Spray Technol. 1999, 8, 433. [Google Scholar] [CrossRef]
  6. Wang, L.; Chen, H.; Liu, Y.; Gou, G.; Li, D. Effects of Cr on microstructure and hardness of HVOF-sprayed WC-Co coating. Adv. Mater. Res. 2011, 317–319, 301–306. [Google Scholar] [CrossRef]
  7. Fang, W.; Cho, T.Y.; Yoon, J.H.; Song, K.O.; Hur, S.K.; Youn, S.J.; Chun, H.G. Processing optimization, surface properties and wear behavior of HVOF spraying WC–CrC–Ni coating. J. Mater. Process. Technol. 2009, 209, 3561–3567. [Google Scholar] [CrossRef]
  8. Hadad, M.; Hockauf, M.; Meyer, L.W.; Marot, G.; Lesage, J.; Hitzek, R.; Siegmann, S. Adhesion evaluation of multilayered based WC–Co–Cr thermally sprayed coatings. Surf. Coat. Technol. 2008, 202, 4399–4405. [Google Scholar] [CrossRef]
  9. Sidhu, T.S.; Prakash, S.; Agrawal, R.D. Performance of High-Velocity Oxyfuel-Sprayed Coatings on an Fe-Based Superalloy in Na2SO4-60%V2O5 Environment at 900 °C, Part I: Characterization of the Coatings. J. Mater. Eng. Perform. 2006, 15, 122–129. [Google Scholar] [CrossRef]
  10. Jafari, M.; Enayati, M.H.; Salehi, M.; Nahvi, S.M.; Park, C.G. Comparison between oxidation kinetics of HVOF sprayed WC-12Co and WC-10Co-4Cr coatings. Int. J. Refract. Met. Hard Mater. 2013, 41, 78–84. [Google Scholar] [CrossRef]
  11. Yang, Q.; Senda, T.; Ohmori, A. Effect of carbide grain size on microstructure and sliding wear behavior of HVOF-sprayed WC–12% Co coatings. Wear 2003, 254, 23–34. [Google Scholar] [CrossRef]
  12. Wang, Q.; Zhang, S.; Cheng, Y.; Xiang, J.; Zhao, X.; Yang, G. Wear and corrosion performance of WC-10Co4Cr coatings deposited by different HVOF and HVAF spraying processes. Surf. Coat. Technol. 2013, 218, 127–136. [Google Scholar] [CrossRef]
  13. Al-Mutairi, S.; Hashmi, M.S.J.; Yilbas, B.S.; Stokes, J. Microstructural characterization of HVOF/plasma thermal spray of micro/nano WC–12%Co powders. Surf. Coat. Technol. 2015, 264, 175–186. [Google Scholar] [CrossRef]
  14. Pulsford, J.; Kamnis, S.; Murray, J.; Bai, M.; Hussain, T. Effect of Particle and Carbide Grain Sizes on a HVOAF WC-Co-Cr Coating for the Future Application on Internal Surfaces: Microstructure and Wear. J. Therm. Spray Technol. 2018, 27, 207–219. [Google Scholar] [CrossRef] [Green Version]
  15. Roy, M.; Pauschitz, A.; Bernardi, J.; Koch, T.; Franek, F. Microstructure and Mechanical Properties of HVOF Sprayed Nanocrystalline Cr3C2-25(NiCr) Coating. J. Therm. Spray Technol. 2006, 15, 372–381. [Google Scholar] [CrossRef]
  16. Mishra, T.K.; Kumar, A.; Sinha, S.K. Experimental investigation and study of HVOF sprayed WC-12Co, WC-10Co-4Cr and Cr3C2-25NiCr coating on its sliding wear behavior. Int. J. Refract. Met. Hard Mater. 2021, 94, 105404. [Google Scholar] [CrossRef]
  17. Ozbek, Y.Y.; Canikoglu, N.; Ipek, M. The Surface Properties of WC–Co–Cr Based Coatings Deposited by High Velocity Oxygen Fuel Spraying. Acta Phys. Pol. A 2017, 131, 186–189. [Google Scholar] [CrossRef]
  18. Kear, B.H.; Skandan, G.; Sadangi, R.K. Factors Controlling Decarburization in HVOF Sprayed Nano-WC/Co Hard coatings. Scr. Mater. 2001, 44, 1703–1707. [Google Scholar] [CrossRef]
  19. SNahvi, M.; Jafari, M. Microstructural and mechanical properties of advanced HVOF-sprayed WC-based cermet coatings. Surf. Coat. Technol. 2016, 286, 95–102. [Google Scholar]
  20. Stewart, D.A.; Shipway, P.H.; Cartney, D.G.M. Microstructural Evolution in Thermally Sprayed WC-Co Coating: Comparison between Nanocomposite and Conventional Starting Powders. Acta Mater. 2000, 48, 1593–1604. [Google Scholar] [CrossRef]
  21. Nerz, J.; Kushner, B.; Rotolico, A. Microstructural Evaluation of Tungsten Carbide-Cobalt Coatings. J. Therm. Spray Technol. 1992, 1, 147. [Google Scholar] [CrossRef]
  22. Guilemany, J.M.; de Paco, J.M.; Nutting, J.; Miguel, J.R. Characterization of the W2C Phase Formed during the High Velocity Oxygen Fuel Spraying of a WC+12 % Co Powder. Metall. Mater. Trans. A 1999, 30, 1913. [Google Scholar] [CrossRef]
  23. Ludwig, G.A.; Malfatti, C.F.; Schroeder, R.M.; Ferrari, V.Z.; Muller, I.L. WC10Co4Cr coatings deposited by HVOF on martensitic stainless steel for use in hydraulic turbines: Resistance to corrosion and slurry erosion. Surf. Coat. Technol. 2019, 377, 124918. [Google Scholar] [CrossRef]
  24. Pulsford, J.; Venturi, F.; Pala, Z.; Kamnis, S.; Hussain, T. Application of HVOF WC-Co-Cr coatings on the internal surface of small cylinders: Effect of internal diameter on the wear resistance. Wear 2019, 432, 202965. [Google Scholar] [CrossRef]
  25. Kumari, K.; Anand, K.; Bellacci, M.; Giannozzi, M. Effect of microstructure on abrasive wear behavior of thermally sprayed WC-10Co-4Cr coatings. Wear 2010, 265, 1309–1319. [Google Scholar] [CrossRef]
  26. Guilemany, J.M.; Nutting, J.; Llorca-lsern, N. Microstructural Examination of HVOF Chromium Carbide Coatings for High-Temperature Applications. J. Therm. Spray Technol. 1996, 5, 483–489. [Google Scholar] [CrossRef]
  27. Yuan, J.; Zhan, Q.; Huang, J.; Ding, S.; Li, H. Decarburization mechanisms of WC-Co during thermal spraying: Insights from controlled carbon loss and microstructure characterization. Mater. Chem. Phys. 2013, 142, 165–171. [Google Scholar] [CrossRef]
  28. ASTM C633-13; Standard Test Method for Adhesion or Cohesion Strength of Thermal Spray Coatings. R&B, Inc.: Colmar, PA, USA, 2021.
  29. Lyphout, C.; Nylen, P.; Östergren, L.G. Adhesion Strength of HVOF Sprayed IN718 Coatings. J. Therm. Spray Technol. 2012, 21, 86–95. [Google Scholar] [CrossRef]
Figure 1. Substrate surface after subjection to grit blasting. Arrows show dents occurring due to the impact of Al2O3 powder.
Crystals 12 00969 g001
Figure 2. Schematic diagram of the erosion test set-up.
Crystals 12 00969 g002
Figure 3. SEM Images of WC-12Co powder at two magnifications: (a) ×500, (b) ×1500, and (c) particle size distribution.
Crystals 12 00969 g003
Figure 4. SEM Images of WC-10Co-4Cr powder at two magnifications: (a) ×500, (b) ×1500 and (c) particle size distribution.
Crystals 12 00969 g004
Figure 5. SEM images of as-sprayed surface morphology of WC-12Co powder (ac) and WC-10Co-4Cr powder (df) at different magnifications.
Crystals 12 00969 g005
Figure 6. The roughness of as-coated surface compared to that of the substrate.
Crystals 12 00969 g006
Figure 7. Coating layer at different magnifications of WC-12Co (ac) and WC-10Co-4Cr (df) Note: black arrows point at the pullout zones.
Crystals 12 00969 g007aCrystals 12 00969 g007b
Figure 8. EDS characterization of: (a) WC-12Co and (b) WC-10Co-4Cr powder. (i,iv) Powder morphology; (ii,v) Element histogram; (iii,vi) Quantitative EDS results.
Crystals 12 00969 g008aCrystals 12 00969 g008b
Figure 9. EDS characterization of WC-12Co coating; (i): microstructure; (ii): Element histogram; (iii): Quantitative EDS results.
Crystals 12 00969 g009
Figure 10. Schematic presentation of decarburization. (a) Initial powder structure composed of WC particle covered with Co-binder. (b) Powder during flight where the binder melts and WC dissolute. (c) Phase of cooling down and decarburization. (d) Solidification of molten binder upon reaching the substrate.
Crystals 12 00969 g010
Figure 11. EDS characterization of WC-10Co-4Cr coating. (i): microstructure; (ii): Element histogram; (iii): Quantitative EDS results.
Crystals 12 00969 g011
Figure 12. XRD-patterns of WC-12Co in powder and coating conditions.
Crystals 12 00969 g012
Figure 13. XRD-patterns of WC-10Co-4Cr in powder and coating conditions.
Crystals 12 00969 g013
Figure 14. XRD-patterns comparing WC-12Co and WC-10Co-4Cr in coating condition.
Crystals 12 00969 g014
Figure 15. Microhardness distribution along the coated samples thickness.
Crystals 12 00969 g015
Figure 16. Erosion test results for both types of coating along with the bare substrate.
Crystals 12 00969 g016
Figure 17. Low magnification SEM images showing surface morphologies of; substrate (ac); WC-12Co coating; (df) and WC-10Co-4Cr coating; (gi). Note: (a) after shot blasting (blank), after erosion test for: (b) 2 h and (c) 3 h; (d) As-sprayed, after erosion test for: (e) 2 h and (f) 3 h; (g) As-sprayed, after erosion test for: (h) 2 h and (i) 3 h.
Crystals 12 00969 g017
Figure 18. Comparison between eroded surfaces (a) Substrate, (b) WC-12Co and (c) WC-10Co-4Cr. at 2 h: (i,iii,v) and 3 h: (ii,iv,vi).
Crystals 12 00969 g018
Figure 19. Adhesion bond strength vs. extension plots for adhesive and both types of coatings.
Crystals 12 00969 g019
Figure 20. SEM images of coating/substrate interface after tensile test of two coatings; WC-12Co: (ac); WC-10Co-4Cr: (df).
Crystals 12 00969 g020
Table 1. Chemical composition and mechanical properties of API-2H-Grade 50.
Chemical composition; wt.%C: 0.12Mn: 1.4P: 0.01S: 0.01Si: 0.3Cb: 0.02Ti: 0.02
Mechanical propertiesYield strength: 375 MPaTensile strength: 525 MPaElongation: 18%
Table 2. HVOF spray coating parameters.
Coating ParameterUnits
Fuel gas typeLPG
Oxygen flow rate (pressure)250 L/min (10 kg/cm2)
Fuel gas flow rate (pressure)60 L/min (7 kg/cm2)
Airflow rate (pressure)600 L/min (6 kg/cm2)
Spray distance≈250 mm
Nitrogen (carrier gas) pressure 6 kg/cm2
Powder feed rate 90 g/min
Table 3. Comparison between W2C peak parameters of WC-12Co and WC-10Co-4Cr coating.
WC-12CoWC-10Co-4Cr
Intensity Intensity
34.9331535.09216
38.4732338.58311
52.817952.9170
62.774262.7735
70.417170.7126
Publisher’s Note: MDPI stays neutral with regard to jurisdictional claims in published maps and institutional affiliations.

