Review

Semiconductor Quantum Dots as Target Analytes: Properties, Surface Chemistry and Detection

by
Jesús Sanmartín-Matalobos
1,*,
Pilar Bermejo-Barrera
2,
Manuel Aboal-Somoza
2,
Matilde Fondo
1,
Ana M. García-Deibe
1,*,
Julio Corredoira-Vázquez
1 and
Yeneva Alves-Iglesias
1,2
1
Coordination and Supramolecular Chemistry Group (SupraMetal), Department of Inorganic Chemistry, Faculty of Chemistry, Institute of Materials (iMATUS), Universidade de Santiago de Compostela, Avenida das Ciencias s/n, 15782 Santiago de Compostela, Spain
2
Trace Element, Speciation and Spectroscopy Group (GETEE), Department of Analytical Chemistry, Nutrition and Bromatology, Faculty of Chemistry, Institute of Materials (iMATUS), Universidade de Santiago de Compostela, Avenida das Ciencias s/n, 15782 Santiago de Compostela, Spain
*
Authors to whom correspondence should be addressed.
Nanomaterials 2022, 12(14), 2501; https://doi.org/10.3390/nano12142501
Submission received: 10 July 2022 / Revised: 17 July 2022 / Accepted: 19 July 2022 / Published: 21 July 2022
(This article belongs to the Special Issue Nanoparticle Analysis, Toxicity and Environmental Impact)

Abstract

:
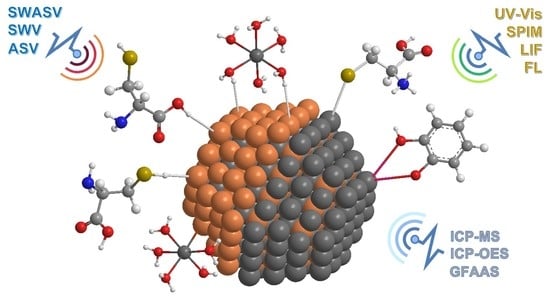
Since the discovery of Quantum Dots (QDs) by Alexey I. Ekimov in 1981, the interest of researchers in that particular type of nanomaterials (NMs) with unique optical and electrical properties has been increasing year by year. Thus, since 2009, the number of scientific articles published on this topic has not been less than a thousand a year. The increasing use of QDs due to their biomedical, pharmaceutical, biological, photovoltaics or computing applications, as well as many other high-tech uses such as for displays and solid-state lighting (SSL), has given rise to a considerable number of studies about its potential toxicity. However, there are a really low number of reported studies on the detection and quantification of QDs, and these include ICP–MS and electrochemical analysis, which are the most common quantification techniques employed for this purpose. The knowledge of chemical phenomena occurring on the surface of QDs is crucial for understanding the interactions of QDs with species dissolved in the dispersion medium, while it paves the way for a widespread use of chemosensors to facilitate its detection. Keeping in mind both human health and environmental risks of QDs as well as the scarcity of analytical techniques and methodological approaches for their detection, the adaptation of existing techniques and methods used with other NMs appears necessary. In order to provide a multidisciplinary perspective on QD detection, this review focused on three interrelated key aspects of QDs: properties, surface chemistry and detection.

Graphical Abstract

1. Introduction

Quantum dots (QDs) mostly consist of semiconductor inorganic materials (e.g., CdTe, CdSe, CdS or PbSe) with diameters typically in a range of 2–10 nm, corresponding to 100 to 100,000 atoms within the nanoparticle volume. Their composition and extremely small size are responsible for their unique optical properties (such as their absorption and emission maximum wavelengths, as well as their bandwidths) and electrical properties, such as their conductivity and charge carrier type, i.e., holes or electrons.
QDs yield emission wavelengths spanning from the infrared to the ultraviolet region of the electromagnetic spectrum. QDs with diameters of 5–6 nm emit longer wavelengths if excited by UV light, while smaller ones with diameters in a range of 2–3 nm emit shorter wavelengths. Since electrons within QDs are confined to discrete energy levels, which are governed by the particle size (the smaller the particle size, the larger the band gap) [1], the emission wavelengths are tuneable by changing the size of QDs and, of course, its chemical composition. As occurring with the optical properties of QDs, electrical properties can be also highly tuneable, which makes them very interesting for a number of applications [2,3,4].
QDs are among the most investigated materials because of their biomedical, pharmaceutical, biological, photovoltaics and computing applications, as well as due to many other high-tech usages, such as displays and solid-state lighting (SSL). Most of the QDs used in analytical applications are core/shell structures [5] rather than conventional simple QDs. Core/Shell QDs (CS QDs) are composed of a semiconducting core material surrounded by a shell of a distinct semiconducting material. A critical advantage of CS QDs over simple QDs is that CS QDs can improve properties or even display some other ones, which cannot be shown by simple QDs.
The possible release into the solution of toxic or poisonous ions such as Cd2+, Pb2+, Se2− or Te2−, even at low concentrations, has raised concerns about the potential impact of QDs both on human health and environment. However, its toxicity has been questioned because of the discrepancy between results obtained from in vitro and in vivo studies on CdSe QDs [6]. While the toxicity of CdSe has not been unquestionably demonstrated using in vivo experiments in animal models, in vitro experiments have shown that QDs can cause cytotoxicity by releasing Cd2+ ions into solution and by generating free radical species. Therefore, a deeper knowledge of the surface chemistry of QDs is essential for a better comprehension of how they may interact with biological systems such as proteins, peptides, oligonucleotides and humic acids or with synthetic organic substances, such as thiol-based ligands. Both natural and synthetic species can bring electron density within the coordination sphere of the metal ion, with the destabilisation of bonds in the surface lattice of QDs, leading to the release of ions into the solution. Hence, the main concepts of surface coordination chemistry should be briefly reviewed for a better understanding of the QDs reactivity, either with a view to its stability, toxicity or eventually its detection.
By contrast, carbon-containing NMs, such as carbon QDs (CQDs) or graphene QDs (GQDs), do not present potential toxicity, as they lack toxic ions. Moreover, these QDs display a wide variety of applications, such as bioimaging, sensors, photovoltaics, etc. [7,8]. Regarding the synthesis of carbon-based NMs, in theory, it can be as expensive as the synthesis of any other NMs. However, economical and facile technologies for the obtention of carbon-based materials (QDs among them) from biological resources are currently well-documented. For instance, the recycling of a waste material such as crayfish-shell derivatives [9] or the use of fungal mycelium-based materials [10] can be the base to prepare NMs. Undoubtedly, these topics open a wide variety of promising possibilities for the future of nanotechnology.
A current challenge for researchers in the field of analytical chemistry is to develop innovative approaches or to adapt existing analytical methods used with NMs to detect and quantify QDs. In addition, methodology should be applicable to track QDs quantitatively not only in homogeneous samples but also in complex samples and at realistic concentrations. Until now, there is a remarkably low number of studies reporting the detection and quantification of QDs, including ICP–MS and electrochemical analysis, which are the most common quantification techniques used for this purpose. The quantification of graphene QDs in aqueous samples using its intrinsic fluorescence emission has been reported by Benítez-Martínez and Valcárcel [7]. Lewinski et al. [11] reported the quantification of water solubilised CdSe/ZnS QDs in a small planktonic crustacean by using ICP–MS measurements in combination with confocal fluorescence microscopy. Medina-Sánchez et al. [12] presented the electrochemical detection of CdS by using a hybrid polydimethylsiloxane-polycarbonate (PDMS–PC) microfluidic platform with an integrated screen-printed electrode (SPE).
During the past ten years, several review articles have focused on the properties [2,13,14,15], applications [2,3,4,13,14,15,16,17,18,19,20,21,22], toxicity [6,15,21,22,23,24,25,26,27,28,29,30,31,32,33,34,35], synthesis [14,16,17,18,22,29,36], characterisation [16,17,37,38,39,40] and functionalisation [29,32,41,42,43] of QDs, but to the best of our knowledge, there are no reviews reporting detection methods for QDs. The aim of this paper is to review the essential knowledge on QDs as target analytes. We will focus on three interrelated key aspects of QDs: the effect of size and composition on properties, surface chemistry and detection from a multidisciplinary perspective. Moreover, the used analytical methods suitable for the detection and characterisation of NMs showing potential capabilities to be used with QDs are considered.

2. The Effect of Size and Composition on Properties of QDs

The unique optical and electrical properties of QDs are between that of a bulk material and discrete molecules. The keys to understanding the properties of QDs are both their small size and their chemical composition.
The particle size of QDs is typically in the range of 2–10 nm in diameter [44], although QDs with 2–50 nm diameters and even larger have been reported. However, the smallest ones display the most interesting properties, showing drastic differences with larger NMs in optical absorptions, exciton binding energies and the decay of the exciton. An exciton (electron-hole pair) is created when an electron leaves the valence band and enters the conduction band due to the excitation of QDs (Figure 1). This gives rise to an empty state in the valence band, i.e., a hole, which can be thought as a positive charge. In excitons, a weak columbic force of attraction exists between the hole and electron pair, and the average separation distance between them is known as the exciton Bohr radius. The exciton Bohr radius (αB) of a NM can be calculated using the following equation [45], where h is the Planck’s constant, ε is the dielectric constant, e is the electron charge, me* is the effective mass of the electron, and mh* is the effective mass of the hole.
α B = h 2 · ε e 2 1 m e * + 1 m h *
After excitation, which causes the formation of the exciton, both electrons and holes rapidly move to energy levels near the confinement energies of excited electron and hole, respectively, and then electron-hole pair recombination occurs. The released energy can be calculated as the sum of the following three terms: the confinement energies of the excited electron and hole, the band gap energy and the bond energy of the exciton.
It must be noted that, in bulk materials, the particle sizes are much larger than the exciton Bohr radius such that the energy levels form continuous bands of energy rather than discrete energy levels. As a result, the conduction band and valence band in bulk materials are separated by a relatively small band gap, if compared to the band gap of QD materials. In contrast, as the size of QDs is less than twice the bulk exciton Bohr radius [45], the energy levels are discrete, resulting in a larger band gap in comparison with that of bulk materials. Therefore, the band gap increases with decreasing particle sizes, and inversely, an increase in size leads to a lower band gap. The optical band gap (i.e., the threshold energy for photons to be absorbed) of simple QDs can be determined from UV–Vis absorption data using the Tauc plot method [46], extrapolating the linear part of the plot to the x-axis. Typically, a Tauc plot shows hν on the x-axis and (α·hν)1/γ on the y-axis [47], where α is the absorption coefficient of the NM (i.e., absorbance/thickness of sample), h is the Planck constant and ν is the frequency of the photon (i.e., c/λabs). The γ factor depends on the nature of the electron transition, and it is equal to 1/2 or 2 for the direct and indirect transition band gaps, respectively. The Tauc method assumes that the energy-dependent absorption coefficient α can be expressed by the following equation, where Eg is the band gap energy, B is a constant and the remaining terms of the equation have been already indicated.
α   ·   h ν 1 / γ = B h ν     E g
The band gap is a very important parameter of QDs, since it determines some of their properties. The size-dependent band gap of quantum dots can be explained in terms of the quantum confinement effect [1,48]. In QDs, excitons are under a three-dimensional confinement that results in the quantisation of the electron and hole energy levels. Semiconductor materials of size less than double the bulk exciton Bohr radius undergo quantum confinement. As examples, the quantum confinement effect will be observed in CdS, CdSe and CdTe NMs when their particle diameters are less than ~5.8 nm, 11.2 nm and 20.0 nm, respectively. Thus, bulk exciton Bohr radius and, by extension, composition determine the size from which a material exhibits quantum confinement effects and, consequently, unique optical and electronic properties of QDs. Since electrons within QDs are confined to discrete energy levels, the wavelengths associated with the formation and recombination of excitons (i.e., the UV–Vis absorption and fluorescence emission maximum wavelengths of QDs, respectively) are tuneable by changing the particle’s size. With decreasing size, the wavelengths of fluorescence and absorption decrease. Table 1 shows the values of the maximum wavelength for fluorescence emission and visible absorption spectra corresponding to CdSe QDs with particle diameters in the 1.8–7.3 nm range, as a representative example of the effect of size on fluorescence emission and absorption in the visible range [49].
The range over which the band gap energy and, therefore, wavelength of fluorescence and absorption can be tuned by quantum confinement depends not only on the size particle but also on the composition of the material. Band gap energy (Eg) varies with the composition of the material following two trends. (i) Eg decreases when proceeding down a group in the periodic table of the elements. This is because Eg is related to the energy difference between bonding and antibonding molecular orbitals, which decreases as the principal quantum number (n) increases. (ii) The band gap’s energy increases with the increase in ionicity in isoelectronic compounds. This can be understood by having in mind that an increase in electronegativity differences between atoms (Δχ) lead to an increase in the energy difference between bonding and antibonding orbitals.
QDs mostly consist of semiconductor inorganic materials, which are usually prepared with elements belonging to groups 12–16 of the periodic table (binary II–VI type QDs) and 14–16 (binary IV–VI type QDs). Although less researched, there are many others, such as metal-free elemental QDs (unary IV type QDs) and, of course, inorganic QDs, such as binary III–V type QDs, ternary I–III–VI type QDs and quaternary I–II–IV–VI type QDs. All these materials, both bulk and QD forms, have band gap energies ≤4.0 eV and, therefore, are semiconductors. Band gap energy for a few materials, which are commonly used to prepare QDs, are provided in Table 2 [14,50,51,52]. An appropriate selection of both size and composition can lead to fluorescence wavelengths in both visible (380–750 nm) and near-infrared (750–2500 nm) ranges.
Among QDs, the so-called core/shell QDs (CS QDs) exhibit improved chemical and physical properties over conventional simple QDs due to a shell of a second semiconductor layer material that surrounds the core [5]. Furthermore, the shell provides protection against environmental changes and photo-oxidative degradation. CS QDs can be categorised according to the difference between the band gap energy (Eg) of the core and the shell into the following three main groups (Figure 2) [5].
Type I: The band gap of the core material is smaller than that of the shell (Eg (shell) > Eg (core)), leading to the localisation of both electrons and holes in the core, which occurs in CdTe/ZnS QDs. Reverse type I: The band gap of the shell material is smaller than that of the core (Eg (core) > Eg (shell)), which leads to the localisation of both electrons and holes in the shell (e.g., CdS/CdSe QDs). Type II: The bandgap of both core and shell materials has a similar value (Eg (core)~Eg (shell)); this leads to the localisation of the electrons in the shell and the holes in the core or vice versa, as occurs in CdTe/CdSe QDs and CdS/ZnSe QDs, respectively. Type I CS QDs are the most common in bioanalytical applications since this configuration provides the best confinement of the exciton and the highest rates of radiative electron-hole recombination (i.e., brightness of the photoluminescence).
QDs are frequently coated with an external layer or protective shell responsible for stability, solubility and functionalisation. This is commonly achieved using surface ligands. Surface ligands also enable control over the stability of QDs dispersions in polar or nonpolar solvents via both steric and electrostatic mechanisms. Organic ligands with hydrophilic tails, such as –COOH, –OH, –SH, etc., are chosen to produce water soluble QDs. By contrast, ligands featuring a hydrocarbon tail, such as long-chain alkyl phosphines, alkyl phosphine oxides, alkyl amines and alkyl thiols, etc., can afford QDs with higher solubility in nonpolar solvents. The external layer of passivating ligands enhances the stability of QDs by preserving under-coordinated atoms existing on the outermost layer of the core material against chemical processes, such as oxidation and degradation. This is of crucial importance in QDs composed of a cadmium-based core material, such as those used as diagnostic and therapeutic tools in nanomedicine. CdS QDs have been coated with different surface ligands, such as glutathione [53,54] and N-acetyl-l-cysteine [53]. Owens et al. [55] synthesised both CdSe and ZnSe QDs protected with several organic ligands such as thioglycolic acid (TGA), thioglycerol (TGL) or glutathione (GSH), with varying thiol-to-metal ratios. Likewise, Gallagher et al. [56] coated CdSe/ZnS QDs with tri-n-octylphosphine oxide (TOPO). Many polymer coatings are also suitable as protective shells on the surface of QDs. As examples, we can mention poly-vinyl alcohol (PVA), poly-methyl methacrylate (PMMA), poly-ethylene glycol (PEG) and poly-lactide-co-glycolides (PLGA). In the case of CdSe/ZnS QDs, these have been coated with amphiphilic polymers such as poly(acrylic acid)-octylamine and poly(maleic anhydride-alt-1-octadecene), previous to a further conjugation with methyl-polyethylene glycol-amine [11] or with PMMA [56].
The surface functionalisation of QDs for improved water solubility has the advantage of favouring its detection in aqueous media [54] but with the inconvenience of increasing its potential toxicity. This may be due to the release of Cd2+ ions [53,56] and fragments that result from QD weathering [53] or to the generation of reactive oxygen species (ROS). Therefore, a deeper understanding of the toxicity of coated QDs under real-life conditions is more than desirable [11].

3. Surface Chemistry of QDs

Because of their small size, QDs have a high ratio of surface atoms to core atoms, which causes the surface atoms to play a decisive role not only in their properties but also in the reactivity of the entire particle. As Table 3 shows, the percentage of surface atoms rapidly increases when the particle size is less than 10 nm. As the particle size reduces to 1 nm, the surface atomic percentage will be approximately 90%, and the atoms are mostly concentrated on the surface of QDs.
The lattice termination on the QD surface has as a consequence that surface atoms are typically undercoordinated, which makes them more reactive than those ones in the core. Although surface atoms are coordinated to passivating ligands, which are commonly used to prevent the agglomeration and growth of QDs, some degree of undercoordination prevails because of the steric hindrance between ligands. This effect has been demonstrated by the spectroscopic studies of the QD’s surface using the following analytical techniques: nuclear magnetic resonance spectroscopy (NMR), Fourier transform infrared spectroscopy (FTIR), extended X-ray absorption fine structure spectroscopy (EXAFS) and Rutherford backscattering spectroscopy (RBS) [57,58,59,60].
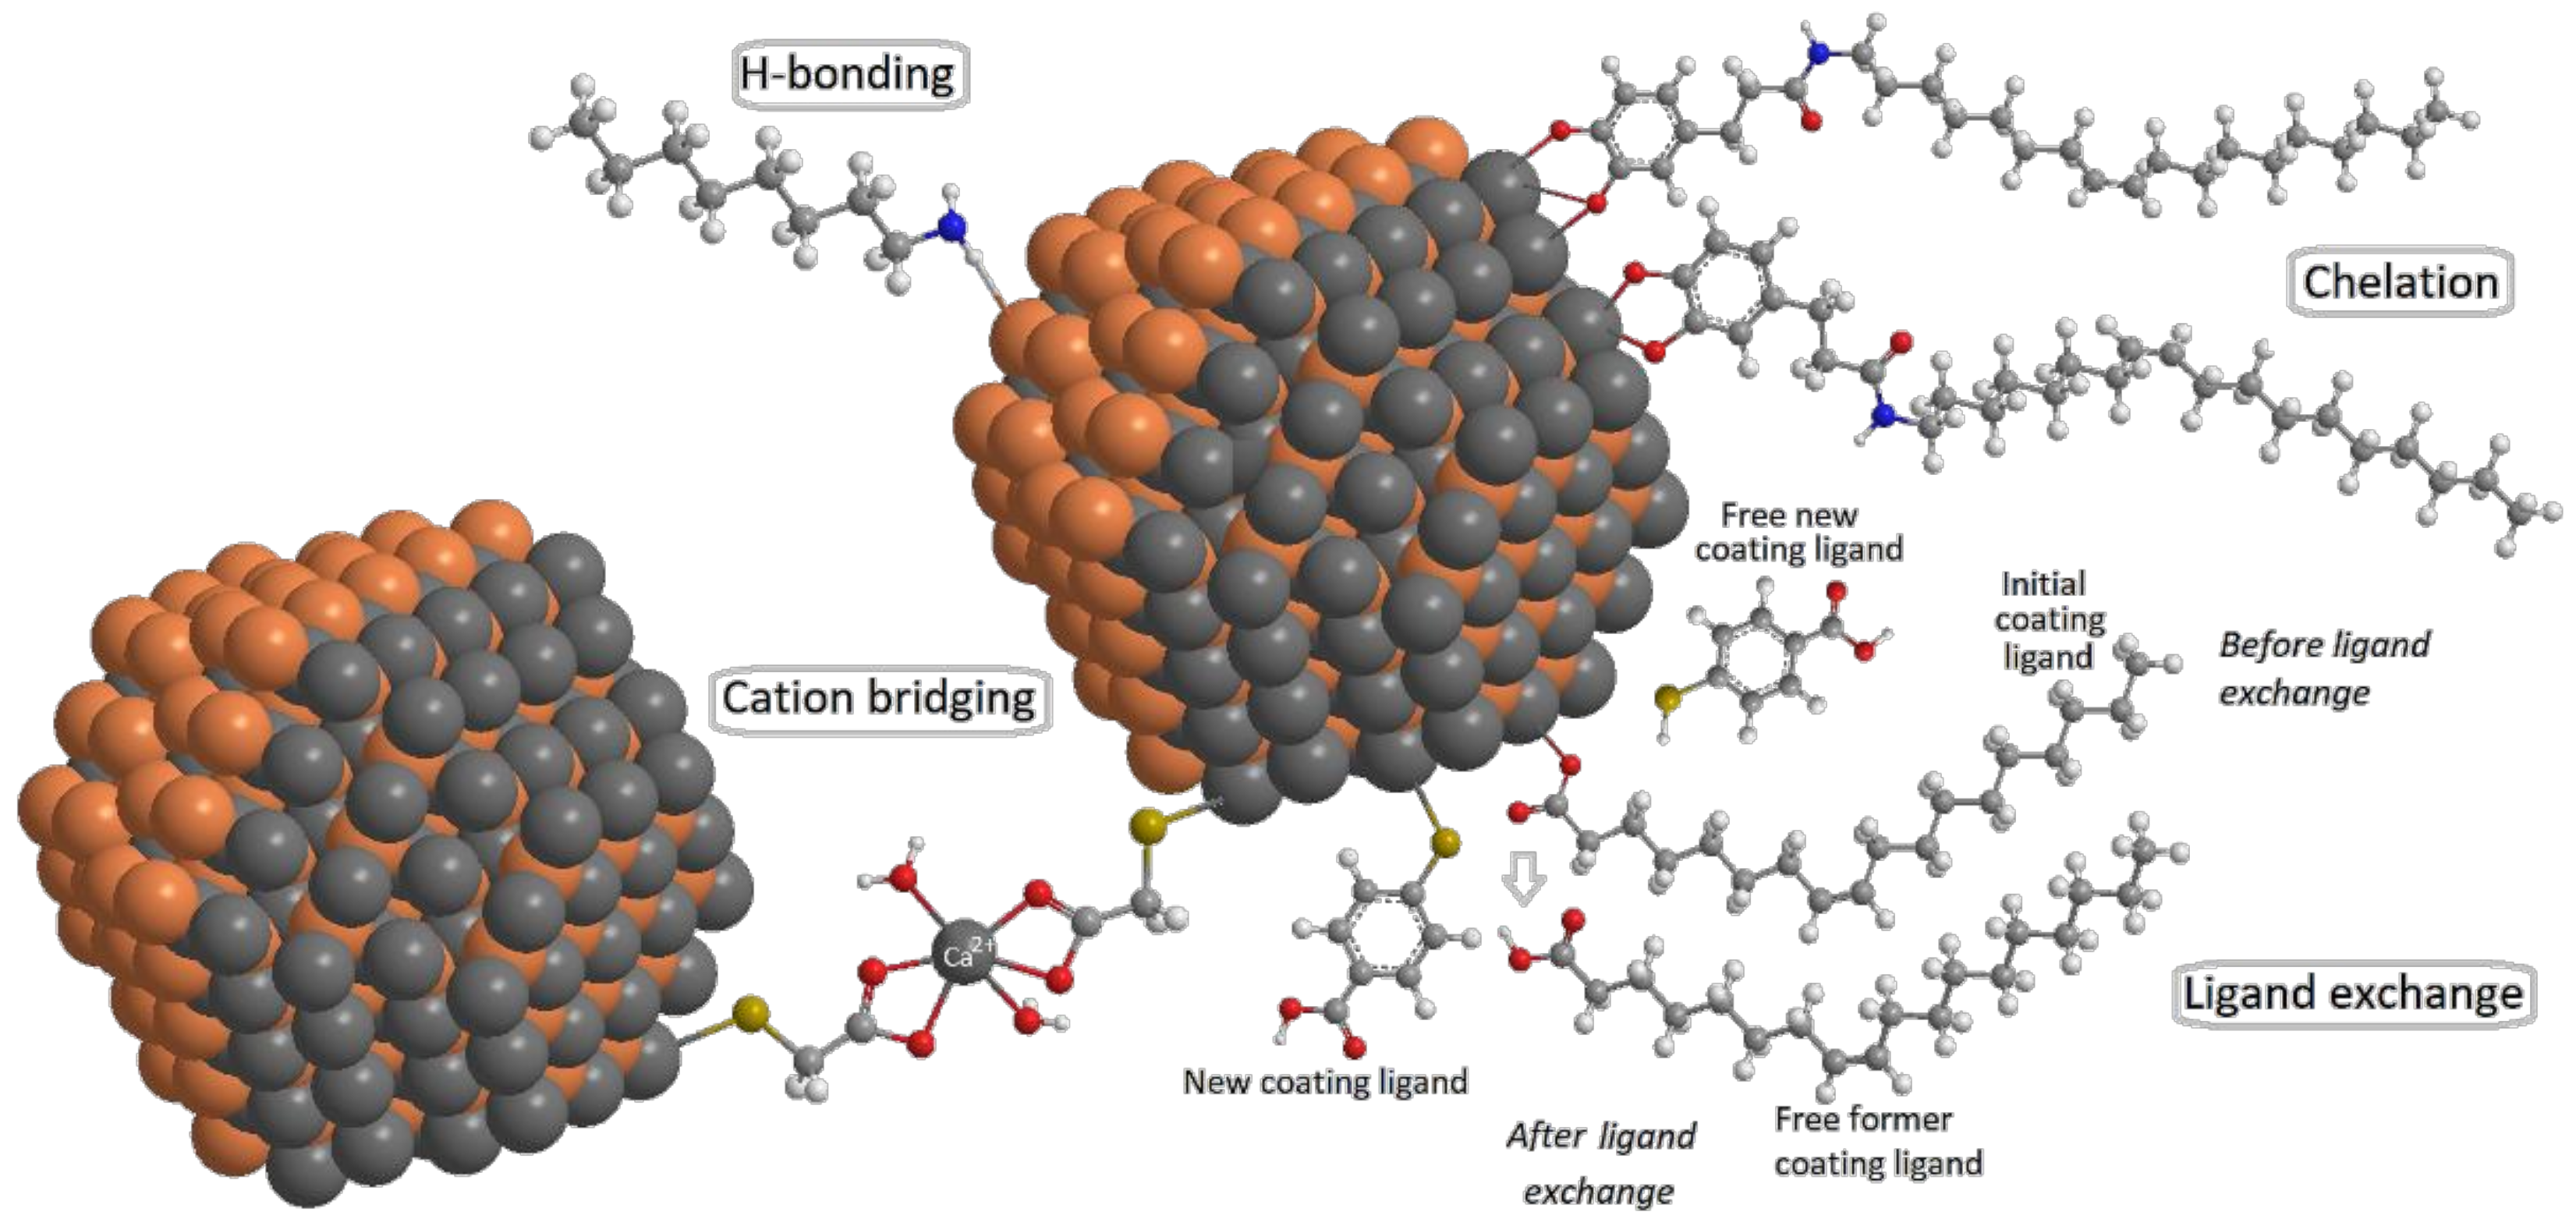
The typical processes in the reaction of dissolved ligands (adsorbates) with nanomaterial surfaces (adsorbents) can be classified into two general types: physisorption and chemisorption [61]. However, it must be noted that no sharp distinction can be made between the forces involved in these interactions, and intermediate cases exist. This is the case of adsorption involving strong hydrogen bonds or weak charge transfer. On the one hand, physisorption (or physical adsorption) is adsorption in which binding energy is typically in the range of 0.010–0.300 eV. Forces such as weak hydrogen bonds, electrostatic interactions, van der Waals interactions, hydrophobic interactions, etc., are involved in physisorption. On the other hand, chemisorption (or chemical adsorption) involves binding energies with typical values in the range of 1–10 eV. The forces involved in chemisorption are valence forces of the same kind as those operating in the formation of chemical compounds, such as the formation of coordinate bonds, or even adsorption involving strong hydrogen bonds. Among the possible chemical adsorption modes of organic adsorbates on the surfaces of NMs, ligand exchange, cation bridging and chelation (Figure 3) are reported.

3.1. Interactions between NMs and Surface Ligands

It is noteworthy that several different modes of interaction have been proposed to explain the adsorption behaviour of organic ligands on NM surfaces, but in most cases, more than one interaction is involved. In addition, their relative contributions may vary depending on the chemical nature of the organic ligand, the NM and the solvent. Below, hydrophobic, π–π and electrostatic interactions, as well as hydrogen bonds, cation bridging, ligand exchange and surface anions chelation, are briefly commented upon.
Hydrophobic interactions preferentially occur between the nonpolar regions of organic adsorbates and NMs, similarly to carbon QDs, have nonpolar surfaces [62]. Thus, the aromatic moieties of organic ligands can be weakly adsorbed on carbon nanomaterial surfaces by hydrophobic effects [63]. The weaker adsorption of organic ligands to the carbon NM surface at higher pH values evidences that the ionisation of functional groups decreased hydrophobic effects, showing that this interaction type is pH-dependent.
Regarding π–π interactions, they can occur between organic ligands containing aromatic moieties (or C=C double bonds) and the π electrons of benzene rings on the surface of NMs, such as carbon QDs [64,65]. π–π electron coupling may be influenced by the number of conjugate groups and the relative position of aromatic rings of adsorbates to benzene rings on carbon NM surfaces [66].
When organic adsorbates and nanomaterials are oppositely charged, an electrostatic interaction can exist between them. In fact, the solvation of nanomaterial surfaces by the addition of capping agents used to stabilise bare nanomaterials, or simply because of the point of zero charge (PZC), can lead to charged nanomaterials [67,68]. Likewise, there is a number of organic adsorbates for which their charges are pH-dependent. Accordingly, the net negative charge on the adsorbate increases with high pH values because of the ionisation of acidic groups, whereas the positive charge can increase with reduced pH because of the protonation of basic groups. Therefore, the electrostatic interaction is strongly pH-dependent.
Hydrogen bonds can also occur when organic adsorbates and nanomaterials contain polar functional groups, such as –COOH, –OH, –NH2, etc., which have high electronegativities. These groups can act as hydrogen-bonding donors, since they have a highly polar hydrogen atom bonded to an electronegative atom (mostly N, O and F) and, therefore, can establish H-bonds with other atoms with a partial negative charge. At the same time, since N, O and F atoms on polar functional groups have a partial negative charge, they can accept H-bonds from other atoms by sharing their lone electron pairs [69]. Therefore, hydrogen bonding interactions have been reported between organic adsorbates and carbon-based nanomaterials [70]. H-bonding interactions are also strongly dependent on pH, and an increase in pH could lead to the deprotonation of acidic functional groups such as –COOH and –OH moieties, which would reduce the number of H-bonding donors.
With regard to cation bridging or bridging chelation, this interaction occurs when anionic or polar functional groups (typically carboxylate-terminated ligands) become bound to a multivalent metal ion that is adsorbed to a negatively charged NM surface. Zhang et al. [71] studied the stability of thioglycolate-capped CdTe QDs in monovalent and polyvalent electrolytes. They observed that the QDs remained stable even at 150 mM KCl solution while aggregates occurred at relatively low concentrations (≤2 meq L−1) of divalent cations. It was concluded that multivalent cations (Ca2+ and Al3+, etc.) may react with the capping ligands of QDs to form complexes that bridge QDs, which induces the formation of settleable QD flocs. As the cation bridging effect not only occurs between adsorbates and NMs but can also exist between adjacent organic adsorbate interfaces, the multilayer adsorption of organic adsorbates onto NM surfaces could be expected. Meanwhile, the compression of electric double layers by cations and the increase in hydrophobicity of organic adsorbates also promote its adsorption [72].
A process leading to the desorption of original surface ligands is ligand exchange, which can be used during the synthesis of QDs to adsorb new ligands, with the aim of changing their optical properties [73,74,75]. Thus, the substitution can affect certain aspects such as head or tail groups or the chain’s length. Surface ligands can be classified into three types according by the number of donated electrons (2, 1 or 0) into L-, X- or Z-types [74,75]. L-type ligands (Lewis bases) are neutral with two electrons coordinated to surface metal ions, e.g., amines (RNH2), phosphines (R3P), phosphine oxides (R3PO), etc. Anions that offer one electron are often categorised as X-type ligands, such as carboxylates (RCOO), thiolates (RS), halides (Cl), etc., which interact with either metal or nonmetal ions. Finally, Z-type ligands (Lewis acids) usually serve as acceptors of electrons, binding anions on QDs’ surface. Examples of Z–type ligands include CdX2, PbX2, etc.
Surface anion chelation occurs when the interaction between the surface of the QDs and the organic adsorbate ligand occurs via a direct bidentate interaction [76], as Figure 3 shows. Both fulvic and humic acids, as well as catechols, are good examples of organic ligands with two oxygen atoms of neighbouring phenol groups forming a strong chelating bond to surface metal ion [77,78,79].

3.2. Analytical Techniques for Characterising the Interactions between NMs and Surface Ligands

A brief comment about what data can be obtained from some common analytical techniques can be found below. This information can be used to study the interaction between NMs and surface ligands. It is rather unusual that researchers obtain data by just one analytical technique but from two or more of them given the complementary information that those techniques provide.

3.2.1. Nuclear Magnetic Resonance (NMR)

NMR spectroscopy allows characterisation with non-destructive perturbations of the sample, providing rapid and remarkable information about the chemical environment of the analysed nuclei. The combination of both 1D (1H, 13C, 31P, 17F, etc.) and 2D experiments, such as COSY, NOESY, ROESY, TOCSY, DOSY, HETCOR, J–RES, INADEQUATE, HSQC, HMBC, etc., for liquids; and CRAMPS, CP/MAS, TOSS, DRAWS, REDOR, etc., for solids, considerably facilitate the identification of interactions occurring between NMs and surface ligands [80,81]. Thus, it has been shown that DOSY (diffusion ordered spectroscopy) makes the accurate assignment of specific resonances in 1D 1H spectra relative to bound ligands possible [82,83], while NOESY (nuclear Overhauser effect spectroscopy) enabled NM-ligand interactions to be pinpointed, even with ligands in a fast adsorption/desorption equilibrium and in complex solvent mixtures [84].
The possibilities offered by NMR to analyse bound ligands have been used by various research groups to study the composition of the ligand shell [85,86,87,88], to analyse the interactions between ligands and NMs [86,87,88,89,90,91,92,93,94,95,96] and to determine the relative binding strength of different ligands [97]. Moreover, it is being increasingly used to support studies that link physicochemical properties of NMs to the NM’s surface chemistry [95,98,99,100]. It has been reported that 1H and 13C signals in the QDs spectra shifted their position in comparison with the free ligand signals to lower field (higher frequencies), as a result of the proximity and anisotropic environment of the QDs surface [101].
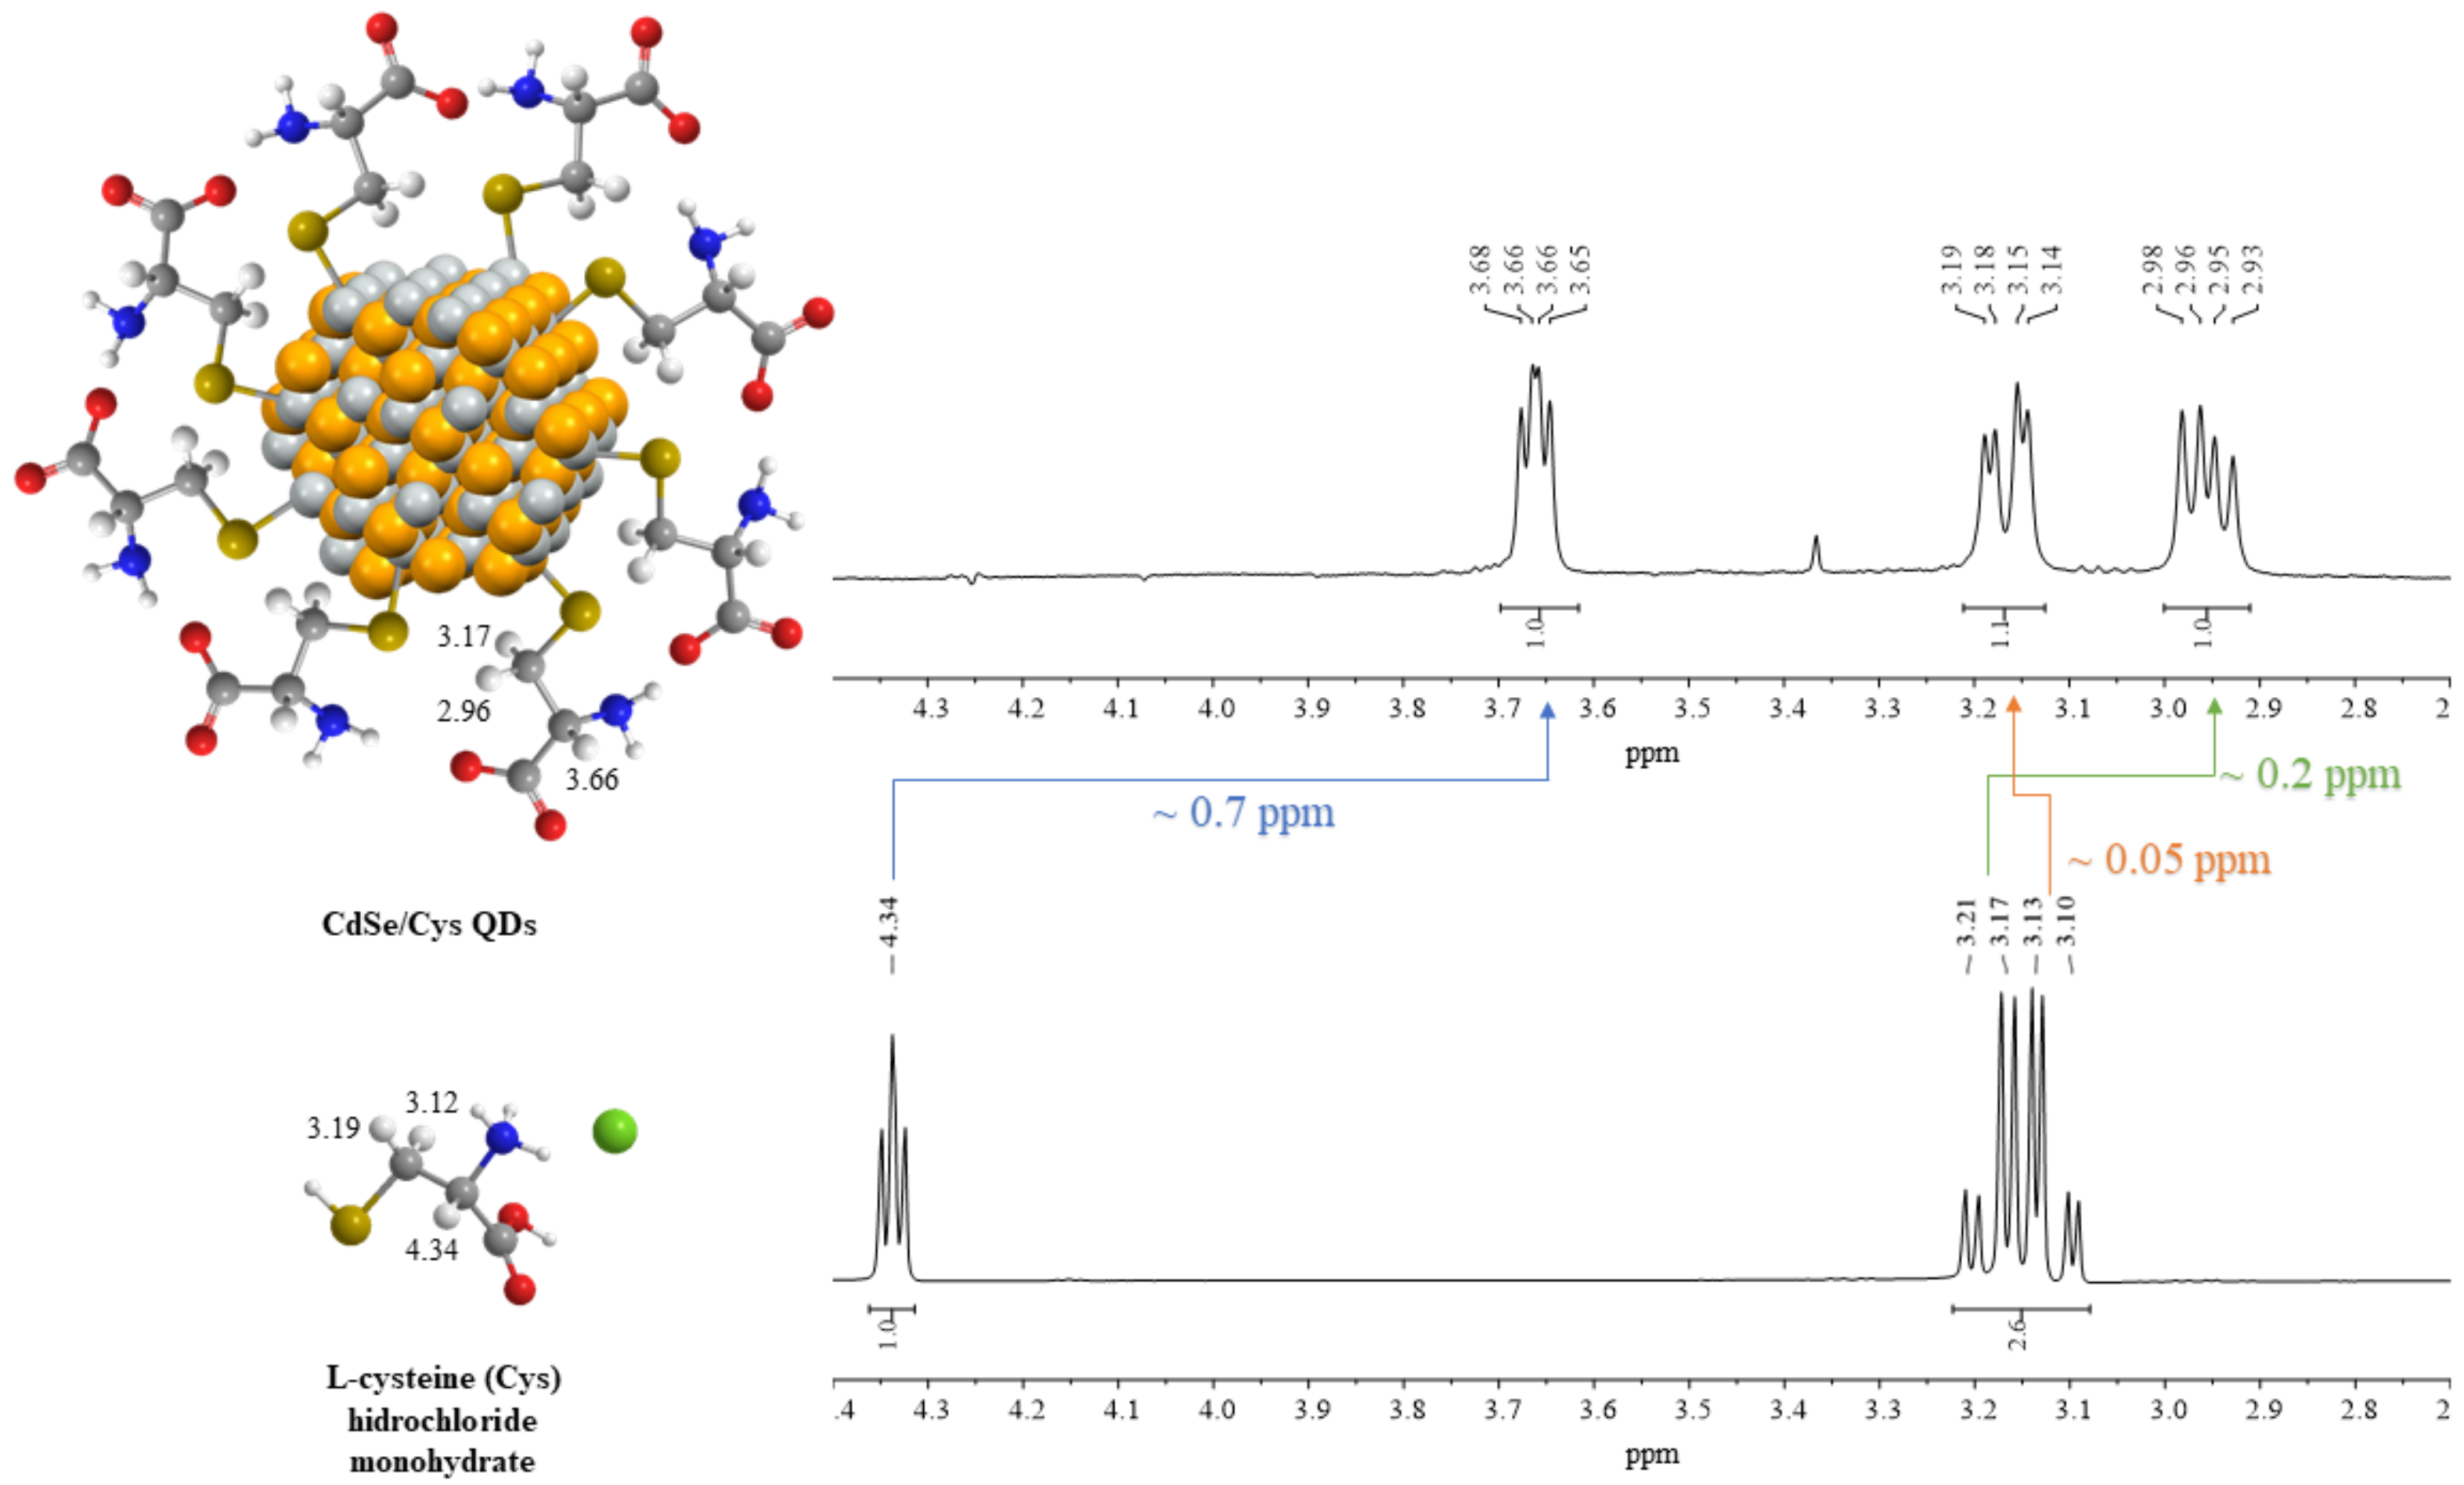
We have characterised cysteine-capped CdSe QDs by 1H NMR spectroscopy in D2O (Figure 4). The analysis of the spectrum clearly shows the characteristic signals of methanetriyl (centred at 3.66 ppm) and methylene protons (at 3.17 and 2.96 ppm). The interaction between CdSe and anionic cysteine results in significant shifts of their signals. Thus, methanetriyl proton shifts 0.7 ppm towards high fields. The same is true for one of the methylene protons, although to a lesser extent (0.2 ppm). The remaining methylene proton moves in the opposite direction at only 0.05 ppm.
Moreover, NMR techniques allowed the quantification of ligands adsorbed to QDs by analysing those signals originated by protons of the ligands interacting with the QD surface by comparison with an internal standard [102]. DOSY offers the valued possibility to prove the attachment of surface ligands to NMs surface [103]. Additionally, a combined 1H–NMR/DOSY procedure can be a complementary method for the measurement of the NM’s size (hydrodynamic diameter, dH) and particle size distribution.

3.2.2. Fourier Transform-Infrared Spectrophotometry (FT–IR)

The FT–IR technique has been successfully applied to the study surface effects on NMs, as it can provide a deep insight into the functional groups on the surface of functionalised NMs. It has been also employed to study the physisorption of molecules at the surface of NMs. Furthermore, the IR spectra of suspensions were used to extract information about specific surface area, surface charge density and concentrations of a nanomaterial.
Among others, carboxyl, hydroxyl, thiol or amine groups are the typical functional groups on the surface of functionalised NMs. In order to facilitate the study of the interaction between NM and organic ligands, the most characteristic stretching and bending vibrations of carboxyl, hydroxyl, thiol and amine functional groups are commented below. Changes affecting the wavenumber and intensity of their related IR bands can allow diagnosing what functional groups of the surface ligands might interact with NMs.
Non-coordinated organic ligands containing a carboxyl functional group show a very broad band for the O–H stretch in the region 3300–2500 cm−1, which is superimposed on the sharp C–H stretching bands of both alkyl and aromatic groups. The broadness of the O–H stretch band of carboxylic acids is related to the existing hydrogen-bonded dimers, which are usually formed by carboxylic acids. The O–H bending band is present in the regions 950–910 cm−1 and 1440–1395 cm−1, although the 1440–1395 band may not be distinguishable from C–H bending bands in the same region [104]. While the C–O stretch of a carboxylic acid appears in the region 1320–1210 cm−1, the C=O stretch appears as an intense band in the region 1760–1690 cm−1. The exact position of this strong band depends on whether the carboxylic acid is saturated or unsaturated, dimerised or displaying internal hydrogen bonding. Oluwafemi et al. [105] reported that bands at 1754 and 1294 cm−1, which correspond to the COO asymmetric and symmetric stretch of cysteine, shifted to lower wave numbers in CdSe/cysteine QDs. The shift in the COO stretching position is probably due to a change in the dipole moment, when cysteine is interacting with a metal surface with high electron density.
Furthermore, organic ligands having a hydroxyl functional group, such as alcohols and phenols, show a relatively broad and strong band for the O–H stretch in the region of 3550–3200 cm−1, which is characteristic of hydrogen-bonded hydroxyl groups. Besides the O–H stretching vibrations, there is a bending O–H vibration normally observed in the region of 1410–1260 cm−1. There also is a strong C–O stretching vibration between 1210 cm−1 and 1050 cm−1 [106]. Li et al. [107] reported that the characteristic broad band at 3399 cm−1 corresponding to the O–H stretch shown by carbon dots shifted to lower wave numbers (3306 cm−1) in C QDs decorated with a catechol derivative.
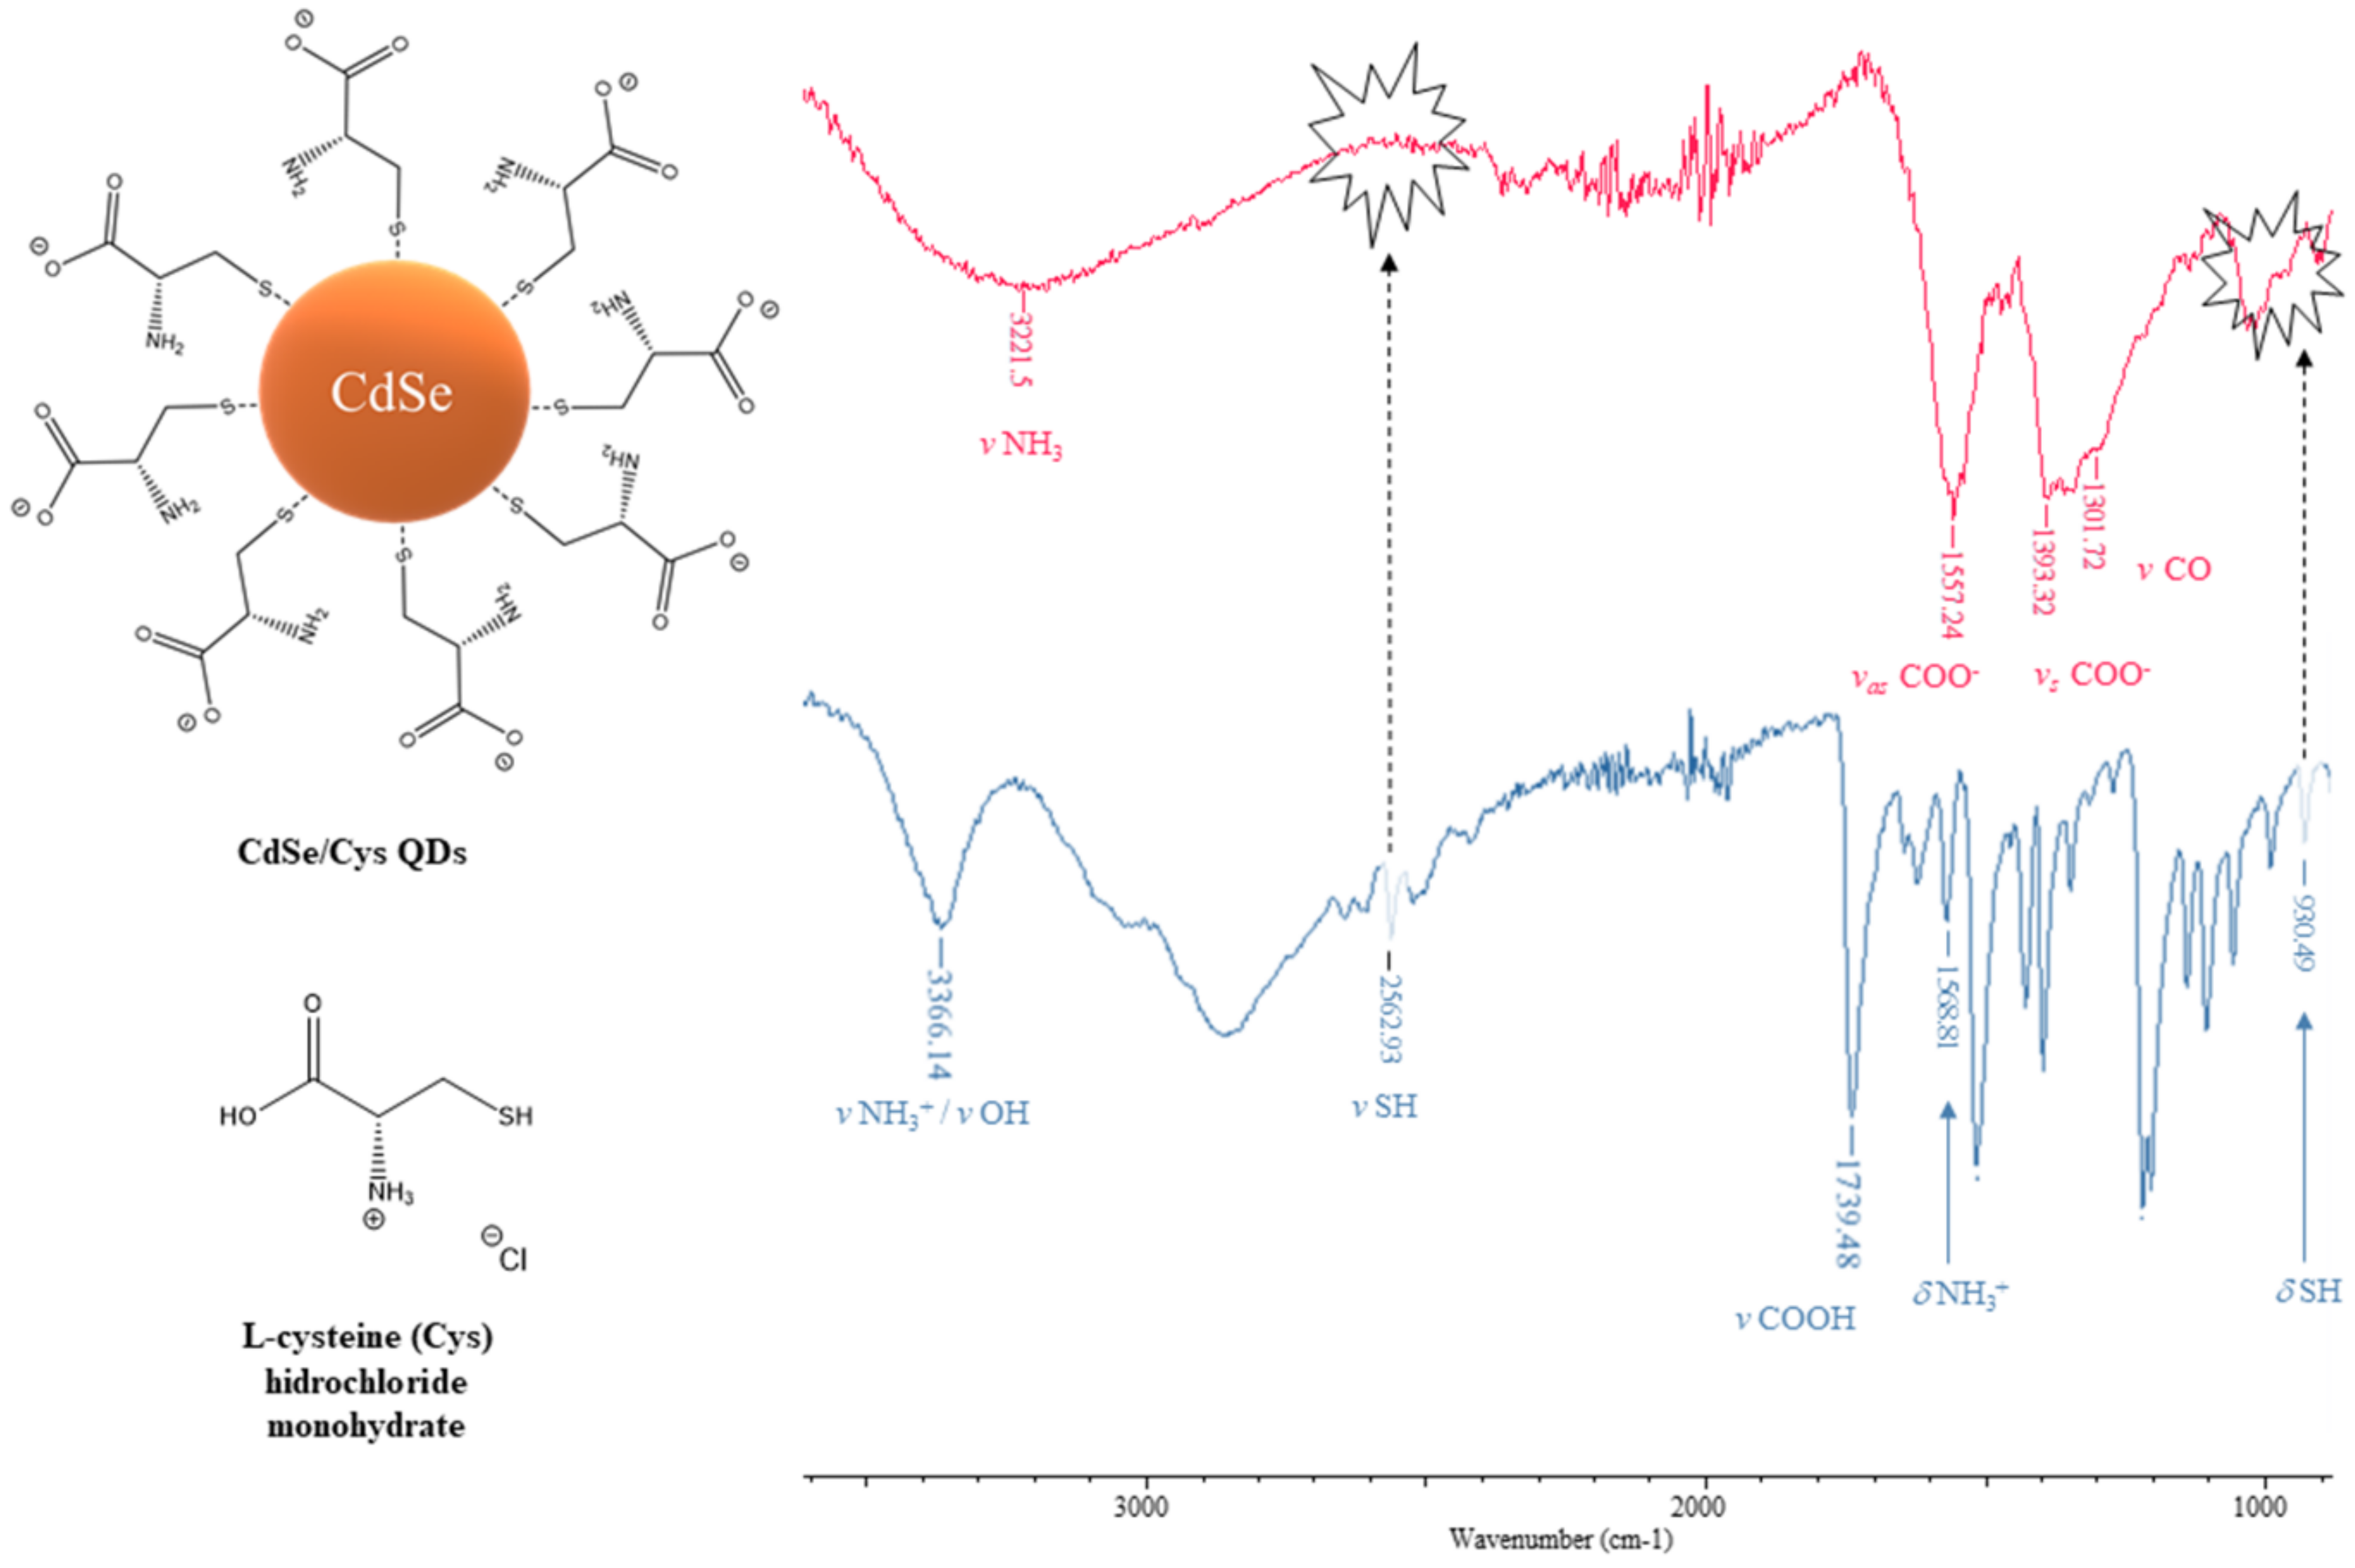
With regard to S–H and C–S stretches, thiols exhibit weak infrared bands (strong in Raman), which occur in the regions of 2600–2540 and 710–570 cm−1, respectively. In addition, the S–H bending vibration is normally observed at about 940 cm−1 [108]. The free surface ligands had an absorption band around 2500 cm−1 due to the S–H group. This band disappears in the case of capped QDs, indicating that the surface ligands are attached to the surface of CdSe QDs via their S atoms. Oluwafemi et al. [105] reported that the spectra of cysteine-capped CdSe particles lack bands at 2546 and 950 cm−1, which correspond to the S–H stretching and bending modes, respectively, in the free cysteine spectrum. This provides strong evidence for the cleavage of the S–H bond, and the subsequent formation of new S–Cd bonds of the Cd thiolate complex on the QD’s surface. For the purposes of illustration, the ATR–FTIR spectrum of cysteine-capped CdSe QDs prepared by us is shown in Figure 5, where the most characteristic infrared bands have been highlighted. This figure clearly shows the absence of νSH and δSH in the ATR–FTIR spectrum of cysteine-capped CdSe QDs, which indicates that the interaction occurred through the thiol group of the cysteine and Cd2+ ions on the surface of QDs.
N–H stretches of amines are typically in the 3300–3000 cm−1 region. These bands are weaker and sharper than those of the alcohol O–H stretches that appear in the same region. For primary amines (–NH2), there are two bands in this region, the asymmetrical N–H stretch and the symmetrical N–H stretch in the regions of 3400–3300 and 3330–3250 cm−1, respectively. Generally, secondary amines (–NH–) show only one band in the region 3350–3310 cm−1, while tertiary amines lack N–H bonds; consequently, they never show a band in this region. The N–H bending vibration of primary amines is observed in the region of 1650–1580 cm−1. A strong band attributed to N–H wag is observed only for primary and secondary amines in the region of 910–665 cm−1. The C–N stretching vibration of aliphatic amines is observed as medium or weak bands in the region of 1250–1020 cm−1. For aromatic amines, this band is usually stronger and appears in the region of 1335–1250 cm−1 [109]. Cooper et al. [110] investigated the characterisation of primary amine capped CdSe, ZnSe and ZnS QDs by using FT–IR, observing that octylamine-capped ZnS QDs display a broad band with two separate peaks at 3409 and 3281 cm−1. This means that the antisymmetric stretch was frequency upshifted by 39 cm−1, while the symmetric stretch was frequency downshifted by 13 cm−1 in comparison with that of free octylamine (3370 and 3294 cm−1). Likewise, the same authors have also observed a splitting of the –NH2 scissoring mode from 1610 cm−1 in the neat sample to 1584 and 1541 cm−1 (medium to strong bands) when interacting with ZnS QDs.

3.2.3. Raman Spectroscopy

Raman spectroscopy, similarly to FTIR, affords information about intra- and inter-molecular vibrations, which can provide additional understanding about the interactions between QDs and surface ligands from a different point of view. Thus, IR spectroscopy relies on absorption of radiation, whereas Raman spectroscopy results from a light-scattering process, but it offers complementary information as, in many cases, molecular symmetry allows both Raman and IR activity. However, molecules containing an inversion centre, Raman bands and IR bands are mutually exclusive; i.e., a bond is either Raman or IR active, but not both. As a general rule, functional groups having significant changes in dipoles are strongly active for IR spectra, whereas functional groups showing weak dipole changes, or having a high degree of symmetry will be better observed with Raman techniques. Accordingly, bonds with strong dipole changes (e.g., C=O, O–H and N=O) and typically identified by IR are difficult to observe in Raman Spectroscopy. By contrast, many bonds, which are not so evident in FT–IR spectra (i.e., O–O, S–H, C=S, N=N, C=C etc.), can be more evident in Raman spectroscopy [108]. Therefore, Raman spectroscopy [111] is a better option than IR spectroscopy for investigating the interactions between QDs and surface thiol ligands, as with other NMs [112,113].
In recent years, Raman spectroscopy has been used to study a variety of QDs such as graphene QDs alone [114,115,116], CdS QDs-graphene hybrid material [117], Zn-containing QDs [118,119], GeSb QDs [120] and even Mn-doped CdSe QDs [121]. In these reports, Raman spectroscopy often is only one technique among different characterisation techniques (FTIR, XPS, TEM, etc.), but sometimes it is the only characterisation technique used [116,117,119].

3.2.4. Spectrofluorimetry

Fluorescence spectrophotometry serves as a useful tool to understand structural changes at the NM-ligand interface by measuring the variation of fluorescence intensities [122,123,124,125,126,127,128,129,130]. Since fluorescence quenching or enhancement is strongly distance-dependent for NPs [131] and also for QDs [127,132], fluorescence spectrophotometry can provide information about the NM-ligand interface, which allows shedding light on the adsorption dynamics and mechanism.
The influence of pH or temperature on fluorescence [133,134] and the determination of the hydrodynamic radius of CdTe QDs [135] has also been reported.

3.2.5. UV–Vis Spectrophotometry

This technique is particularly suitable for obtaining valuable information when organic ligands become bonded on NM surfaces because this binding may change the absorption spectra of surface ligands or NMs. In addition, these capping ligands provide the interface to many applications. Among the different ligands to be considered, long chain thiols, that some years ago appeared to be an excellent choice for most of semiconducting and metal NPs [136], have been revealed as one of the most successful cases of QD capping or functionalisation [137]. Yang et al. [137] cite thioglycolic acid (TGA), 3-mercaptopropionic acid (MPA), reduced glutathione (GSH), L-cysteine (L-Cys), sodium 2-mercaptoetahensulfonate (MES) and 1-thioglycerol (TG) as the most widely used thiol-capping agents. However, they only studied the complexation properties of MPA, GSH, TG and MES with CdTe QDs, combining theoretical calculations with experimental UV–Vis absorption spectra.
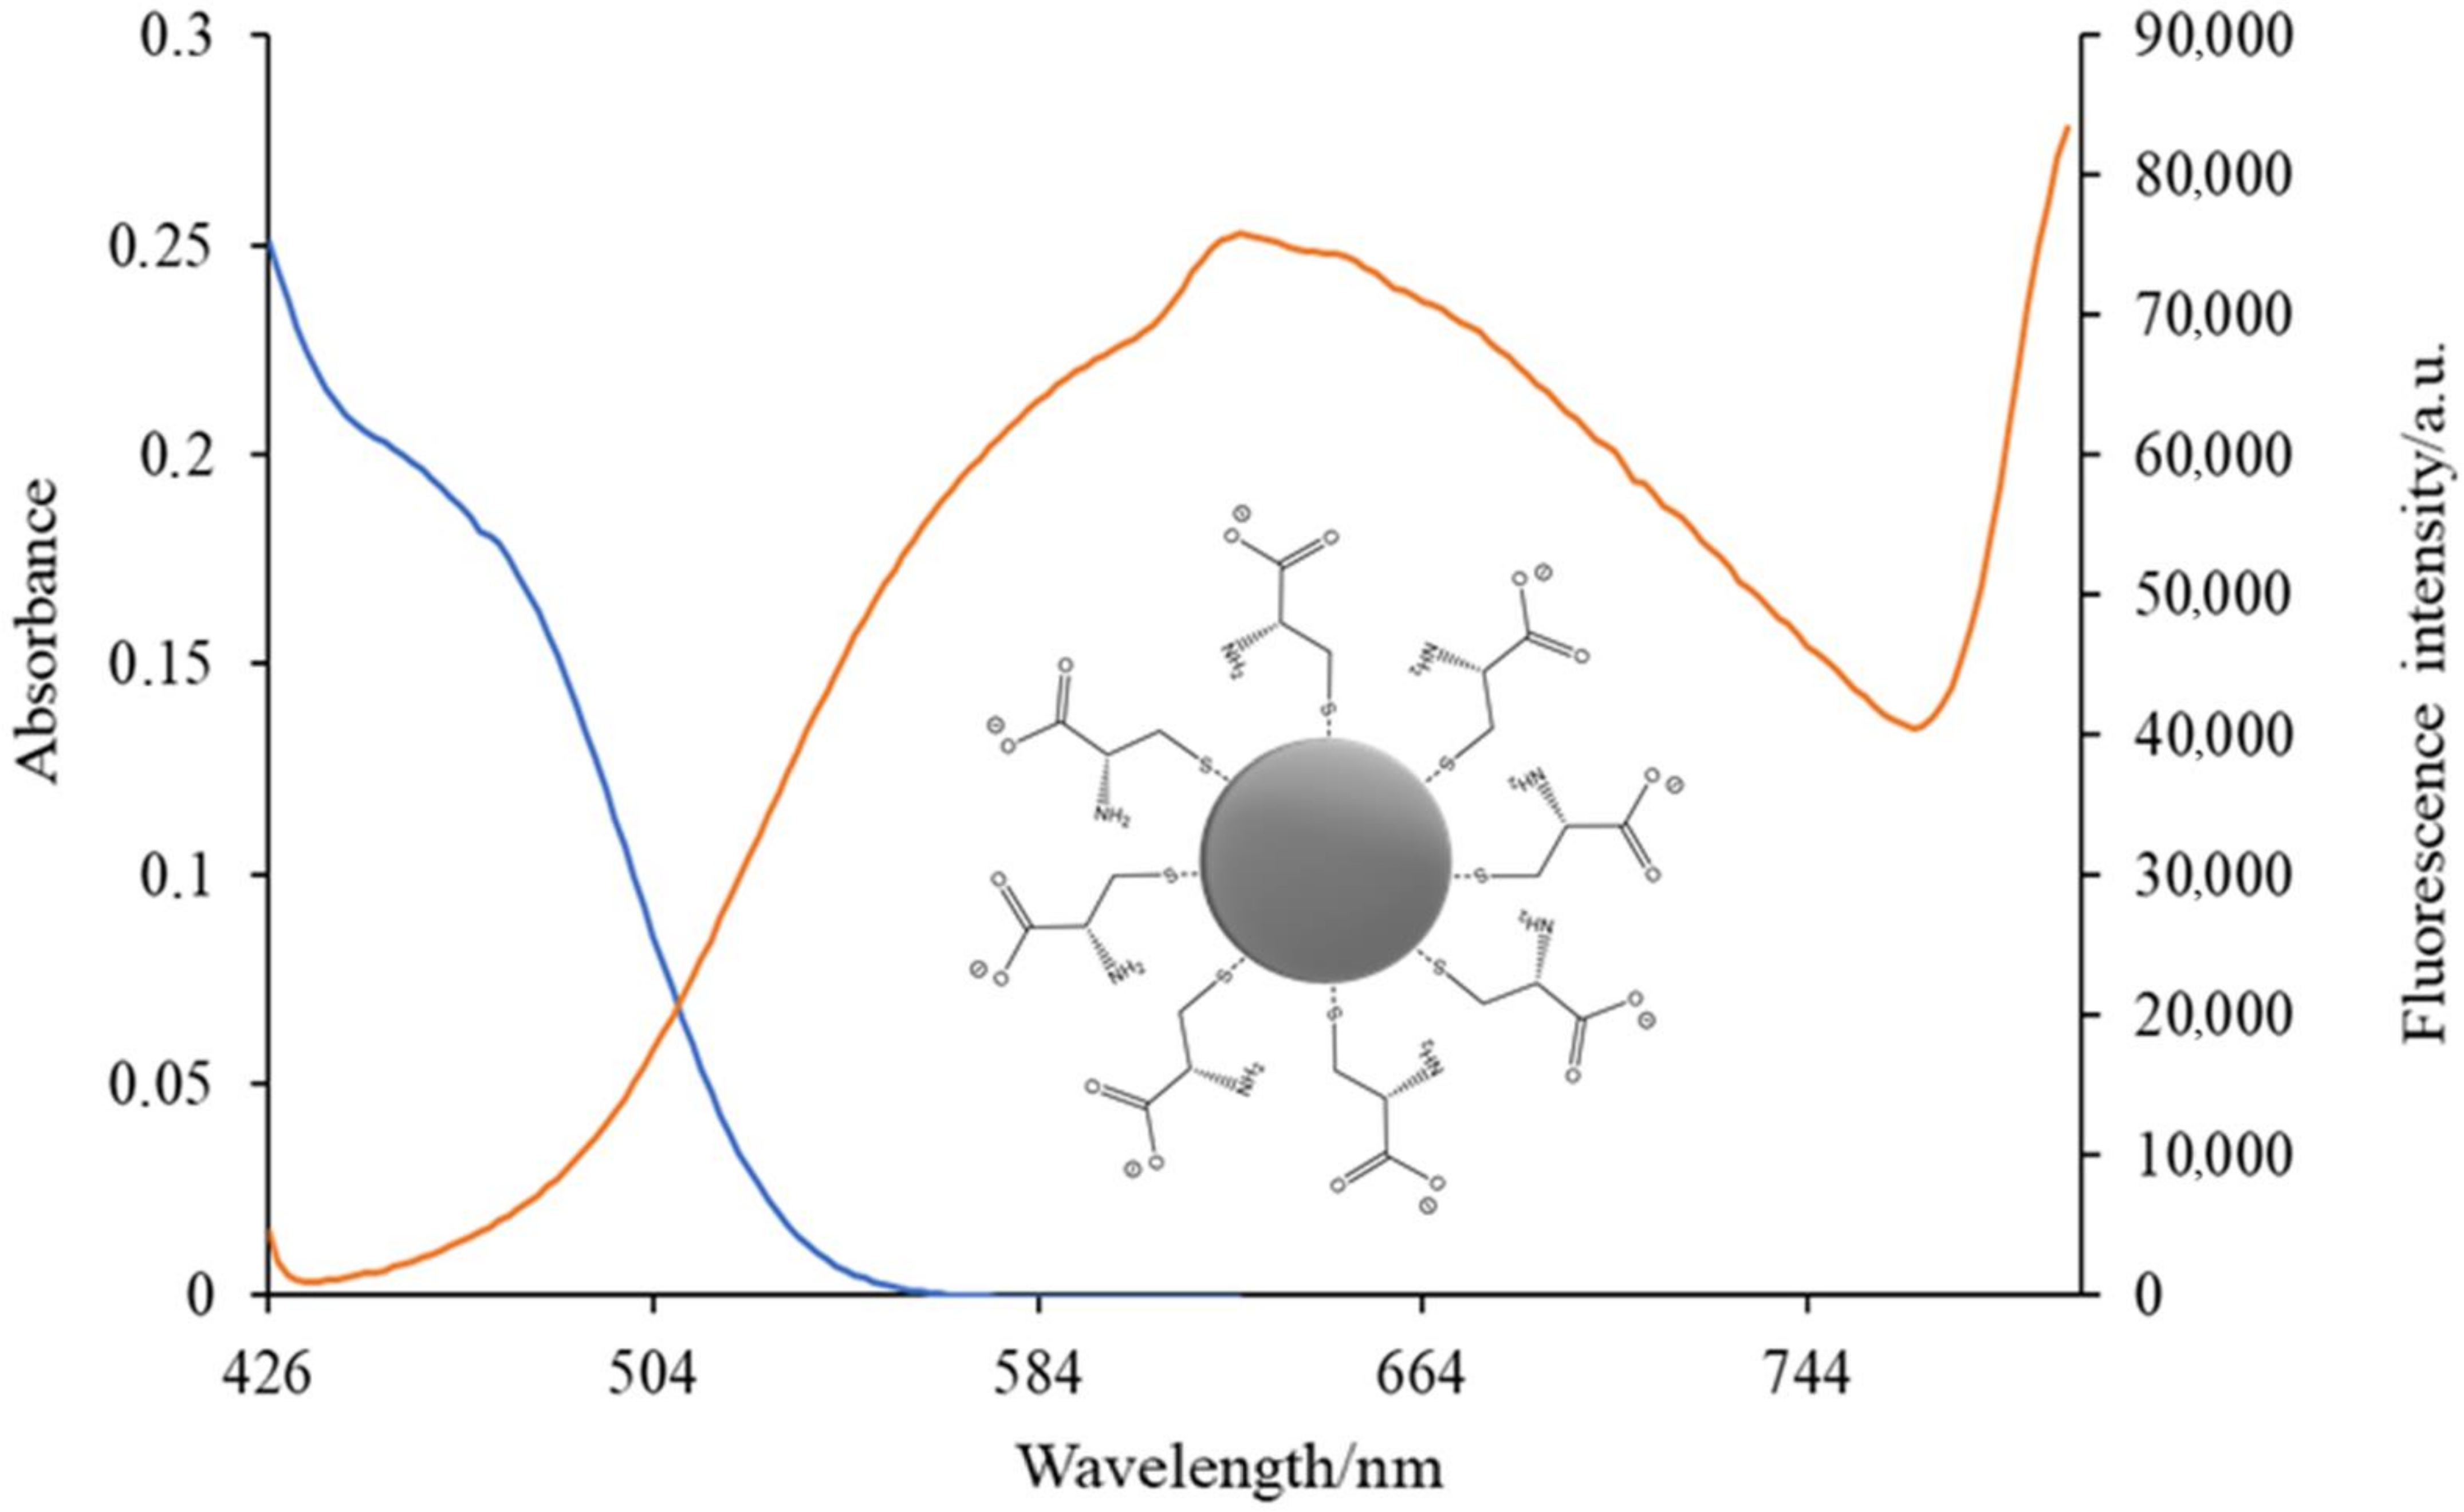
Similarly, the association of empirical data (obtained from UV–Vis spectrophotometry and other characterisation techniques) with structural studies has been applied to investigate the gelation of GQDs (graphene QDs) [138] or the effect of size on optical properties of GQDs by using polycyclic aromatic hydrocarbons (PAHs) as molecular models [139]. Furthermore, the size of QDs can be determined from the position of the absorption peak in the UV–Vis spectrum [140] provided that a suitable model is used, as stated by Pesika et al. [141]. This offers a valuable support to prove the attachment of surface ligands to NMs surface. In this sense, the absorption wavelength (λabs) obtained by this technique, in joint connection with the equations proposed by Yu et al. [142], allows determining the size of CdS, CdSe and CdTe QDs in a simple and convenient manner. Thus, UV–Vis spectroscopy allowed us to observe a band around 460 nm, which led us to estimate the particle size in about 2.02 nm in the spectrum of cysteine-capped CdSe QDs (Figure 6). This also shows a broad fluorescence emission band at λmax 626 nm, when an ethanol solution of cysteine-capped CdSe QDs was excited with visible light (400 nm).
A study on how size and shape influence on optical properties of oleic acid—as well as trioctylphosphine-capped CdSe QDs—has been reported too, using the results achieved by UV–Vis absorption, fluorescence spectra and X-ray diffraction [130].
Current models applied to relate the optical properties (of QDs or other NMs) and size distributions are often revised and discussed. Thus, an extensive revision by Ferreira et al. of the main theoretical contributions to the understanding of the quantum confinement effect and its consequences produced results comparable to those achieved by AFM and TEM data for CdTe QDs [143]. Their improvement consisted in including, in the model, the broadening of the absorbance spectrum caused by the polydispersity of the QDs, as it had been described some years before when working with ZnO QDs [144]. Later, Lesnichaya et al. [145] successfully applied this refinement of the method to Se NPs as confirmed by TEM data, thus supporting the applicability of the methodology to different systems of semiconductor NMs [143].
Closely related to the luminescence exhibited by QDs and photodetection technology, UV–Vis spectrophotometry is widely used, for example, for the characterisation of metallic Bi QDs [146] or Mn-doped CS QDs (ZnCdS:Mn/ZnS) [147].

3.2.6. Isothermal Titration Calorimetry (ITC)

During titration, the heat change is directly recorded, and important thermodynamic parameters (including changed of enthalpy ΔH, entropy ΔS and Gibbs-free energy ΔG) and reaction parameters between QDs and surface ligands (including the binding constant and binding stoichiometry) can be calculated. Meanwhile, it also provides information on the interaction mechanisms between surface ligands and NMs. Although ITC is a straightforward technique for measuring the association process between surface ligands and NMs in a quantitative manner, its main inconveniences are that it is time-consuming and relatively high concentrations of titrant are needed.
ITC was firstly used to characterise the binding of QDs with human serum albumin (GSH) by Yang et al. [148], who also carried out spectrofluorimetric and UV–Vis spectrophotometric measurements. The ITC results revealed that this binding was a thermodynamically spontaneous process mainly driven by hydrophobic interactions, and the binding constant tended to increase as the GSH–CdTe QDs’ size increased. In this case, the binding constant decreased from 4.50 × 10⁵ to 1.34 × 10⁵ M−1 as the size decreased from 3.0 nm to 2.8 nm. Meanwhile, the binding stoichiometry for QDs (3.0 nm): GSH and QDs (2.8 nm): GSH at 298 K was determined to be 0.269 and 0.204, respectively.
Later on, the same authors carried out an analogous work to explore the effects of N-acetyl-L-cysteine-capped CdTe QDs on bovine serum albumin (BSA) and bovine hemoglobin (BHb) in vitro under physiological conditions [149]. Although proteins interacted spontaneously with the CdTe QDs, such interactions were deeper on BHb than on BSA, whereas the ITC results indicate that both binding processes are endothermic, and the predominant force is a hydrophobic interaction.
Based on previous theoretical studies showing that ligands derived from alkylphosphonic acids were more strongly bonded to CdSe QDs than carboxyl groups-containing ligands, Gee et al. [150] used ITC to monitor the carboxylate to phosphonate ligand exchange reaction on CdSe QDs in tetrahydrofuran (THF) at room temperature. The results reported confirm the potential and interest of ITC as another technique in the field of NM research.

3.2.7. Size Exclusion Chromatography (SEC)

SEC is a column chromatographic technique that separates molecules mainly on the base of their relative size or, more specifically, on their hydrodynamic volume, and NMs can be separated likewise [151]. When samples are injected into the column, smaller molecules can be trapped into the pores of the gels, while larger molecules are excluded and firstly eluted. Since bare NMs have lower volume than capped NMs, the size distribution of the target NM after sorption can be determined, indicating that adsorption has occurred. Different detectors, such as SLS (static light scattering), QELS (quasi-elastic light scattering) and ICP–MS (inductively coupled plasma mass spectrometry), can be used in conjunction with SEC to generate size information. Although the use of the SEC as a separation technique is simple and fast, it is not possible to obtain information on the adsorption mode.
Recently, Wu et al. [152] described the use of this technique to purify CdSe/ZnS QDs modified with octylamine grafted polyacrylic acid (OPA) or with amino-terminated polyethylene glycol (PEG) to generate water-dispersible QDs (OPA–QDs and PEG–QDs). Since the objective was to prepare QD-based bioprobes, the authors took advantage of the separation capability of SEC to purify both the modified QDs and QD-based bioprobes, removing an excess of reagents and other substances. Three detection systems were used: UV–Vis, fluorescence and refractive-index detectors.

3.2.8. Zeta Potential Determination

The adsorption of organic ligands on NMs can lead to a change in their surface charge, even so drastically as to reverse it, with the consequent influence on the zeta (ζ) potential. Thus, it was found that QDs carrying a PEG-amine had a ζ potential of −37.92 ± 0.16 mV (similar to the −31 mV reported for PEG–CdSe/ZnS QDs [152]), but when these QDs were conjugated to somatostatin (SST) to produce QDs–SST, the ζ potential showed a reversal to positive values (+23.3 ± 0.23 mV) [153]. More recently, water-soluble CdSe/ZnS QDs were encapsulated with modified poly(maleic anhydride-alt-1-tetradecene) (PMAT). PMAT was modified by using carbodiimide reactions between carboxyl groups of PMAT and primary amino groups of bifunctional molecules containing differently charged groups (sulphonic acid, phosphonic acid, trimethylammonium chloride, sulphate or phosphate) [154]. These modifications resulted in controlled ζ potential values ranging from −38 to +20 mV in an aqueous solution, while preserving the hydrodynamic diameter of the resulting QDs below 50 nm.
Furthermore, as the zeta potential depends on the type of charged groups, ζ potential analysis can be used to study the NM-surface ligand interaction either by physical or chemical adsorption. The number of organic ligands covalently attached to the surface of CdTe QDs has been also determined from their electrophoretic mobilities [155]. Although the ζ potential analysis cannot provide direct information on the surface binding, it can be useful as an important auxiliary technique to elucidate the adsorption mechanism.
In addition, the monitoring of the ζ potential with time allowed Wang et al. [156] to study the charge, size, aggregation behaviour and stability of 1-thioglycerol (TG)-CdTe QDs at different pH values, aiming at future applications in biosystems.
Another topic to highlight the interest of ζ potential determinations is the study of the dispersion of QDs in liquid crystalline materials (or liquid crystals, LCs). LCs exhibit interesting dielectric, optical and spectroscopic properties that explain their wide variety of applications. Among the different phases in LCs, the nematic phase is the simplest one and has very interesting advantages in the fields of both display and non-display electronic devices [157]. In addition, the dispersion of NMs, namely QDs, in nematic LCs (NLCs) has gained importance due to the improvement in the properties that QDs dispersion impairs NLCs [158]. Likewise, in the previous paragraph, the study of the stability and aggregation of pristine and QD-dispersed NLCs was carried out by ζ potential and spectrometric (UV–Vis and fluorescence) measurements, when dispersing CQDs in 4′-heptyl-4-biphenylcarbonitrile [158], and when oil palm leaf-based carbonaceous QDs (OPL QDs) were dispersed in the commercial nematic mixture E48, a positive (+ve) dielectric anisotropic material with the phase sequence Cr.–19 °C–N–100 °C–Iso was observed [157].

3.2.9. Powder X-ray Diffraction (XRD)

Powder X-ray diffraction (XRD) is a rapid analytical technique that has been primarily used for the phase identification of a crystalline material, but it is a common characterisation technique for finely ground and homogenised nanoscale materials as well. It can provide information not only about unit cell dimensions but also about average bulk composition, purity, phase identification, size, crystallinity and, in some cases, morphology and other important features of nanoscale materials. However, unambiguous sample characterisation almost always requires complementary experimental microscopic and/or spectroscopic methods and/or computational methods [130,159]. Thus, as a bulk technique, the information that is provided can be correlated with microscopy data to test if microscopic observations on a small number of particles are representative of most of the sample. X-ray diffraction (XRD) patterns for samples of nanoparticles possessing different sizes and shapes can look different, and a careful analysis of the XRD data can provide useful information and help correlate microscopic observations with the bulk sample.
Additionally, a deep study of XRD spectra, their comparison with simulated X-ray diffraction patterns and the results achieved with other techniques can help explain the origin of the ligand signals recorded in such spectra, which can be considered as a probe of ligand-shell ordering, as described by Calvin et al. in the case of InP QDs [160].
More detailed XRD spectra can be obtained, if necessary, by high resolution XRD (HR–XRD). Thus, HR–XRD and photoluminescence have been used to study active media for lasers and light emitting diodes. See, for example, the following cases: the study of GaAs/In0.15Ga0.85As/GaAs quantum wells (QWs) with embedded InAs QDs [161], the characterisation of GaAs/Al0.30Ga0.70As QWs with InAs QDs arrays covered by different capping layers (Al0.30Ga0.70As or Al0.1Ga0.75In0.15As) [162], and the investigation on the effect of the same capping layers on the emission of GaAs/Al0.30Ga0.70As/AlGaInAs heterostructures with embedded InAs QDs [163].

3.2.10. X-ray Absorption Spectroscopy (XAS)

Extended X-ray Absorption Fine Structure (EXAFS) and X-ray Absorption Near Edge Structure (XANES) are subsets of X-ray absorption spectroscopy (XAS). X-ray absorption spectroscopy (XAS) is one of the direct structural probes providing information on the local environment around a photoabsorber. XAS is an excellent tool for this purpose, because it can be successfully applied to both ordered and disordered materials. XAS is also element selective, and it is sensitive to high dilutions and to length scales down to NMs and even molecules. X-ray absorption spectroscopy is well suited for the investigation of nanomaterials, and size-dependent effects are readily detectable for nanoparticles having a size below about 10–15 nm. An analysis of the nearest coordination shells around a photoabsorber can be performed using conventional methods of analysis to determine the local structure parameters and degree of disorder. The combination of XANES and EXAFS analyses has proved to be a robust methodology for the characterisation of complex systems [164,165], even when only EXAFS measurements are obtained and XANES spectra are used only for comparison purposes [166,167]. This approach can provide both local symmetry information (through XANES), as well as structural and stoichiometry information (through EXAFS), which can be used as an input for the subsequent analysis of scattering data and computer modelling [165] or as a support to density functional theoretical (DFT) calculations [168]. However, EXAFS or XAS are often used alone. Thus, EXAFS has been used to investigate the microstructure of multilayer semiconductor heterosystems SiGe containing self-assembled ordered groups of Ge QDs [169], while XAS has been used to study the electronic structure and the electrochemical performance of NiCo2O4/graphene QDs [170].

3.2.11. X-ray Photoelectron Spectroscopy (XPS)

As described above, because of their small size, QDs have a high surface-to-volume ratio; thus, many of their properties are surface chemistry-dependent [171]. Hence, surface analysis techniques are of high interest, and X-ray photoelectron spectroscopy (XPS) is deserving of particular mention. In fact, the literature shows that XPS has been the technique of choice for the analysis of the surface of a variety of QDs [8,171,172,173,174,175,176,177], although as previously mentioned, authors often combine XPS and other techniques with characterization purposes.
N-doped GQDs synthesised by a top-down electrochemical exfoliation process were also studied by XPS prior to being used in the fabrication of a novel GQDs-based light-emitting electrochemical cell (LEC) [8]. CdSe QDs were also subjected to XPS to study the desorption dynamics of different ligands upon annealing treatments at different temperatures [172]. In the case of He et al., they have used XPS to characterise N-doped GQDs prepared through a hydrothermal process and achieved the complete elucidation of the full band structures of such QDs [173]. Therefore, the complete elucidation of the structure of core-shell QDs is indeed possible, as also occurring in Weigert et al.’s study with CdSe/CdS QDs [177], showing the potential of complementary techniques such as HR-TEM and XPS. These same techniques allowed the study of the growth and the effect of post-annealing process on the crystallinity and crystallite size of SnO2 QDs [174].
The Mn-doping of CdSe QDs was also investigated by XPS, since such doping was predicted to optimise the surface passivation of anionic and cationic surface trap states, which organic ligands cannot overcome [175]. Moreover, the use of passivation strategies on QDs is well-known, since without a well-passivated surface, QDs are prone to oxidation, resulting in poor performance and shorter lifetime. Thus, XPS on depth-profiling modes can be useful for studying the variation of the extent of oxidation processes with depth, as reported by Clark and Flawell [171], who have also investigated PbS/CdS QDs by XPS.
Finally, XPS is not only useful for investigating “simple” QDs but also much more complex structures, such as the 6-fold stack of Si QDs layers embedded in an ultrathin SiO2 matrix. This material was prepared by Futamura et al. [176], who investigated the electron emission mechanism when the structure was subjected to DC biases, concluding that electrons gain kinetic energy mainly in the upper side of the stacked Si QDs structure.

3.2.12. X-ray Fluorescence (XRF)

XRF is a non-destructive analytical technique used to determine the elemental composition of materials. X-ray fluorescence (XRF) results from the atom-localised emission when incident X-rays or γ–ray with a higher energy than the ionisation potential of the atoms in the NMs induces the emission of characteristic fluorescence [178,179].
Besides elemental compositions, XRF can help find the precise position of functional NMs inside three-dimensional structures with photonic or other properties, as described by Schulz et al. [180]. They infiltrated PbS QDs deep inside crystals made of Si and localised them using synchrotron XRF tomography.
Another application of XRF as a characterisation technique deals with the development of contrast agents to be adopted in X-ray computed tomography: silica-coated Au nanospheres (Au@SiO2) were prepared and coated first with CdSe/ZnS QDs and then coated again with silica and finally modified with polyvinylpyrrolidone (PVP). The composite Au@SiO2–QDs/SiO2–PVP structure obtained was first studied by XRF and other techniques, revealing good dispersity, high fluorescence intensity and good effects of X-ray absorption [181]. The subsequent in vivo application of the probe on mice was reported to be successful, and it is expected to be used for tumour-targeted and vascular imaging [182].

3.2.13. Scanning Electron Microscopy with Energy Dispersive X-ray Analysis (SEM–EDX)

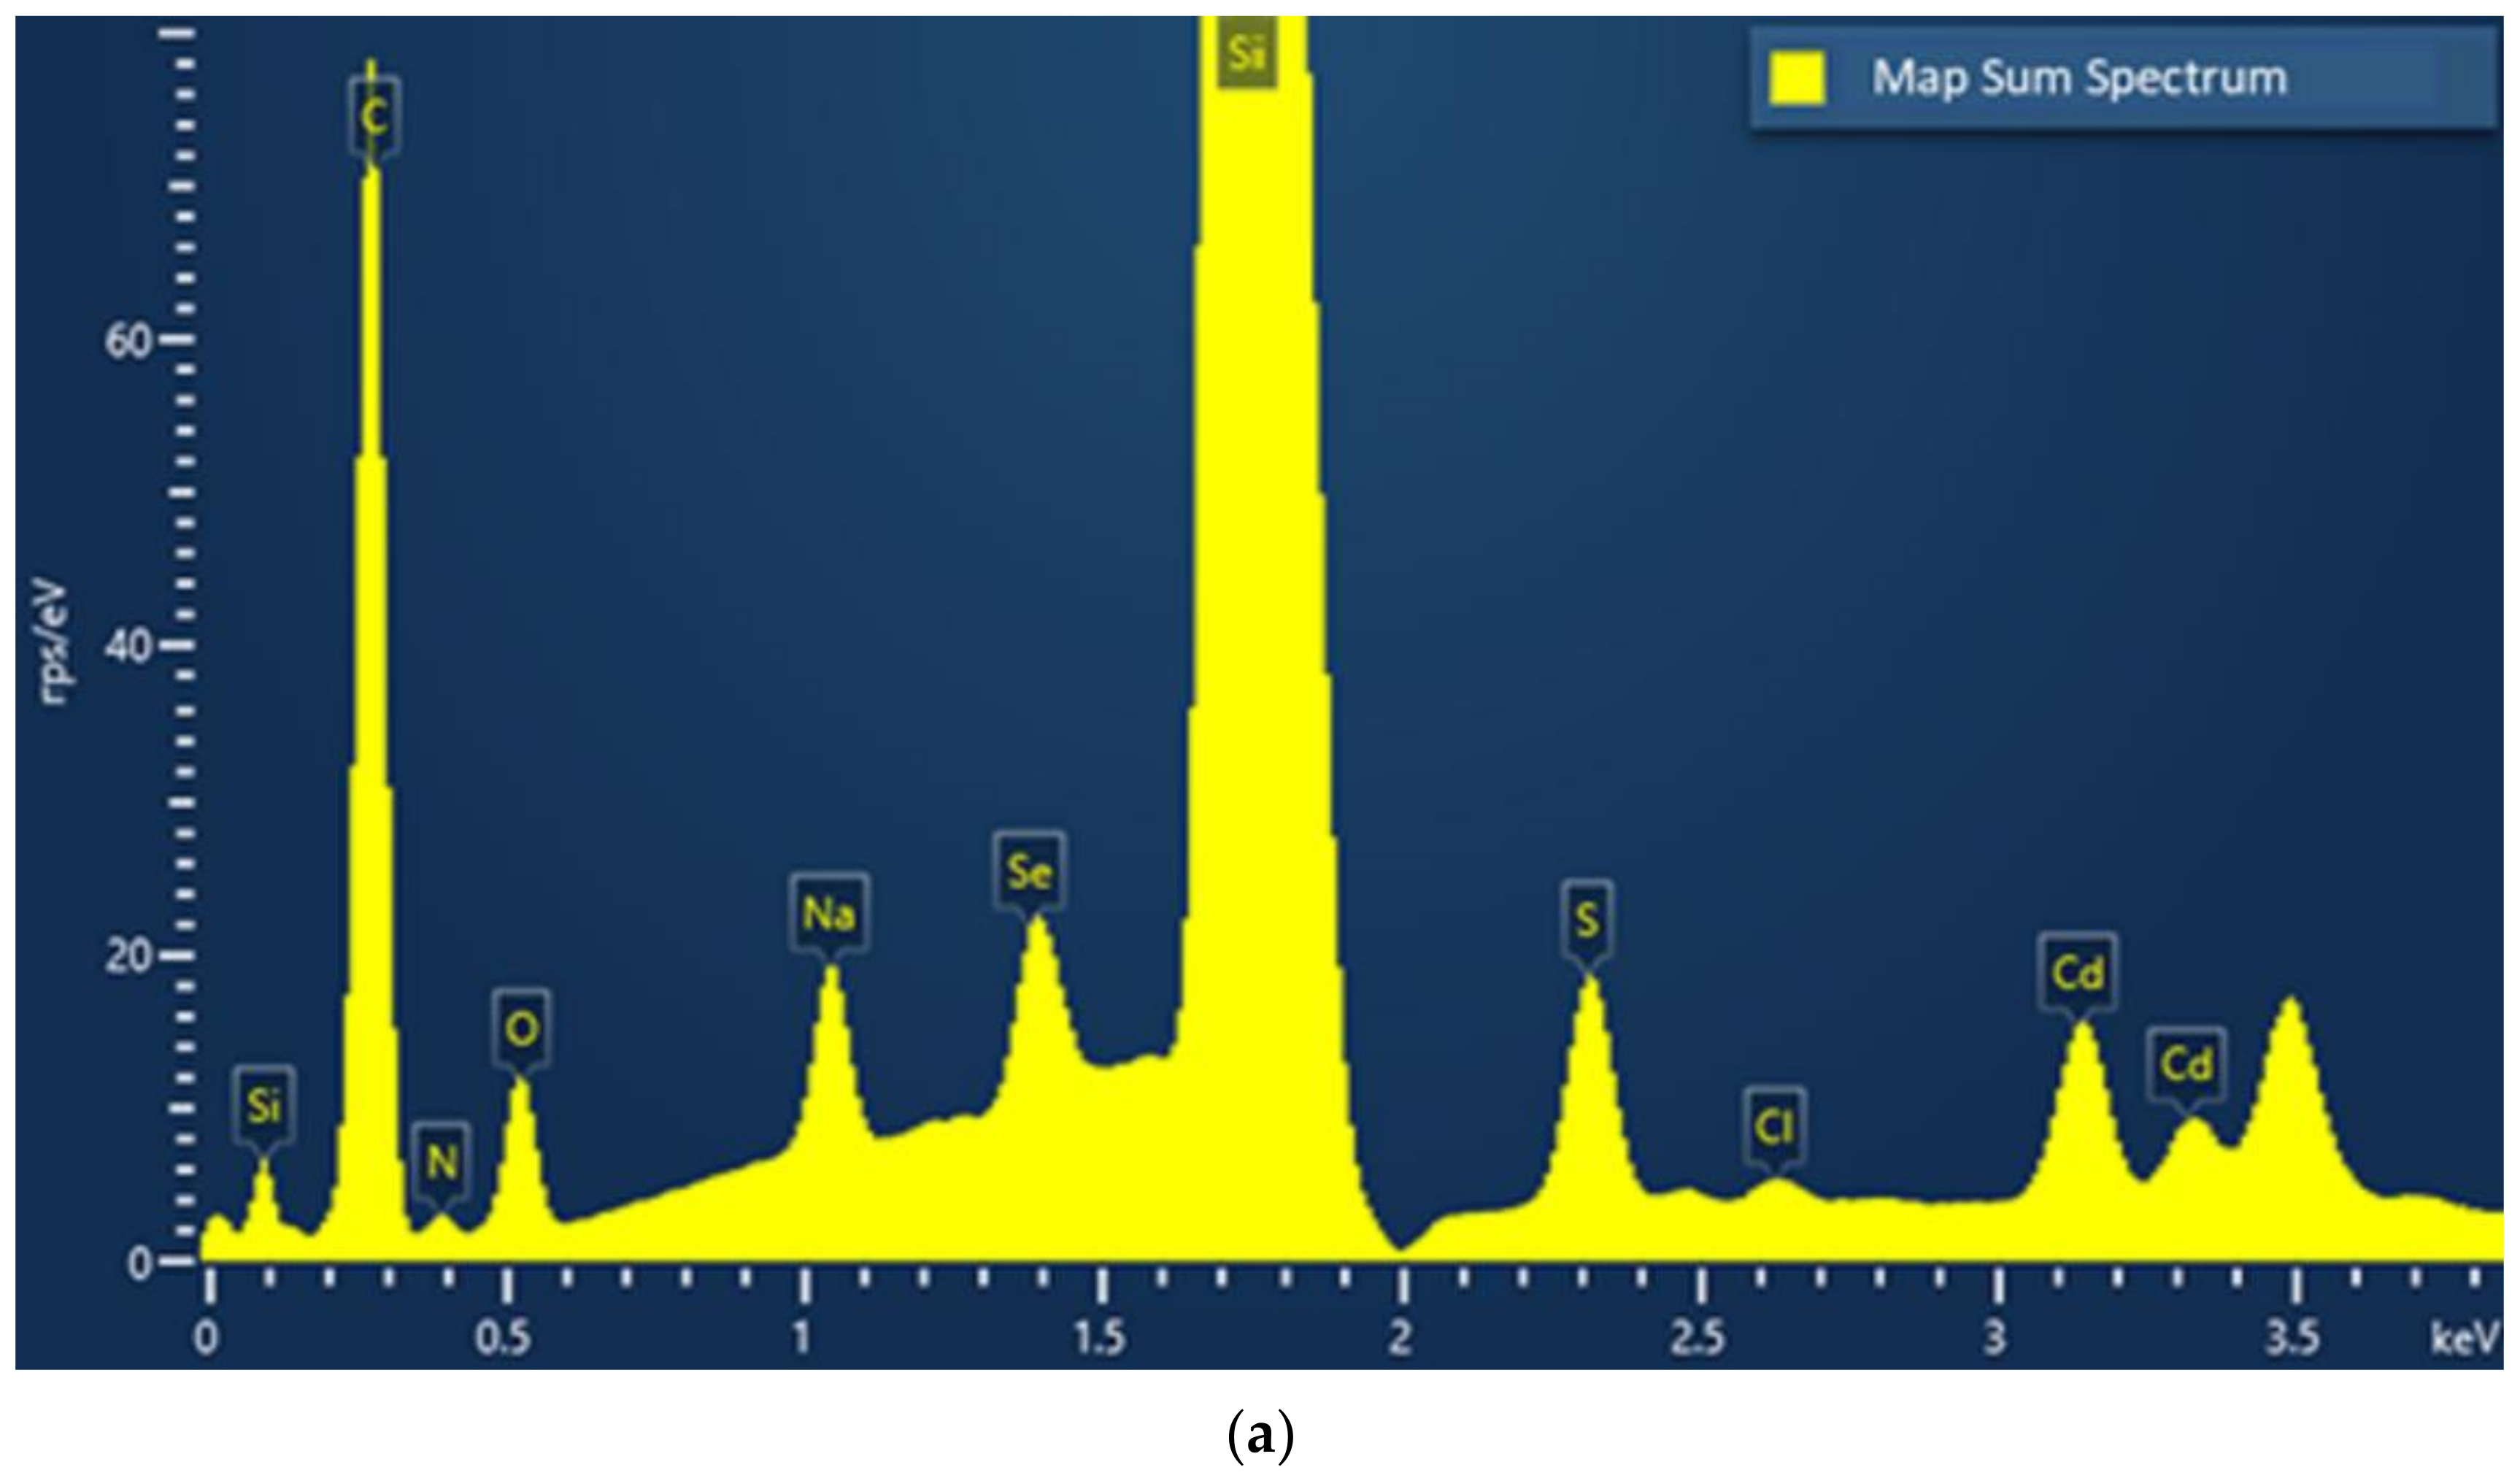
SEM provides detailed, high-resolution images of the nanomaterial by scanning a focused electron beam across the surface and detecting the secondary or backscattered electron signal. This often allows the size and shape of nanomaterial particles to be studied [183,184]. An EDX analyser is used to provide elemental identification and not quantitative compositional information (% weight of the constituent in the nanocrystal) [185] as well as element distribution in nanomaterials (mapping analysis) [186,187]. The sample is irradiated with electrons resulting in the emission of X-rays characteristic to the elements present. The energy emissions are translated into spectral peaks of varying intensity, resulting in a spectrum profile, which identifies the different inorganic elements present in the sample. The size of spectrum peaks is directly proportional to the concentration of the elements in the sample. Figure 7a shows the EDX spectrum of cysteine-capped CdSe QDs. The huge size of the silicon peak is due to the sample holder, which contains this element.
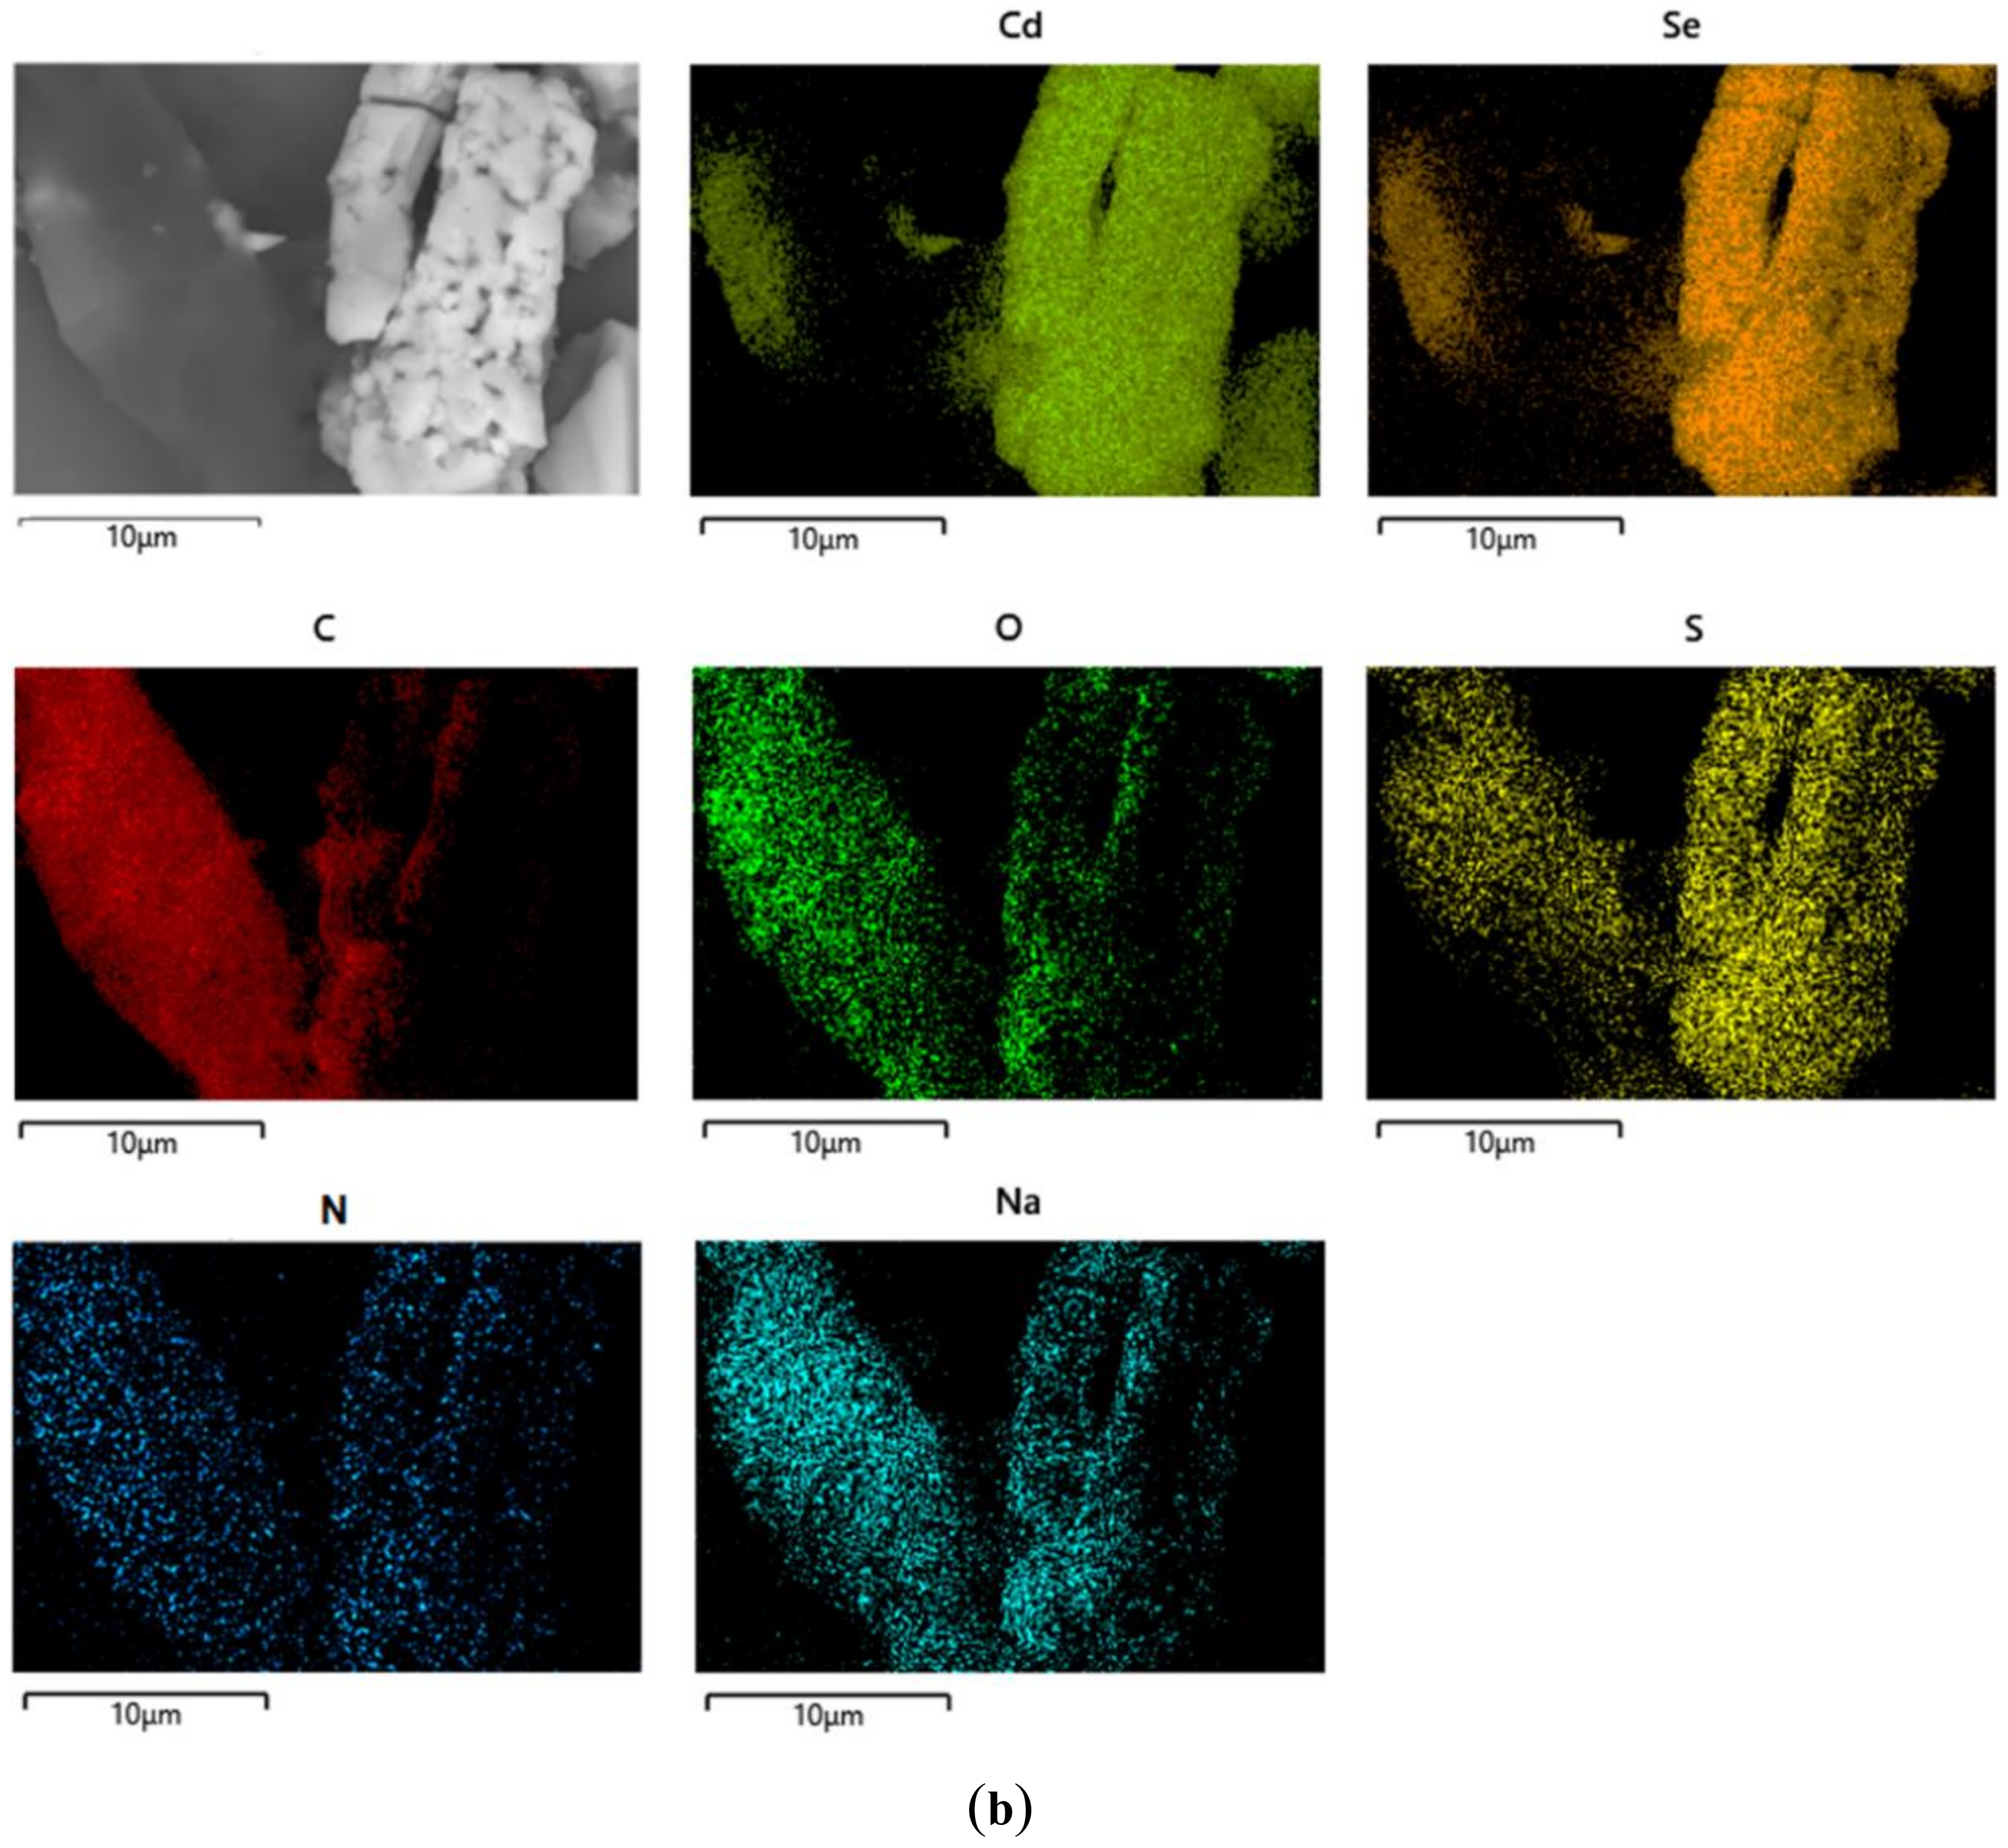
SEM with EDX has been used to generate a map of element distributions from cysteine-capped CdSe QDs (Figure 7b). It must be noted that cysteine, as a carboxylate sodium salt, consists of O, Na, C, N and S elements. The EDX analysis shows the presence of Cd, Se, O, Na, C, N and S elements with a very similar and uniform spatial distribution pattern, which supports the existence of the interaction of anionic cysteine with CdSe.

4. Analytical Techniques for Detection and Quantification of QDs

While the characterisation of synthesised QDs is widely covered in the literature, the research on the detection or quantification of QDs in complex samples is much more unusual. Thus, the detection/determination of QDs both directly (as inorganic or metal-free materials) [7,188,189,190,191,192,193] and indirectly (as the heavy metal content of inorganic materials) has been reported [11,12,54,56,194,195,196,197,198,199,200,201,202,203,204,205,206,207,208,209,210]. Nevertheless, for the indirect determination to be successful, the nature of the sample must be ensured; otherwise, the heavy metal content could come from sources other than the QDs themselves.
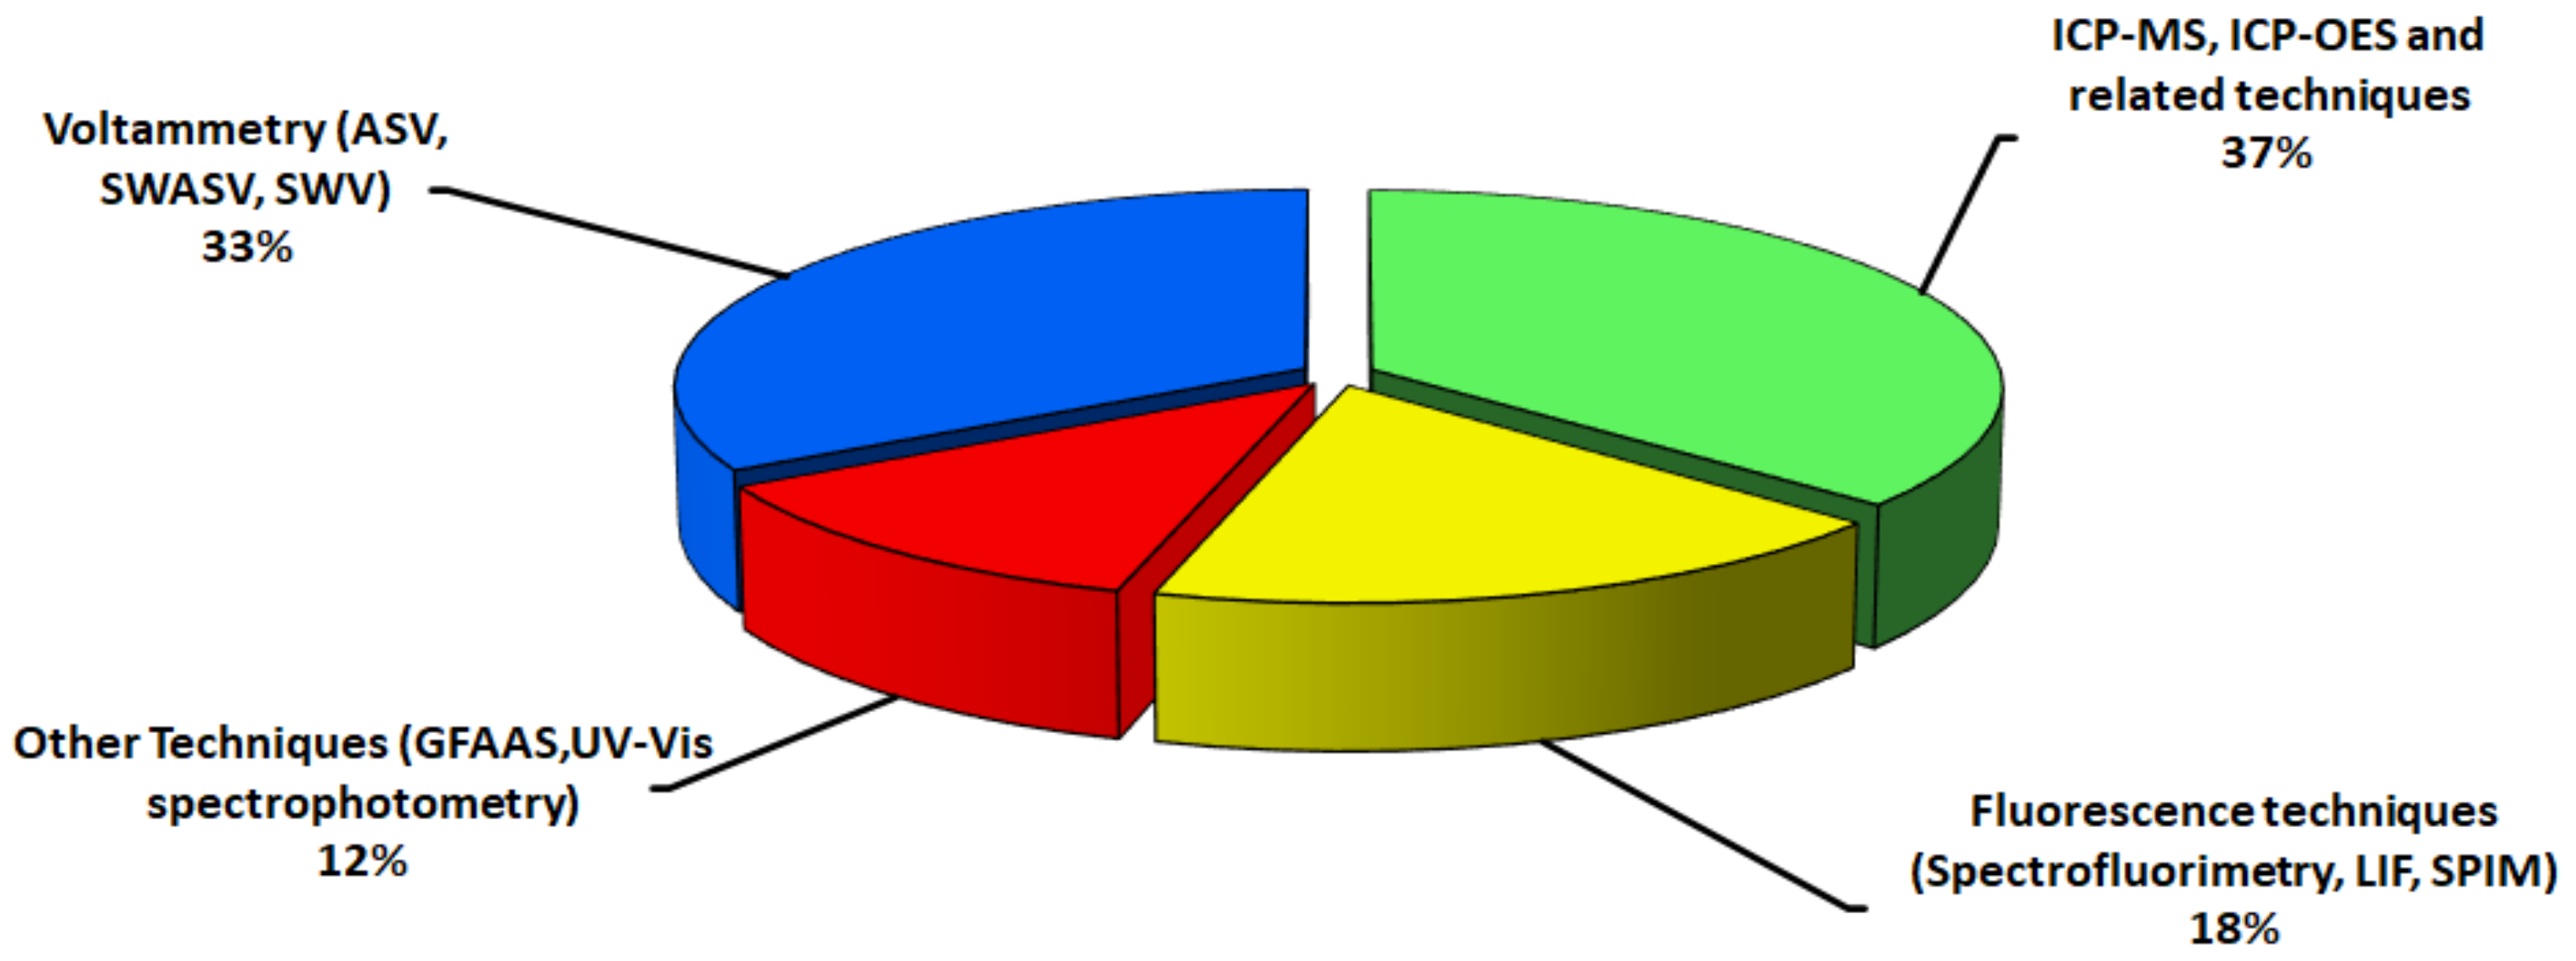
As depicted in Figure 8, voltammetric-sensing techniques [12,54,194,200,201,203,205,206,207,208,210] and mass spectrometry-related techniques [12,56,191,192,193,195,196,197,199,202,204,209] are commonly used analytical techniques for the detection/determination of QDs. Less used techniques are spectrofluorimetry [7,188,189,190,211,212] and others such as UV–Vis spectrophotometry or graphite furnace atomic absorption spectrometry (GFAAS) [142,194,213,214].

4.1. Electroanalytical Techniques: Voltammetry

Voltammetry is the general term for all techniques in which the current is measured as a function of electrode potential. Voltammetric-sensing techniques are characterised by simplicity, high sensitivity, good stability, low-cost instrumentation and small sample requirements. To our knowledge, the recently published literature on the detection of QDs reports the use of Square Wave Anodic Stripping Voltammetry (SWASV), Square Wave Voltammetry (SWV) and Anodic Stripping Voltammetry (ASV) techniques.

4.1.1. Square Wave Anodic Stripping Voltammetry (SWASV)

A reliable and low-cost three-electrode microchip, produced by screen-printing technology, was used for the SWASV detection of CdS QDs, such as lab-made solutions [12]. CdS QDs are adsorbed on the working electrode, where Cd2+ ions are reduced to Cd0. The subsequent oxidation of Cd0 to Cd2+ allows its electrochemical detection in NaCl 0.05 M solutions (acetate buffer solution pH 4.6). The authors report a linear range in the graph with concentrations of CdS QDs between 50 and 8000 ng mL−1, a relative standard deviation (RSD) of 6.5% and a sensitivity of 0.0009 μA/(ng mL−1). The proposed sensor allows the use of much lower sample volumes than other devices, which opens the way to a variety of applications in microreactions, separations or pre-concentrations.
More recently, Sýs et al. proposed an SWASV method to determine several heavy metals likely have originated from the dissolution of QDs, which suggests the possible indirect determination of QDs [207]. This possibility became true shortly afterwards, when the detection of CdSe/ZnS QDs and PbS QDs by the same technique was published [208]. After studying the conditions for the determination of each type of QDs separately (linearities ranged from 2.5 to 15 nM CdSe/ZnS QDs and from 0.5 to 10 nM PbS QDs), the simultaneous detection of both QDs without any signal overlaps was achieved. The application of these findings to the determination of biomolecules, using QDs as sensitive tags bonded to them, seems to be at hand in the near future.

4.1.2. Square Wave Voltammetry (SWV)

Square Wave Voltammetry has been reported as an inexpensive procedure for the rapid screening, field analysis and development of electrochemical biosensors. The SWV detection of CdS–GSH QDs was performed at pH values of 3.0 and 7.0 [54]. Different screen-printed electrodes produced reproducible signals (RSD 6.7%), although better responses were achieved by using one electrode for each measurement. Calibration was possible over the range 0.5–14.0 × 10¹⁶ QDs mL−1 (detection limit of ca. 2 × 10¹⁴ QDs).
The SWV detection of CdSe/ZnS–biotin QDs in an ammonia solution has been reported [205]. The authors report a linear range in graph with concentrations of CdSe/ZnS–biotin QDs between 0.05 and 2 nM (detection limit of 37 pM).

4.1.3. Anodic Stripping Voltammetry (ASV)

The ASV detection of CdSe/ZnS-biotin QDs in an ammonia solution has been reported [203]. The method takes advantage of the catalytic effect of the QDs on the electrodeposition of Ag at the surface of QDs. The final stripping of the electrodeposited Ag was carried out by differential-pulse voltammetry. The direct relationship between the voltammetric signal and the concentration of CdSe/ZnS-biotin QDs allows its determination.
The ASV detection of CdSe/ZnS QDs and CdSe QDs in organic medium in water after derivatisation with an amphiphilic polymer has been also reported [201]. The detection limits achieved with the selected experimental conditions were 3.0 × 10¹² nanoparticles mL−1 for CdSe QDs dispersed in organic medium and 6.0 × 10¹² nanoparticles mL−1 for water-solubilised CdSe/ZnS QDs. The method can be applied to other QDs, and since the results are expressed in number of QDs per unit volume, the procedure can be useful for the study of toxicological and bioanalytical uses and risks of QDs.
A very sensitive method was applied to the ASV determination of CdSe/ZnS-streptavidin QDs and CdSe/ZnS-biotin QDs [206]. The use of a magnetoelectrochemical supports for screen-printed electrodes to improve the anodic stripping voltammetry of cadmium due to the generated magnetohydrodynamic (MHD) effect has been reported. To create a significant MHD effect, Fe3+ was added at mM concentrations to the solution. The reduction in iron(III) simultaneously with the cadmium deposition on the electrode surface allowed the production of a high cathodic current, which generated a large Lorentz force capable of exerting a convective effect on the solution in the presence of the magnetic field. The authors report a linear range in the graph with concentrations of CdSe/ZnS-biotin QDs between 0.05 and 5 nM (detection limit of 0.05 nM).
The detection of organic-capped CdSe QDs via cadmium deposition and ASV measurement was achieved down to the highly dilute concentration of 15 pM [200]. It has been reported that the use of a large capping agent alters the mass transport and solubility of an electroactive species adjacent to the electrode. The altered mass transport regime adjacent to the electrochemical interface can be utilized to afford a highly sensitive analytical signal for the detection of CdSe QDs.
The determination of the number of Zn and Cd atoms in CdSe/ZnS QDs was achieved from ASV measurements [194]. The comparison of the results obtained from ASV and atomic absorption spectrometry (GFAAS) showed good coincidence. In contrast, a comparison of the results with concentrations obtained by UV–vis spectrophotometry revealed large discrepancies. The authors attribute this to the different nanocrystals’ absorption cross sections from different synthesis routes. ASV has been also applied for the determination of novel Ag2S QDs with two different surface coatings: 3–mercaptopropionic acid (MPA) and boronic acid (BA) [210]. The LODs achieved were 4.10 × 10¹⁰ QDs mL−1 for MPA–Ag2S QDs and 5.70 × 10¹⁰ QDs mL−1 for BA–Ag2S QDs, both with good precision and with a wide linear response range (109 to 1012 QD mL−1).

4.2. Atomic Spectrometry Techniques

4.2.1. Inductively Coupled Plasma-Mass Spectrometry (ICP–MS)

ICP–MS is a technique useful to determine low concentrations (µg L−1) and ultra-low concentrations of elements (ng L−1). Atomic elements are led through a plasma source where they become ionised. Then, these ions are sorted on account of their masses. The advantages of the ICP–MS technique over AAS (Atomic Absorption Spectrometry) or ICP–OES (inductively coupled plasma optical emission spectrometry) are lower detection limits, larger linear ranges and possibilities for detecting the isotope composition of elements. The ICP–MS technique has a multi-element character and a high sample throughput (similarly to ICP–OES), but it allows the performance of more sensitive measurements. The disadvantages and weaknesses of the ICP–MS are the occurrence of spectral and non-spectral interferences and the high costs.
ICP–MS can identify the nature and/or concentration of dissolved ions released into water during QD-polymer composites degradation. When combined with centrifugal filtration separation techniques, ICP–MS can also quantify the ratio of released nanoparticles to released ions. Single-particle ICP–MS (sp–ICP–MS) can discriminate and quantify ions and nanoparticles. However, sp–ICP–MS can only discern the presence of nanoparticles with an element-dependent size limitation of 11–20 nm for cadmium, 21–80 nm for zinc and > 200 nm for selenium.
The Cd concentration from a small planktonic crustacean (Daphnia magna) exposed to of amphiphilic polymer coated CdSe/ZnS QDs was determined by ICP–MS [11]. Fluorescence confocal laser scanning microscopy was used to visualise and spectrally distinguish QDs from competing autofluorescent signals arising from the daphnia themselves and their food sources. Fluorescence emission help localise QDs within organisms and to assess their elimination and accumulation in the digestive tract.
Since the toxic effects of QDs are mainly ascribed to the release of ions derived from their chemical components and to the generation of reactive oxygen species (ROS) [56,192,209], the determination of the elements likely to be released from QDs has been carried out from different points of view. A suspension of polyethylene glycol-coated CdSe/CdS QDs (PEG–CdSe/CdS QDs) was applied locally to the skin of mice (in some individuals after the removal of epidermis), and Cd was determined by ICP–MS in sentinel organs (liver tissue and lymph nodes) [195]. The Cd levels found showed that damaged skin enabled the penetration of QDs, which is toxicologically relevant and enables the determination of QDs, as stated by Sewell et al. [197]. These authors determined QDs by means of ICP–MS determination of Cd and Se from streptavidin-functionalized CdSe/ZnS QDs. They found that Cd and Se were independent of the QDs functionalisation, and the QDs concentrations were not different from those obtained by UV–Vis spectrophotometry. Another approach to the study of citotoxicity of CdSe QDs [209] was the incubation of human hepatocellular carcinoma cells (HepG2) for 24 h with CdSe QDs, followed by magnetic solid phase microextraction (MSPME) and a subsequent ICP–MS sensitive determination of Cd and Se (with LODs of 2.2 and 21 ng L−1, respectively).
Given the described toxic effect of the elements released, other authors forced that process. The concentration of Cd released into solution as a result of an artificially accelerated photodegradation of CdSe/ZnS and CdSe QDs polymer composites was measured using ICP–MS [56], and cadmium-containing species, <0.45 µm in size, were detected with ICP–MS.
The single-cell ICP–MS (SC–ICP–MS) method was established to determine intracellular carboxyl-coated CdSeS QDs in single cells after exposure. The results were compared and validated by flow cytometry and cell digestion methods. In contrast to other methods, SC–ICP–MS can directly detect QDs and their degradation products via elements [199]. Cells are sprayed in sequence into a high temperature plasma, where each cell is desolvated, and its constituents are atomised and ionised. The resulting ions are then detected by mass spectrometry. In the mass spectra, the intensity of each transient signal corresponds to atomic constituents in a single cell, and the frequency of transient signals is directly related to the number of cells. The number of cells detected by ICP–MS (Fcd) during acquisition time (t) can be calculated by the following equation:
F cd = ε · Q sam · N cd · t
where ε is the transport efficiency, Qsam is the sample uptake rate (mL s−1), Ncd is the cell number density (mL−1), t is the acquisition time (s) and Fcd is the number of cells detected. It is necessary for SC–ICP–MS analysis that only one cell enters the plasma at a time so that each transient signal in the mass spectrum corresponds to a single cell.
In addition, the use of ICP–MS as a detector in hyphenated techniques has also been reported. Size-exclusion chromatography coupled with ICP–MS as a detector (SEC–ICP–MS) was used to separate and quantify CdSe/ZnS QDs and their dissolved metal cations (Cd2+ and Zn2+). This was made on lab-prepared suspensions and in spiked water samples (river water, moderately hard groundwater and a secondary effluent from a municipal wastewater treatment plant) [191]. The method enabled the determination of QDs at 1 µg L−1 or more, and the results agreed with the achieved with the conventional method involving previous separation of dissolved cations by centrifuge ultrafiltration. Moreover, regarding the release of cations from the QDs, the authors observed that the QDs leached ca. 50% Zn2+ and 20% Cd2+ over 4 days within natural river water contained within a 2 mL HPLC autosampler vial. Moreover, SEC–ICP–MS was the technique applied for the speciation of four CdSe/ZnS QDs in HepG2 cells: cells were incubated with QDs and later fractioned by SEC–ICP–MS [192]. The method was based on metallomics, a novel omics science, which was developed in recent years by focusing on the amount, speciation, distribution, structure and function of metals in biological systems. This is quite interesting, because little is known about the QD species present in media after their degradation. Eventually, two types of chemical form, named as QD–1 and QD–2, were found in HepG2 cells. QD–1 and QD–2 were confirmed to be a type of QD-like nanoparticles and a type of Cd-metallothionein complex, respectively.
Asymmetric flow field-flow fractionation (AF4) coupled with ICP–MS is another hybrid technique to be mentioned. AF4–ICP–MS has been proposed for the detection of QDs in the monitoring of bioconjugation between a protein, namely a “model” monoclonal IgG antibody (Ab) and CdSe/ZnS QDs (which were surface-coated with an amphiphilic polymer) [202]. Cd, Se and S were determined, which is a critical need for the assessment of the elution of the bioconjugated or free Ab. The LOD obtained, as QD concentrations, was 11 ± 3 nM. Later, through the determination of Zn by AF4–ICP–MS, the concentration of Mn2+-doped ZnS QDs was estimated as the number of QDs per unit volume and number of surface ligands on the QDs (ligand density). These two parameters help in assessing the reliability of quantitative analytical or bioanalytical applications of the QDs [204]. L-cysteine and dihydrolipoic acid (DHLA) were compared as surface ligands, and the latter one was found to enhance the phosphorescent properties of capped QDs and their aqueous stability, while facilitates the further bioconjugation of the QDs to biomolecules.
Finally, capillary electrophoresis coupled to ICP–MS (CZE–ICP–MS) enabled the separation of L-glutathione/L-cysteine-capped CdTe QDs, and the corresponding ionic species, Cd2+ and TeO32−, likely to be released from them [193]. The method was applied to buffered solutions and complex biological matrices (cell culture solution and normal rat serum sample). The interest of ions determination is their toxicity, as commented above [56,192,209]. All the analytes were completely separated, detected and quantified, with good sensitivity (LODs below 5.5 µg L−1), precision and analytical recovery.

4.2.2. Inductively Coupled Plasma-Optical Emission Spectrometry (ICP–OES)

Inductively Coupled Plasma-Optical Emission Spectroscopy (ICP–OES) is a multi-elemental analysis technique capable of determining and quantifying, at concentrations ranging from % to ppb, most of the elements of the periodic table, with the exception of C, N, O, H, F, noble gases, some rare earths and other rare elements. The samples are introduced in liquid form, transformed by a nebuliser into an aerosol and excited by an argon plasma. The emissions of the excited atoms are collected by an optical system based on a polychromator combined with CCD detectors, obtaining an emission spectrum for the selected lines of each element.
The study of the extent of cadmium release upon exposure to a series of environmental and biological simulant fluids has been reported, in addition to the tracking of the loss of QD-characteristic fluorescence, as a marker for chemical damage to the CdSe/ZnS nanoparticles [198]. ICP–OES was used to distinguish soluble cadmium from particulate forms. Probably due to the lower sensitivity of ICP–OES compared to ICP–MS, ICP–OES is usually not the technique of choice.

4.2.3. Graphite Furnace Atomic Absorption Spectrometry (GFAAS)

Although GFAAS is a powerful analytical technique for the analysis of elements present in complex samples such as biological and environmental samples by measuring the radiation absorbed by the target element, its use in the field of QDs determination is limited.
The determination of the Cd concentration by means of GFAAS was followed by the calculation of the amount of Cd atoms in each nanocrystal [194]. The CdSe QDs concentrations were determined by factoring the number of Cd atoms per nanocrystal of relevant size (AF) into the calculation. These values were calculated with the crystallographic software Diamond 3.0. The exponential fitting curve for the total amount of cadmium atoms (y) in one nanocrystal at a given emission wavelength (nm) is stated below.
y Cd = 0.0952 · 10 0.0168   λ ,   R 2   =   0.9914

4.3. Molecular Spectrometry Techniques

4.3.1. Spectrofluorimetry

Molecular Fluorescence Spectrophotometry has been used to study aqueous solutions containing graphene QDs (GQDs), which allowed its quantification [7]. GQDs are retained in a strong anion exchange column for their preconcentration, recovered in an aqueous solution and measured in a spectrofluorimeter using the fluorescence of the GQDs as the analytical signal for the quantification. The limits of detection and quantification were 7.5 mg L−1 and 25 mg L−1, respectively. The precision for 200 mg L−1, expressed as %RSD, was 2.8%. Recovery percentages between 86.9 and 103.9% were obtained for two different concentration levels. Interferences from other nanoparticles were studied, and no significant changes were observed at the concentration levels tested.
An approach based on single-molecule two-colour coincidence detection was developed to evaluate the on-state QDs in a microfluidic flow, taking advantage of the fact that single QDs exhibit the dynamic fluctuation of fluorescence intensity (i.e., blinking) with the transition between on and off states [211]. The authors have quantified the on-state QDs by detecting the coincidence signals of red streptavidin-coated CdSe/ZnS QDs associated with the green fluorescent microspheres in a microfluidic flow, which can overcome the limitations that are inherent in the above immobilisation method and fluorescence correlation spectroscopy methods.
Spectrofluorimetric detection has been combined with poly(acrylamide) gel electrophoresis (PAGE) for the characterisation of CdSe/CdS/ZnS QDs [212].

4.3.2. Laser-Induced Fluorescence Spectrophotometry (LIF)

In LIF, the excitation step is produced by a laser source. The most important advantages of this technique are low background signal, high selectivity towards the analyte, the obtention of information about the rotational-vibrational structure of the ground or excited state of the sample, and time-resolved information if pulsed lasers are used. In addition, polarisation-dependent measurements are easy to implement since most laser beams are linearly polarised.
It has been reported the quantification of the 3.1 nm QDs–TOPO/TOP/SDS by using LIF detection (excitation 480 nm and emission 520 nm) [189]. The surfactants used to achieve the surface functionalisation were trioctylphosphine oxide/trioctylphosphine (TOPO/TOP) and sodium dodecyl sulfate (SDS). A log-linear regression was found to provide the following equation: Y = −0.21 + 0.215 log X, R2 = 0.979, where Y is the peak area, and X is the concentration of the QDs–TOPO/TOP/SDS complex. These free QDs were separated by capillary zone electrophoresis (CZE) based on the differences in the charge-to-mass ratio of the QDs–TOPO/TOP/SDS complexes, and the detection was carried out with UV–Vis and laser-induced fluorescence (LIF) techniques obtaining detection limits 5-times lower with CE–LIF.

4.3.3. Selective Plane Illumination Microscopy (SPIM)

SPIM is a fluorescence microscopy technique that uses a focused light sheet to illuminate the sample from the side. SPIM achieves excellent resolutions at high-penetration depths while being minimally invasive at the same time. SPIM offers a number of advantages over established techniques such as strongly reduced photo-bleaching, high dynamic range and high acquisition speed. It has been reported a setup for SPIM, which enables the detection and tracking of single streptavidin-coated CdSe/ZnS QDs in model biological systems, with the resolution of confocal microscopy and the optical penetration beyond 300 μm [188,190].

4.3.4. UV–Vis Spectrophotometry

The concentration determination was performed by taking the extinction coefficient into account [180]. The CdSe/ZnS QDs concentrations determined by Schmelz et al. [213] and Yu et al. [213] provided a much higher Cd concentration in the solution if compared to the ASV and AAS data. However, the extinction coefficient and, thus, the concentration determined by Striolo et al. [214] seem to be comparable to the ASV and AAS. Due to the large discrepancies from different work groups, it is conceivable that the extinction coefficient of nanocrystals in comparison to organic fluorophores is additionally a function of the crystal’s quality. High crystallinity, i.e., fewer defects, guarantees higher quantum yields. Since the quantum yield of nanocrystals is strongly influenced by surfactants, their coverage rate to nanocrystals will differ not only in terms of the photoluminescence characteristic but also, conceivably, in terms of the absorption cross section. This can lead to a different extinction coefficient. Hence, nanocrystals prepared by different syntheses should be compared carefully, even if they have similarly shaped absorption characteristics.

5. Concluding Remarks and Prospects

The composition of NMs determines the size from which a material exhibits quantum confinement effect and, therefore, the unique optical and electronic properties of QDs. Semiconductor materials of a size less than double the bulk exciton Bohr radius undergo quantum confinement. Since electrons within QDs are confined to discrete energy levels, the wavelengths associated to the formation and recombination of excitons, i.e., the UV–Vis absorption and fluorescence emission of QDs, respectively, are tuneable by changing the particle’s size. An appropriate selection of both size and composition can lead to fluorescence wavelengths in both visible (380–750 nm) and near-infrared (750–2500 nm) ranges. Type I CS QDs are the most common in bioanalytical applications since this configuration provides the best confinement of the exciton and the highest rates of radiative electron-hole recombination (i.e., brightness of the photoluminescence).
QDs are frequently coated with an external layer or protective shell responsible for stability, solubility and functionalisation. Organic ligands with hydrophilic tails, such as –COOH, –OH, –SH, etc., are chosen to produce water soluble QDs. By contrast, ligands featuring a hydrocarbon tail, such as trioctylphosphine/trioctylphosphine oxide (TOP/TOPO), long-chain alkylamines and alkylthiols, etc., can afford QDs with higher solubility in nonpolar solvents. The external layer of passivating ligands enhances the stability of QDs by preserving under-coordinated atoms existing on the outermost layer of the core material against chemical processes such as oxidation and degradation. This is of crucial importance in QDs composed of a cadmium-based core material, such as those used as diagnostic and therapeutic tools in nanomedicine.
Because of their small particle size, QDs have a high ratio of surface atoms to core atoms, which causes the surface atoms to play a decisive role not only in properties but also in the reactivity of the entire particle. The lattice termination on the QD’s surface has as a consequence that surface atoms are typically undercoordinated, which makes them more reactive than the core atoms. The typical processes in the reaction of dissolved ligands (adsorbates) with nanomaterial surfaces (adsorbents) can be classified into two general types: chemisorption and physisorption. Forces such as weak hydrogen bonds, electrostatic interactions, van der Waals interactions, hydrophobic interactions, etc., are involved in physisorption. The forces involved in chemisorption are valence forces of the same type as those operating in the formation of chemical compounds, such as the formation of coordinate bonds (surface complexation).
The possibilities offered by NMR to analyse bound ligands have been used by various research groups to study the composition of the ligand shell, to analyse the binding between ligands and NMs and to determine the relative binding strength of different ligands. NMR allowed the quantification of the ligands adsorbed to QDs by the analysis of signals originating from the protons of the ligands that are bound to the QD surface and the inclusion of an internal standard. A combined 1H–NMR/DOSY procedure can be a complementary method for the measurement of the NM size (hydrodynamic diameter, dH) and particle size distribution. The FTIR technique has been successfully applied to study surface effects on nanomaterials. It can be used to obtain a deep insight into the functional groups on the surface of functionalized nanomaterials. Raman spectroscopy, such as FTIR, yields information about intra- and inter-molecular vibrations and can provide additional understanding about the interactions between QDs and surface ligands. As fluorescence quenching or enhancement is strongly distance-dependent, fluorescence spectroscopy can provide information on the direct NM–ligand interface, which could shed light on the adsorption dynamics and mechanism. The binding of organic ligands on NM surfaces may change the absorption spectra of surface ligands or NMs, which makes the UV–vis spectroscopy suitable for providing complementary information. ITC is a straightforward method for measuring the association process between surface ligands and NMs in a quantitative manner, although it is time consuming and relatively high concentrations of titrant are needed. During the titration, the heat change is directly recorded and important thermodynamic parameters (including the change of enthalpy ΔH, entropy ΔS and Gibbs-free energy ΔG) and reaction parameters between QDs and surface ligands (including the binding constant and binding stoichiometry) can be calculated. The SEC method is simple, quick and relatively cheap; however, it provides no further information on the adsorption mode. The adsorption of organic ligands on NMs would change their surface charge, thus influencing the zeta (ζ) potential. Although ζ potential analyses cannot provide direct information on the surface’s binding, it served as an important auxiliary to elucidate the adsorption mechanism. Powder X-ray diffraction (XRD) is a common characterisation technique for nanoscale materials. An analysis of a sample by powder XRD provides important information that is complementary to various microscopic and spectroscopic methods, such as phase identification, sample purity, crystallite size and, in some cases, morphology. As a bulk technique, the information it provides can be correlated with microscopy data to test if microscopic observations on a small number of particles are representative of most of the sample. X-ray absorption spectroscopy is well suited for the investigation of nanomaterials, and size-dependent effects are readily detectable for nanoparticles with a size below about 10–15 nm.
Although, today, different instrumental analytical techniques can be used to study the chemical composition of QDs, their structure and the interaction with different types of ligands, only few techniques have been used for the detection and determination of QDs in real samples.
Electrochemical techniques such as voltammetry in different modes such as SWASV, SWV and ASV have been applied in different media but not in complex matrices. UV–Vis spectrophotometry and spectrofluorimetry have been proposed for the analysis of complex samples, but at the moment, no application for real samples has been reported.
Among the Atomic Spectrometry techniques, the GFAAS has been used to determine the chemical composition of the QDs, but it was not applied to quantify the presence of QDs in real samples. ICP–OES has been used to determine the liberation of cadmium from QDs in simulant fluids. In relation to ICP–MS, due to the low size of the majority of the QDs, the single particle mode (sp–ICP–MS) introduces problems in detecting this type of metal nanoparticles. Only the ICP–MS working in the single-cell mode (SC–ICP–MS) has been applied to study Cd concentrations in cells exposed to CdSe/ZnS QDs.
Due to the limitations of the current analytical techniques to perform the detection and quantification of QDs in complex samples, as well as the great concern about their liberation at the different environmental compartments and their possible toxicity for humans, it is necessary to work with a multidisciplinary perspective in the development of new analytical methods for the detection of these nanomaterials in complex real samples.
To develop new methodologies for the determination of QDs in complex media, it is mandatory to consider not only the capabilities and limitations of analytical techniques at hand but also the properties of the QDs, especially those related to their structure and surface characteristics, as has been described throughout this review.

Author Contributions

J.S.-M.: Conceptualization, visualisation, writing—original draft, and writing—review and editing. P.B.-B.: Conceptualisation, writing—review. M.A.-S.: Conceptualisation, writing—original draft, and writing—review and editing. M.F. and J.C.-V.: Writing—original draft. A.M.G.-D. and Y.A.-I.: Writing—original draft, preparation of figures, and visualisation. All authors have read and agreed to the published version of the manuscript.

Funding

This research was funded by the Ministerio de Ciencia, Innovación y Universidades of Spain and Unión Europea (Fondo Europeo de Desarrollo Regional) Ref. RTI2018-099222-B-I00; Dirección Xeral de I+D-Xunta de Galicia, Grupos de Referencia Competitiva (Ref. ED431C2018/19) and Strategic Grouping in Materials AEMAT (ED431 E2018/0).

Data Availability Statement

Not applicable.

Conflicts of Interest

The authors declare no conflict of interest.

References

  1. Brus, L.E. Electron-Electron and electron-hole interactions in small semiconductor crystallites: The size dependence of the lowest excited electronic state. J. Chem. Phys. 1984, 80, 4403–4409. [Google Scholar] [CrossRef] [Green Version]
  2. Vasudevan, D.; Ranganathan Gaddam, R.; Trinchi, A.; Cole, I. Core-Shell quantum dots: Properties and applications. J. Alloys Comp. 2015, 636, 395–404. [Google Scholar] [CrossRef]
  3. Michalet, X.; Pinaud, F.F.; Bentolila, L.A.; Tsay, J.M.; Doose, S.; Li, J.J.; Sundaresan, G.; Wu, A.M.; Gambhir, S.S.; Weiss, S. Quantum dots for live cells, in vivo imaging, and diagnostics. Science 2005, 307, 538–544. [Google Scholar] [CrossRef] [PubMed] [Green Version]
  4. Clift, M.J.D.; Stone, V. Quantum dots: An insight and perspective of their biological interaction and how this relates to their relevance for clinical use. Theranostics 2012, 2, 668–680. [Google Scholar] [CrossRef] [PubMed] [Green Version]
  5. Petryayeva, E.; Algar, W.R.; Medintz, I.L. Quantum dots in bioanalysis: A review of applications across various platforms for fluorescence spectroscopy and imaging. Appl. Spectrosc. 2013, 67, 215–252. [Google Scholar] [CrossRef] [Green Version]
  6. Tsoi, K.M.; Dai, Q.; Alman, B.A.; Chan, W.C.W. Are quantum dots toxic? Exploring the discrepancy between cell culture and animal studies. Acc. Chem. Res. 2013, 46, 662–671. [Google Scholar] [CrossRef]
  7. Benítez-Martínez, S.; Valcárcel, M. Fluorescent determination of graphene quantum dots in water samples. Anal. Chim. Acta 2015, 896, 78–84. [Google Scholar] [CrossRef]
  8. Chu, K.; Adsetts, J.R.; He, S.; Zhan, Z.; Yang, L.; Wong, J.M.; Love, D.A.; Ding, Z. Electrogenerated chemiluminescence and electroluminescence of N-doped graphene quantum dots fabricated from an electrochemical exfoliation process in nitrogen-containing electrolytes. Chem. Eur. J. 2020, 26, 15892–15900. [Google Scholar] [CrossRef]
  9. Chen, S.; Jiang, S.; Jiang, H. A review on conversion of crayfish-shell derivatives to functional materials and their environmental applications. J. Bioresour. Bioprod. 2020, 5, 238–247. [Google Scholar] [CrossRef]
  10. Manan, S.; Ullah, M.W.; Ul-Islam, M.; Atta, O.M.; Yang, G. Synthesis and applications of fungal mycelium-based advanced functional materials. J. Bioresour. Bioprod. 2021, 6, 1–10. [Google Scholar] [CrossRef]
  11. Lewinski, N.A.; Zhu, H.; Jo, H.-J.; Pham, D.; Kamath, R.R.; Ouyang, C.R.; Vulpe, C.D.; Colvin, V.L.; Drezek, R.A. Quantification of water solubilized CdSe/ZnS quantum dots in Daphnia magna. Environ. Sci. Technol. 2010, 44, 1841–1846. [Google Scholar] [CrossRef] [PubMed]
  12. Medina-Sánchez, M.; Miserere, S.; Marín, S.; Aragaya, G.; Merkoçi, A. On-Chip electrochemical detection of CdS quantum dots using normal and multiple recycling flow through modes. Lab. Chip 2012, 12, 2000–2005. [Google Scholar] [CrossRef]
  13. Ragusa, A.; Zacheo, A.; Pellegrino, T.; Manna, L. Quantum dot nanoparticles: Properties, surface functionalization, and their applications in biosensoring and imaging. In Nanostructured Materials for Biomedical Applications; Tan, M.C., Chow, G.M., Ren, L., Eds.; Transworld Research Network: Kerala, India, 2009; pp. 151–221. [Google Scholar]
  14. Ma, Y.; Zhang, Y.; Yu, W.W. Near infrared emitting quantum dots: Synthesis, luminescence properties and applications. J. Mater. Chem. C 2019, 7, 13662–13679. [Google Scholar] [CrossRef]
  15. Mo, D.; Hu, L.; Zeng, G.; Chen, G.; Wan, J.; Yu, Z.; Huang, Z.; He, K.; Zhang, C.; Cheng, M. Cadmium-Containing quantum dots: Properties, applications, and toxicity. Appl. Microbiol. Biotechnol. 2017, 101, 2713–2733. [Google Scholar] [CrossRef] [PubMed]
  16. Jain, S.; Bharti, S.; Bhullar, G.K.; Tripathi, S.K. I-III-VI core/shell QDs: Synthesis, characterizations and applications. J. Lumin. 2020, 219, 116912–116939. [Google Scholar] [CrossRef]
  17. Tsolekile, N.; Parani, S.; Matoetoe, M.C.; Songca, S.P.; Oluwafemi, O.S. Evolution of ternary I–III–VI QDs: Synthesis, characterization and application. Nano Struct. Nano Objects 2017, 12, 46–56. [Google Scholar] [CrossRef]
  18. Ma, Q.; Su, X. Near-infrared quantum dots: Synthesis, functionalization and analytical applications. Analyst 2010, 135, 1867–1877. [Google Scholar] [CrossRef]
  19. Volkov, Y. Quantum dots in nanomedicine: Recent trends, advances and unresolved issues. Biochem. Biophys. Res. Commun. 2015, 468, 419–427. [Google Scholar] [CrossRef] [Green Version]
  20. Frigerio, C.; Ribeiro, D.S.M.; Rodrigues, S.S.M.; Abreu, V.L.R.G.; Barbosa, J.A.C.; Prior, J.A.V.; Marques, K.L.; Santos, J.L.M. Application of quantum dots as analytical tools in automated chemical analysis: A review. Anal. Chim. Acta 2012, 735, 9–22. [Google Scholar] [CrossRef]
  21. Filali, S.; Pirot, F.; Miossec, P. Biological applications and toxicity minimization of semiconductor quantum dots. Trends Biotechnol. 2020, 38, 163–177. [Google Scholar] [CrossRef]
  22. Ji, X.; Peng, F.; Zhong, Y.; Su, Y.; He, Y. Fluorescent quantum dots: Synthesis, biomedical optical imaging, and biosafety assessment. Colloids Surf. B 2014, 124, 132–139. [Google Scholar] [CrossRef] [PubMed]
  23. Wang, Y.; Tang, M. Dysfunction of various organelles provokes multiple cell death after quantum dot exposure. Int. J. Nanomed. 2018, 13, 2729–2742. [Google Scholar] [CrossRef] [Green Version]
  24. Luo, G.; Long, J.; Zhang, B.; Liu, C.; Ji, S.; Xu, J.; Yu, X.; Ni, Q. Quantum dots in cancer therapy. Expert Opin. Drug Deliv. 2012, 9, 47–58. [Google Scholar] [CrossRef]
  25. Zhu, C.; Chen, Z.; Gao, S.; Goh, B.L.; Bin, S.I.; Lwe, K.W.; Wu, Y.; Wu, C.; Su, X. Recent advances in non-toxic quantum dots and their biomedical applications. Prog. Nat. Sci. Mater. Int. 2019, 29, 628–640. [Google Scholar] [CrossRef]
  26. Wang, Y.; Tang, M. Review of in vitro toxicological research of quantum dot and potentially involved mechanisms. Sci. Total Environ. 2018, 625, 940–962. [Google Scholar] [CrossRef] [PubMed]
  27. Libralato, G.; Galdiero, E.; Falanga, A.; Carotenuto, R.; De Alteriis, E.; Guida, M. Toxicity effects of functionalized quantum dots, gold and polystyrene nanoparticles on target aquatic biological models: A review. Molecules 2017, 22, 1439. [Google Scholar] [CrossRef] [PubMed] [Green Version]
  28. Rocha, T.L.; Mestre, N.C.; Saboia-Morais, S.M.T.; Bebianno, M.J. Environmental behaviour and ecotoxicity of quantum dots at various trophic levels: A review. Environ. Int. 2017, 98, 1–17. [Google Scholar] [CrossRef] [PubMed]
  29. Hu, L.; Zhang, C.; Zeng, G.; Chen, G.; Wan, J.; Guo, Z.; Wu, H.; Yu, Z.; Zhou, Y.; Liu, J. Metal-based quantum dots: Synthesis, surface modification, transport and fate in aquatic environments and toxicity to microorganisms. RSC Adv. 2016, 6, 78595–78610. [Google Scholar] [CrossRef]
  30. Zhan, Q.; Tang, M. Research advances on apoptosis caused by quantum dots. Biol. Trace Elem. Res. 2014, 161, 3–12. [Google Scholar] [CrossRef]
  31. Wu, T.; Tang, M. Toxicity of quantum dots on respiratory system. Inhal. Toxicol. 2014, 26, 128–139. [Google Scholar] [CrossRef]
  32. Sun, H.; Zhang, F.; Wei, H.; Yang, B. The effects of composition and surface chemistry on the toxicity of quantum dots. J. Mater. Chem. B 2013, 1, 6485–6494. [Google Scholar] [CrossRef] [PubMed]
  33. Yong, K.-T.; Law, W.-C.; Hu, R.; Ye, L.; Liu, L.; Swihart, M.T.; Prasad, P.N. Nanotoxicity assessment of quantum dots: From cellular to primate studies. Chem. Soc. Rev. 2013, 42, 1236–1250. [Google Scholar] [CrossRef] [PubMed]
  34. Ahmad, F.; Pandey, A.K.; Herzog, A.B.; Rose, J.B.; Gerba, C.P.; Hashsham, S.A. Environmental applications and potential health implications of quantum dots. J. Nanopart. Res. 2012, 14, 1038. [Google Scholar] [CrossRef]
  35. Xu, L.; Chen, C. Physiological behavior of quantum dots. WIREs Nanomed. Nanobiotechnol. 2012, 4, 620–637. [Google Scholar] [CrossRef]
  36. Drbohlavova, J.; Adam, V.; Kizek, R.; Hubalek, J. Quantum dots-characterization, preparation and usage in biological systems. Int. J. Mol. Sci. 2009, 10, 656–673. [Google Scholar] [CrossRef]
  37. Bajorowicz, B.; Kobylański, M.P.; Gołąbiewska, A.; Nadolna, J.; Zaleska-Medynska, A.; Malankowska, A. Quantum dot-decorated semiconductor micro-and nanoparticles: A review of their synthesis, characterization and application in photocatalysis. Adv. Colloid Interface Sci. 2018, 256, 352–372. [Google Scholar] [CrossRef]
  38. Stanisavljevic, M.; Vaculovicova, M.; Kizek, R.; Adam, V. Capillary electrophoresis of quantum dots: Minireview. Electrophoresis 2014, 35, 1929–1937. [Google Scholar] [CrossRef]
  39. Sang, F.; Huang, X.; Ren, J. Characterization and separation of semiconductor quantum dots and their conjugates by capillary electrophoresis. Electrophoresis 2014, 35, 793–803. [Google Scholar] [CrossRef]
  40. Kim, H.S.; Yoon, K.B. Preparation and characterization of CdS and PbS quantum dots in zeolite Y and their applications for nonlinear optical materials and solar cell. Coord. Chem. Rev. 2014, 263–264, 239–256. [Google Scholar] [CrossRef]
  41. Bilan, R.; Fleury, F.; Nabiev, I.; Sukhanova, A. Quantum dot surface chemistry and functionalization for cell targeting and imaging. Bioconjug. Chem. 2015, 26, 609–624. [Google Scholar] [CrossRef]
  42. Kilina, S.V.; Tamukong, P.K.; Kilin, D.S. Surface chemistry of semiconducting quantum dots: Theoretical perspectives. Acc. Chem. Res. 2016, 49, 2127–2135. [Google Scholar] [CrossRef] [PubMed]
  43. Hines, D.A.; Kamat, P.V. Recent advances in quantum dot surface chemistry. ACS Appl. Mater. Interfaces 2014, 6, 3041–3057. [Google Scholar] [CrossRef] [PubMed]
  44. Le, P.; Vaidya, R.; Smith, L.D.; Han, Z.; Zahid, M.U.; Winter, J.; Sarkar, S.; Chung, H.J.; Perez-Pinera, P.; Selvin, P.R.; et al. Optimizing quantum dot probe size for single-receptor imaging. ACS Nano 2020, 14, 8343–8358. [Google Scholar] [CrossRef] [PubMed]
  45. Enright, B.; Fitzmaurice, D. Spectroscopic determination of electron and hole effective masses in a nanocrystalline semiconductor film. J. Phys. Chem. 1996, 100, 1027–1035. [Google Scholar] [CrossRef]
  46. Tauc, J.; Grigorovici, R.; Vancu, A. Optical properties and electronic structure of amorphous germanium. Phys. Status Solidi 1966, 15, 627–637. [Google Scholar] [CrossRef]
  47. Viezbicke, B.D.; Patel, S.; Davis, B.E.; Birnie, D. Evaluation of the Tauc method for optical absorption edge determination: ZnO thin films as a model system. Phys. Status Solidi B 2015, 252, 1700–1710. [Google Scholar] [CrossRef]
  48. Maxwell, T.; Nogueira Campos, M.G.; Smith, S.; Doomra, M.; Thwin, Z.; Santra, S. Quantum dots. In Nanoparticles for Biomedical Applications. Fundamental Concepts, Biological Interactions and Clinical Applications; Chung, E.J., Leon, L., Rinaldi, C., Eds.; Elsevier: Amsterdan, The Netherlands, 2020; pp. 243–265. [Google Scholar]
  49. Smith, A.M.; Nie, S. Semiconductor nanocrystals: Structure, properties, and band gap engineering. Acc. Chem. Res. 2010, 43, 190–200. [Google Scholar] [CrossRef] [Green Version]
  50. Soloviev, V.N.; Eichhöfer, A.; Fenske, D.; Banin, U. Molecular limit of a bulk semiconductor: Size dependence of the “band gap” in CdSe cluster molecules. J. Am. Chem. Soc. 2000, 122, 2673–2674. [Google Scholar] [CrossRef]
  51. Guzelturk, B.; Hernandez Martinez, P.L.; Zhang, Q.; Xiong, Q.; Sun, H.; Sun, X.W.; Govorov, A.O.; Demir, H.V. Excitonics of semiconductor quantum dots and wires for lighting and displays. Laser Photonics Rev. 2014, 8, 73–93. [Google Scholar] [CrossRef]
  52. Dramićanin, M. Luminescence Thermometry: Methods, Materials, and Applications; Woodhead Publishing: Cambridge, UK, 2018. [Google Scholar]
  53. Chaparro Barriera, E.A.; Bailón-Ruiz, S.J. Fabrication, characterization, and nanotoxicity of water stable quantum dots. MRS Adv. 2020, 5, 2231–2239. [Google Scholar] [CrossRef]
  54. Merkoçi, A.; Marcolino-Junior, L.H.; Marín, S.; Fatibello-Filho, O.; Alegret, S. Detection of cadmium sulphide nanoparticles by using screen-printed electrodes and a handheld device. Nanotechnology 2007, 18, 035502. [Google Scholar] [CrossRef] [PubMed]
  55. Owens, S.A.; Carpenter, M.C.; Sonne, J.W.H.; Miller, C.A.; Renehan, J.R.; Odonkor, C.A.; Henry, E.M.; Miles, D.T. Reversed-Phase HPLC separation of water-soluble, monolayer-protected quantum dots. J. Phys. Chem. C 2011, 115, 18952–18957. [Google Scholar] [CrossRef]
  56. Gallagher, M.J.; Buchman, J.T.; Qiu, T.A.; Zhi, B.; Lyons, T.Y.; Landy, K.M.; Rosenzweig, Z.; Haynes, C.L.; Fairbrother, D.H. Release, detection and toxicity of fragments generated during artificial accelerated weathering of CdSe/ZnS and CdSe quantum dot polymer composites. Environ. Sci. Nano 2018, 5, 1694–1710. [Google Scholar] [CrossRef]
  57. Becerra, L.R.; Murray, C.B.; Griffin, R.G.; Bawendi, M.G. Investigation of the surface morphology of capped CdSe nanocrystallites by 31P NMR. J. Chem. Phys. 1994, 100, 3297–3300. [Google Scholar] [CrossRef]
  58. Taylor, J.; Kippeny, T.; Rosenthal, S.J. Surface stoichiometry of CdSe nanocrystals determined by Rutherford backscattering spectroscopy. J. Cluster Sci. 2001, 12, 571–582. [Google Scholar] [CrossRef]
  59. Bowen-Katari, J.E.; Colvin, V.L.; Alivisatos, A.P. X-ray photoelectron spectroscopy of CdSe nanocrystals with application to studies of the nanocrystal surface. J. Phys. Chem. 1994, 98, 4109–4117. [Google Scholar] [CrossRef]
  60. Morris-Cohen, A.J.; Donakowski, M.D.; Knowles, K.E.; Weiss, E.A. The effect of a common purification procedure on the chemical composition of the surfaces of CdSe quantum dots synthesized with trioctylphosphine oxide. J. Phys. Chem. C 2009, 114, 897–906. [Google Scholar] [CrossRef]
  61. Philippe, A.; Schaumann, G.E. Interactions of dissolved organic matter with natural and engineered inorganic colloids: A review. Environ. Sci. Technol. 2014, 48, 8946–8962. [Google Scholar] [CrossRef]
  62. Yang, K.; Xing, B.S. Adsorption of fulvic acid by carbon nanotubes from water. Environ. Pollut. 2009, 157, 1095–1100. [Google Scholar] [CrossRef]
  63. Sun, Q.; Xie, H.B.; Chen, J.; Li, X.; Wang, Z.; Sheng, L. Molecular dynamics simulations on the interactions of low molecular weight natural organic acids with C-60. Chemosphere 2013, 92, 429–434. [Google Scholar] [CrossRef]
  64. Hyung, H.; Kim, J.H. Natural organic matter (NOM) adsorption to multi-walled carbon nanotubes: Effect of NOM characteristics and water quality parameters. Environ. Sci. Technol. 2008, 42, 4416–4421. [Google Scholar] [CrossRef] [PubMed]
  65. Wang, X.L.; Tao, S.; Xing, B.S. Sorption and competition of aromatic compounds and humic acid on multiwalled carbon nanotubes. Environ. Sci. Technol. 2009, 43, 6214–6219. [Google Scholar] [CrossRef] [PubMed]
  66. Yang, K.; Xing, B. Adsorption of organic compounds by carbon nanomaterials in aqueous phase: Polanyi theory and its application. Chem. Rev. 2010, 110, 5989–6008. [Google Scholar] [CrossRef]
  67. Liu, W.; Chen, H.; Pan, D.; Ji, X. Electrostatic interaction mediates the formation of vesicular structures from coassembly of PS-b-PAA with quantum dots. Langmuir 2019, 35, 12501–12508. [Google Scholar] [CrossRef] [PubMed]
  68. Luo, Q.-Y.; Lin, Y.; Peng, J.; Liu, S.-L.; Zhang, Z.-L.; Tian, Z.-Q.; Pang, D.-W. Evaluation of nonspecific interactions between quantum dots and proteins. Phys. Chem. Chem. Phys. 2014, 16, 7677–7680. [Google Scholar] [CrossRef]
  69. Liu, J.; Yang, X.; Wang, K.; Yang, R.; Ji, H.; Yang, L.; Wu, C. A switchable fluorescent quantum dot probe based on aggregation/disaggregation mechanism. Chem. Commun. 2011, 47, 935–937. [Google Scholar] [CrossRef]
  70. Wang, X.L.; Shu, L.; Wang, Y.Q.; Xu, B.B.; Bai, Y.C.; Tao, S.; Xing, B.S. Sorption of peat humic acids to multi-walled carbon nanotubes. Environ. Sci. Technol. 2011, 45, 9276–9283. [Google Scholar] [CrossRef]
  71. Zhang, Y.; Chen, Y.; Westerhoff, P.; Crittenden, J.C. Stability and removal of water soluble CdTe quantum dots in water. Environ. Sci. Technol. 2008, 42, 321–325. [Google Scholar] [CrossRef]
  72. Mashayekhi, H.; Ghosh, S.; Du, P.; Xing, B. Effect of natural organic matter on aggregation behavior of C-60 fullerene in water. J. Colloid Interface Sci. 2012, 374, 111–117. [Google Scholar] [CrossRef]
  73. Kessler, M.L.; Starr, H.E.; Knauf, R.R.; Rountree, K.J.; Dempsey, J.L. Exchange equilibria of carboxylate-terminated ligands at PbS nanocrystal surfaces. Phys. Chem. Chem. Phys. 2018, 20, 23649–23655. [Google Scholar] [CrossRef]
  74. De Roo, J.; De Keukeleere, K.; Hens, Z.; Van Driessche, I. From ligands to binding motifs and beyond; the enhanced versatility of nanocrystal surfaces. Dalton Trans. 2016, 45, 13277–13283. [Google Scholar] [CrossRef] [PubMed] [Green Version]
  75. Owen, J.S. The coordination chemistry of nanocrystal surfaces. Science 2015, 347, 615–616. [Google Scholar] [CrossRef] [PubMed]
  76. Liu, X.; Cheng, L.; Lei, J.; Liu, H.; Ju, H. Formation of surface traps on quantum dots by bidentate chelation and their application in low-potential electrochemiluminescent biosensing. Chem. Eur. J. 2010, 16, 10764–10770. [Google Scholar] [CrossRef] [PubMed]
  77. Navarro, D.A.G.; Watson, D.F.; Aga, D.S.; Banerjee, S. Natural organic matter-mediated phase transfer of quantum dots in the aquatic environment. Environ. Sci. Technol. 2009, 43, 677–682. [Google Scholar] [CrossRef]
  78. Navarro, D.A.; Banerjee, S.; Aga, D.S.; Watson, D.F. Partitioning of hydrophobic CdSe quantum dots into aqueous dispersions of humic substances: Influence of capping-group functionality on the phase-transfer mechanism. J. Colloid Interface Sci. 2010, 348, 119–128. [Google Scholar] [CrossRef]
  79. Bloemen, M.; Debruyne, D.; Demeyer, P.-J.; Clays, K.; Gils, A.; Geukens, N.; Bartic, C.; Verbiest, T. Catechols as ligands for CdSe–ZnS quantum dots. RSC Adv. 2014, 4, 10208–10211. [Google Scholar] [CrossRef]
  80. Hens, Z.; Martins, J.C. A solution NMR toolbox for characterizing the surface chemistry of colloidal nanocrystals. Chem. Mater. 2013, 25, 1211–1221. [Google Scholar] [CrossRef]
  81. Zeng, B.; Palui, G.; Zhang, C.; Zhan, N.; Wang, W.; Ji, X.; Chen, B.; Mattoussi, H. Characterization of the ligand capping of hydrophobic CdSe–ZnS quantum dots using NMR spectroscopy. Chem. Mater. 2018, 30, 225–238. [Google Scholar] [CrossRef]
  82. Hens, Z.; Moreels, I.; Martins, J.C. In situ 1H NMR study on the trioctylphosphine oxide capping of colloidal InP nanocrystals. ChemPhysChem 2005, 6, 2578–2584. [Google Scholar] [CrossRef]
  83. Ribot, F.; Escax, V.; Roiland, C.; Sanchez, C.; Martins, J.C.; Biesemans, M.; Verbruggen, I.; Willem, R. In situ evaluation of interfacial affinity in CeO2 based hybrid nanoparticles by pulsed field gradient NMR. Chem. Commun. 2005, 1019–1021. [Google Scholar] [CrossRef]
  84. Fritzinger, B.; Moreels, I.; Lommens, P.; Koole, R.; Hens, Z.; Martins, J.C. In situ observation of rapid ligand exchange in colloidal nanocrystal suspensions using transfer NOE nuclear magnetic resonance spectroscopy. J. Am. Chem. Soc. 2009, 131, 3024–3032. [Google Scholar] [CrossRef] [PubMed]
  85. Moreels, I.; Fritzinger, B.; Martins, J.C.; Hens, Z. Surface chemistry of colloidal PbSe nanocrystals. J. Am. Chem. Soc. 2008, 130, 15081–15086. [Google Scholar] [CrossRef] [PubMed]
  86. Cros-Gagneux, A.; Delpech, F.; Nayral, C.; Cornejo, A.; Coppel, Y.; Chaudret, B. Surface chemistry of InP quantum dots: A comprehensive study. J. Am. Chem. Soc. 2010, 132, 18147–18157. [Google Scholar] [CrossRef] [PubMed]
  87. Moreels, I.; Justo, Y.; De Geyter, B.; Haustraete, K.; Martins, J.C.; Hens, Z. Size-Tunable, bright, and stable PbS quantum dots: A surface chemistry study. ACS Nano 2011, 5, 2004–2012. [Google Scholar] [CrossRef]
  88. Moreels, I.; Martins, J.C.; Hens, Z. Ligand adsorption/desorption on sterically stabilized InP colloidal nanocrystals: Observation and thermodynamic analysis. ChemPhysChem 2006, 7, 1028–1031. [Google Scholar] [CrossRef]
  89. Van Lokeren, L.; Maheut, G.; Ribot, F.; Escax, V.; Verbruggen, I.; Sanchez, C.; Martins, J.C.; Biesemans, M.; Willem, R. Characterization of titanium dioxide nanoparticles dispersed in organic ligand solutions by using a diffusion-ordered spectroscopy-based strategy. Chem. Eur. J. 2007, 13, 6957–6966. [Google Scholar] [CrossRef]
  90. Shen, L.; Soong, R.; Wang, M.; Lee, A.; Wu, C.; Scholes, G.D.; Macdonald, P.M.; Winnik, M.A. Pulsed field gradient NMR studies of polymer adsorption on colloidal CdSe quantum dots. J. Phys. Chem. B 2008, 112, 1626–1633. [Google Scholar] [CrossRef] [Green Version]
  91. Hassinen, A.; Moreels, I.; Donega, C.D.M.; Martins, J.C.; Hens, Z. Nuclear magnetic resonance spectroscopy demonstrating dynamic stabilization of CdSe quantum dots by alkylamines. J. Phys. Chem. Lett. 2010, 1, 2577–2581. [Google Scholar] [CrossRef] [Green Version]
  92. Fritzinger, B.; Capek, R.K.; Lambert, K.; Martins, J.C.; Hens, Z. Utilizing self-exchange to address the binding of carboxylic acid ligands to CdSe quantum dots. J. Am. Chem. Soc. 2010, 132, 10195–10201. [Google Scholar] [CrossRef]
  93. Donakowski, M.D.; Godbe, J.M.; Sknepnek, R.; Knowles, K.E.; de la Cruz, M.O.; Weiss, E.A. A quantitative description of the binding equilibria of para-substituted aniline ligands and CdSe quantum dots. J. Phys. Chem. C 2010, 114, 22526–22534. [Google Scholar] [CrossRef]
  94. Wallner, A.; Jafri, S.H.M.; Blom, T.; Gogoll, A.; Leifer, K.; Baumgartner, J.; Ottosson, H. Formation and NMR spectroscopy of ω-thiol protected α, ω-alkanedithiol-coated gold nanoparticles and their usage in molecular charge transport junctions. Langmuir 2011, 27, 9057–9067. [Google Scholar] [CrossRef] [PubMed]
  95. Hughes, B.K.; Ruddy, D.A.; Blackburn, J.L.; Smith, D.K.; Bergren, M.R.; Nozik, A.J.; Johnson, J.C.; Beard, M.C. Control of PbSe quantum dot surface chemistry and photophysics using an alkylselenide ligand. ACS Nano 2012, 6, 5498–5506. [Google Scholar] [CrossRef]
  96. Coppel, Y.; Spataro, G.; Pages, C.; Chaudret, B.; Maisonnat, A.; Kahn, M.L. Full characterization of colloidal solutions of long-alkyl-chain-amine-stabilized ZnO nanoparticles by NMR spectroscopy: Surface state, equilibria, and affinity. Chem. Eur. J. 2012, 18, 5384–5393. [Google Scholar] [CrossRef] [PubMed]
  97. Gomes, R.; Hassinen, A.; Szczygiel, A.; Zhao, Q.; Vantomme, A.; Martins, J.C.; Hens, Z. Binding of phosphonic acids to CdSe quantum dots: A solution NMR study. J. Phys. Chem. Lett. 2011, 2, 145–152. [Google Scholar] [CrossRef]
  98. Kalyuzhny, G.; Murray, R. Ligand effects on optical properties of CdSe nanocrystals. J. Phys. Chem. B 2005, 109, 7012–7021. [Google Scholar] [CrossRef] [PubMed]
  99. Hassinen, A.; Moreels, I.; De Nolf, K.; Smet, P.F.; Martins, J.C.; Hens, Z. Short-Chain alcohols strip X-type ligands and quench the luminescence of PbSe and CdSe quantum dots, acetonitrile does not. J. Am. Chem. Soc. 2012, 134, 20705–20712. [Google Scholar] [CrossRef] [PubMed]
  100. Malicki, M.; Knowles, K.E.; Weiss, E.A. Gating of hole transfer from photoexcited PbS quantum dots to aminoferrocene by the ligand shell of the dots. Chem. Commun. 2013, 49, 4400–4402. [Google Scholar] [CrossRef]
  101. Martínez Bonilla, C.A.; Torres Flórez, M.H.; Molina Velasco, D.R.; Kouznetsov, V.V. Surface characterization of thiol ligands on CdTe quantum dots: Analysis by 1H NMR and DOSY. New J. Chem. 2019, 43, 8452–8458. [Google Scholar] [CrossRef]
  102. Morris-Cohen, A.J.; Vasilenko, V.; Amin, V.A.; Reuter, M.G.; Weiss, E.A. Model for adsorption of ligands to colloidal quantum dots with concentration-dependent surface structure. ACS Nano 2012, 6, 557–565. [Google Scholar] [CrossRef]
  103. Huo, R.; Wehrens, R.; Van Duynhoven, J.; Buydens, L.M.C. Assessment of techniques for DOSY NMR data processing. Anal. Chim. Acta 2003, 490, 231–251. [Google Scholar] [CrossRef]
  104. McMurry, J.E. Organic Chemistry, 9th ed.; Cengage Learning: Andover, UK, 2016. [Google Scholar]
  105. Oluwafemi, S.O.; Revaprasadu, N.; Ramirez, A.J. A novel one-pot route for the synthesis of water-soluble cadmium selenide nanoparticles. J. Cryst. Growth 2008, 310, 3230–3234. [Google Scholar] [CrossRef]
  106. Roberts, J.D.; Caserio, M.C. Basic Principles of Organic Chemistry, 2nd ed.; W.A. Benjamin: Menlo Park, CA, USA, 1977. [Google Scholar]
  107. Li, L.; Zhao, F.; Zhang, T.; Lü, C. A facile method to prepare polymer functionalized carbon dots inspired by the mussel chemistry for LED application. Dye. Pigment. 2019, 162, 845–854. [Google Scholar] [CrossRef]
  108. Nyquist, R.A. Interpreting Infrared, Raman, and Nuclear Magnetic Resonance Spectra; Academic Press: San Diego, CA, USA, 2001; Volume 2, pp. 65–83. [Google Scholar] [CrossRef]
  109. Nakamoto, K. Infrared and Raman Spectra of Inorganic and Coordination Compounds. Part B: Applications in Coordination, Organometallic, and Bioinorganic Chemistry, 6th ed.; Wiley: Hoboken, NJ, USA, 2009. [Google Scholar]
  110. Cooper, J.K.; Franco, A.M.; Gul, S.; Corrado, C.; Zhang, J.Z. Characterization of primary amine capped CdSe, ZnSe, and ZnS quantum dots by FT-IR: Determination of surface bonding interaction and identification of selective desorption. Langmuir 2011, 27, 8486–8493. [Google Scholar] [CrossRef] [PubMed]
  111. Mukherjee, P.; Lim, S.J.; Wrobel, T.P.; Bhargava, R.; Smith, A.M. Measuring and predicting the internal structure of semiconductor nanocrystals through Raman spectroscopy. J. Am. Chem. Soc. 2016, 138, 10887–10896. [Google Scholar] [CrossRef]
  112. Tian, H.; Li, H.; Fang, Y. Binary thiol-capped gold nanoparticle monolayer films for quantitative surface-enhanced Raman scattering analysis. ACS Appl. Mater. Interfaces 2019, 11, 16207–16213. [Google Scholar] [CrossRef] [PubMed]
  113. Chadha, R.; Das, A.; Kapoor, S.; Maiti, N. Surface-Induced dimerization of 2-thiazoline-2-thiol on silver and gold nanoparticles: A surface enhanced Raman scattering (SERS) and density functional theoretical (DFT) study. J. Mol. Liq. 2021, 322, 114536. [Google Scholar] [CrossRef]
  114. Rajender, G.; Giri, P.K. Formation mechanism of graphene quantum dots and their edge state conversion probed by photoluminescence and Raman spectroscopy. J. Mater. Chem. C 2016, 4, 10852–10865. [Google Scholar] [CrossRef]
  115. Wu, J.; Wang, P.; Wang, F.; Fang, Y. Investigation of the microstructures of graphene quantum dots (GQDs) by surface-enhanced Raman spectroscopy. Nanomaterials 2018, 8, 964. [Google Scholar] [CrossRef] [Green Version]
  116. Dervishi, E.; Ji, Z.; Htoon, H.; Sykora, M.; Doorn, S.K. Raman spectroscopy of bottom-up synthesized graphene quantum dots: Size and structure dependence. Nanoscale 2019, 11, 16571–16581. [Google Scholar] [CrossRef]
  117. Zhang, B.; Wang, K.; Chang, R.; Yi, X.; Zhang, Y.; Wang, S. Study of charge transfer at the quantum dot-graphene interface by Raman spectroscopy. J. Phys. Chem. C 2019, 123, 24943–24948. [Google Scholar] [CrossRef]
  118. Trajić, J.; Kostić, R.; Romčević, N.; Mitrić, M.; Lazović, V.; Balaž, P.; Stojanović, D. Raman spectroscopy of ZnS quantum dots. J. Alloys Comp. 2015, 637, 401–406. [Google Scholar] [CrossRef]
  119. Gong, K.; Kelley, D.F.; Kelley, A.M. Resonance Raman spectroscopy and electron-phonon coupling in zinc selenide quantum dots. J. Phys. Chem. C 2016, 120, 29533–29539. [Google Scholar] [CrossRef] [Green Version]
  120. Musa, I.; Qamhieh, N.; Said, K. Germanium antimony quantum dots morphology and Raman spectroscopy fabricated by inert gas condensation. Results Phys. 2019, 13, 102311. [Google Scholar] [CrossRef]
  121. Hamizi, N.A.; Johan, M.R.; Chowdhury, Z.Z.; Wahab, Y.A.; Al-Douri, Y.; Saat, A.M.; Pivehzhani, O.A. Raman spectroscopy and FTIR spectroscopy studies of Mn-doped CdSe QDs at different particles size. Optik 2019, 179, 628–631. [Google Scholar] [CrossRef]
  122. Ahmed, M.A.; Imam, N.G.; El-Dek, S.I.; El-Mahy, S.K. Fluorescence and spectroscopic characterization of multiferroic quantum dots of La:BiFeO3. J. Supercond. Nov. Magn. 2015, 28, 2417–2424. [Google Scholar] [CrossRef]
  123. Estupiñán-López, C.; Tolentino Dominguez, C.; Cabral Filho, P.E.; Santos, B.S.; Fontes, A.; de Araujo, R.E. A pH dependence study of CdTe quantum dots fluorescence quantum yields using eclipsing thermal lens spectroscopy. J. Lumin. 2016, 174, 17–21. [Google Scholar] [CrossRef]
  124. Yashima, S.; Sugimoto, H.; Takashina, H.; Fujii, M. Fluorescence enhancement and spectral shaping of silicon quantum dot monolayer by plasmonic gap resonances. J. Phys. Chem. C 2016, 120, 28795–28801. [Google Scholar] [CrossRef]
  125. Munro, T.; Liu, L.; Glorieux, C.; Ban, H. CdSe/ZnS quantum dot fluorescence spectra shape-based thermometry via neural network reconstruction. J. Appl. Phys. 2016, 119, 214903. [Google Scholar] [CrossRef]
  126. Lyons, T.Y.; Williams, D.N.; Rosenzweig, Z. Addition of fluorescence lifetime spectroscopy to the tool kit used to study the formation and degradation of luminescent quantum dots in solution. Langmuir 2017, 33, 3018–3027. [Google Scholar] [CrossRef]
  127. Saha, D.; Negi, D.P.S. Spectroscopic investigations on the interaction of thioacetamide with ZnO quantum dots and application for its fluorescence sensing. Spectrochim. Acta A 2018, 189, 516–521. [Google Scholar] [CrossRef]
  128. Chhabra, V.A.; Kaur, R.; Kumar, N.; Deep, A.; Rajesh, C.; Kim, K.-H. Synthesis and spectroscopic studies of functionalized graphene quantum dots with diverse fluorescence characteristics. RSC Adv. 2018, 8, 11446–11454. [Google Scholar] [CrossRef] [PubMed] [Green Version]
  129. Zhou, Z.-H.; Yang, F.; Li, D.; Wang, J.-P.; Xu, J.-H. pH dependent time-resolved fluorescence spectra of ZnSe quantum dots based on glutathione ligands. Spectrosc. Spectr. Anal. 2021, 41, 3178–3183. [Google Scholar] [CrossRef]
  130. Kim, S.H.; Man, M.T.; Lee, J.W.; Park, K.-D.; Lee, H.S. Influence of size and shape anisotropy on optical properties of CdSe quantum dots. Nanomaterials 2020, 10, 1589. [Google Scholar] [CrossRef]
  131. Schneider, G.; Decher, G.; Nerambourg, N.; Praho, R.; Werts, M.H.V.; Blanchard-Desce, M. Distance-Dependent fluorescence quenching on gold nanoparticles ensheathed with layer-by-layer assembled polyelectrolytes. Nano Lett. 2006, 6, 530–536. [Google Scholar] [CrossRef]
  132. Noblet, T.; Dreesen, L.; Hottechamps, J.; Humbert, C. A global method for handling fluorescence spectra at high concentration derived from the competition between emission and absorption of colloidal CdTe quantum dots. Phys. Chem. Chem. Phys. 2017, 19, 26559–26565. [Google Scholar] [CrossRef] [PubMed]
  133. Li, C.; Zhang, J.; Xiong, Q.; Lorenzini, G.; Yue, Y. The pH effect on thermal response of fluorescence spectroscopy of graphene quantum dots for nanoscale thermal characterization. J. Eng. Thermophys. 2018, 27, 345–356. [Google Scholar] [CrossRef]
  134. Yang, J.; Ling, Z.; Li, B.Q.; Li, R.; Mei, X. Nanoscale 3D temperature gradient measurement based on fluorescence spectral characteristics of the CdTe quantum dot probe. Opt. Express 2019, 27, 6770–6791. [Google Scholar] [CrossRef]
  135. de Thomaz, A.A.; Almeida, D.B.; Pelegati, V.B.; Carvalho, H.F.; Cesar, C.L. Measurement of the hydrodynamic radius of quantum dots by fluorescence correlation spectroscopy excluding blinking. J. Phys. Chem. B 2015, 119, 4294–4299. [Google Scholar] [CrossRef]
  136. Green, M. The nature of quantum dot capping ligands. J. Mater. Chem. 2010, 20, 5797–5809. [Google Scholar] [CrossRef]
  137. Yang, Q.; Wan, X.; Chen, Y.; Luo, H.; Zheng, Y.; Li, L. Theoretical investigation complexation characteristics and UV–Vis absorption spectral properties of CdTe QDs with four capping agents. J. Mol. Model. 2022, 28, 28. [Google Scholar] [CrossRef]
  138. Allahbakhsh, A.; Bahramian, A.R. Self-Assembly of graphene quantum dots into hydrogels and cryogels: Dynamic light scattering, UV–Vis spectroscopy and structural investigations. J. Mol. Liq. 2018, 265, 172–180. [Google Scholar] [CrossRef]
  139. Budyka, M.F. Semiempirical study on the absorption spectra of the coronene-like molecular models of graphene quantum dots. Spectrochim. Acta A 2019, 207, 1–5. [Google Scholar] [CrossRef] [PubMed]
  140. Schulze, A.S.; Tavernaro, I.; Machka, F.; Dakischew, O.; Lips, K.S.; Wickleder, M.S. Tuning optical properties of water-soluble CdTe quantum dots for biological applications. J. Nanopart. Res. 2017, 19, 70. [Google Scholar] [CrossRef]
  141. Pesika, N.S.; Stebe, K.J.; Searson, P.C. Determination of the particle size distribution of quantum nanocrystals from absorbance spectra. Adv. Mater. 2003, 15, 1289–1291. [Google Scholar] [CrossRef]
  142. Yu, W.W.; Qu, L.H.; Guo, W.Z.; Peng, X.G. Experimental determination of the extinction coefficient of CdTe, CdSe, and CdS nanocrystals. Chem. Mater. 2013, 15, 2854–2860. [Google Scholar] [CrossRef]
  143. Ferreira, D.L.; Sousa, J.C.L.; Maronesi, R.N.; Bettini, J.; Schiavon, M.A.; Teixeira, A.V.N.C.; Silva, A.G. Size-Dependent bandgap and particle size distribution of colloidal semiconductor nanocrystals. J. Chem. Phys. 2017, 147, 154102. [Google Scholar] [CrossRef] [Green Version]
  144. Pesika, N.S.; Stebe, K.J.; Searson, P.C. Relationship between absorbance spectra and particle size distributions for quantum-sized nanocrystals. J. Phys. Chem. 2003, 107, 10412–10415. [Google Scholar] [CrossRef]
  145. Lesnichaya, M.V.; Shendrik, R.; Sukhov, B.G. Relation between excitation dependent luminescence and particle size distributions for the selenium nanoparticles in κ-carrageenan shell. J. Lumin. 2019, 211, 305–313. [Google Scholar] [CrossRef]
  146. Xing, C.; Huang, W.; Xie, Z.; Zhao, J.; Ma, D.; Fan, T.; Liang, W.; Ge, Y.; Dong, B.; Li, J.; et al. Ultrasmall bismuth quantum dots: Facile liquid-phase exfoliation, characterization, and application in high-performance UV–Vis photodetector. ACS Photonics 2018, 5, 621–629. [Google Scholar] [CrossRef]
  147. Yuan, Y.; Han, Y.; Huang, B.; Zhang, L.; Yang, H.; Gu, B.; Cui, Y.; Zhang, J. Single-Channel UV/vis dual-band detection with ZnCdS:Mn/ZnS core/shell quantum dots. Nanotechnology 2019, 30, 075501. [Google Scholar] [CrossRef]
  148. Yang, B.; Liu, R.; Hao, X.; Wu, Y.; Du, J. Effect of CdTe quantum dots size on the conformational changes of human serum albumin: Results of spectroscopy and isothermal titration calorimetry. Biol. Trace Elem. Res. 2013, 155, 150–158. [Google Scholar] [CrossRef] [PubMed]
  149. Sun, H.; Cui, E.; Tan, Z.; Liu, R. Effects of N-acetyl-L-cysteine-capped CdTe quantum dots on bovine serum albumin and bovine hemoglobin: Isothermal titration calorimetry and spectroscopic investigations. J. Biochem. Mol. Toxicol. 2014, 28, 549–557. [Google Scholar] [CrossRef] [PubMed]
  150. Gee, M.Y.; Shen, Y.; Greytak, A.B. Isothermal titration calorimetry resolves sequential ligand exchange and association reactions in treatment of oleate-capped CdSe quantum dots with alkylphosphonic acid. J. Phys. Chem. C 2020, 124, 23964–23975. [Google Scholar] [CrossRef]
  151. Pitkänen, L.; Striegel, A.M. Size-Exclusion chromatography of metal nanoparticles and quantum dots. Trends Anal. Chem. 2016, 80, 311–320. [Google Scholar] [CrossRef] [Green Version]
  152. Wu, J.-K.; Tian, Z.-Q.; Zhang, Z.-L.; Liu, A.-A.; Tang, B.; Zhang, L.-J.; Chen, Z.-L.; Pang, D.-W. Purification of quantum dot-based bioprobes via high-performance size exclusion chromatography. Talanta 2016, 159, 64–73. [Google Scholar] [CrossRef]
  153. Abdellatif, A.A.H. Targeting of somatostatin receptors using fluorescent nanoparticles. J. Nanomed. Nanotechnol. 2018, 9, 1000506. [Google Scholar] [CrossRef]
  154. Radchanka, A.; Hrybouskaya, V.; Antanovich, A.; Artemyev, M. Poly (maleicanhydride) shell modified with negatively and positively charged groups to control zeta potential and hydrodynamic size of encapsulated quantum dots at variable pH. ChemNanoMat 2022, 8, e20210053. [Google Scholar] [CrossRef]
  155. Voráčová, I.; Klepárník, K.; Lišková, M.; Foret, F. Determination of ζ-potential, charge, and number of organic ligands on the surface of water soluble quantum dots by capillary electrophoresis. Electrophoresis 2015, 36, 867–874. [Google Scholar] [CrossRef]
  156. Wang, A.; Fu, L.; Ng, H.P.; Cai, W.; Zheng, Y.; Han, F.; Wang, Z.; Peng, F. Monitoring fluorescence lifetime changes of CdTe QDs synthesized with different stabilizers by photoluminscence and zeta potential measurement. J. Non Oxide Glasses 2015, 7, 1–12. [Google Scholar]
  157. Rastogi, A.; Pandey, F.P.; Parmar, A.S.; Singh, S.; Hegde, G.; Manohar, R. Effect of carbonaceous oil palm leaf quantum dot dispersion in nematic liquid crystal on zeta potential, optical texture and dielectric properties. J. Nanostruct. Chem. 2021, 11, 527–548. [Google Scholar] [CrossRef]
  158. Pandey, F.P.; Rastogi, A.; Singh, S. Optical properties and zeta potential of carbon quantum dots (CQDs) dispersed nematic liquid crystal 4′-heptyl-4-biphenylcarbonitrile (7CB). Opt. Mater. 2020, 105, 109849. [Google Scholar] [CrossRef]
  159. Holder, C.F.; Schaak, R.E. Tutorial on powder X-ray diffraction for characterizing nanoscale materials. ACS Nano 2019, 13, 7359–7365. [Google Scholar] [CrossRef] [PubMed] [Green Version]
  160. Calvin, J.J.; Kaufman, T.M.; Sedlak, A.B.; Crook, M.F.; Alivisatos, A.P. Observation of ordered organic capping ligands on semiconducting quantum dots via powder X-ray diffraction. Nat. Comm. 2021, 12, 2663. [Google Scholar] [CrossRef]
  161. Vega-Macotela, L.G.; Torchynska, T.V.; Polupan, G. Emission and HR-XRD study of InGaAs/GaAs quantum wells with InAs quantum dots grown at different temperatures. J. Mater. Sci. Mater. Electron. 2017, 28, 17778–17783. [Google Scholar] [CrossRef]
  162. Torchynska, T.; Cisneros-Tamayo, R.; Vega-Macotela, L.; Polupan, G.; Escobosa-Echavarria, A. Emission and HR-XRD study of MBE structures with InAs quantum dots and AlGaInAs strain reducing layers. Superlat. Microst. 2018, 124, 153–159. [Google Scholar] [CrossRef]
  163. Polupan, G.; Torchynska, T.; Vega-Macotela, L.; Cisneros-Tamayo, R.; Escobosa-Echavarria, A. Emission and HR XRD varying in GaAs/AlGaInAs heterostructures with InAs quantum dots at annealing. J. Mater. Sci. Mater. Electron. 2020, 31, 2643–2649. [Google Scholar] [CrossRef]
  164. Zhang, Y.; Ersoy, O.; Karatutlu, A.; Little, W.; Sapelkin, A. Local structure of Ge quantum dots determined by combined numerical analysis of EXAFS and XANES data. J. Synchrotron Rad. 2016, 23, 253–259. [Google Scholar] [CrossRef]
  165. Liu, Y.; Tan, L.; Cibin, G.; Gianolio, D.; Han, S.; Yu, K.; Dove, M.T.; Sapelkin, A.V. Analysis of the atomic structure of CdS magic-size clusters by X-ray absorption spectroscopy. Nanoscale 2020, 12, 19325–19332. [Google Scholar] [CrossRef]
  166. Wei, H.; Zhou, J.; Zhang, L.; Wang, F.; Wang, J.; Jin, C. The core/shell structure of CdSe/ZnS quantum dots characterized by X-ray absorption fine spectroscopy. J. Nanomater. 2015, 2015, 764712. [Google Scholar] [CrossRef] [Green Version]
  167. Marmiroli, M.; Lepore, G.O.; Pagano, L.; d’Acapito, F.; Gianoncelli, A.; Villani, M.; Lazzarini, L.; White, J.C.; Marmiroli, N. The fate of CdS quantum dots in plants as revealed by extended X-ray absorption fine structure (EXAFS) analysis. Environ. Sci. Nano 2020, 7, 1150–1162. [Google Scholar] [CrossRef]
  168. Manikandan, D.; Yadav, A.K.; Jha, S.N.; Bhattacharyya, D.; Boukhvalov, D.W.; Murugan, R. XANES, EXAFS, EPR, and first-principles modeling on electronic structure and ferromagnetism in Mn doped SnO2 quantum dots. J. Phys. Chem. C 2019, 123, 3067–3075. [Google Scholar] [CrossRef]
  169. Erenburg, S.B.; Trubina, S.V.; Zvereva, V.V.; Zinov’ev, V.A.; Dvurechenskiy, A.V.; Kuchinskaya, P.A.; Kvashnina, K.O. Microstructure of multilayer heterosystems containing molecules of Ge quantum dots in Si on the stages of nucleation and growth as revealed by EXAFS spectroscopy. J. Struct. Chem. 2016, 57, 1407–1416. [Google Scholar] [CrossRef]
  170. Chang, H.-W.; Fu, J.-X.; Huang, Y.-C.; Lu, Y.-R.; Kuo, C.-H.; Chen, J.-L.; Chen, C.-L.; Lee, J.-F.; Chen, J.-M.; Tsai, Y.-C.; et al. NiCo2O4/graphene quantum dots (GQDs) for use in efficient electrochemical energy devices: An electrochemical and X-ray absorption spectroscopic investigation. Catal. Today 2020, 348, 290–298. [Google Scholar] [CrossRef]
  171. Clark, P.C.J.; Flavell, W.R. Surface and interface chemistry in colloidal quantum dots for solar applications studied by X-ray photoelectron spectroscopy. Chem. Rec. 2019, 19, 1233–1243. [Google Scholar] [CrossRef] [PubMed]
  172. Iacono, F.; de la Cueva, L.; Gallego, J.M.; Juarez, B.H.; Otero, R. Thermal ligand desorption in CdSe quantum dots by correlated XPS and STM. Part. Part. Syst. Charact. 2016, 33, 358–362. [Google Scholar] [CrossRef]
  173. He, S.; Turnbull, M.J.; Nie, Y.; Sun, X.; Ding, Z. Band structures of blue luminiscent nitrogen-doped graphene quantum dots by synchrotron-based XPS. Surface Sci. 2018, 676, 51–55. [Google Scholar] [CrossRef]
  174. Babu, B.; Reddy, I.N.; Yoo, K.; Kim, D.; Shim, J. Bandgap tuning and XPS study of SnO2 quantum dots. Mater. Lett. 2018, 221, 211–215. [Google Scholar] [CrossRef]
  175. Hamizi, N.A.; Johan, M.R.; Wahab, Y.A.; Chowdhury, Z.Z.; Akbarzadeh, O.; Sagadevan, S.; Badruddin, I.A.; Khan, T.M.Y.; Kamangar, S. Investigation on Surface Properties of Mn-Doped CdSe Quantum Dots Studied by X-ray Photoelectron Spectroscopy. Symmetry 2019, 11, 1250. [Google Scholar] [CrossRef] [Green Version]
  176. Futamura, Y.; Nakashima, Y.; Ohta, A.; Ikeda, M.; Makihara, K.; Miyazaki, S. Evaluation of the potential distribution in a multiple stacked Si quantum dots structure by hard X-ray photoelectron spectroscopy. Jpn. J. Appl. Phys. 2019, 58, SAAE01. [Google Scholar] [CrossRef]
  177. Weigert, F.; Müller, A.; Häusler, I.; Geiβler, D.; Skroblin, D.; Krumrey, M.; Unger, W.; Radnik, J.; Resch-Genger, U. Combining HR-TEM and XPS to elucidate the core-shell structure of ultrabright CdSe/CdS semiconductor quantum dots. Sci. Rep. 2020, 10, 20712. [Google Scholar] [CrossRef]
  178. Ma, J.; Liu, M.; Li, Z.; Li, L. Synthesis of highly photo-stable CuInS2/ZnS core/shell quantum dots. Opt. Mater. 2015, 47, 56–61. [Google Scholar] [CrossRef]
  179. Buso, D.; Jasieniak, J.; Lay, M.D.H.; Schiavuta, P.; Scopece, P.; Laird, J.; Amenitsch, H.; Hill, A.J.; Falcaro, P. Highly luminescent metal-organic frameworks through quantum dot doping. Small 2012, 8, 80–88. [Google Scholar] [CrossRef] [PubMed]
  180. Schulz, A.S.; Harteveld, C.A.M.; Vancso, G.J.; Huskens, J.; Cloetens, P.; Vos, W.L. Targeted positioning of quantum dots inside 3D silicon photonic crystals revealed by synchrotron X-ray fluorescence tomography. ACS Nano 2022, 16, 3674–3683. [Google Scholar] [CrossRef]
  181. Song, J.-T.; Yang, X.-Q.; Zhang, X.-S.; Yan, D.-M.; Yao, M.-H.; Qin, M.-Y.; Zhao, Y.-D. Composite silica coated gold nanosphere and quantum dots nanoparticles for X-ray CT and fluorescence bimodal imaging. Dalton Trans. 2015, 44, 11314–11320. [Google Scholar] [CrossRef] [PubMed]
  182. Song, J.-T.; Yang, X.-Q.; Zhang, X.-S.; Yan, D.-M.; Yao, M.-H.; Qin, M.-Y.; Zhao, Y.-D. Composite nanoparticle of Au and quantum dots for X-ray computed tomography and fluorescence dual-mode imaging in vivo. J. Nanopart. Res. 2015, 17, 479. [Google Scholar] [CrossRef]
  183. Zhao, F.; Kim, J.S. Fabrication of CdSeS alloyed quantum dots and study on fluorescence lifetime. Mol. Cryst. Liq. Cryst. 2012, 566, 120–125. [Google Scholar] [CrossRef]
  184. Samadi-Maybodi, A.; Tirbandpay, R. Synthesis, optical properties and tuning size of CdSe quantum dots by variation capping agent. Spectrochim. Acta A 2021, 250, 119369. [Google Scholar] [CrossRef]
  185. Begum, A.; Sonkar, S.K.; Saxena, M.; Sarkar, S. Nanocomposites of carbon quantum dots-nickel (II) dithiolene as nanolights. J. Mater. Chem. 2011, 21, 19210–19213. [Google Scholar] [CrossRef]
  186. Nguyen, V.-H.; Mousavi, M.; Ghasemi, J.B.; Le, Q.V.; Delbari, S.A.; Namini, A.S.; Asl, M.S.; Shokouhimehr, M.; Mohammadi, M. Novel p-n heterojunction nanocomposite: TiO2 QDs/ZnBi2O4 photocatalyst with considerably enhanced photocatalytic activity under visible-light irradiation. J. Phys. Chem. C 2020, 124, 27519–27528. [Google Scholar] [CrossRef]
  187. Cryer, M.E.; Halper, J.E. Room temperature Mid-IR detection through localized surface vibrational states of SnTe nanocrystals. ACS Sens. 2018, 3, 2087–2094. [Google Scholar] [CrossRef]
  188. Friedrich, M.; Nozadze, R.; Gan, Q.; Zelman-Femiak, M.; Ermolayev, V.; Wagner, T.U.; Harms, G.S. Detection of single quantum dots in model organisms with sheet illumination microscopy. Biochem. Biophys. Res. Commun. 2009, 390, 722–727. [Google Scholar] [CrossRef] [PubMed]
  189. Carrillo-Carrión, C.; Moliner-Martínez, Y.; Simonet, B.M.; Valcárcel, M. Capillary electrophoresis method for the characterization and separation of CdSe quantum dots. Anal. Chem. 2011, 83, 2807–2813. [Google Scholar] [CrossRef] [PubMed]
  190. Friedrich, M.; Nozadze, R.; de Keijzer, S.; Steinmeyer, R.; Ermolayev, V.; Harms, G.S. Detection of single quantum dots in model systems with sheet illumination microscopy. J. Fluoresc. 2018, 27, 29–39. [Google Scholar] [CrossRef]
  191. Paydary, P.; Larese-Casanova, P. Separation and quantification of quantum dots and dissolved metal cations by size exclusion chromatography-ICP-MS. Int. J. Environ. Anal. Chem. 2015, 95, 1450–1470. [Google Scholar] [CrossRef]
  192. Peng, L.; He, M.; Chen, B.; Qiao, Y.; Hu, B. Metallomics study of CdSe/ZnS quantum dots in HepG2 cells. ACS Nano 2015, 9, 10324–10334. [Google Scholar] [CrossRef]
  193. Meng, P.; Xiong, Y.; Wu, Y.; Hu, Y.; Wang, H.; Pang, Y.; Jiang, S.; Han, S.; Huang, P. A novel strategy to evaluate the degradation of quantum dots: Identification and quantification of CdTe quantum dots and corresponding ionic species by CZE-ICP-MS. Chem. Commun. 2018, 54, 5342–5345. [Google Scholar] [CrossRef]
  194. Kuçur, E.; Boldt, F.M.; Cavaliere-Jaricot, S.; Ziegler, J.; Nann, T. Quantitative analysis of cadmium selenide nanocrystal concentration by comparative techniques. Anal. Chem. 2007, 79, 8987–8993. [Google Scholar] [CrossRef]
  195. Gopee, N.V.; Roberts, D.W.; Webb, P.; Cozart, C.R.; Siitonen, P.H.; Latendresse, J.R.; Warbitton, A.R.; Yu, W.W.; Colvin, V.L.; Walker, N.J.; et al. Quantitative determination of skin penetration of PEG-Coated CdSe quantum dots in dermabraded but not intact SKH-1 hairless mouse skin. Toxicol. Sci. 2009, 111, 37–48. [Google Scholar] [CrossRef]
  196. Montoro Bustos, A.R.; Ruiz Encinar, J.; Fernández-Argüelles, M.T.; Costa-Fernández, J.M.; Sanz-Medel, A. Elemental mass spectrometry: A powerful tool for an accurate characterisation at elemental level of quantum dots. Chem. Commun. 2009, 3107–3109. [Google Scholar] [CrossRef] [Green Version]
  197. Sewell, S.L.; Higgins, M.M.; Bell, C.S.; Giorgio, T.D. Quantification of quantum dot concentration using inductively coupled plasma-mass spectrometry (ICP-MS). J. Biomed. Nanotechnol. 2011, 7, 685–690. [Google Scholar] [CrossRef]
  198. Liu, J.; Katahara, J.; Li, G.; Coe-Sullivan, S.; Hurt, R.H. Degradation products from consumer nanocomposites: A case study on quantum dots lighting. Environ. Sci. Technol. 2012, 46, 3220–3227. [Google Scholar] [CrossRef] [Green Version]
  199. Zheng, L.-N.; Wang, M.; Wang, B.; Chen, H.-Q.; Ouyang, H.; Zhao, Y.-L.; Chai, Z.-F.; Feng, W.-Y. Determination of quantum dots in single cells by inductively coupled plasma mass spectrometry. Talanta 2013, 116, 782–787. [Google Scholar] [CrossRef] [PubMed]
  200. Hepburn, W.G.; Batchelor-McAuley, C.; Tschulik, K.; Kachoosangi, R.T.; Ness, D.; Compton, R.G. Use of the capping agent for the electrochemical detection and quantification of nanoparticles: CdSe quantum dots. Sens. Act. B 2014, 204, 445–449. [Google Scholar] [CrossRef]
  201. Martín-Yerga, D.; Bouzas-Ramos, D.; Menéndez-Miranda, M.; Montoro Bustos, A.R.; Ruiz Encinar, J.; Costa-Fernández, J.M.; Sanz-Medel, A.; Costa-García, A. Voltammetric determination of size and particle concentration of Cd-Based quantum dots. Electrochim. Acta 2015, 166, 100–106. [Google Scholar] [CrossRef] [Green Version]
  202. Menéndez-Miranda, M.; Ruiz Encinar, J.; Costa-Fernández, J.M.; Sanz-Medel, A. Asymmetric flow field-flow fractionation coupled to inductively coupled plasma mass spectrometry for the quantification of quantum dots bioconjugation. J. Chromatogr. A 2015, 1422, 247–252. [Google Scholar] [CrossRef] [PubMed]
  203. Martín-Yerga, D.; Costa Rama, E.; Costa-García, A. Electrochemical study and applications of selective electrodeposition of silver on quantum dots. Anal. Chem. 2016, 88, 3739–3746. [Google Scholar] [CrossRef]
  204. Garcia-Cortés, M.; Sotelo González, E.; Fernández-Argüelles, M.T.; Ruiz Encinar, J.; Costa-Fernández, J.M.; Sanz-Medel, A. Capping of Mn-Doped ZnS quantum dots with DHLA for their stabilization in aqueous media: Determination of the nanoparticle number concentration and surface ligand density. Langmuir 2017, 33, 6333–6341. [Google Scholar] [CrossRef]
  205. Martín-Yerga, D.; Costa-García, A. Electrochemical detection of quantum dots by stabilization of electrogenerated copper species. Electrochem. Commun. 2017, 74, 53–56. [Google Scholar] [CrossRef]
  206. Martín-Yerga, D.; Fanjul-Bolado, P.; Hernández-Santos, D.; Costa-García, A. Enhanced detection of quantum dots by the magnetohydrodynamic effect for electrochemical biosensing. Analyst 2017, 142, 1591–1600. [Google Scholar] [CrossRef]
  207. Sýs, M.; Metelka, R.; Korecká, L.; Pokorná, H.; Švancara, I. Comparison of various bismuth film electrodes in simultaneous electrochemical detection of heavy metals for application in quantum dot-linked immunoassays. Monatsh. Chem. 2017, 148, 505–510. [Google Scholar] [CrossRef]
  208. Čadková, M.; Kovářová, A.; Dvořáková, V.; Bílková, Z.; Korecká, L. Optimization of anodic stripping voltammetry conditions for efficient detection of quantum dots at micro flow-cell electrodes. Monatsh. Chem. 2017, 148, 571–575. [Google Scholar] [CrossRef]
  209. Yu, X.; Chen, B.; He, M.; Wang, H.; Hu, B. Chip-Based magnetic solid phase microextraction coupled with ICP-MS for the determination of Cd and Se in HepG2 cells incubated with CdSe quantum dots. Talanta 2018, 179, 279–284. [Google Scholar] [CrossRef] [PubMed]
  210. Amor-Gutiérrez, O.; Iglesias-Mayor, A.; Llano-Suárez, P.; Costa-Fernández, J.M.; Soldado, A.; Podadera, A.; Parra, F.; Costa-García, A.; de la Escosura-Muñiz, A. Electrochemical quantification of Ag2S quantum dots: Evaluation of different surface coating ligands for bacteria determination. Microchim. Acta 2020, 187, 169. [Google Scholar] [CrossRef]
  211. Zhang, C.-Y.; Yang, K. Accurate detection of on-state quantum dot and biomolecules in a micro fluidic flow with single-molecule two-color coincidence detection. Anal. Bioanal. Chem. 2010, 397, 703–708. [Google Scholar] [CrossRef] [PubMed]
  212. Kim, H.; Jeen, T.; Tran, M.V.; Algar, W.R. Polyacrylamide gel electrophoresis of semiconductor quantum dots and their bioconjugates: Materials characterization and physical insights from spectrofluorimetric detection. Analyst 2018, 143, 1104–1116. [Google Scholar] [CrossRef]
  213. Schmelz, O.; Mews, A.; Basché, T.; Herrmann, A.; Müllen, K. Supramolecular complexes from CdSe nanocrystals and organic fluorophors. Langmuir 2001, 17, 2861–2865. [Google Scholar] [CrossRef] [Green Version]
  214. Striolo, A.; Ward, J.; Prausnitz, J.M.; Parak, W.J.; Zanchet, D.; Gerion, D.; Milliron, D.; Alivisatos, A.P. Molecular weight, osmotic second virial coefficient, and extinction coefficient of colloidal CdSe nanocrystals. J. Phys. Chem. B 2002, 106, 5500–5505. [Google Scholar] [CrossRef] [Green Version]
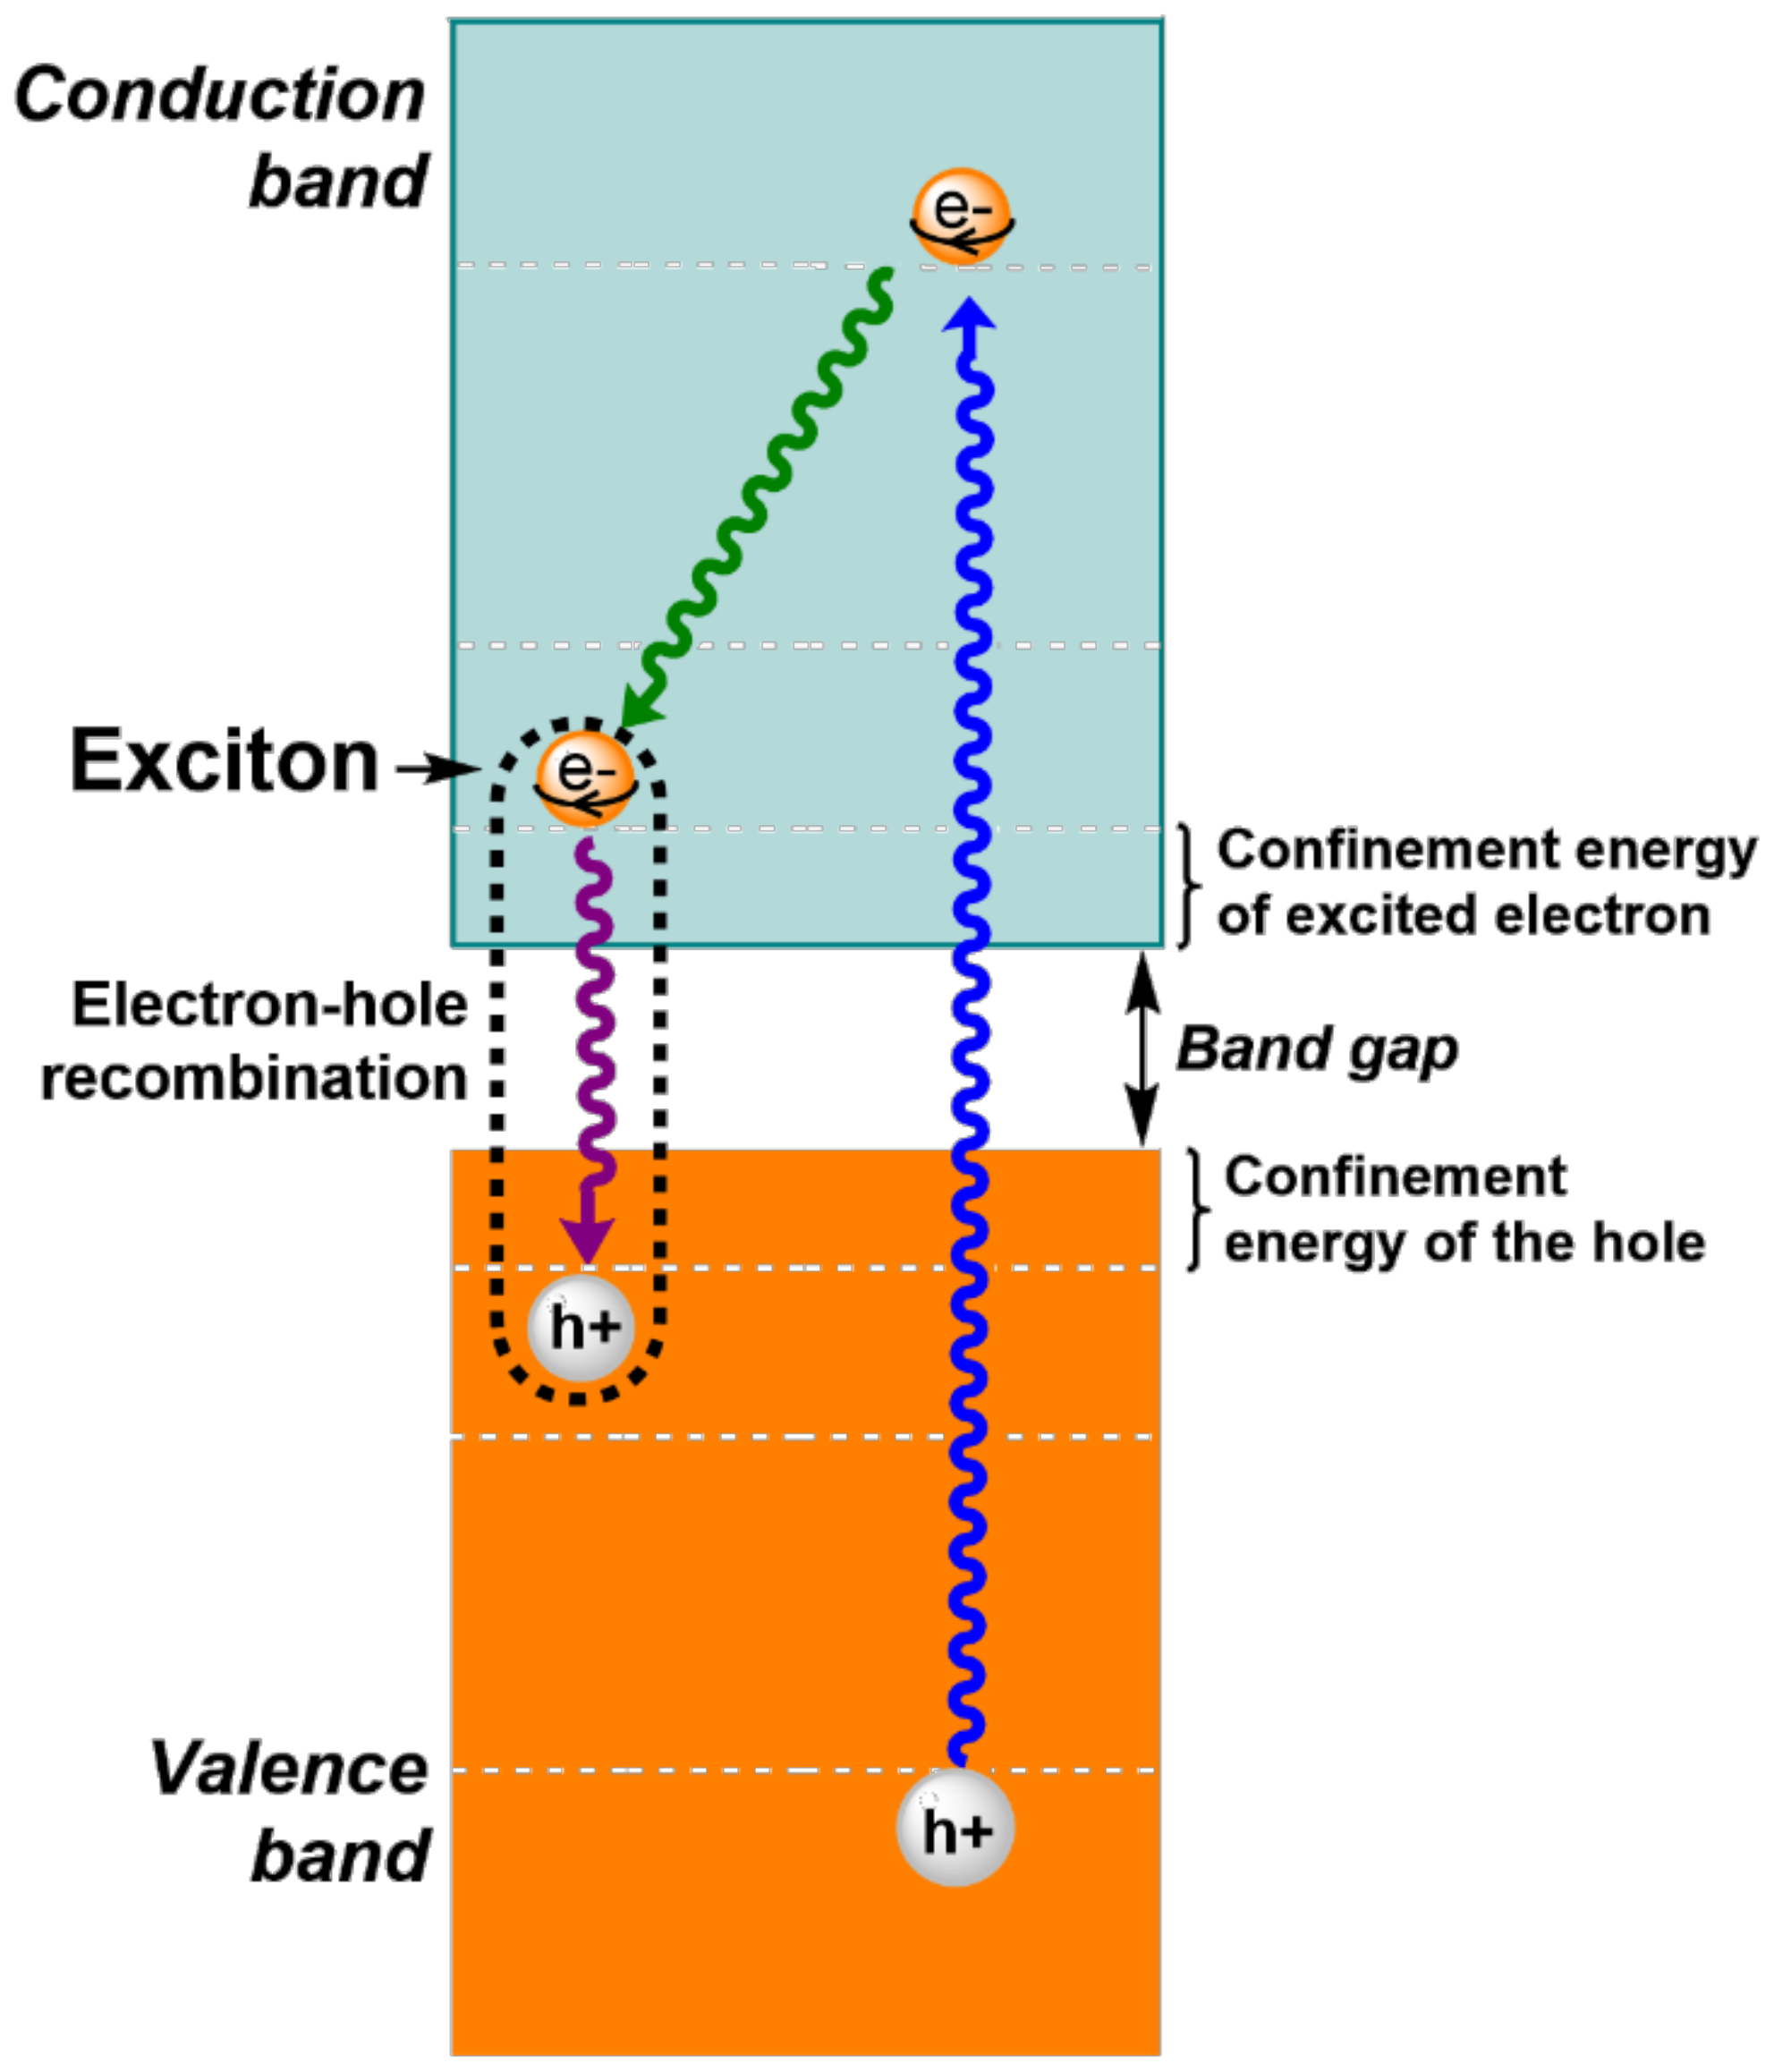
Figure 1. Formation of the exciton from the electron-hole pair and subsequent electron-hole recombination.
Nanomaterials 12 02501 g001
Figure 2. Schematic representation of the three main types of CS QDs: Type I, Inverse type I and Type II, of which CdTe/ZnS, CdS/CdSe and CdTe/CdSe, as well as CdS/ZnSe, are examples. Band gap energies (Eg) for the semiconductor materials used as examples are indicated. Electron-hole recombination is indicated by a wavy arrow.
Nanomaterials 12 02501 g002
Figure 3. Schematic diagram to illustrate the bonding forms for main adsorption modes of dissolved ligands onto the surface of CdSe QDs (Cd: grey balls; Se: brown balls). Left top: CdSe-octylamine has been used here as an illustrative example of an H-bonding interaction. Right top: The interaction between CdSe and a catechol-based oleylamine shows a couple of modes of chelation. Right-bottom: The desorption of oleic acid from coated QDs and the subsequent absorption of 4-mercaptobenzoic acid illustrates the ligand exchange mode. Left-bottom: The interaction between thioglycolate-capped QDs and Ca2+ shows cation bridging mode among particles.
Nanomaterials 12 02501 g003
Figure 4. 1H NMR spectrum (in D2O) of cysteine-capped CdSe QDs (top). The spectrum of L-cysteine (bottom) has been included for comparison.
Nanomaterials 12 02501 g004
Figure 5. ATR–FTIR spectrum cysteine-capped CdSe QDs (top). The spectrum of L-cysteine (bottom) has been included for comparison purposes.
Nanomaterials 12 02501 g005
Figure 6. UV–Vis (left) and fluorescence (right) spectra of the cysteine-capped CdSe QDs in ethanol (λex = 400 nm; λem = 632 nm).
Nanomaterials 12 02501 g006
Figure 7. (a) EDX spectrum of CdSe–Cys QDs; (b): SEM micrograph with EDX mapping pattern of the elements Cd, Se, C, S, N, Na and O from an anionic cysteine-capped CdSe QDs sample.
Nanomaterials 12 02501 g007aNanomaterials 12 02501 g007b
Figure 8. Sector graph of analytical techniques for detection/determination of QDs.
Nanomaterials 12 02501 g008
Table 1. Maximum wavelength values for fluorescence emission and visible absorption shown by CdSe as bulk material and as QDs with particle diameters in the range 1.8–7.3 nm.
CdSeVis. AbsorptionFluorescence Emission
Diameter (nm)λabs (nm)λem (nm)COLOUR *
Bulk material671713 Nanomaterials 12 02501 i001
7.3645653 Nanomaterials 12 02501 i002
4.1586596 Nanomaterials 12 02501 i003
2.9541549 Nanomaterials 12 02501 i004
2.2484499 Nanomaterials 12 02501 i005
1.8427449 Nanomaterials 12 02501 i006
* Colours were calculated by conversion of the wavelength maximum to an RGB colour.
Table 2. Bandgap energy and exciton Bohr radius of some semiconductor inorganic materials, which are commonly used in QDs. Values of bulk semiconductor materials vary depending on the literature because various methods have been used to obtain them.
IV–VI QDsBulk Bandgap (eV) [ref.]Bulk Exciton Bohr Radius (nm) [ref.]
PbS0.41 [14]18 [14]
PbSe0.28 [14]46 [14]
PbTe0.31 [14]150 [14]
II–VI QDsBulk bandgap (eV)Bulk exciton Bohr radius (nm) [ref.]
ZnS3.6 [50]2.5 [51]
ZnSe2.72 [52]4.5 [52]
ZnTe2.25 [52]6.7 [52]
CdS2.42 [50]2.9 [51]
CdSe1.73 [50]5.6 [51]
CdTe1.5 [14]10 [14]
HgTe−0.15 * [14]80 [14]
III–V QDsBulk bandgap (eV)Bulk exciton Bohr radius (nm) [ref.]
AlN6.2 [52]1.6 [52]
AlP2.45 [52]37 [52]
AlAs2.15 [52]41 [52]
AlSb1.6 [52]64 [52]
GaN3.4 [52]3.1 [52]
GaP2.27 [52]29 [52]
GaAs1.43 [52]12.4 [52]
GaSb0.7 [52]60 [52]
InN0.65 [52]11.4 [52]
InP1.27 [14]/1.42 [52]15 [14]/11 [52]
InAs0.36 [14]34 [14]
InSb018 [52]54 [52]
IV QDsBulk bandgap (eV)Bulk exciton Bohr radius (nm) [ref.]
Si1.17 [52]4.3 [52]
Ge0.67 [52]11.5 [52]
II–V QDsBulk bandgap (eV)Bulk exciton Bohr radius (nm) [ref.]
Cd3P20.55 [14]18 [14]
Cd3As2−0.19 * [14]47 [14]
I–VI QDsBulk bandgap (eV)Bulk exciton Bohr radius (nm) [ref.]
Ag2S0.9–1.1 [14,52]2.2 [52]
Ag2Se0.15 [14,52]2.9 [52]
I–III–VI QDsBulk bandgap (eV)Bulk exciton Bohr radius (nm) [ref.]
CuInS21.53 [14,52]4.1 [14,52]
CuInSe21.04 [14,52]10.6 [14,52]
AgInS21.87 [52]5.5 [52]
AgInSe21.24 [14,52]5–6 [52]
II–II–VI QDsBulk bandgap (eV)Bulk exciton Bohr radius (nm) [ref.]
CdHgTe0–1.5 [11]Not found
* Materials with an inverted bandgap.
Table 3. Relationship between the size of QDs and the number of surface atoms.
Diameter of QDs (nm)No. of Surface AtomsRatio of Surface Atoms to
Total Atoms (%)
103 × 10420
44 × 10340
22.5 × 10280
13090
Publisher’s Note: MDPI stays neutral with regard to jurisdictional claims in published maps and institutional affiliations.