Abstract
Stevia rebaudiana cultivated in non-native tropical conditions tends to flower early, halting vegetative growth, resulting in lower biomass and yields of its valued steviol glycoside metabolites. While indoor cultivation allows manipulation of artificial lighting to mimic optimal conditions, it introduces an additional energy cost. The study objectives were to assess photoperiod manipulation as a lighting strategy to increase overall biomass and metabolite yields as well as to improve the efficacy of the electrical energy used for indoor cultivation of Stevia rebaudiana in non-native environmental conditions. Stevia was grown under artificial lighting with red, green, and blue wavelengths with photoperiods of 8 h, 12 h, 16 h, and intermittent light amounting to 16/24 h, each with a constant Daily Light Integral (DLI) of 7.2 mol m−2 day−1. Yield was measured as leaf dry weight biomass in combination with Liquid chromatography–mass spectrometry (LCMS) analysis of Stevioside and Rebaudioside A content. The photon flux density of the artificial and natural light as measured by a spectroradiometer, and the energy use data collected with a three-phase power quality logger, were compared for each treatment tested and to that from plants grown under natural light irradiation in a greenhouse. Yield and energy data were used to determine the efficacies of the lighting systems tested. Stevia plants under a continuous 16-h photoperiod (16H) had the highest productivity, resulting in the highest biomass accumulation and metabolite concentrations. The Stevioside and Rebaudioside A yields per plant were 975% higher than those obtained under natural daylight and day-neutral tropical photoperiod. Overall energy use and photon conversion efficacies were also highest under 16H at 65.10 g kWh−1 for biomass accumulation, 12.40 g kWh−1 for metabolite yields and 7.5 mg mol−1 for photon conversion. These findings support the application of photoperiod manipulation as a viable approach to increase productivity and improve energy use efficacies for indoor cultivation of Stevia rebaudiana plants under artificial lighting in non-native environments with the 16-h photoperiod under red and blue artificial light supplemented with green spectrum as the best option.
1. Introduction
The quality, intensity and the period of photon activity, or photoperiod, are factors known to regulate the morphogenesis, growth and differentiation of plant cells and tissues [1]. The photoperiod, or duration of light, plays a key role in establishing and regulating the plant’s internal biological clock for phenological events [2,3]. Except for day-neutral plants, photoperiod also affects flowering time, with flowering induced under a short photoperiod for short day plants and under a long photoperiod for long day plants [4].
Early studies on the effects of artificial light on plants utilized wide band light sources and filters [5]. The advent of Light Emitting Diodes (LED) paved the way for very narrow beam monochromatic light to be made available for use in horticulture, as supplemental lighting or as a sole source of light, and its use has grown exponentially over the past years. Typically, red and blue LEDs are used together to provide the most efficient photosynthetically active radiation (PAR), and far-red (FR) is commonly added to induce flowering [6,7,8]. Horticulture lighting systems design are often determined by the optimal daily light integral (DLI) of the plants to be cultivated. The DLI, described in mol m−2 day−1, represents the cumulated photon number of moles that falls on a surface of 1 m2 over a 24-h period [9,10]. The optimal DLI values for plants, the amount of light needed by the plant to produce the best results, are often based on natural sunlight and do not consider light quality, intensity or photoperiod [3]. DLI is related to the intensity and photoperiod and has a significant impact on the electrical energy usage associated with artificial lighting in indoor cultivation. As the lighting load typically accounts for between 40% to 80% of artificially lighted controlled environment agriculture (CEA) system, it provides the greatest opportunity for optimization that can lead to an overall reduction in cultivation costs [11,12]. The proliferation of LEDs in horticulture has presented an opportunity for manipulation of light intensity and photoperiod to improve plant productivity and energy efficacies. Unlike conventional discharge lamps, LEDs can easily be dimmed without affecting their life span [3]. Studies have also shown improved photosynthetic activity in certain plants that were cultivated under conditions with lower intensities and longer photoperiods compared to those under higher intensities and shorter photoperiod, under the same DLI [13].
Stevia rebaudiana Bertoni is a perennial plant from the Asteraceae family, native to the highlands of Brazil and Paraguay [14]. The steviol glycoside (SG) compounds found in its leaves, stems and flowers form the basis of zero calorie sweeteners that have become highly popular globally due to the lack of harmful side effects commonly associated with alternative synthetic artificial sweeteners [15,16]. Purified Stevia extracts have been approved for use as a food additive and sweetener by the USA Food and Drug Administration (FDA), Foods Standards Australia New Zealand (FSANZ) and the European Food Safety Authority (EFSA) [17,18]. This recognition has seen an increase in global demand for Stevia extracts, rising from 5100 tonnes valued at USD 338 million in 2014 to an estimated 8100 tonnes with a global market value of USD 554 million by the end of 2024 [19]. In developed and developing countries in Asia, such as Malaysia, dried Stevia leaves and extracts have been popularized as a natural low-calorie sweetener and herbal supplement, driven by an alarming rise in diabetes and obesity [17,20]. At present, most countries import Stevia as unprocessed leaves and as processed products from China, India and South America with little local cultivation due to the non-ideal photoperiodic conditions [20,21]. To address the over-reliance of imported products, while catering to the expanding local demand, there is a need to improve the productivity of Stevia rebaudiana outside its normal range of latitude, by optimization of the cultivation environment in controlled environment agriculture (CEA) systems [20,21].
Past studies on the productivity of Stevia under artificial lighting did not consider the effects of DLI [22,23,24]. Studies typically focused on the effects of light intensity or photoperiod without considering the total DLI, while studies with constant DLI employed varying spectral compositions [2,22,25,26]. When experiments are conducted using light sources with similar intensity but different photoperiods, the overall DLI can vary significantly, as reported in experiments comparing a 12-h photoperiod with a 16-h photoperiod under identical intensities, where the difference in DLI varied by as much as 33% [22,27]. There is also no available literature reporting evaluation of the lighting energy requirements and efficacies for indoor cultivation of Stevia. Other studies on energy requirements of indoor cultivation focused on lettuce [28], spinach [29], pepper [30] and cucumber [1], either under fully artificially lighted or supplemental lighted conditions. While the use of LEDs has proven to be more energy efficient compared to traditional lighting technologies such as the high-pressure sodium (HPS) lamps, and presents the possibility to enhance the overall yields by employing the use of selected wavelengths, these specialized spectral content systems come at a price: the cost of green, far-red (FR), and ultraviolet (UV) LEDs are often far higher than that of the red and blue LEDs that are common in standard horticulture lighting products. Hence, for an existing facility, it would be beneficial to consider lighting strategies that manipulate the photoperiod and light intensity, to optimize the productivity and overall energy efficacy of the current installation, before resorting to a change of its total lighting system.
This study explored the use of photoperiod and light intensity manipulation as a strategy to improve the biomass accumulation, metabolite concentration and overall metabolite yields of Stevia rebaudiana plants grown indoors under full artificial light, especially in locations that would otherwise be non-ideal. The focus of this study is on the use of standard red + blue horticulture lighting systems with small quantities of green light to maximize the plant productivity and energy use efficacies without the need for additional spectral content. Besides looking at the biomass and metabolite yields, this study also evaluated the effects of photoperiod manipulation on the photon conversion and energy use efficacies under a constant DLI and spectral composition. The photon conversion efficacy (PCE), expressed in mg mol−1, represents the amount of Rebaudioside A (Reb A) + Stevioside (ST) that can be produced by 1 mol of photons, while the energy use efficacy (EUE), expressed in g kWh−1, denotes the amount of electrical energy consumed to produce 1 g of Reb A and ST compounds.
2. Material and Methods
2.1. Plant Materials
Stevia rebaudiana seeds procured from Bakers Creek Heirloom Seeds, USA (https://www.rareseeds.com/, accessed on 10 January 2022) were washed under running tap water and dried on a filter paper prior to use. A 50- cell plug tray (54 cm × 28 cm × 5.7 cm) was filled with autoclaved potting soil (www.serbajadi.com.my, accessed on 10 January 2022), then seeds were surface sowed with 1 seed per cell. The seeds were purchased in batches for each experimental cycle. The soil and seed were sprayed with water and wrapped in clear plastic to prevent evaporation of moisture. The trays were placed in a climate controlled dark room for experiments with artificial light or in a greenhouse, both within the Plant Biotech Facility of University of Malaya, Kuala Lumpur. The temperature of the dark room and greenhouse were maintained at 25 °C ± 2 °C with a relative humidity of 70–80%. The dark room was housed in a building within the facility, with highly insulated walls, floors, and ceiling, and without any windows. The greenhouse had diffused colorless polycarbonate walls and roof, with three of the four walls not exposed to the external environment. The temperature of both rooms was controlled via air conditioning units that had an average cooling load of 2500 BTU m−2.
Five weeks after sowing, the seedlings were removed from the plug trays and transplanted into individual pots (12 cm × 12 cm × 10 cm) filled with autoclaved potting soil (www.serbajadi.com.my, accessed on 10 January 2022). A total of 24 seedlings from all treatments were selected for transplanting. The seedlings were selected based on the mean height, discarding the outliers. The transplanted seedlings were watered sparingly, ensuring the topsoil remained moist while preventing water logging. The experiment was repeated three times from August 2018 to October 2019. Each cycle lasted for 175 days from the first sowing of the seeds. In order to ensure timelines are adhered to and to ensure a full 175 days per experimental cycle, the sowing and germination of the cycles has an overlap, with experimental cycle 2 starting before the end of experimental cycle 1, and cycle 3 starting before the end of experimental cycle 2. The plants under artificial light and under natural sunlight in the climate-controlled greenhouse (GH) had a planting density of 24 plants/m2.
The Daily Light Integral (DLI) for the respective light treatments were computed as follows:
where DLI = Daily Light Integral in mol m−2 day−1 and PPFD = Measured Photosynthetic Photon Flux Density in µmol m−2 s−1.
2.2. Light Treatments
Four custom-built lighting systems were used for this study. Each system consisted of 144 high powered LEDs (Cree, USA and Osram, Germany) in a single channel (Figure 1A). The 144 LEDs were connected in series consisting of 96 Red LEDs with a peak of 630 nm, 24 Green LEDs with a peak of 550 nm and 24 Blue LEDs with a peak of 450 nm (Figure 2). The intensity of each unit was individually controlled by varying the supply current for each system, via the built-in potentiometer of the power supply units (Meanwell, Taiwan). Each system has a maximum wattage of 400 W, limited by the power supply units, to ensure the LEDs solder point temperature did not exceed the rated values provided by the manufacturers. Prior to installation at the facility, the photosynthetic photon flux (PPF) of the system, that denotes the total amount of light within the PAR range that is emitted by the luminaire, was measured in an integrating sphere at Novabrite Lighting Sdn Bhd, Malaysia (www.novabrite.com.my, accessed on 10 January 2022) lighting laboratory. The photoperiods were controlled by the means of a standard timer (Hager EH711, Germany). The intensity of each artificial lighting treatment was adjusted to ensure all treatments had the same DLI of 7.2 ± 0.1 mol m−2 day−1. The intensity, photoperiod and light recipe for each treatment are as in Table 1. The plants exposed to the photoperiod named 16HI (where “I” indicates intermittent) were exposed to 5.3H Light/2.7H Dark on a continuous loop such that they received a total of 16 h of light intermittently over a period of 24 h (Table 1, Figure 2A). All systems were fitted with a digital energy meter (BAYITE-PZEM-061, China) to monitor and record the overall power and energy consumption throughout the duration of the experiments. The Engineers [10] standards were used to define the PAR and Plant Biologically Active Radiation (PBAR) range.
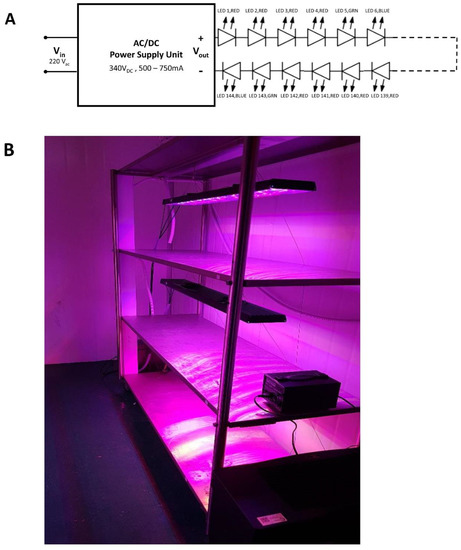
Figure 1.
Artificial lighting fixture. (A) Lighting system circuit. (B) Actual lighting fixture setup in growth room.
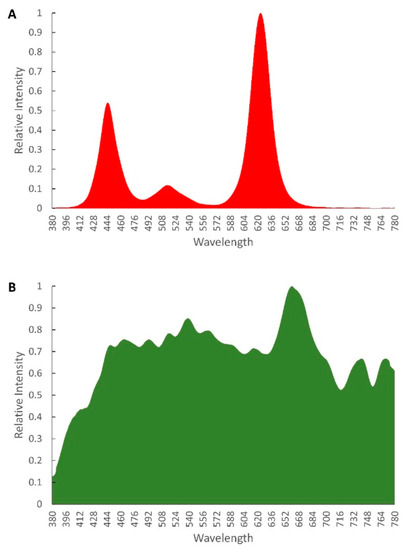
Figure 2.
Spectral distribution of light treatments used for photoperiod experiments. (A) Artificial light treatment. All treatments used equal spectral distribution but with varying intensities and photoperiod. (B) Spectral distribution of natural daylight measured at the greenhouse.

Table 1.
Light treatments of photoperiod experiments.
The artificial lighting systems were installed on four separate racks. All four racks were located within the same climate controlled dark room. Each of the four racks had three growing levels installed with identical light treatments (Figure 1B). A black mesh material was used to shield the racks, preventing light trespass and interference between the different light treatments.
One experimental set of plants was grown in the climate-controlled greenhouse (GH) under natural light and photoperiod as a control for natural tropical sunlight and day-neutral photoperiod. The typical photoperiod in Kuala Lumpur, Malaysia (latitude 3°08′28.32″ N) is 12 h [21,31]. As the intensity and spectral distribution of the natural light captured in the greenhouse varied significantly throughout the day, light measurements were conducted at 5-min intervals, continuously over a 14-day period using a portable spectroradiometer (Asensetek, Taiwan) (Table 1, Figure 2B).
2.3. Plant Productivity Analysis
2.3.1. Biomass Yield
Plants were harvested at the end of each 175-day cycle, in November 2018, May 2019 and September 2019 by cutting all stems at 5 cm above the soil. Only samples that had not reached the flowering stage were harvested. The leaves and stems for each plant were separated and a digital scale (Shimadzu, Japan) was used to determine fresh weight. The leaves for all plants under the same photoperiod were collected and washed under running water. The leaves were drained in a mesh bowl before gently blotting with tissue paper. The leaves were dried in an oven (Binder, Germany) at 60 °C for 20 h, at which time a steady weight was achieved. The dried leaves and stems were cooled to room temperature before measurements of dry weight were made. After weighing, the leaves were packed with a desiccant (silica gel) in an airtight container. The samples were stored at −4 °C before LCMS analysis.
The percentage biomass partitioning towards the leaves were calculated using the formula:
2.3.2. Metabolite Yield
Although various components of SG can be separated via LCMS, this study focused only on ST and Reb A, as these two components account for more than 90% of the total SG present in Stevia leaves, and are compounds with the highest commercial demand at present [16,19]. Analytical standards of ST and Reb A (purity > 96%) obtained from Sigma-Aldrich (Germany) were used as an external reference. The standard compounds were dissolved in 1 mL mixture of 70:30 v/v water and acetonitrile before being injected into the LCMS apparatus to identify its peaks and to construct the standard curves for each compound using the methods outlined in WHO [32].The dried leaves from all cycles were combined after the final harvest in September 2019 and were subjected to LCMS analysis to determine the percentage content of Reb A and ST. Ground dried leaves were extracted via the cold maceration method in which 0.5 g of ground leaves was mixed with 50 mL of 35:65 (v/v) ethanol and water. The sample was sonicated for 2 h and filtered. The resulting eluents were dried using a miVac centrifugal concentrator. Samples of 10 mg of the resulting extract were dissolved in 1 mL of 70:30 (v/v) mixture of water and acetonitrile. The sample was filtered using a PES membrane with 0.22 μm pore size. LCMS analysis used an LC-MS QTOF apparatus (Agilent 1290 Infinity™) with a C18 column. A modified approach based on the assay methods outlined in WHO [32] was used to quantify the amount of ST and Reb A among the within the leaves of each treatment, expressed in percentage of mass of leaf dry matter (%w/w).
To obtain the quantity of the total ST and Reb A metabolite yields that can be realized, the mean combined Reb A and ST yields per plant, expressed in g plant−1, was calculated as follows:
where, Mean Leaf DW = Mean leaf dry weight per plant in g; Reb A & ST Concentration = Percentage composition per gram of leaf DW (Obtained from LCMS results).
2.4. Energy and Photon Efficacy
The lighting power density (LPD) representing the lighting electrical energy used per m−2 of growth area, directly related to the overall energy demand of a CEA, expressed as Wm−2, was calculated as follows:
The photon conversion efficacy (PCE), the amount of Reb A + ST that can be produced with 1 mol of light, represented in mg mol−1 was calculated using the following equation:
The photosynthetic photon efficacy (PPE) of the systems that describes the amount of photosynthetic radiation emitted by the system for every unit of electrical energy consumed, denoted in µmol J−1, was calculated as follows:
The total cooling power and energy measurements of the growth room and greenhouse were measured using a three-phase power quality logger (Fluke 1735) that was connected to the input at the distribution panels at both locations. The greenhouse did not have any other electrical loads besides the air conditioning system. Although the growth room had the lighting and air conditioning loads, as each lighting system had its own logger, only the air conditioning loads were measured. The measurements were logged at 5-min intervals over a period of 10-days. To obtain the highest energy use, the measurements were done under full load conditions with growth areas filled to maximum density with fully grown plants just before harvest. The results were used to calculate the cooling power density (CPD) expressed in W m−2, normalized to 1 m2 of growth space in both facilities:
The Cooling Power Density for the growth room was measured under light and dark conditions. As the greenhouse cooling system was influenced by the external ambient conditions, a 24-h average was used, resulting in the following values:
Using the values obtained in Table 2, the total energy density (kWh m−2) for the growth room and greenhouse was calculated. These values present the total electrical energy consumed per m2 of growth space over the 175 days growth cycle. The values were calculated using the following equations:
Table 2.
Cooling power density of growth room and greenhouse.
Greenhouse:
Growth room:
where
As the artificial lighting and cooling systems were fixed for all experimental cycles, there were no difference in energy densities obtained between replicates of the same treatment.
The energy use efficacy (EUE) that describes the realizable yield for every kWh of electrical energy consumed, expressed in g kWh−1 was calculated for both the biomass and metabolite yields as follows:
2.5. Statistical Analysis
The one-way Analysis of Variance (ANOVA) with Tukey’s Honestly Significant Difference (HSD) post hoc test with p < 0.05 was used to identify the statistical significance and relationship between the results, while a two-way ANOVA was used to evaluate the interaction effects between the light treatments and experiment cycles. The IBM SPSS Statistics package (V25.0) was used for all statistical analysis.
3. Results
3.1. Interaction Effects
The results from the two-way ANOVA (Table 3) showed that there were no significant interactions between the replicates and light treatments (Replicate × Treatment), indicating that the effects of light treatment on the parameters were reproducible and were not caused or affected by the experiment replications. While there were statistically significant effects between the treatments was not unexpected, there were also statistically significant effects at p < 0.05 observed between the replicates within a treatment. However, further analysis of the estimated marginal means indicated that while the mean values for all treatments under replicate 2 varied compared to replicate 1, the overall pattern on the effectiveness of the different treatments remained the same through all replicates (Supplemental Figure S1) ensuring the validity and robustness of the data obtained.
Table 3.
ANOVA results on interaction effects.
3.2. Biomass Yield
The 16H treatment, which had the longest continuous photoperiod, resulted in the highest accumulation of fresh leaf and stem biomass, with 21% more fresh leaf per plant and 20% more fresh stem compared to the 8H-treated plants that had the next greatest yield of fresh biomass (Figure 3A,B). GH treatment had the lowest fresh leaf and stem yield, 66% lower compared to the 16H treatment for both. The 16HI- and 8H-treated plants had the highest dry biomass partitioning towards it leaves at 34.77% and 33.73%, while the longer photoperiods of 16H, 12H and GH has similar portioning of 31% (Figure 3D). 16H-treated plants had the highest dry leaf yield among all treatments. 16HI had significantly lower fresh leaf yields but plants in this group had dry leaf yields comparable to those from the 16H treatments, with 1.93 g dry leaf yield per plant. 8H and 12H had dry leaf yields of 1.30 g and 1.22 g, respectively, while the lowest dry leaf biomass was observed in plants grown under GH (Figure 3C).
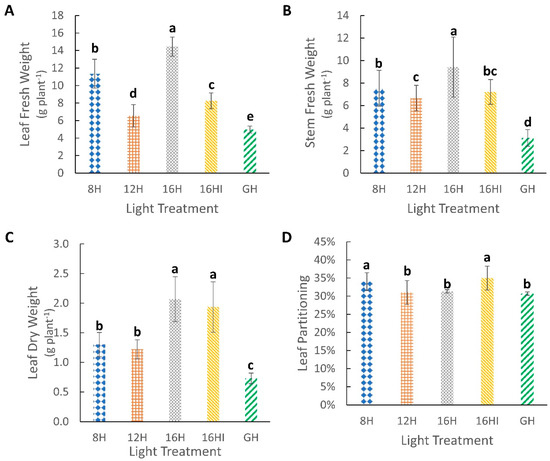
Figure 3.
Effect of photoperiod on fresh and dry biomass. (A) Leaf fresh weight (g plant−1). (B) Stem fresh weight (g plant−1). (C) Leaf dry weight (g plant−1). (D) Percentage dry biomass partitioning towards leaves (%). All measurements were obtained at 175 DAP. Values represents Mean (n = 72) ± Standard Deviation. Different letters above the error bars indicate statistical significance determined by Tukey’s HSD post hoc test at p < 0.05.
3.3. Metabolite Concentration and Yield
At 175 DAP, plants under the 8H photoperiod had the highest Reb A content at 6.54% w/w of dry leaf followed by 16HI (6.27% w/w), while 12H had the lowest Reb A content at 2.87% w/w (Figure 4A). Plants from the 8H and 16HI treatments, with the highest Reb A content, had the lowest ST accumulation in their leaves (Figure 4B). 8H (5.17% w/w) and 16HI (4.61% w/w) were the only treatments with ST content below 10% w/w, 56% and 31% lower than the 16H treatment that had the highest ST content of 13.79% w/w. The plants grown under natural sunlight and photoperiod (GH) had the lowest yield of 0.04 g per plant, while the 16H treatment had the highest combined yield of ST and Reb A per plant at 0.39 g, 975% higher than that of GH, followed by 16HI (0.22 g), 12H (0.19 g) and 8H (0.15 g) light treatments (Figure 4C).
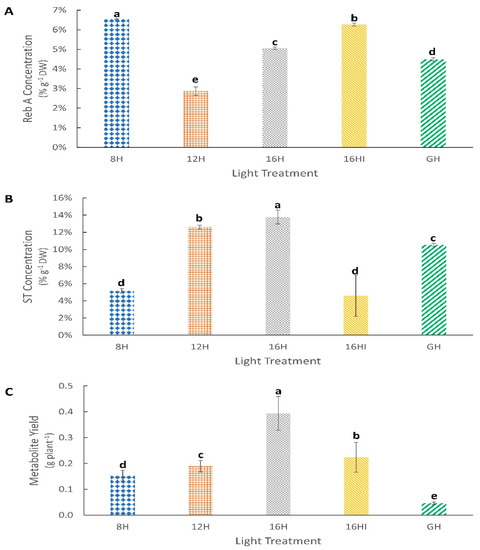
Figure 4.
Effect of photoperiod on metabolite accumulation in Stevia rebaudiana leaves. (A) Percentage concentration of Reb A in dry leaf weight (%). (B) Mean percentage concentration of ST in dry leaf weight (%). (C) Average metabolite (ST + Reb A) yield per plant (g plant−1). Values represents Mean (n = 72) ± Standard Deviation. Different letters above the error bars indicate statistical significance determined by Tukey’s HSD post hoc test at p < 0.05.
3.4. Energy and Yield Efficacy Analysis Results
The 8H and 12H treatments, both with higher PPFDs, had higher lighting power densities (LPD) at 316 W m−2 and 175.01 W m−2, respectively, compared to the 16H and 16HI treatments (Figure 5A). Among the artificial light treatments, the 16H treatment had the highest photon conversion efficacy, producing a combined 7.5 mg of ST and Reb A compound for every mol of light, while the 8H treatment was the lowest, producing 2.92 mg of the same compound for every mol of light (Figure 5B). No significant changes in PPE were observed under the different photoperiods and intensities.
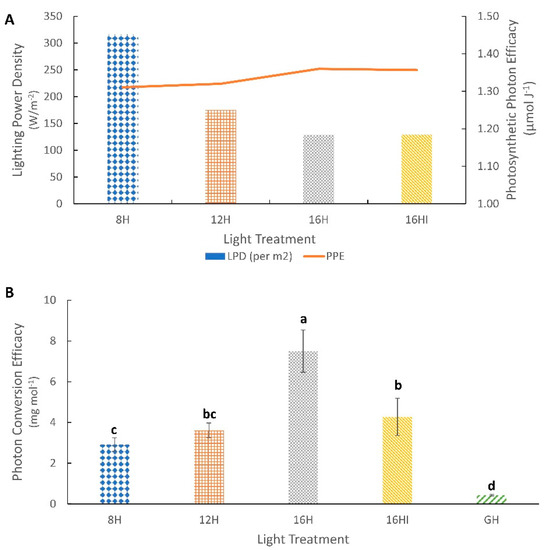
Figure 5.
Photosynthetic and Photon Conversion Efficacy. (A) Lighting Power Density (W m−2) and Photosynthetic Photon Efficacy (µmol J−1) for different artificial light treatments. The bar charts indicate the Lighting Power Densities (LPD) for the different light treatments, while the Line chart describes the Photosynthetic Photon Efficacies (PPE) for the same light treatments. (B) Photon Conversion Efficacy (PCE), the total amount of ST and Reb A produced for every mol of light (mg mol−1). Values represents Mean (n = 72) ± Standard Deviation. Different letters above the error bars indicate statistical significance determined by Tukey’s HSD post hoc test at p < 0.05.
The energy consumption of the growth room that used artificial lighting was significantly higher compared to the naturally lighted greenhouse, with the extended photoperiods of 16H and 16HI having the highest energy density of 763 kWh m−2 each. The higher energy requirements of the artificial lighting systems were driven by the additional lighting loads that were not present in the greenhouse that only used natural light, but also used air conditioning for temperature regulation. Overall, the greenhouse had the lowest total energy consumption of 585 kWh m−2. Even though the 16H protocol had the highest energy consumption, it was the most efficient photoperiod, resulting in the highest EUE for both biomass (61.5 g kWh−1) and metabolite (12.4 g kWh−1) accumulation. Conversely, although the greenhouse had the lowest overall energy consumption among all experiments, it had the lowest EUE for biomass and metabolite accumulation at 29.89 g kWh−1 and 1.87 g kWh−1, respectively.
4. Discussion
Indoor cultivation of plants in controlled environments under full artificial light has been shown to be not only economically viable for many plant species but also improved yields and quality [29,33,34]. The productivity of such systems is, however, effected by the light quality, intensity, and photoperiod [1,2,3]. As artificial lighting systems in CEAs account for a significant portion of the energy usage and costs [12,35], it is important to ensure that qualitative and quantitative aspects are optimized for the plants being cultivated. At present, artificial lighting used in indoor cultivation are designed to provide photoperiodic extension, supplemental intensities or both. These artificial lighting systems are often designed based on the ideal DLI requirements of the plants. DLI being a function of the photoperiod and intensity has a direct relationship on the energy consumption and cost within a CEA. A common approach towards achieving a high DLI is to have high light intensities and extended photoperiods. This does not only increase the overall lighting energy costs, but also indirectly increases the cost of cooling. While LEDs are more energy efficient compared to traditional fluorescent and discharge lamp technologies, it still converts up to 48% [36] of the electrical energy into heat. Hence, a system having higher intensities, DLI or both, would contribute more internal heat build-up within a facility. Using DLI values equivalent that is typically based on natural daylight is also not efficient when using LEDs that can supply the specific wavelengths used by the plant to maximize the intended yields. Studies have reported the beneficial and detrimental effects of selected spectral content on the productivity of multiple plant species [37,38]. Therefore, the full spectral composition available in natural daylight may not be the most optimized spectra for the plant, and as such, the DLI based on natural light alone is not a proper reference towards maximizing plant productivity, as it does not consider the qualitative aspect of the light. This is apparent from studies showing that artificial lighting with different spectral composition but with identical PPFDs and DLI, having significantly different yields [25,39].
Stevia rebaudiana is one of the many plants that can be cultivated indoors under artificial lighting, producing improved yields and a higher quality product. This is especially useful in tropical day-neutral locations such as Kuala Lumpur, Malaysia, where although Stevia is not only popular as a low-calorie sweetener but also as an herbal supplement, the short photoperiod does not allow for large-scale outdoor cultivation [17,20,21]. Although past studies have shown that introduction of short nigh interruptions with red and far-red lights are able to extend the vegetative period of field-grown Stevia plants [40], the tropical climate in Malaysia, with a hot and humid climate with thunderstorms throughout the year, limits large scale field cultivation [20,21]. Hence, this study is specifically focused on indoor cultivation in an environmentally controlled condition. Studies have shown that the SG and biomass accumulation in field-grown Stevia plants vary significantly according to the seasons and other environmental factors, such as humidity, temperature and water availability [2]. Indoor cultivation would eliminate these uncertainties, as all environmental conditions can be controlled and reproduced as desired, regardless of external environmental conditions, not requiring natural light, ensuring a stable and predictable yield. The photoperiod experimental system in the current study, was designed to provide an output within the PAR region with the intensities adjusted to achieve identical DLIs across all artificial lighting photoperiods. Past studies have shown that having a lower PPFD over a longer photoperiod is more productive in lettuce and Mizuna than having higher intensities with shorter photoperiods, with identical DLIs, as lower PPFDs promote more efficient photosynthetic activity in plants [3]. Besides improving plant productivity, lower light intensities would also require less lighting power, improving the lighting system efficacy due to reduced effects from the thermal and current droop within the LED package [41]. The spectra distribution of the artificial lighting systems in this study were selected to match the peak sensitivity range of the photosynthetic pigments. Red and blue light were used as the basal spectra as plant photosynthetic pigments chlorophyll a, chlorophyll b and carotenoid are most sensitive to these wavelength ranges [42]. Small amounts of green spectra were introduced to address the lower sensitivity areas of the chlorophyll absorption spectra between the green 500 nm to 600 nm range in order to provide the plants with a continuous spectrum that mimics the pattern of the chlorophyll absorption range and not just the peak wavelengths [6,43]. While the combination of red and blue spectra is known to be highly effective in stimulating photosynthesis, more recent studies have found that adding supplemental green light to match closer to the chlorophyll action spectra is beneficial in stimulating plant photosynthetic response as green light is able to penetrate deep through the canopy reaching leaves at lower levels, unlike red and blue light [8,44]. The artificial lighting systems had a maximum wattage of 400 Ws and operating at a maximum of 80% of the maximum wattage, the maximum intensity was determined to be at 249 ± 5.7 µmol m−2 s−1. This value was used for the shortest photoperiod of 8H and the DLI calculated was at 7.2 mol m−2 day−1. This DLI value was then selected for all artificial lighting systems. Incidentally, it represented 50% of the average DLI obtained from natural sunlight in the greenhouse and was within the range reported by Evans, Vallejo [27] to be ideal for accumulation of ST and Reb A compounds. The treatments were set up to compare the effects of 8, 12 and 16 h of continuous light within a 24-h period. The 16HI treatment was designed to create a photostressed environment by providing a shorter light and dark period of 5.3 h light and 2.7 h of darkness, with the cycle repeated three times daily resulting in a cumulative photoperiod of 16 h delivered intermittently over a 24-h period. Plants grown in a greenhouse (GH) with around 12 h of natural daylight were used as a reference for plant growth and metabolite analyses. To maximize the ST and Reb A yields in indoor cultivated Stevia plants, both the dry leaf biomass and concentrations of ST and Reb A must be increased. There was a small but statistically significant difference (p < 0.05) observed in the measurements between replicates 1 and 2 within each treatment. This observation is attributed to the genetic variation of the seeds. While the seeds were sourced from the same supplier and is of the same plant type, as it was procured in batches at different times over the course of 2 years, it was not possible to control or limit its genetic variability. Although there was no significant difference in germination rates (Supplemental Figure S2) for the different photoperiods, there were clear differences in the accumulation of biomass and metabolites that could influence the economics of plant productivity.
4.1. Plant Productivity
4.1.1. 16 Hour Continuous and Intermittent Photoperiod Optimized Biomass Accumulation
The leaves are the most commercially important part of the Stevia plant as they have the highest concentrations of SG compounds. From the findings of this study, it was noted that the dry leaf weight was the best representation of the metabolite yields of the plants compared to the fresh leaf yields. While the results obtained for 16H, 8H and 12H were consistent with studies that noted the increase in dry leaf biomass under higher light intensities, photoperiod or DLIs [22,23,45,46], the high yield from the 16HI was not expected given the significantly lower fresh leaf yield obtained. It was also observed that while both 8H and 12H treatments resulted in comparable dry leaf yields per plants, the 8H treatment resulted in significantly higher fresh leaf yields compared to 12H-treated plants. This points to a higher moisture content of 89% in the leaves of 8H-treated plants compared to 81% of those in plants treated under the 8H photoperiod. While the mean moisture contents of these treatments were in line with those from previous studies [25,40,47], which reported an average leaf moisture content of between 81% to 89%, the major difference between the short 8H photoperiod and neutral 12H period suggests a higher water usage by Stevia plants under short photoperiod conditions. All artificial lighting treatments resulted in higher dry leaf biomass accumulation compared to the natural sunlight of GH. The significant difference observed in the fresh and dry leaf biomass yields among the different artificial lighting systems corroborates previous studies that found more efficient photosynthetic activity with lower light intensities under constant DLIs [3] with the lowest intensities under 16H and 16HI having the highest dry leaf yields, a result of photosynthetic activity [3,13,48]. Meanwhile, the GH treatment, with higher DLI, had lower dry biomass accumulation when compared to the 12H-treated plants, although both treatments had similar photoperiods. This finding also underlines the importance of the light quality over the intensity and DLI, providing an option to further optimize the biomass yields of indoor Stevia cultivation by manipulation of photoperiod and light quality. Although natural daylight had higher intensities, DLI, and had more spectral content, ranging from UV to beyond far-red, it had the lowest fresh and dry biomass accumulation, suggesting the inhibitive nature of certain spectral components within natural light. Yoneda, Nakashima [26] reported shorter plants and lower biomass accumulation with the increase of blue spectral component in Stevia plants, comparable to the findings in this study where the GH treatment under natural daylight, which had the highest blue spectral content, resulted in the lowest fresh and dry leaf biomass accumulation. Although studies have reported the supercharging effect of far-red spectral component [37,39,49,50,51] in increasing the productivity of photosynthetic activity in several plants, increasing its dry biomass yields; however, this was not observed in this study. The higher far-red content of the natural sunlight under GH treatment did not result in any increase in biomass accumulation of Stevia plants, corroborating past studies that reported far-red spectral components to not having any positive effects on the yields of Stevia [25].
The overall effect of the photoperiod and intensity over the DLI was observed throughout this study, where plants grown under the same spectral composition and DLI, but with shorter photoperiods, had lower dry leaf yields compared to those under the 16H and 16HI treatments, although under higher intensities. It was observed that plants under the 12H treatment, with a photoperiod similar to the critical photoperiod of Stevia plants [52], resulted in fresh and dry leaf yields more similar to the GH grown plants, compared to other artificial lighting treatments. While the similar traits between 12H- and GH-treated plants were not unexpected, the 8H and 16H treatments, with inverse intensity and photoperiods, had traits similar to each other, demonstrating the possible influence of high light intensities in reducing some of the effects of photoperiods shorter than the critical photoperiod of Stevia. Under all treatments, the dry stem biomass was significantly higher than the leaf biomass. Previous studies reported significantly higher leaf to stem biomass ratios, often with leaves accounting for more than 50% of the total biomass [53]. However, these findings in previous studies were based on fresh and not dry biomass and may have been influenced by the overall water content of the samples, not accurately representing the dry biomass partitioning. These findings highlight the importance and effects of the light quality and photoperiod on optimizing biomass yields. Having higher intensities or DLIs may not always result in higher output if the way the light is delivered (photoperiod) is not optimized. Even under conditions with identical spectral content, the biomass accumulation can be significantly improved by employing an optimized photoperiod strategy while maintaining the DLI. While having lower light intensities over extended photoperiods has proven to be the most productive approach, caution should be exercised to avoid using lighting levels that are too low. When lighting levels drop below an acceptable threshold, plants such as Stevia will begin to exhibit a light scavenging shade avoidance response, resulting in taller plants with fewer leaves, and would begin to transition to a reproductive stage where plants start to flower [25]. Stevia plants lose their commercial viability once they begin to flower as the content of desired metabolites deteriorates by up to 50% when there is no new vegetative growth [25].
4.1.2. Continuous 16 Hour Photoperiod Increased Metabolite Concentration and Yields
Although ST and Reb A are two of the most abundant of all SG components, Reb A has significantly higher commercial value, with preference for use in the food and beverage industry due to a better taste profile that lacks the bitter aftertaste of ST [19]. The Reb A and ST concentrations obtained under GH treatment were consistent with field-grown varieties, reported to be between 2% to 4% w/w for Reb A, and 5% to 10% for ST [16,54,55]. The short photoperiods of 8H and intermittent light from the 16HI treatment had the highest percentage yields of Reb A and the lowest ST content. Given the higher commercial value of Reb A, reaching USD70,000 per tonne, this is a preferred trait [19]. However, when considering the overall dry leaf biomass, the final realizable yield of these two compounds was significantly lower compared to that of the 16H treatment. The difference in concentration of Reb A and ST and the overall difference in ratio observed in this study corroborated the findings of previous studies that reported higher percentage of ST and Reb A under long day conditions compared to short day conditions [22,27,52]. Evans, Vallejo [27] noted an increase in the concentration of ST and Reb A, as the DLI increased up to 10 mol m−2 day−1, after which the concentration of ST reduced while Reb A and total SG percentage remained constant. The combined ST and Reb A metabolite yields per plant were highest under the 16H treatment (0.40 g plant−1), 8.6 times the amount obtained in plants under the GH treatment (0.05 g plant−1). All artificial lighting treatments, regardless of photoperiod and intensity, yielded higher than the GH grown plants with 16HI at 0.22 g (4.91×), 12H at 0.19 g (4.15×) and 8H at 0.15 g (3.35×) per plant. Studies have reported higher metabolite yields under lower DLIs [27] and long day conditions [22,23]. However, the increase in biomass accumulation caused by an extended vegetative period was attributed to this increase, rather than an increase of the metabolite concentration [22]. A similar observation was made in this study where the increase in metabolite yields was correlated with the increase in the dry biomass yields as opposed to the concentration of ST and Reb A. This result indicates the functional feasibility of implementing the strategy of optimizing artificial lighting photoperiod to improve productivity, as this does not compromise on the metabolite concentrations and yields. Often, the application of artificial lighting in commercial agriculture is focused on improving the biomass yields with no significant consideration for the metabolite contents. However, in plants with medicinal purposes such as Stevia, having both the biomass and metabolite yields is imperative towards maximizing economic viability.
4.2. Extended Photoperiod Improved Efficacies
In CEAs, lighting energy costs often account for more than 50% of the total energy load, and as such, careful consideration should be made to ensure the most efficient approach is taken [12]. The LPD and PPE of the artificial light treatment is a representation of the equipment energy efficacy, and while it does not a reveal the effectiveness of the different photoperiods on biomass and metabolite accumulation, this is linked directly to the overall lighting energy requirements and costs. Increase in light intensities resulted in higher LPDs with the highest intensity of the 8H system consuming 316.6 W m−2, or 2.45 times more than the LPD of the 16H system, which had the lowest intensity. The overall LPD does not increase linearly as the intensity is increased (Figure 6). While the intensity between 16H and 8H increased by 100%, the corresponding LPD increased by 145% from 128 W m−2 (16H) to 316 W m−2 (8H). This is due to the nature of LEDs that experience current droop, caused by an increase in current density of the chip surface leading to, among others, photon leakage and thermal droop, which causes a reduction in optical efficacy of the LEDs with an increase in junction temperature of the LEDs [7,41]. While the PPE values of the systems did not vary significantly across the different intensity and photoperiods, it should be noted that these systems were designed and constructed as a prototype for experimental purposes using technology available in 2017 and have PPE values that are deemed to be low by current standards. Current technologies with significantly improved LED efficacies, and with superior commercial grade luminaire and control systems achieve photosynthetic photon efficacies (PPE), defined as the amount of lighting within the PAR range that can be produced per Joule (J) of electrical energy used, of between 2.7 to 3 µmol J−1 [41], up to 2.7 to 3 times more energy efficient compared to the LED components used for this study. This would result in possible further reduction of 16H system’s LPD from 128.7 W m−2 to between 42.9 and 47.6 W m−2 [12,36,41] further reducing the overall electrical energy requirements and costs. As both LPD and PPE are indicators of the lighting system’s electrical efficiencies, improvement in these parameters also translates to lower internal heat generation by the lighting systems. As the LED efficiencies improve, the LPD reduces and the PPE increases, leading to a reduction in energy conversion to heat. This results in lower waste heat generated within the CEA, reducing the cooling requirements and costs [12].
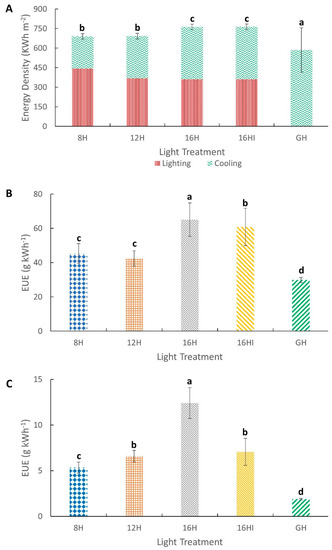
Figure 6.
Electrical energy consumption and efficacies. (A) Total electrical energy consumption over a 175-day growth cycle (kWh m−2). (B) Energy use efficacy (EUE) of biomass production (g kWh−1). (C) Energy use efficacy of metabolite production (g kWh−1). All values normalized to 1 m2 of growth space. Values represents Mean (n = 72) ± Standard Deviation. Different letters above the error bars indicate statistical significance determined by Tukey’s HSD post hoc test at p < 0.05.
Overall, the artificial lighting systems had significantly higher photon conversion efficacies compared to those of the greenhouse. However, there were significant differences between the artificial lighting systems, with the highest efficacy observed under the 16H (7.50 mg mol−1) treatment followed by the 16HI (4.23 mg mol−1), 12H (3.62 mg mol−1) and 8H (2.92m g mol−1) treatments. This difference highlights the important role of the overall photoperiod and intensity of artificial light on the biomass and metabolite accumulation in Stevia, as all treatments had the same DLI and spectral component. The PCE decreased as the intensity increased and as the photoperiod decreased. An increase in intensity was not sufficient to counteract the effects of a shorter photoperiod. These findings are directly related to the lower efficiency of photosynthetic activity at higher light intensity in certain plants due to lower daily electron transport through photosystem II [3,13,48]. The PCE is an important indicator of the economic viability of the lighting systems, as artificial lighting requires additional energy input that translates to an increase in operating costs; hence, it is essential that the yields are maximized for every mol of light delivered. The natural daylight of the GH treatment, although having higher DLI, intensity and a complete spectral content, had the lowest conversion efficacy of 0.44 mg mol−1, 17 times that of the 16H systems. While the PCE is not relevant for natural light, as sunlight is free, it provides an insight into the photo sensitivity of Stevia plants. The significant variance between the PCE of natural and artificial light points to a lower photo saturation point of Stevia rebaudiana plants, not responding to higher intensities and DLIs, an observation that was also noted by Evans, Vallejo [27] and Yoneda, Shimizu [22]. The lowest LPD and highest PCE of the 16H photoperiod makes this the most efficient among the artificial lighting treatments.
The energy density for the entire growing cycle was lowest under the naturally lighted GH compared to all artificial lighting setups. This finding was not unexpected and corroborates past studies that reported energy consumption in climate-controlled greenhouses to be lower than artificially lighted plant factories [35,36,56]. However, unlike past studies that were based on northern latitudes with seasonal temperature variations, this study was based in the tropics, where the annual ambient temperature and photoperiod remains fairly constant throughout the year [57] and cooling instead of heating was the primary energy load for the greenhouse. Comparing the artificial lighting setups and the greenhouse, it is apparent that while there is no lighting energy demand for the GH, it has significantly higher cooling energy consumption. In the growth room, the cooling load is directly related to the photoperiod. A longer photoperiod would require extended hours of additional cooling to mitigate the waste heat generated by the lighting systems. As the photoperiod extends to 16 h, the cooling energy requirements outweighed the lighting requirements. Hence, while the longer 16-h photoperiod was more productive, had lower LPD and the highest PPE, it also consumed the most electrical energy among all artificial lighting systems over the growth cycle. This finding may seem to be against the intention of optimizing energy efficacy; however, when comparing the energy use efficacies for all systems, the 16H photoperiod was the most efficient in both biomass and metabolite accumulation. While 16H consumed 11% more energy compared to 8H, it had 44% higher EUE in terms of biomass accumulation and 133% higher EUE in terms of metabolite yields. These findings indicate that while photoperiod manipulation does not affect the lighting equipment efficiency, it is extremely effective in improving the overall energy use efficacies, generating higher yields per unit of electrical energy consumed. When coupled with the latest horticulture lighting systems that have higher PPEs [41], this efficacies can be further improved.
Ceunen, Werbrouck [40] recommended the use of night interruption via short photoperiods of red light during the dark period as a low-cost method to extend the vegetative stage of field-grown Stevia plants. This was corroborated by Yoneda, Shimizu [22], who reported that red and far-red night interruption results in an increase in biomass yields as compared to an 8 h photoperiod control. While the proposed method by Ceunen, Werbrouck [40] would be the preferred for field cultivation or cultivation under natural sunlight, the current study focused on the optimization of the photoperiod under full artificial light, in an indoor setup, without any natural light in a tropical environment where outdoor cultivation would not be ideal. Although Yoneda, Shimizu [22] reported improved yields under the night interruption approach, the overall highest biomass yield across all experiments was observed under treatments with higher intensities and longer photoperiods. As artificial lighting energy consumption accounts for more than 50% of the total energy cost within a CEA system, it is important to optimize the lighting setup, to maximize the yields, going beyond field-grown benchmarks.
Besides drawing attention to the effect of light quality on plant productivity, the findings of this study also highlighted the influence of spectral composition on the effective DLI of Stevia plants. The plant productivity was higher under the selected wavelengths of the artificial light as compared to the full spectrum natural light. This allows for significantly lower DLIs within a CEA, lowering its energy requirements. As DLI is affected by both intensity and photoperiod, this study found that having lower intensities at longer photoperiods further optimized the energy requirements of artificial light, increasing plant productivity, reducing the overall lighting power load and improving the overall system efficacy compared to having higher intensities at shorter photoperiods. These results validate photoperiod manipulation as a viable approach to improving productivity and increasing energy use efficacies for indoor cultivation of Stevia rebaudiana. Hence, in future design considerations for more efficient artificial lighting systems for indoor cultivation of Stevia, instead of trying to match the DLIs of field-grown conditions, the light quality, intensity and photoperiod should be prioritized.
5. Conclusions
The effect of photoperiod and intensities productivity and energy efficacy of indoor cultivation of Stevia rebaudiana was studied. The 16-h photoperiod delivered continuously or intermittently had the highest dry leaf yields. Although 16HI and 8H had higher concentrations of Reb A, the overall metabolite yields were highest under the 16H treatment driven by the overall higher dry biomass and ST yields. Although the GH had the lowest energy consumption, the highest energy use efficacies were obtained under 16H.
Based on this study, a 16-h photoperiod under red and blue artificial lighting systems supplemented with small amounts of green spectrum is recommended for indoor cultivation of Stevia rebaudiana. These conditions produced high biomass and metabolite yields, with a high energy use efficiency. The findings of this study also underlined the influence of light quality on determining the quantitative aspects of Stevia plants. Under the right spectral composition, the DLIs, intensities and photoperiods of artificial light can be further optimized to improve yields and energy efficacies.
Supplementary Materials
The following supporting information can be downloaded at: https://www.mdpi.com/article/10.3390/agronomy12081787/s1, Figure S1: Estimated Marginal Means (EMM). (A) EMM of the Leaf Fresh Weight. (B) EMM of the Stem Fresh Weight. (C) EMM of the Leaf Dry Weight. (D) EMM of the Photon Conversion Efficacy (PCE). (E) EMM of the Reb A + ST Metabolite Yields per plant. (F) EMM of the Energy Use Efficacy (EUE) for biomass accumulation. (G) EMM of the Energy Efficacy (EUE) for the Metabolite accumulation; Figure S2: The mean rate of germination of Stevia rebaudiana seeds under different photoperiods and under natural daylight observed on a weekly basis. A negative slope indicates mortality within the seedlings. Values represent Mean percentage (n = 72) and bars indicate Standard Deviation.
Author Contributions
Conceptualization: N.R., R.Y.O., H.S.C. and J.A.H.; Methodology: N.R.; Data curation: N.R.; Formal analysis: N.R.; Visualization: N.R.; Writing—Original draft preparation: N.R.; Writing—Editing: N.R., R.Y.O., H.S.C. and J.A.H.; Supervision: R.Y.O., H.S.C. and J.A.H. All authors have read and agreed to the published version of the manuscript.
Funding
This work was supported by the Ministry of Education Malaysia [CEBAR Research University grant no. RU004A-2020].
Data Availability Statement
Data available on request from the first author.
Acknowledgments
The authors thank Purabi Mazumdar and Zarina Md Ali for their kind assistance with the use of the Plant Biotech Facility, University of Malaya.
Conflicts of Interest
The authors declare that they have no known competing financial interest or personal relationships that could have appeared to influence the work reported in this paper.
References
- An, S.; Hwang, H.; Chun, C.; Jang, Y.; Lee, H.J.; Wi, S.H.; Yeo, K.-H.; Yu, I.-h.; Kwack, Y. Evaluation of Air Temperature, Photoperiod and Light Intensity Conditions to Produce Cucumber Scions and Rootstocks in a Plant Factory with Artificial Lighting. Horticulturae 2021, 7, 102. [Google Scholar] [CrossRef]
- De Andrade, M.V.S.; de Castro, R.D.; da Silva Cunha, D.; Neto, V.G.; Carosio, M.G.A.; Ferreira, A.G.; de Souza-Neta, L.C.; Fernandez, L.G.; Ribeiro, P.R. Stevia rebaudiana (Bert.) Bertoni cultivated under different photoperiod conditions: Improving physiological and biochemical traits for industrial applications. Ind. Crops Prod. 2021, 168, 113595. [Google Scholar] [CrossRef]
- Palmer, S.; van Iersel, M.W. Increasing Growth of Lettuce and Mizuna under Sole-Source LED Lighting Using Longer Photoperiods with the Same Daily Light Integral. Agronomy 2020, 10, 1659. [Google Scholar] [CrossRef]
- Jones, M.A. Using light to improve commercial value. Hortic. Res. 2018, 5, 47. [Google Scholar] [CrossRef]
- Hernández, R.; Eguchi, T.; Deveci, M.; Kubota, C. Tomato seedling physiological responses under different percentages of blue and red photon flux ratios using LEDs and cool white fluorescent lamps. Sci. Hortic. 2016, 213, 270–280. [Google Scholar] [CrossRef]
- Zheng, L.; He, H.; Song, W. Application of Light-emitting Diodes and the Effect of Light Quality on Horticultural Crops: A Review. HortScience 2019, 54, 1656–1661. [Google Scholar] [CrossRef]
- Morgan Pattison, P.; Hansen, M.; Tsao, J.Y. LED lighting efficacy: Status and directions. Comptes Rendus Phys. 2018, 19, 134–145. [Google Scholar] [CrossRef]
- Zhang, X.; Bian, Z.; Yuan, X.; Chen, X.; Lu, C. A review on the effects of light-emitting diode (LED) light on the nutrients of sprouts and microgreens. Trends Food Sci. Technol. 2020, 99, 203–216. [Google Scholar] [CrossRef]
- Samuoliene, G.; Virsile, A.; Haimi, P.; Miliauskiene, J. Photoresponse to different lighting strategies during red leaf lettuce growth. J. Photochem. Photobiol. B 2020, 202, 111726. [Google Scholar] [CrossRef]
- American Society of Agricultural and Biological Engineers. Quantities and Units of Electromagnetic Radiation for Plants (Photosynthetic Organisms); ASABE: St. Joseph, MI, USA, 2017; p. 1. [Google Scholar]
- Shaari, A.M.; Razuan, M.S.M.; Taweekun, J.; Batcha, M.F.M.; Abdullah, K.; Sayuti, Z.; Ahmad, M.A.; Tahir, M.A.M. Energy Profiling of a Plant Factory and Energy Conservation Opportunities. J. Adv. Res. Fluid Mech. Therm. Sci. 2021, 80, 13–23. [Google Scholar] [CrossRef]
- Graamans, L.; Baeza, E.; van den Dobbelsteen, A.; Tsafaras, I.; Stanghellini, C. Plant factories versus greenhouses: Comparison of resource use efficiency. Agric. Syst. 2018, 160, 31–43. [Google Scholar] [CrossRef]
- Elkins, C.; van Iersel, M.W. Longer photoperiods with the same daily light integral increase daily electron transport through photosystem II in lettuce. Plants 2020, 9, 1172. [Google Scholar] [CrossRef]
- Geuns, J.M. Stevia and Steviol Glycosides; Euprint: Heverlee, Belgium, 2010. [Google Scholar]
- Libik-Konieczny, M.; Capecka, E.; Kąkol, E.; Dziurka, M.; Grabowska-Joachimiak, A.; Sliwinska, E.; Pistelli, L. Growth, development and steviol glycosides content in the relation to the photosynthetic activity of several Stevia rebaudiana Bertoni strains cultivated under temperate climate conditions. Sci. Hortic. 2018, 234, 10–18. [Google Scholar] [CrossRef]
- Wojewoda, A.; Wodyk, T.; Stępniowski, D.; Cholewińska, E.; Stępniowska, A. Analysis of content of steviosides as biologically active compounds in stevia (Stevia rebaudiana) and products manufactured on the basis of this plant. World Sci. News 2018, 93, 146–156. [Google Scholar]
- Saharudin, A.M.i.B.; Nazri, N.B.M.; Roslee, A.H.B.; Hawi, M.H.B.; Mar, S.O. Acceptance of Stevia as a Sugar Substitute and its Determinants among Health Educated Individuals and its Determinants. Curr. Res. Nutr. Food Sci. J. 2020, 8, 226–237. [Google Scholar] [CrossRef]
- FSANZ. Final Assessment Report: Application A540: Steviol Glycosides as Intense Sweeteners; FSANZ: Canberra, Australia; Wellington, New Zealand, 2008. [Google Scholar]
- Ciriminna, R.; Meneguzzo, F.; Pecoraino, M.; Pagliaro, M. A bioeconomy perspective for natural sweetener Stevia. Biofuels Bioprod. Biorefining 2019, 13, 445–452. [Google Scholar] [CrossRef]
- Abdulameer, D.A.; Osman, M.B.; Sulaiman, Z.; Yusop, M.R.; Abdullah, S.; Azizi, P.; Muttaleb, Q.A. Assessment of Stevia rebaudiana Bertoni Genotypes via Morpho-Agronomic Traits under Two Light Conditions. Am. J. Plant Sci. 2018, 9, 1403–1413. [Google Scholar] [CrossRef][Green Version]
- Tan, S.; Muhammad Ghawas, M.; Mohamad Najib, M.; Zawayi, M. Preliminary evaluation and selection of stevia under Malaysian conditions. J. Trop. Agric. Food Sci. 2008, 36, 1–7. [Google Scholar]
- Yoneda, Y.; Shimizu, H.; Nakashima, H.; Miyasaka, J.; Ohdoi, K. Effects of light intensity and photoperiod on improving steviol glycosides content in Stevia rebaudiana (Bertoni) Bertoni while conserving light energy consumption. J. Appl. Res. Med. Aromat. Plants 2017, 7, 64–73. [Google Scholar] [CrossRef]
- Ceunen, S.; Geuns, J.M. Influence of photoperiodism on the spatio-temporal accumulation of steviol glycosides in Stevia rebaudiana (Bertoni). Plant Sci. 2013, 198, 72–82. [Google Scholar] [CrossRef]
- Nakonechnaya, O.V.; Gafitskaya, I.V.; Burkovskaya, E.V.; Khrolenko, Y.A.; Grishchenko, O.V.; Zhuravlev, Y.N.; Subbotin, E.P.; Kulchin, Y.N. Effect of Light Intensity on the Morphogenesis of Stevia rebaudiana under In Vitro Conditions. Russ. J. Plant Physiol. 2019, 66, 656–663. [Google Scholar] [CrossRef]
- Rengasamy, N.; Othman, R.Y.; Che, H.S.; Harikrishna, J.A. Beyond the PAR Spectra: Impact of light quality on the germination, flowering, and metabolite content of Stevia rebaudiana (Bertoni). J. Sci. Food Agric. 2021, 102, 299–311. [Google Scholar] [CrossRef]
- Yoneda, Y.; Nakashima, H.; Miyasaka, J.; Ohdoi, K.; Shimizu, H. Impact of blue, red, and far-red light treatments on gene expression and steviol glycoside accumulation in Stevia rebaudiana. Phytochemistry 2017, 137, 57–65. [Google Scholar] [CrossRef]
- Evans, J.M.; Vallejo, V.A.; Beaudry, R.M.; Warner, R.M. Daily Light Integral Influences Steviol Glycoside Biosynthesis and Relative Abundance of Specific Glycosides in Stevia. HortScience 2015, 50, 1479–1485. [Google Scholar] [CrossRef]
- Chen, X.-l.; Li, Y.-l.; Wang, L.-c.; Guo, W.-z. Red and blue wavelengths affect the morphology, energy use efficiency and nutritional content of lettuce (Lactuca sativa L.). Sci. Rep. 2021, 11, 8374. [Google Scholar] [CrossRef]
- Hardanto, A.; Sumarni, E. Biomass Growth of Red Spinach in Plant-Factory System under Three Kinds of LED Light Sources. In IOP Conference Series: Earth and Environmental Science; IOP Publishing: Bristol, UK, 2021; p. 12100. [Google Scholar]
- Olvera-Gonzalez, E.; Escalante-Garcia, N.; Myers, D.; Ampim, P.; Obeng, E.; Alaniz-Lumbreras, D.; Castaño, V. Pulsed LED-Lighting as an Alternative Energy Savings Technique for Vertical Farms and Plant Factories. Energies 2021, 14, 1603. [Google Scholar] [CrossRef]
- Othman, H.S.; Osman, M.; Zainuddin, Z. Genetic Variabilities of Stevia rebaudiana Bertoni Cultivated in Malaysia as Revealed by Morphological, Chemical and Molecular Characterisations. AGRIVITA J. Agric. Sci. 2018, 40, 267–283. [Google Scholar] [CrossRef]
- WHO; FAO. Compendium of Food Additive Specifications. Joint FAO/WHO Expert Committee on Food Additives (JECFA), 87th Meeting June 2019. FAO JECFA Monogr. 2020, 23, 62–85. [Google Scholar]
- Hwang, H.; An, S.; Lee, B.; Chun, C. Improvement of Growth and Morphology of Vegetable Seedlings with Supplemental Far-Red Enriched LED Lights in a Plant Factory. Horticulturae 2020, 6, 109. [Google Scholar] [CrossRef]
- He, R.; Zhang, Y.; Song, S.; Su, W.; Hao, Y.; Liu, H. UV-A and FR irradiation improves growth and nutritional properties of lettuce grown in an artificial light plant factory. Food Chem. 2020, 345, 128727. [Google Scholar] [CrossRef] [PubMed]
- Zhang, Y.; Kacira, M. Comparison of energy use efficiency of greenhouse and indoor plant factory system. Eur. J. Hortic. Sci. 2020, 85, 310–320. [Google Scholar] [CrossRef]
- Graamans, L.; Tenpierik, M.; van den Dobbelsteen, A.; Stanghellini, C. Plant factories: Reducing energy demand at high internal heat loads through façade design. Appl. Energy 2020, 262, 114544. [Google Scholar] [CrossRef]
- Demotes-Mainard, S.; Péron, T.; Corot, A.; Bertheloot, J.; Le Gourrierec, J.; Pelleschi-Travier, S.; Crespel, L.; Morel, P.; Huché-Thélier, L.; Boumaza, R.; et al. Plant responses to red and far-red lights, applications in horticulture. Environ. Exp. Bot. 2016, 121, 4–21. [Google Scholar] [CrossRef]
- Huché-Thélier, L.; Crespel, L.; Gourrierec, J.L.; Morel, P.; Sakr, S.; Leduc, N. Light signaling and plant responses to blue and UV radiations—Perspectives for applications in horticulture. Environ. Exp. Bot. 2016, 121, 22–38. [Google Scholar] [CrossRef]
- Zhen, S.; Bugbee, B. Far-red photons have equivalent efficiency to traditional photosynthetic photons: Implications for redefining photosynthetically active radiation. Plant Cell Environ. 2020, 43, 1259–1272. [Google Scholar] [CrossRef]
- Ceunen, S.; Werbrouck, S.; Geuns, J.M. Stimulation of steviol glycoside accumulation in Stevia rebaudiana by red LED light. J. Plant Physiol. 2012, 169, 749–752. [Google Scholar] [CrossRef]
- Kusuma, P.; Pattison, P.M.; Bugbee, B. From physics to fixtures to food: Current and potential LED efficacy. Hortic. Res. 2020, 7, 56. [Google Scholar] [CrossRef]
- Leyla, B.; Mostafa, A.; Sasan, A.; Mehdi, S.; Tao, L.; Oksana, L. Effects of growth under different light spectra on the subsequent high light tolerance in rose plantsm. AoB Plants 2018, 10, ply052. [Google Scholar]
- Ouzounis, T.; Rosenqvist, E.; Ottosen, C.-O. Spectral effects of artificial light on plant physiology and secondary metabolism: A review. HortScience 2015, 50, 1128–1135. [Google Scholar] [CrossRef]
- Claypool, N.; Lieth, J. Physiological responses of pepper seedlings to various ratios of blue, green, and red light using LED lamps. Sci. Hortic. 2020, 268, 109371. [Google Scholar] [CrossRef]
- Yang, Y.; Huang, S.; Han, Y.; Yuan, H.; Gu, C.; Wang, Z. Environmental cues induce changes of steviol glycosides contents and transcription of corresponding biosynthetic genes in Stevia rebaudiana. Plant Physiol Biochem. 2015, 86, 174–180. [Google Scholar] [CrossRef]
- Ermakov, E.; Kochetov, A. Growth and productivity of Stevia under regulated conditions, depending on the photoperiod and light intensity. Russ. Agric. Sci. 1994, 20, 11–14. [Google Scholar]
- Ceunen, S.; Geuns, J.M. Spatio-temporal variation of the diterpene steviol in Stevia rebaudiana grown under different photoperiods. Phytochemistry 2013, 89, 32–38. [Google Scholar] [CrossRef]
- Elkins, C.; van Iersel, M.W. Longer photoperiods with the same daily light integral improve growth of Rudbeckia seedlings in a greenhouse. HortScience 2020, 1, 1–7. [Google Scholar] [CrossRef]
- Legendre, R.; van Iersel, M.W. Supplemental Far-Red Light Stimulates Lettuce Growth: Disentangling Morphological and Physiological Effects. Plants 2021, 10, 166. [Google Scholar] [CrossRef]
- Zhen, S.; van Iersel, M.; Bugbee, B. Why Far-Red Photons Should Be Included in the Definition of Photosynthetic Photons and the Measurement of Horticultural Fixture Efficacy. Front. Plant Sci. 2021, 12, 1158. [Google Scholar] [CrossRef] [PubMed]
- Zhen, S.; Bugbee, B. Substituting far-red for traditionally defined photosynthetic photons results in equal canopy quantum yield for CO2 fixation and increased photon capture during long-term studies: Implications for re-defining PAR. Front. Plant Sci. 2020, 11, 1433. [Google Scholar] [CrossRef] [PubMed]
- Zaidan, L.B.; Dietrich, S.M.; Felippe, G. Effect of photoperiod on flowering and stevioside content in plants of Stevia rebaudiana Bertoni. Jpn. J. Crop Sci. 1980, 49, 569–574. [Google Scholar] [CrossRef]
- Benhmimou, A.; Ibriz, M.; Al Faïz, C.; Gaboun, F.; Shaimi, N.; Amchra, F.Z.; Lage, M. Effects of water stress on growth, yield, quality and physiological responses of two stevia (Stevia rebaudiana Bertoni) varieties in Rabat region, Morocco. Asian J. Agric. Biol. 2018, 6, 21–34. [Google Scholar]
- Muthusamy, K.; Munaim, M.S.A. Determination of Factors Affecting Extraction of Rebaudioside A & Stevioside from Stevia Leaves. Int. J. Eng. Technol. Sci. 2019, 6, 120–130. [Google Scholar]
- Kurek, J.M.; Krejpcio, Z. The functional and health-promoting properties of Stevia rebaudiana Bertoni and its glycosides with special focus on the antidiabetic potential–A review. J. Funct. Foods 2019, 61, 103465. [Google Scholar] [CrossRef]
- Weidner, T.; Yang, A.; Hamm, M.W. Energy optimisation of plant factories and greenhouses for different climatic conditions. Energy Convers. Manag. 2021, 243, 114336. [Google Scholar] [CrossRef]
- Department, M.M. Annual Report; Malaysian Meteorological Department: Petaling Jaya, Malaysia, 2019. [Google Scholar]


Publisher’s Note: MDPI stays neutral with regard to jurisdictional claims in published maps and institutional affiliations. |
© 2022 by the authors. Licensee MDPI, Basel, Switzerland. This article is an open access article distributed under the terms and conditions of the Creative Commons Attribution (CC BY) license (https://creativecommons.org/licenses/by/4.0/).