Article

Seeking Ways for Dealing with the Impacts of Sandstorms on the Railway Network in Saudi Arabia

Department of Civil Engineering, College of Engineering, Taif University, P.O. Box 11099, Taif 21944, Saudi Arabia
*
Author to whom correspondence should be addressed.
Sustainability 2022, 14(15), 9436; https://doi.org/10.3390/su14159436
Submission received: 18 May 2022 / Revised: 28 July 2022 / Accepted: 29 July 2022 / Published: 1 August 2022
(This article belongs to the Special Issue Sustainable Operation and Maintenance of Railway Systems)

Abstract

:
Sandstorms that cause shifting dunes are a huge technical challenge in the development of the railway network in Saudi Arabia, and are known as one of the most concerning atmospheric aspects. In this case, the weather or climate change makes railways more problematic and costly in Saudi Arabia compared to other countries. The purpose of this article is to develop Saudi Arabia’s rail system in order to overcome environmental difficulties and obstacles such as wind–sand flow behavior and other impediments (e.g., camels) by constructing obstructions such as protective walls and dykes. Theoretical analysis is used to investigate the major components that influence wind velocity and density. The wind velocity in the majority of the locations in Saudi Arabia was employed as a control value in this study, which was based on the Saudi building standard SBC301. Sandstorm protection is best achieved by combining four different building solutions, including ditches, dykes, trees, and concrete barriers. The site parameters, such as sand particle size, air velocity, and the required downwind strip distance, all influence which of the four recommended approaches is optimal. From this study, it is concluded that the wind speed at the height of interest (barrier height) should be calculated using wind shear exponents ranging from 0.2 to 0.5 depending on the topography and surface roughness aspects. A new equation based on two parameters, Q 1 and n, as a function of the wind shear exponent is suggested to predict the percentage of wind velocity increase ( V i n c   % ) over the barriers. This study found that the protected distance between the downwind strip and the receiver might be anywhere between 20 and 40 m.

1. Introduction

Railway lines in desert and dry regions are predicted to expand quickly in the short and medium term, most notably in the Middle East and North Africa (MENA) region. At various scales, Arab countries are developing, analyzing, and creating a massive railway network. The Arab Network Railway (ANR) is a 30,000 km high-speed/high-capacity railway network connecting all Arab countries in the Middle East and North Africa. It is worth noting that such a project spans more than twice the length of the whole European high-speed railway network, and is now operational and under development. The Gulf Railway (GR) is a projected 2217 km project that would link six Arab Gulf Cooperation Council (GCC) member nations. National railway networks, such as those in Oman, the UAE, and Saudi Arabia, are now being designed and/or built using high-speed railway network systems. The development of rail system planning includes many challenges such as wind–sand flow (sand dunes), and these issues need to be solved. Changes to the level of demand depend on safety first as well as other services, which will help the rail sector in Saudi Arabia to develop by finding appropriate solutions to overcome these problems. The resulting investments are substantial. For example, the Middle East countries have set aside USD 260 billion to construct 40,000 km of railway tracks by 2030 [1].
The justification for the issue definition, design, quantitative analysis, and verification of sand mitigation methods is currently lacking. The research offers new categorizations for both windblown sand-induced performance deficiencies in railway systems and preventative approaches for mitigating the impacts of windblown sand. In order to convey the classification as correctly as possible, the state of the art is evaluated. The classification’s major objective is to give a reference point for academics, railway owners, designers, general contractors, and operators.

2. Literature Review

Dust storms are defined as strong winds that carry large clouds of dust into the atmosphere; the winds of fine dust are commonly raised to a height of above 3000 m and can be transported thousands of kilometers [2]. In this case, the sand and dust storms usually develop in desert areas and are caused by strong pressure gradients or by thunderstorm outflows, which commonly cause an increase in the velocity of wind over a wide region [3]. For example, the sandy deserts in Saudi Arabia are the most prominent feature and cover about 35% of the land in the country. There are three major deserts, as shown in Figure 1: An-Nafud is an upland desert of red sands because of an iron oxide coating that covers an area of 64,000 km2, lying in the northern part of the country at an elevation of 900 m [4].
The Rub-al-khali desert covers much of the southeast of the country and beyond the southern border, which has an estimated area of around 650,000 km2. The Ad-Dahna desert, or reddish sandy desert, is a narrow strip of sandy terrain located in the central region of Saudi Arabia, which extends around 1300 km southward from the northwestern side of An-Nafud desert to the northwestern borders of the Rub-al-khali desert [4].
This section will concentrate on research relating to Saudi Arabian dust storms. Middleton [5] examined horizontal visibility over a 10-year period (from the 1950s to the 1960s) and found that a major source of dust originated from Lower Mesopotamia (southern Iraq), although there seemed to be a decline in dust activity over eastern Saudi Arabia during that time period. Middleton also revealed that dust storms in Saudi Arabia’s northern regions mostly happened in the spring, while those in the south were more likely to appear in the summer. Furman [6] studied visibility losses from 1973 to 1993, and reached the same conclusions as Middleton [5].
Over a five-year period (1979–1983), Ackerman and Cox [7] investigated the timing and geographical distribution of dust episodes over the southwest Indian summer monsoon area, finding that dust plume heights reached 400 millibars (mb) during the summer and 600 mb during the late spring and early fall. This can be explained by the increased summer temperature, which causes thermal convection, allowing dust to be loaded higher into the atmosphere and moved over greater distances. This matches Middleton’s and Furman’s findings of increasingly frequent dust storms in Saudi Arabia’s south. Furthermore, Alharbi [8] used PM10 (concentrations of airborne particulate matter with an aerodynamic diameter less than 10 µm; the smallest size that is suitable for wind transportation) dust concentrations to investigate the geographical and temporal aspects of dust storm activity over Saudi Arabia from 2000 to 2003. The dust record from the King Abdulaziz City for Science and Technology (KACST) monitoring network was used in the study. These data were integrated with back trajectories analysis using the Hybrid Single Particle Lagrangian Integrated Trajectory Model (HYSPLIT) and total ozone mapping spectrometer (TOMS) satellite images. The study found that the city of Riyadh saw the most severe dust episodes from March to August. Additionally, nine local and four far sources of dust were detected using satellite pictures and back trajectories from 2000 to 2005. Riyadh, Dammam, and Jeddah were shown to be badly affected by these sources.
Dust particles dramatically change the radiative balance over the Saudi Arabian deserts, according to Mohalfi et al. [9], weakening the non-frontal heat, lows created by direct solar heating. This has an immediate effect on pressure distribution, affecting synoptic-scale systems. Numerical models have been used in several investigations to simulate or forecast dust outbreaks. Draxler et al. [10] utilized the HYSPLIT model to predict PM10 concentrations in many Middle Eastern countries between August 1990 and August 1991. Because of the poor resolution of the European Centre for Medium-Range Weather Forecasts’ (ECMWF) gridded data utilized in the model, which did not capture small-scale phenomena such as sea breezes, the model repeatedly overpredicted PM10 air concentrations, especially in coastal locations. Likewise, Barnum et al. [11] employed a University of Colorado-developed meso-scale meteorological model and a dust transport model to forecast dust storms across the Sahara Desert and southwestern Asia, including Saudi Arabia. The model’s results were not always accurate. Dust storms in Saudi Arabia’s western and central areas were underestimated by the model (these were more strongly affected by Saharan dust). Despite this, it functioned admirably east of the Arabian Desert. Maghrabi et al. [12] investigated the impact of dust storms on meteorological parameters during a significant dust storm that passed over Riyadh on 10 March 2009. The air pressure, temperature, relative humidity, wind speed and direction, and aerosol optical depth (AOD) all changed significantly. Research conducted by Notaro et al. [13] examined the temporal and geographical aspects of dust storms in 13 Saudi Arabian cities. The study employed data from the National Climatic Data Centre (NCDC) for eight years (2005–2012), gridded data from the National Centers for Environmental Prediction (NCEP) with a resolution of (1°–11°), and aerosol optical depth (AOD) data from remote sensing and the Global Data Assimilation System (GDAS). Dust storms were found to be most common between February and June, with a spring peak in the northern areas and an early summer high in the eastern parts. Using satellite photos, AOD data, and meteorological observations, Yu et al. [14] investigated temporal and geographical air dust variations over Saudi Arabia from 2000 to 2010. The results revealed that dust activity was at its peak in the northern and central portions of Saudi Arabia during the spring and summer, and in the southern and western sections during the early spring and summer, as in previous research. They also showed how satellite data might be incorrect, especially in places with minimal dust activity, such as coastal areas and topographically difficult highlands. Four distinct synoptic trends over Saudi Arabia were found by Awad and Mashat [15], contributing to large spring dust episodes in the central and eastern areas. The interaction of high- and low-pressure systems across the Arabian Peninsula caused these circumstances. Furthermore, dust activity in Saudi Arabia’s northern and southern areas is affected by the expansion of the Siberian High and the Red Sea (Sudanese) trough, respectively [16]. Amanollahi et al. [17] made some interesting observations about the effect of the temperature difference between the Mediterranean Sea and the Syrian Desert on the occurrence of dust over western Iran and eastern Saudi Arabia, concluding that the temperature difference is an important predictor days before a dust storm. A number of articles on global atmospheric circulation and air temperatures in Saudi Arabia have been published by Vorhees [18], Hasanean et al. [19], and Li et al. [20]. For instance, Vorhees [18] investigated the effects of global climate change on southwest Asia (including Saudi Arabia). The research looked at the association between (October—winter) temperature and rainfall in southwest Asia and lower- and upper-level circulation anomalies in the eastern hemisphere. They discovered that during the winter season, the Siberian High (SH) has a substantial impact on the climate over Saudi Arabia.
In 2019, Mehdipour and Baniamerian [21] determined two classic methods to reduce the sand deposition on railway tracks, using fence installation in different shapes and porosities along the railway. In this case, the shape of fences can help in reducing the amount of sand drift on railways, as shown in Figure 2.
In 2018, Luca Bruno [22] mentioned that a number of railway lines have been built along deserts, such as the British military railway in the 19th century over the Nubian Desert from Wadi Halfa to Abu Hamed; the French railway in 1887 from Mecheria to Ain Sefra across the Kenadsa desert in Algeria; the German railway line in 1906 from Aus to Luderitz over the Namib Desert; and the Hejaz railway from Damascus to Medina in 1900 through the arid Hejaz region of Saudi Arabia, as shown in Figure 3 [22].
In this case, windblown sand commonly induces effects on the railways, from construction delays to service suspension and train derailment. For example, the Riyadh–Damam railway line in Saudi Arabia recently suffered a service suspension in 2013, and a train derailment due to windblown sand [22]. Based on publications in English, Russian, French, Chinese, and Spanish, Mirakhmedovich et al. [23] performed an analytical assessment of strategies to limit the influence of winds and flow on a railway track. The study found that using fences and blown snow shields to protect infrastructure from sand drifts is only appropriate when combined with other measures in the context of establishing a forest belt.
In Saudi Arabia, there are some challenges that may affect the development of railway networks, including a harsh climate and varied terrain, the sustainability of infrastructure, and the transferring of construction materials, for example, the development of railway infrastructure across deserts with sandstorms, flash flooding, dry areas that experience high temperatures in summer. However, the sand dune accumulation on railway tracks is considered a major challenge that requires a complete knowledge of wind–sand flow behavior, as it significantly affects the safety of the railway sector and causes decreases in the speed of trains. In order to develop a safe, speedy, reliable, efficient, and sustainable railway system, different methods are examined in this paper for preventing railway tracks from the sand drift; each can be used according to different situations and types of dust storms. In this article, methods for minimizing the effects of sandstorms on the Saudi Arabian railway network are discussed. These methods include employing strong concrete walls, dykes, and ditches, while also taking into account the overall height of the barrier to pass the railway region.

3. Problem Definition

The Middle East and North Africa (MENA) region contains the majority of in-service desert railroads in the Near East. The referenced Dammam–Riyadh line in Saudi Arabia has just been shut down owing to a train disaster caused by windblown sand. The detailed mapping of in-service railway lines across sandy areas is now available for the Saudi railway networks: an overall length of 3650 km is exposed to windblown sand, with serious operating difficulties in the north–south line through the An-Nafud Desert. Two more main lines in the Arabic peninsula are now undergoing testing and commissioning. The length of the Riyadh–Dammam railway line is 449 km, operating partially through the Ad-Dahna Desert. Figure 4 depicts a map of the listed railways that are now in operation, under development, or projected for the future.
In the recent decade, there has been a rise in demand for windblown sand mitigation design, construction, and maintenance, which is likely to continue over the next 50 years. The expanding number of published research and filed patents in recent years reflects the increased interest in windblown sand reduction. Different international codes, such as E01F 7/02 and E04H 17/00, were used in these investigations to classify technology.
The development of rail networks in Saudi Arabia may face various difficulties due to the country’s severe climate and varied topography, as well as issues with infrastructure sustainability. However, the buildup of sand dunes on railroad tracks is regarded as a significant challenge that necessitates a thorough understanding of wind–sand flow behavior, since it greatly compromises train safety and slows down the speed of trains. The many techniques for protecting the railroad tracks from sand drift are examined in this paper in order to establish a safe, quick, reliable, efficient, and sustainable railway system; each may be employed according to the various circumstances and types of dust storms.

4. Methodology

This study followed the different steps shown in Figure 5, based on some information gathered in the beginning from standards and other sources.

4.1. Site Investigation

The accuracy of the downwind strip distance estimations obtained from site evaluations completed before 2018 to pick the wind barriers was influenced by two main factors: inadequate wind resource assessments and site investigations. The first reason was the lack of certified wind factors and coefficients curves. As a result, the KSA Standard Committee established a standard [25] that contained the SBC301 [25] standard with wind velocity as shown in Figure 6, and calculating technique. The second problem was that the current resource assessments were frequently unrealistic.
Saltation is characterized as the process that contributes the most to the overall transported sand bulk [26]. Because an ensemble of particles with lower diameters is defined as dust, only sand grains with a diameter in the range of 0.07–2 mm are considered. Dust has a variety of physical qualities that allow it to be transported across great distances in short- and long-term suspension procedures (e.g., Pye et al., [27]; Goudie [28]).
The shear stress caused by the wind across the sand bed causes the windblown sand saltation flux q (see Figure 7b). If the shear stress acting on the sand bed reaches a specific threshold, is proportional to the rate of change of a wind velocity uw in vertical direction (τ∝∂uw/∂z) and is commonly represented in terms of wind shear velocity u * = τ ρ . Sand grains become entrained in the lowest section of the atmospheric boundary layer, causing grain bouncing and saltation. The combination of the sand grain velocity us (z) and the sand density ρs (z) whose distribution follows a declining exponential function in vertical direction, defines the resultant sand flux q (z) kg m 2 s 1 .
In the following sections, windblown sand will be referred to as an environmental variable action, similar to heat or wind action (ENV, 1991-1-5, Ref. [29]) or fire action (EN, 1991-1-2, 2002 [30]). Entering windblown sand, analogous to incoming mean wind velocity in wind engineering practice, is defined as the quantity of sand carried by the incoming wind unimpeded by the infrastructure. The interaction of two physical subsystems, namely, the wind and the sand, results in a complicated process known as windblown sand transport. Sand is carried by multiple modes of motion depending on the grain diameter d, such as creeping (d > 0.5 mm), saltation (0.5 > d > 0.07 mm), and suspension (d < 0.07 mm) (Bagnold [31]; Shao [32]) (see Figure 7).

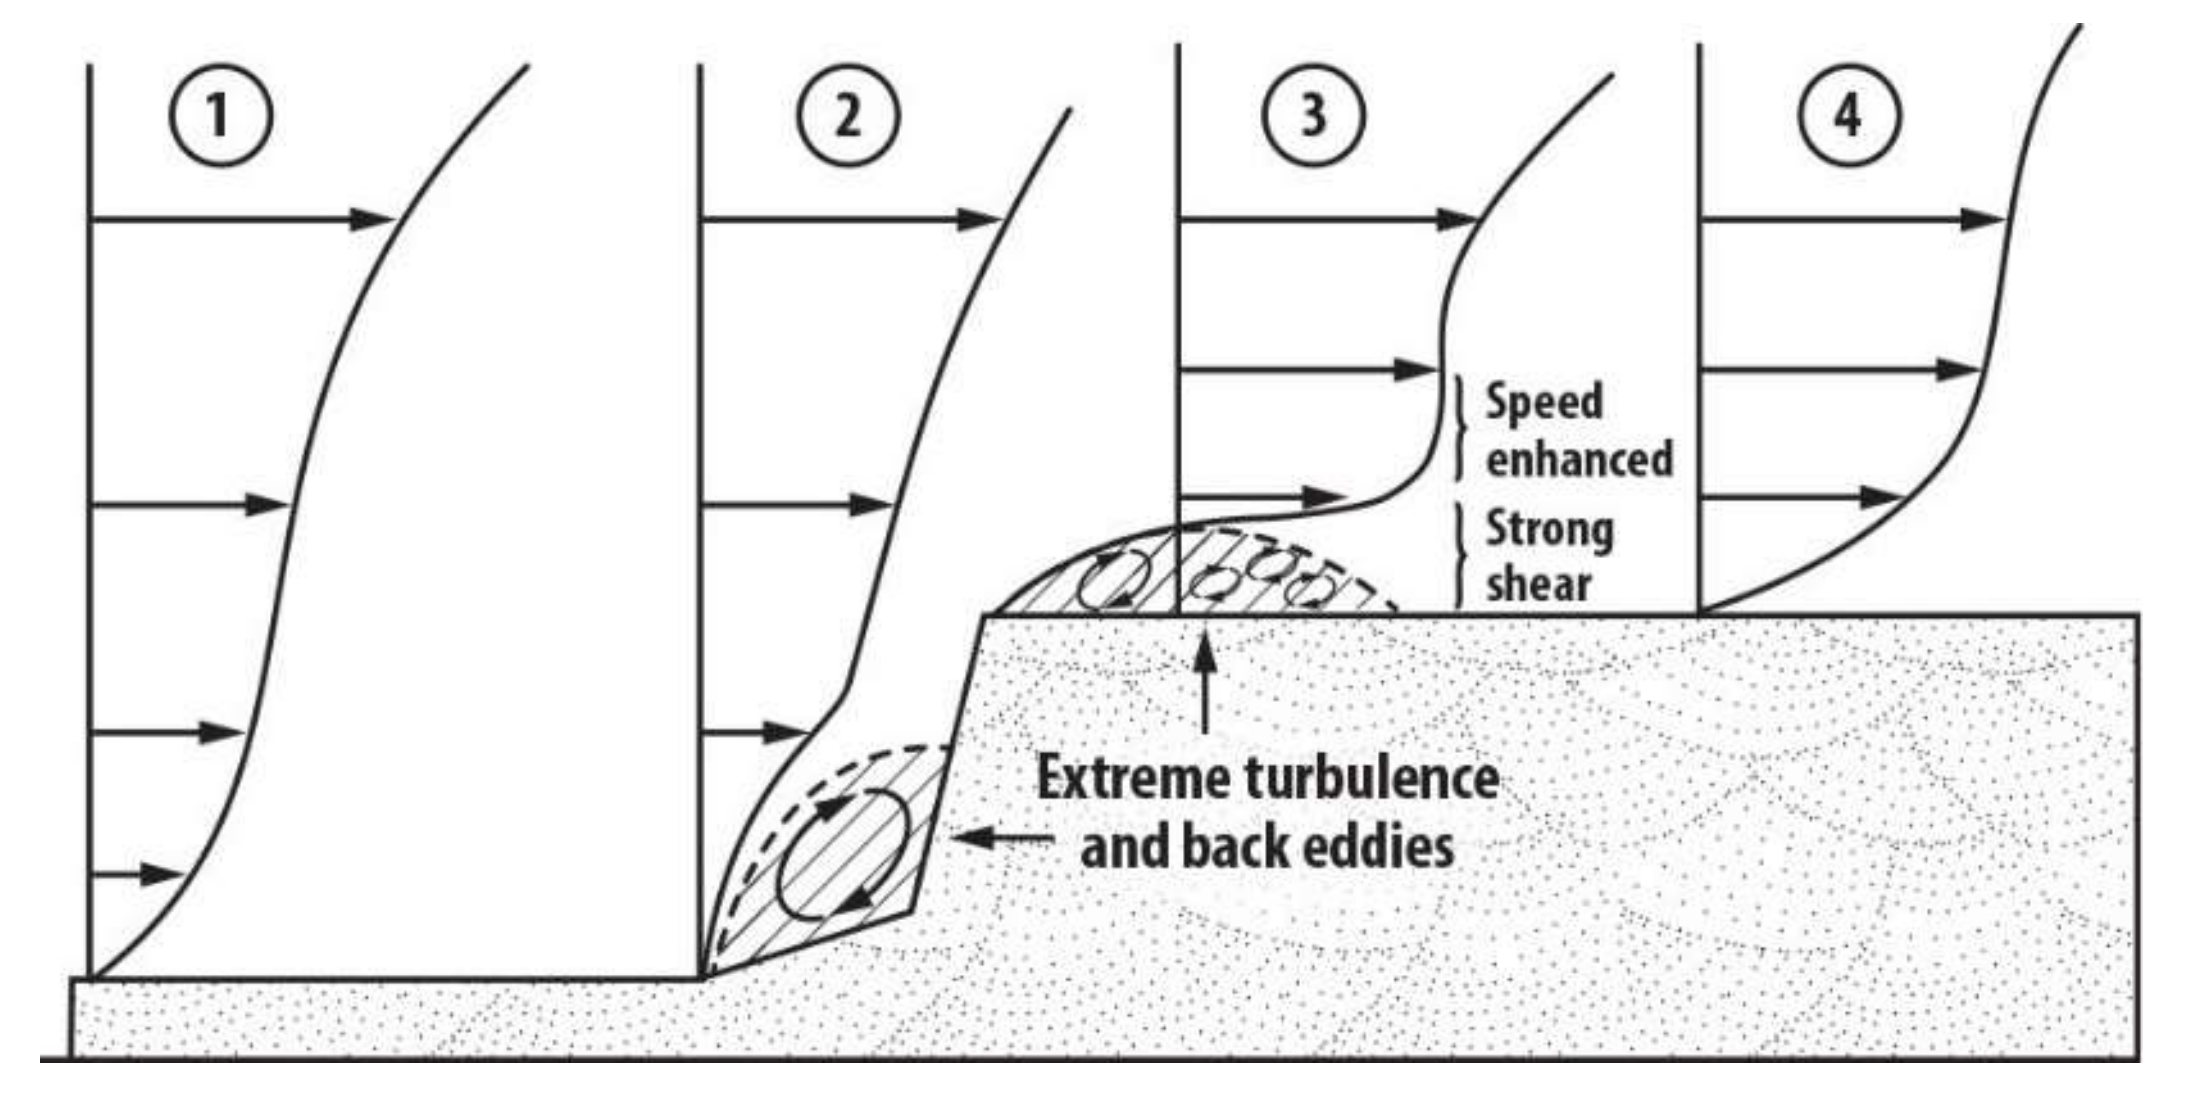
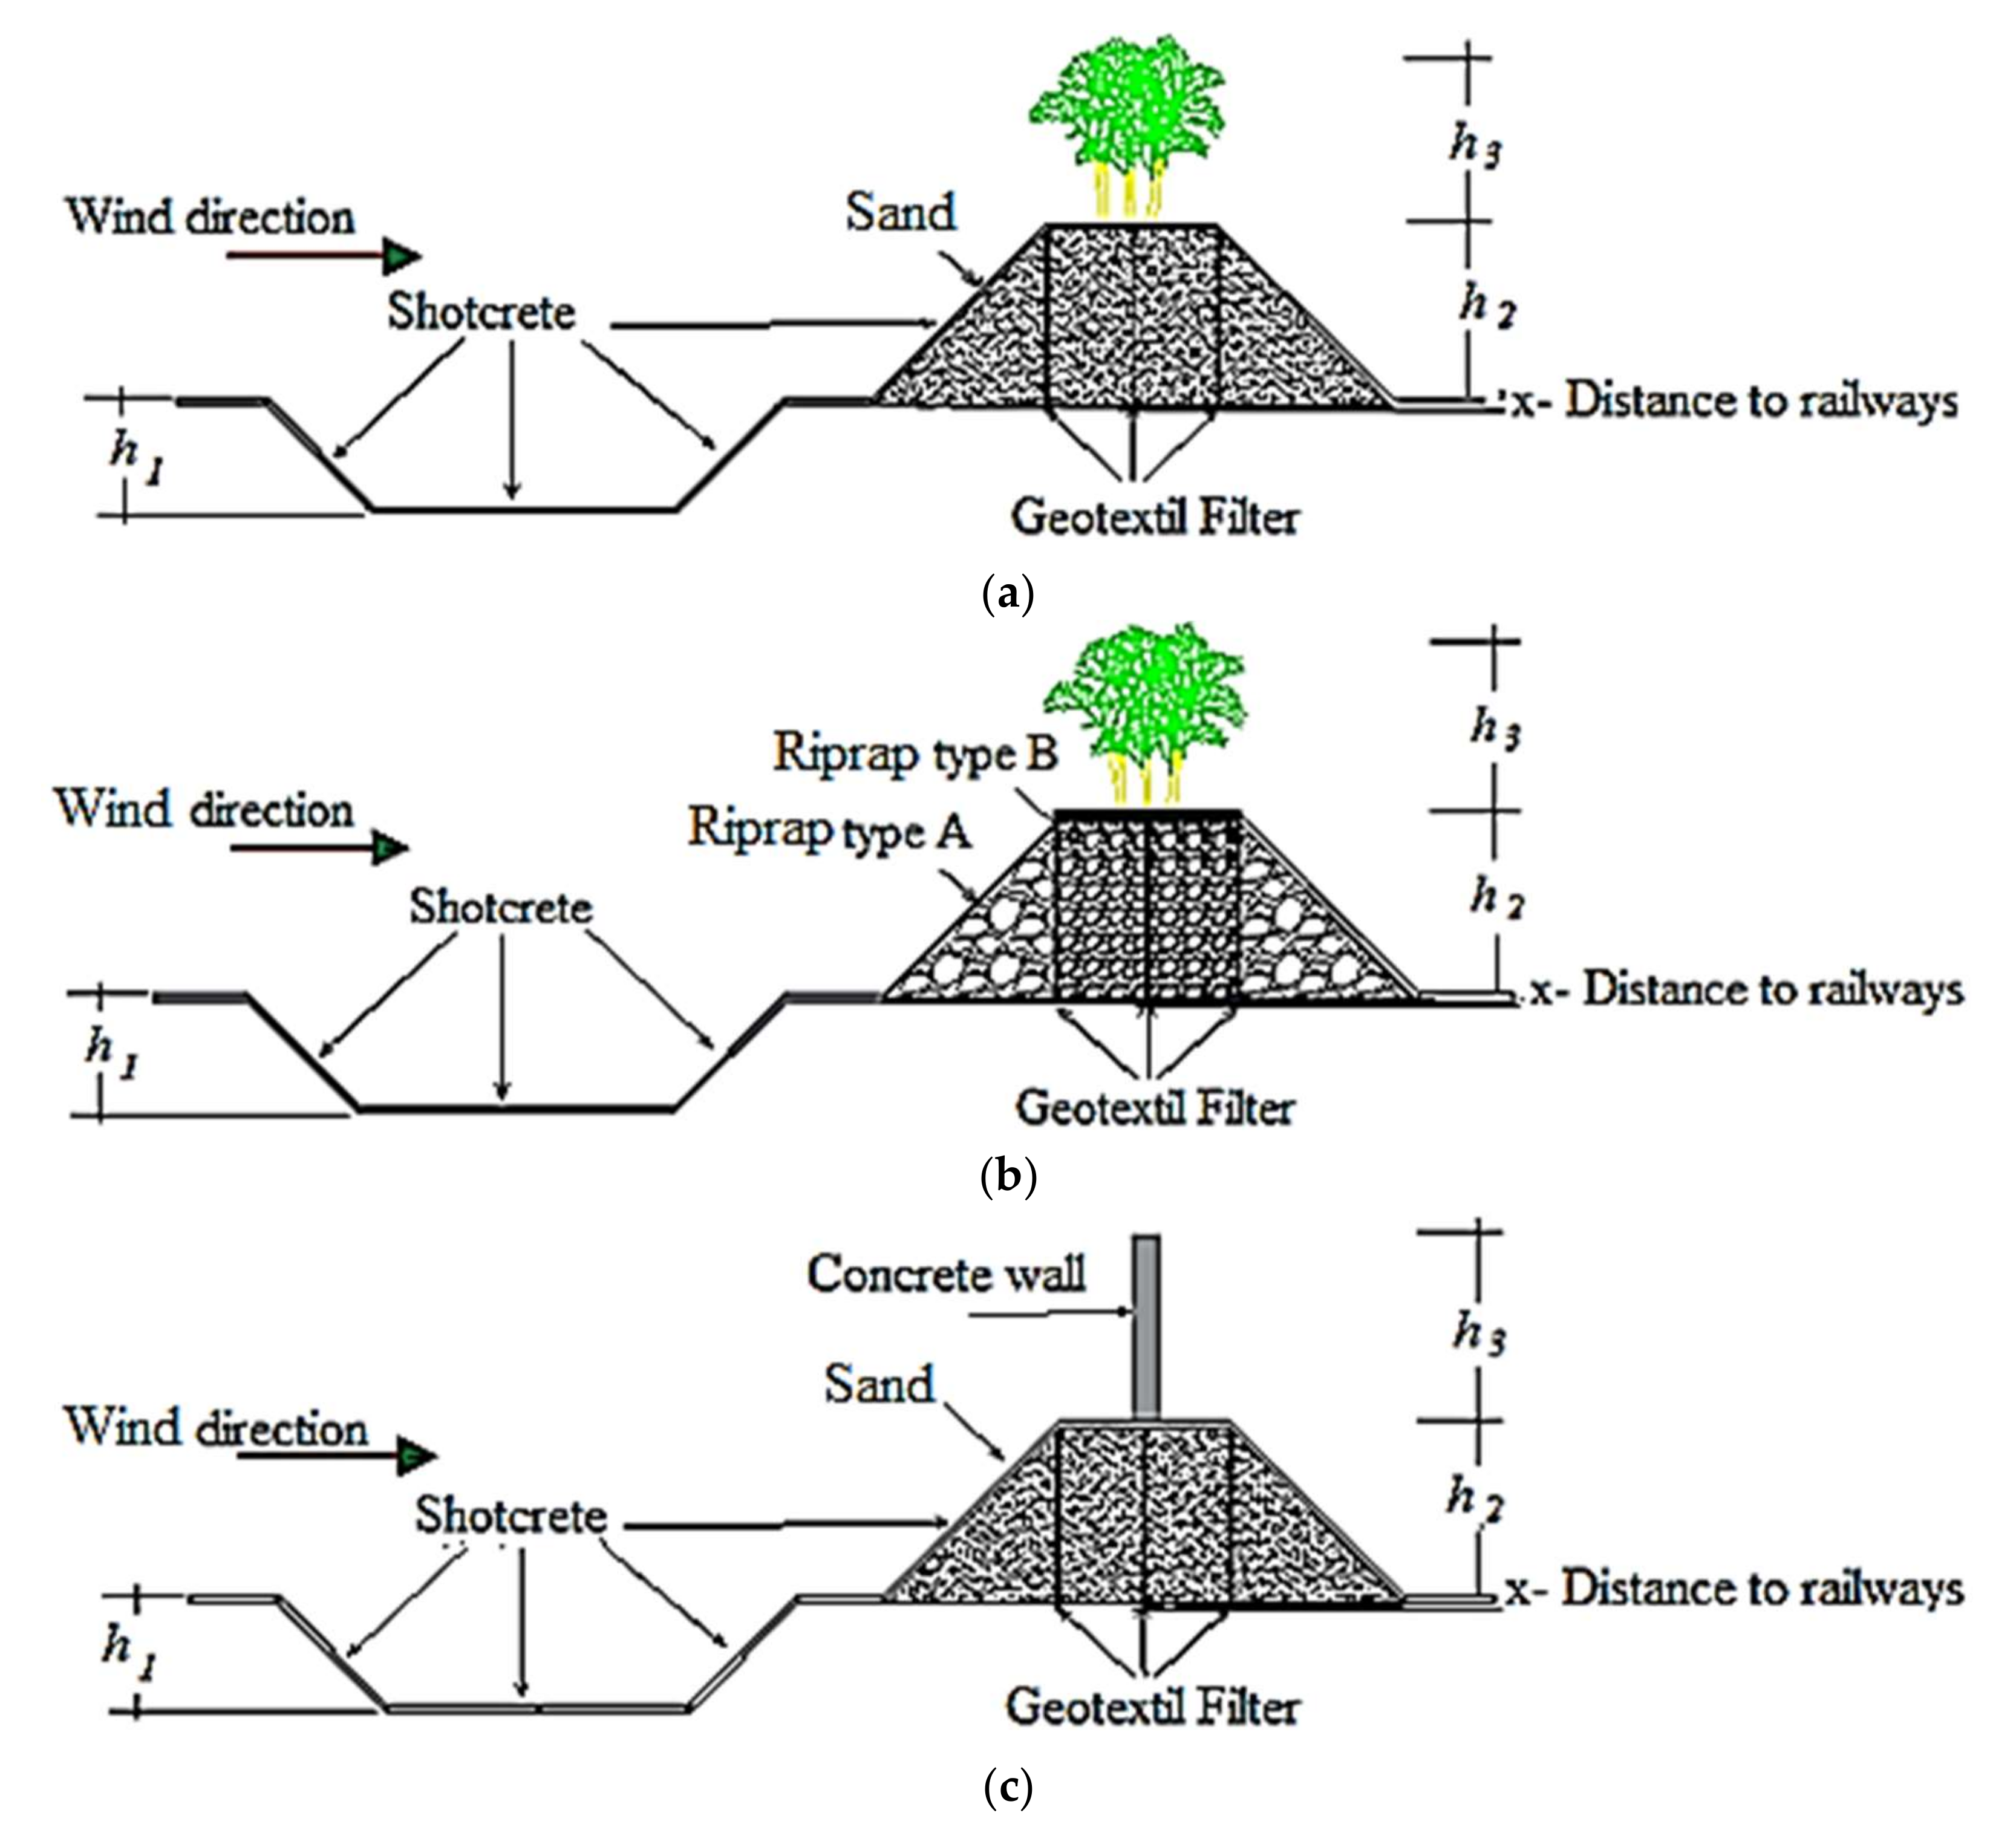
4.2. Principal of Proposed Solution

At various heights, friction has a significant impact on wind speed. For example, a 40 km/h wind recorded at 300 m above grassy terrain flows at 9 km/h, 3 m above the surface. It then gradually grows until it breaks free from the drag or friction of the earth. The change in wind speed from 50 m/s to 5 m/s is seen in Figure 4. Friction occurs when moving air comes into contact with the ground, and between air layers. Wind shear is the variation in wind speed at various heights above the ground caused by friction. A wind profile, as illustrated in Figure 8, depicts the variation in wind speed with height. Wind speeds are shown by horizontal arrows at different heights in the wind profile. Because of friction, winds move more slowly at ground level. As the height increases, the friction decreases, and the wind speed increases. When determining wind speeds for effective wind height, wind shear is an essential aspect to consider.
The wind speed in a grassy area and a woodland area is compared in these graphs. The effective ground level goes upward as the forest nearly eliminates ground level airflow. It is worth noting that the wind speed increases faster with height in a forest than it does in a grassy region, as turbulence is created. The turbulent zone, like eddies behind boulders in streams, includes a fluid (air) that swirls and tumbles in all directions. Figure 9 shows the difference in wind speed between a grassy region and a forest, which has a much rougher surface. The wind speed in a grassy area and woodland is compared in these graphs. As can be seen, ground-level winds are almost eliminated by the forest. The effective ground level moves upward as a result. It is worth noting that the wind speed increases with height in a forest more quickly than it does in a grassy region. Ground drag has a significant impact on wind speed near the ground’s surface, where structures are located. According to the previous study conducted by [33], the effects of friction decrease with height above the earth’s surface, and winds are significantly stronger than near the ground; this suggests that the winds flow more slowly at ground level owing to friction. As the height increases, the friction decreases, and the wind speed increases.
Rough terrain and ground cover increase friction, turbulence, and can even raise the effective ground level (called “displacement height”). The grove of trees causes the wind profile to be shifted higher from ground level, as seen in Figure 6. Because the wind is almost nonexistent below that height, it is referred to as the “level of effective zero wind”. Displacement height (d) is described as a percentage of canopy height that varies based on vegetation or forest density, and is commonly estimated to be 67% for dense deciduous forests and 75% for thick evergreen forests.
Surface roughness from ground cover can reach up to 500 m above ground, with the top two meters having the most influence, which can have a considerable impact on railway safety. Turbulence is the second significant natural phenomenon. When air traveling across the earth’s surface collides with things such as trees or buildings, turbulence is created. They disrupt the wind’s clean laminar flow, causing it to tumble and whirl, as shown in Figure 10. Wind speed varies rapidly behind massive obstructions, and winds may even flow in the opposite direction of the wind.
Bluffs and cliffs (Figure 11) are high landforms that cause turbulence, including back eddies, when the wind sweeps up and over them. As a result, it is essential to position the barriers to avoid the turbulence caused by the landform’s wind influence. Before constructing the wind barrier near the railway’s marginal region, the site assessor must first grasp the qualitative nature of these terrain impacts and conduct more extensive modeling or site testing. Turbulence is a term used to describe a highly disordered wind flow.

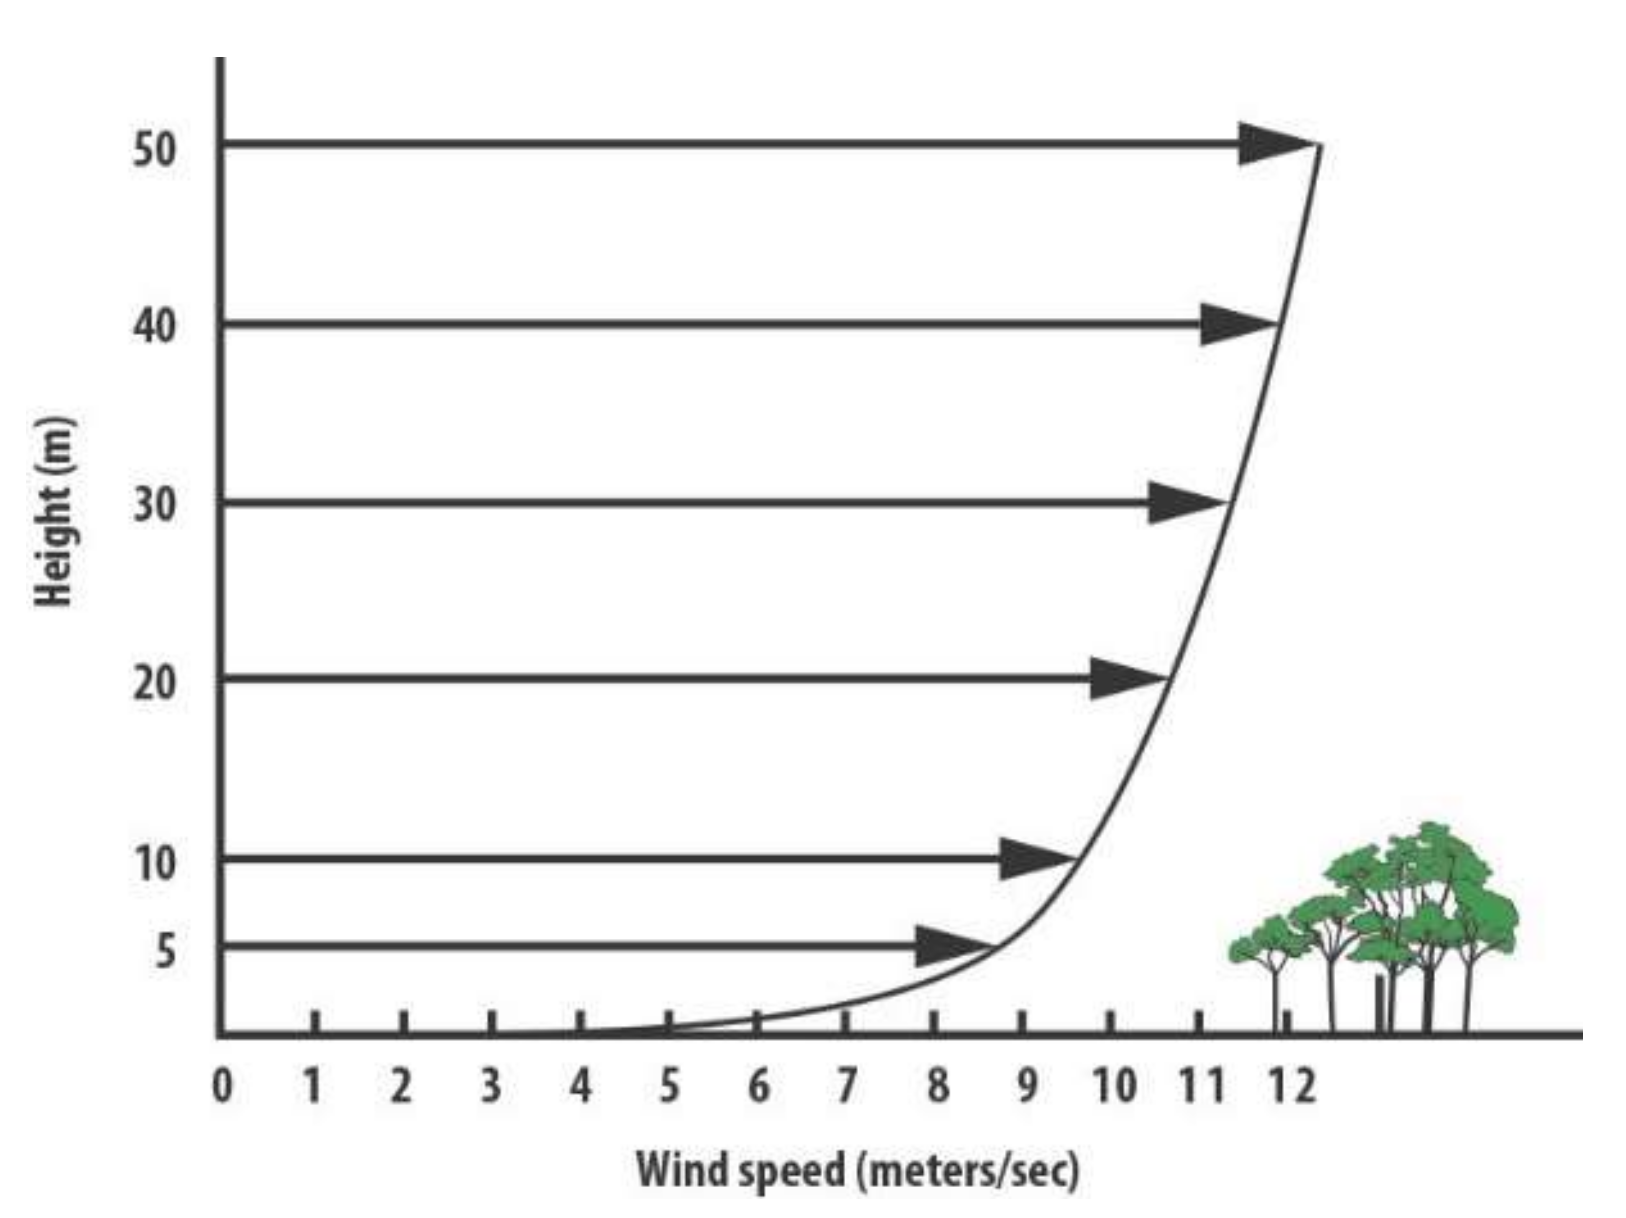
4.3. Calculating Wind Shear Effect on Wind Speed

To describe the recorded wind shear profile, analysts often employ the wind speed law (i.e., power law equation).
Wind speed law
The power law equation is:
V = Vref × (h/href) α
  • V = wind speed at height of interest,
  • Vref = wind speed measured at height href; (e.g., barrier height),
  • h = height of interest,
  • href = height of measured data (e.g., barrier height),
  • α = wind shear exponent.
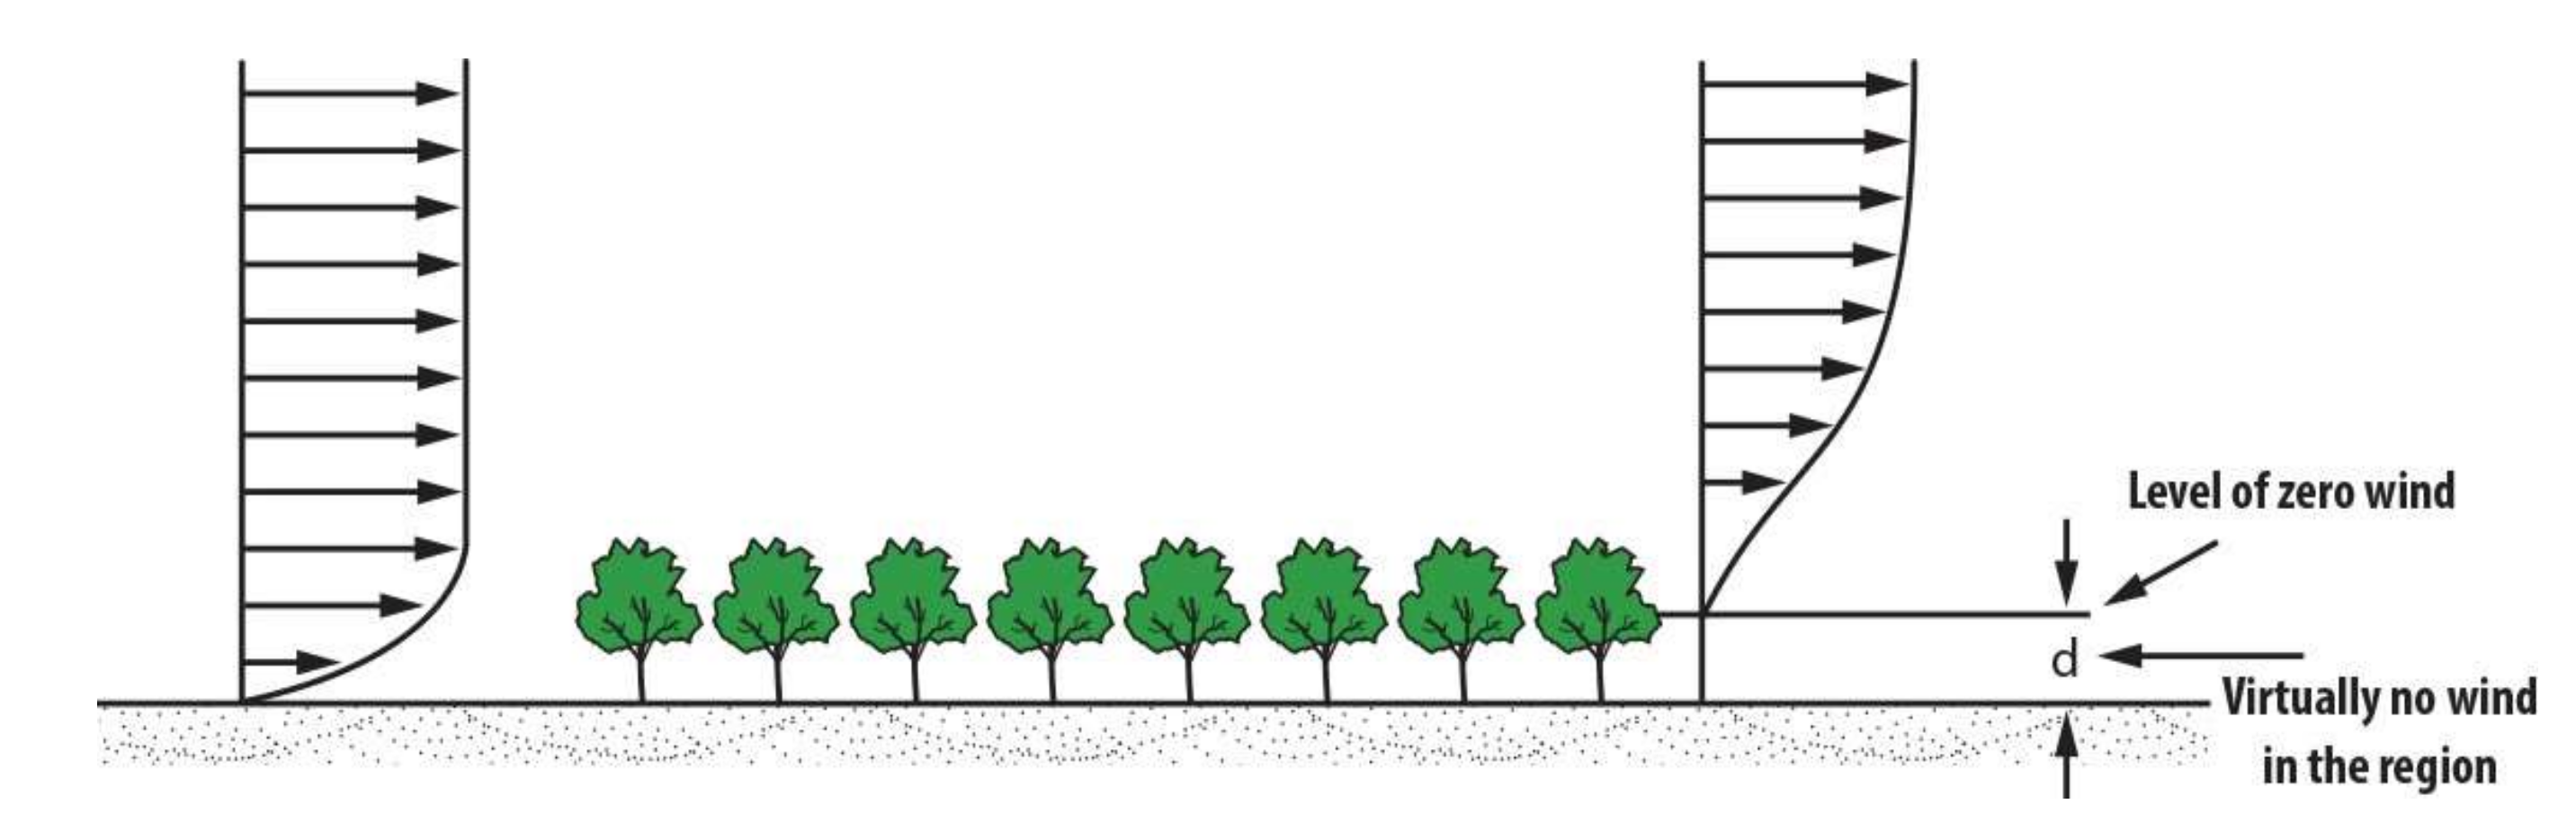
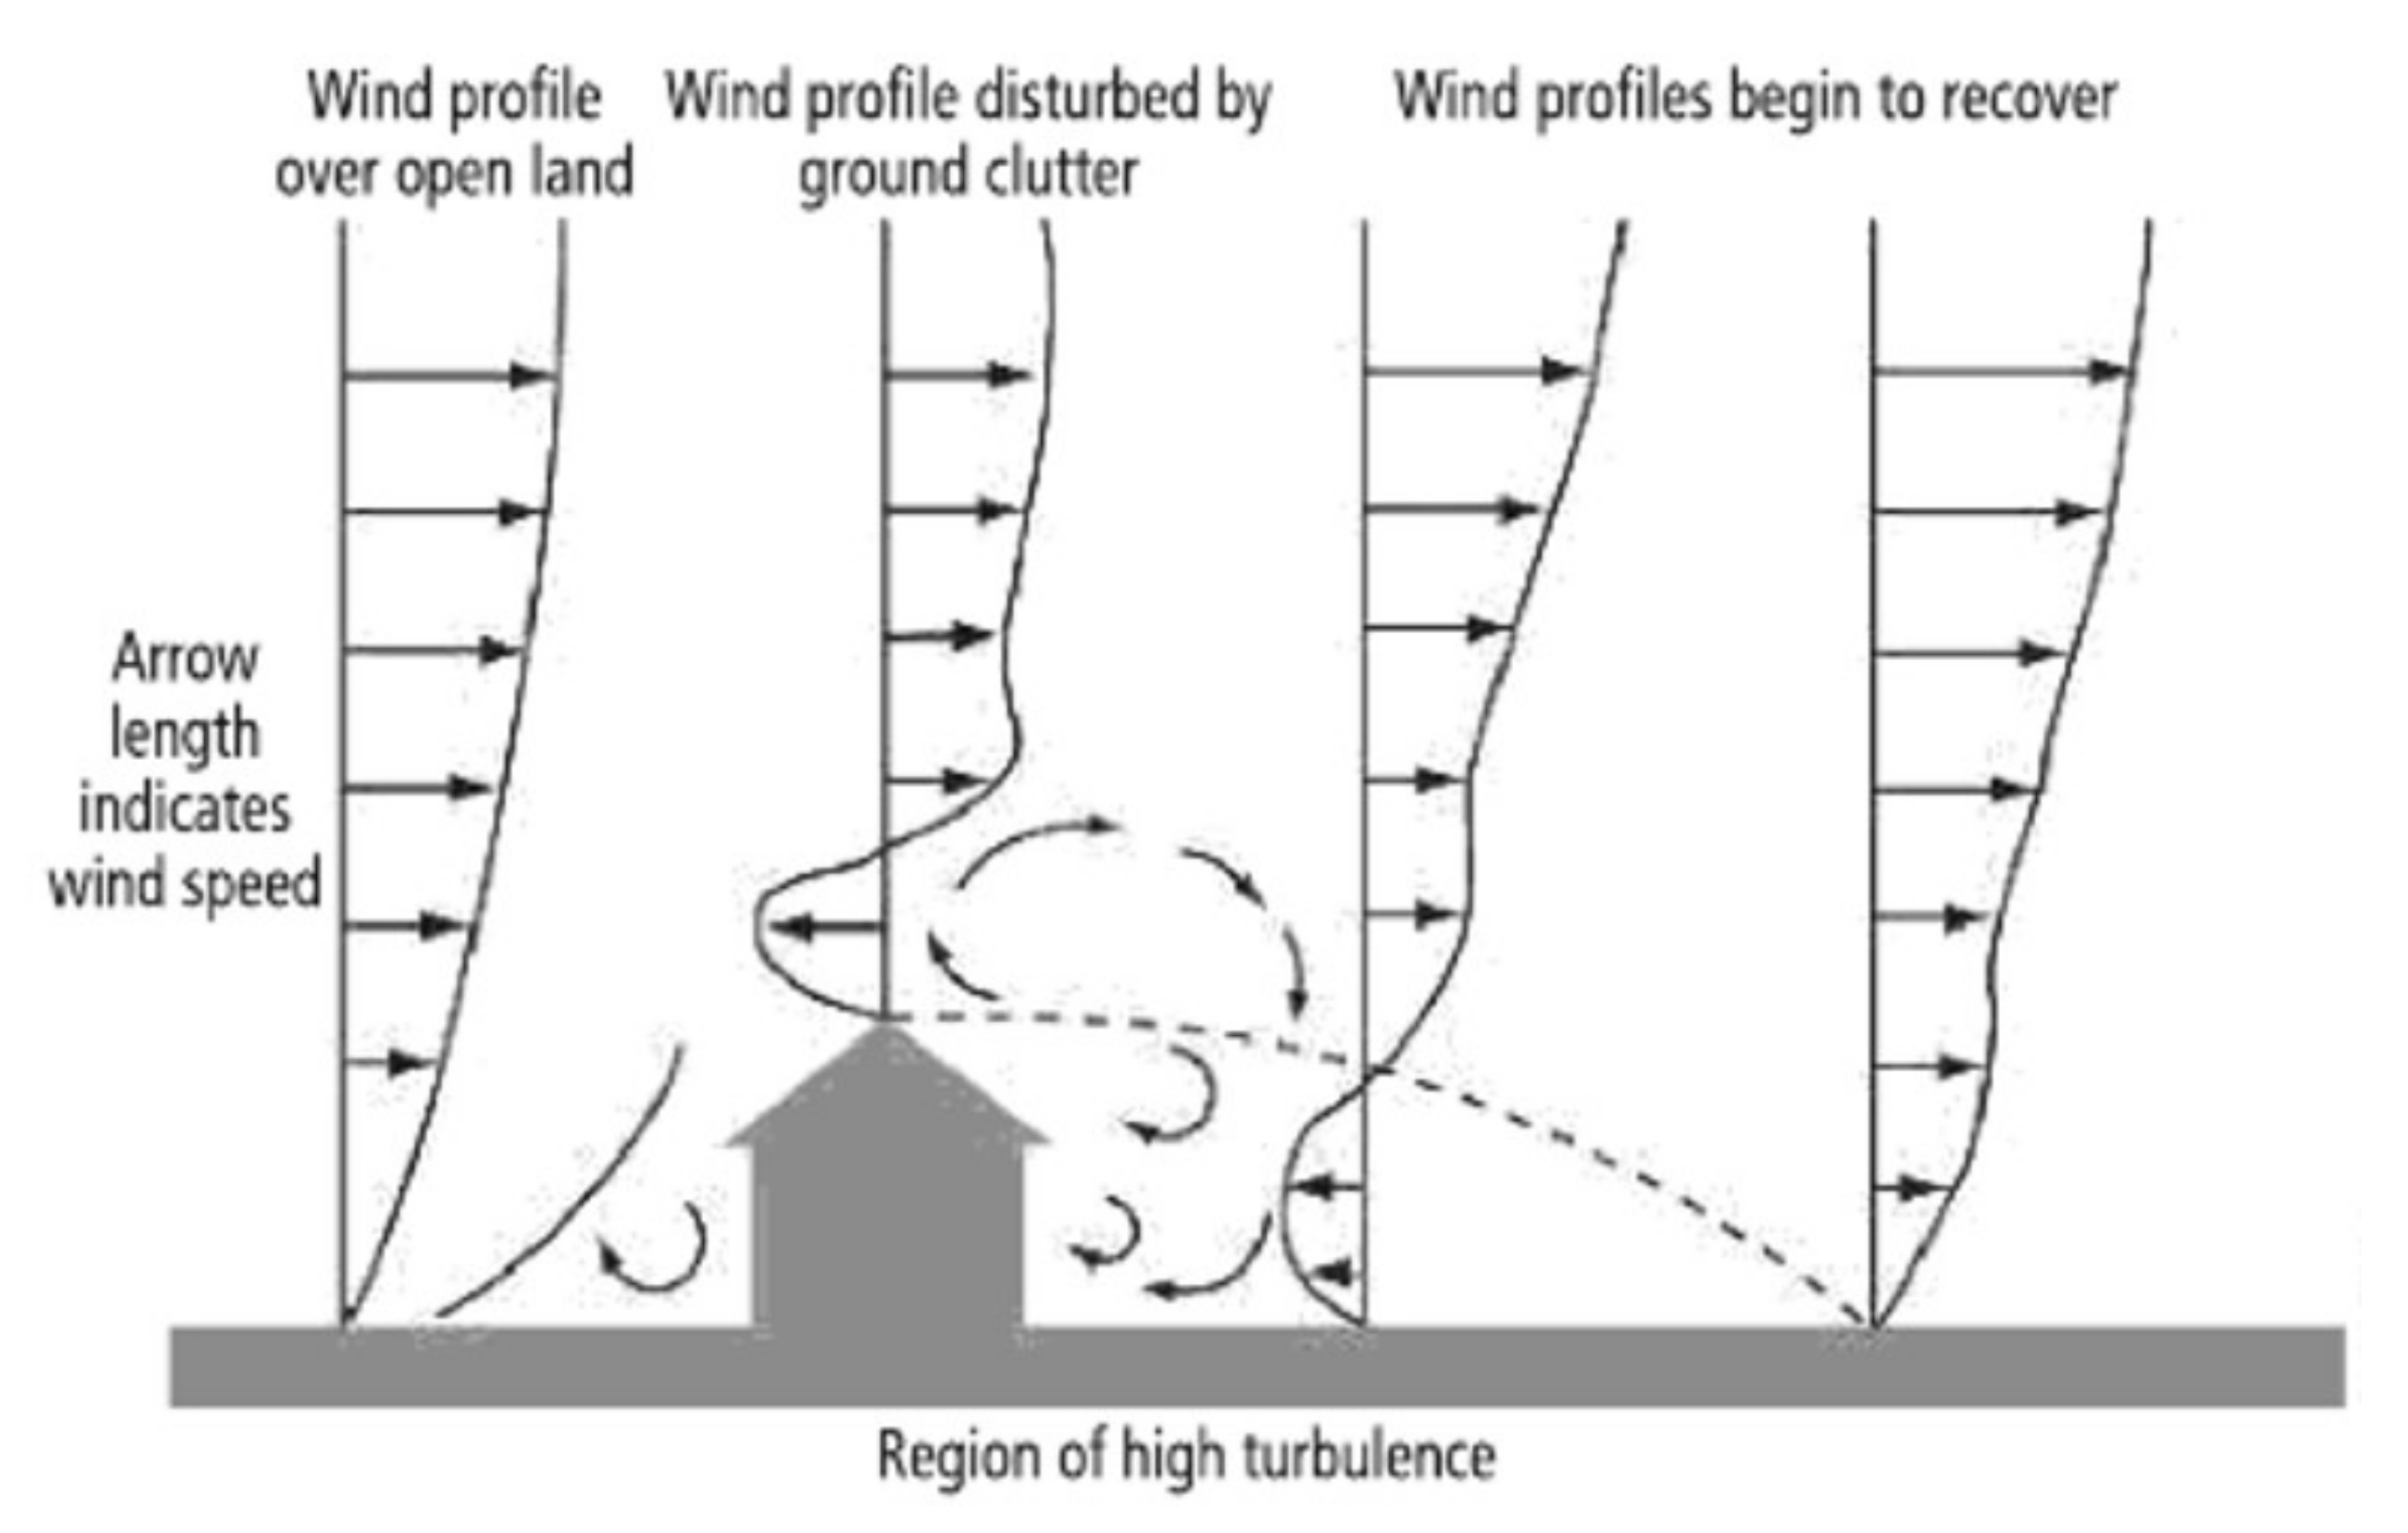
The wind shear exponent, α, describes how wind speed varies with altitude. The wind shear factor may be estimated using the power law equation when wind speed data are available at several heights.
To estimate the wind speed at additional heights of interest, the wind shear exponents from different heights with known wind speeds are employed (e.g., construction barrier height). Wind shear exponents can range from 0.2 to 0.5 depending on the topography and surface roughness aspects.
Many studies have been conducted to calculate the wind shear exponent using various degrees of surface roughness. As a consequence, based on the surrounding land cover, the site assessor should be able to calculate a suitable wind shear exponent.

5. Windbreaks

5.1. General

The primary goal of windbreaks is to limit the wind speed. Windbreaks are structures that change the direction of the wind, and have the ability to block a significant amount of wind and force it to stop the wind in front of it. The main purpose of using the windbreaks is not only keep the wind out, but also to keep the project’s building costs low. In this study, the windbreaks will be used to keep the wind out of the railway area; for this purpose, they are beneficial in a variety of ways. As a result, the windbreak type, smart positioning, and total height are the most essential factors affecting the outcome results.

5.2. Windbreak Benefits

Windbreaks made out of trees and shrubs are useful conservation tools that serve a variety of purposes. The following are some of their advantages:
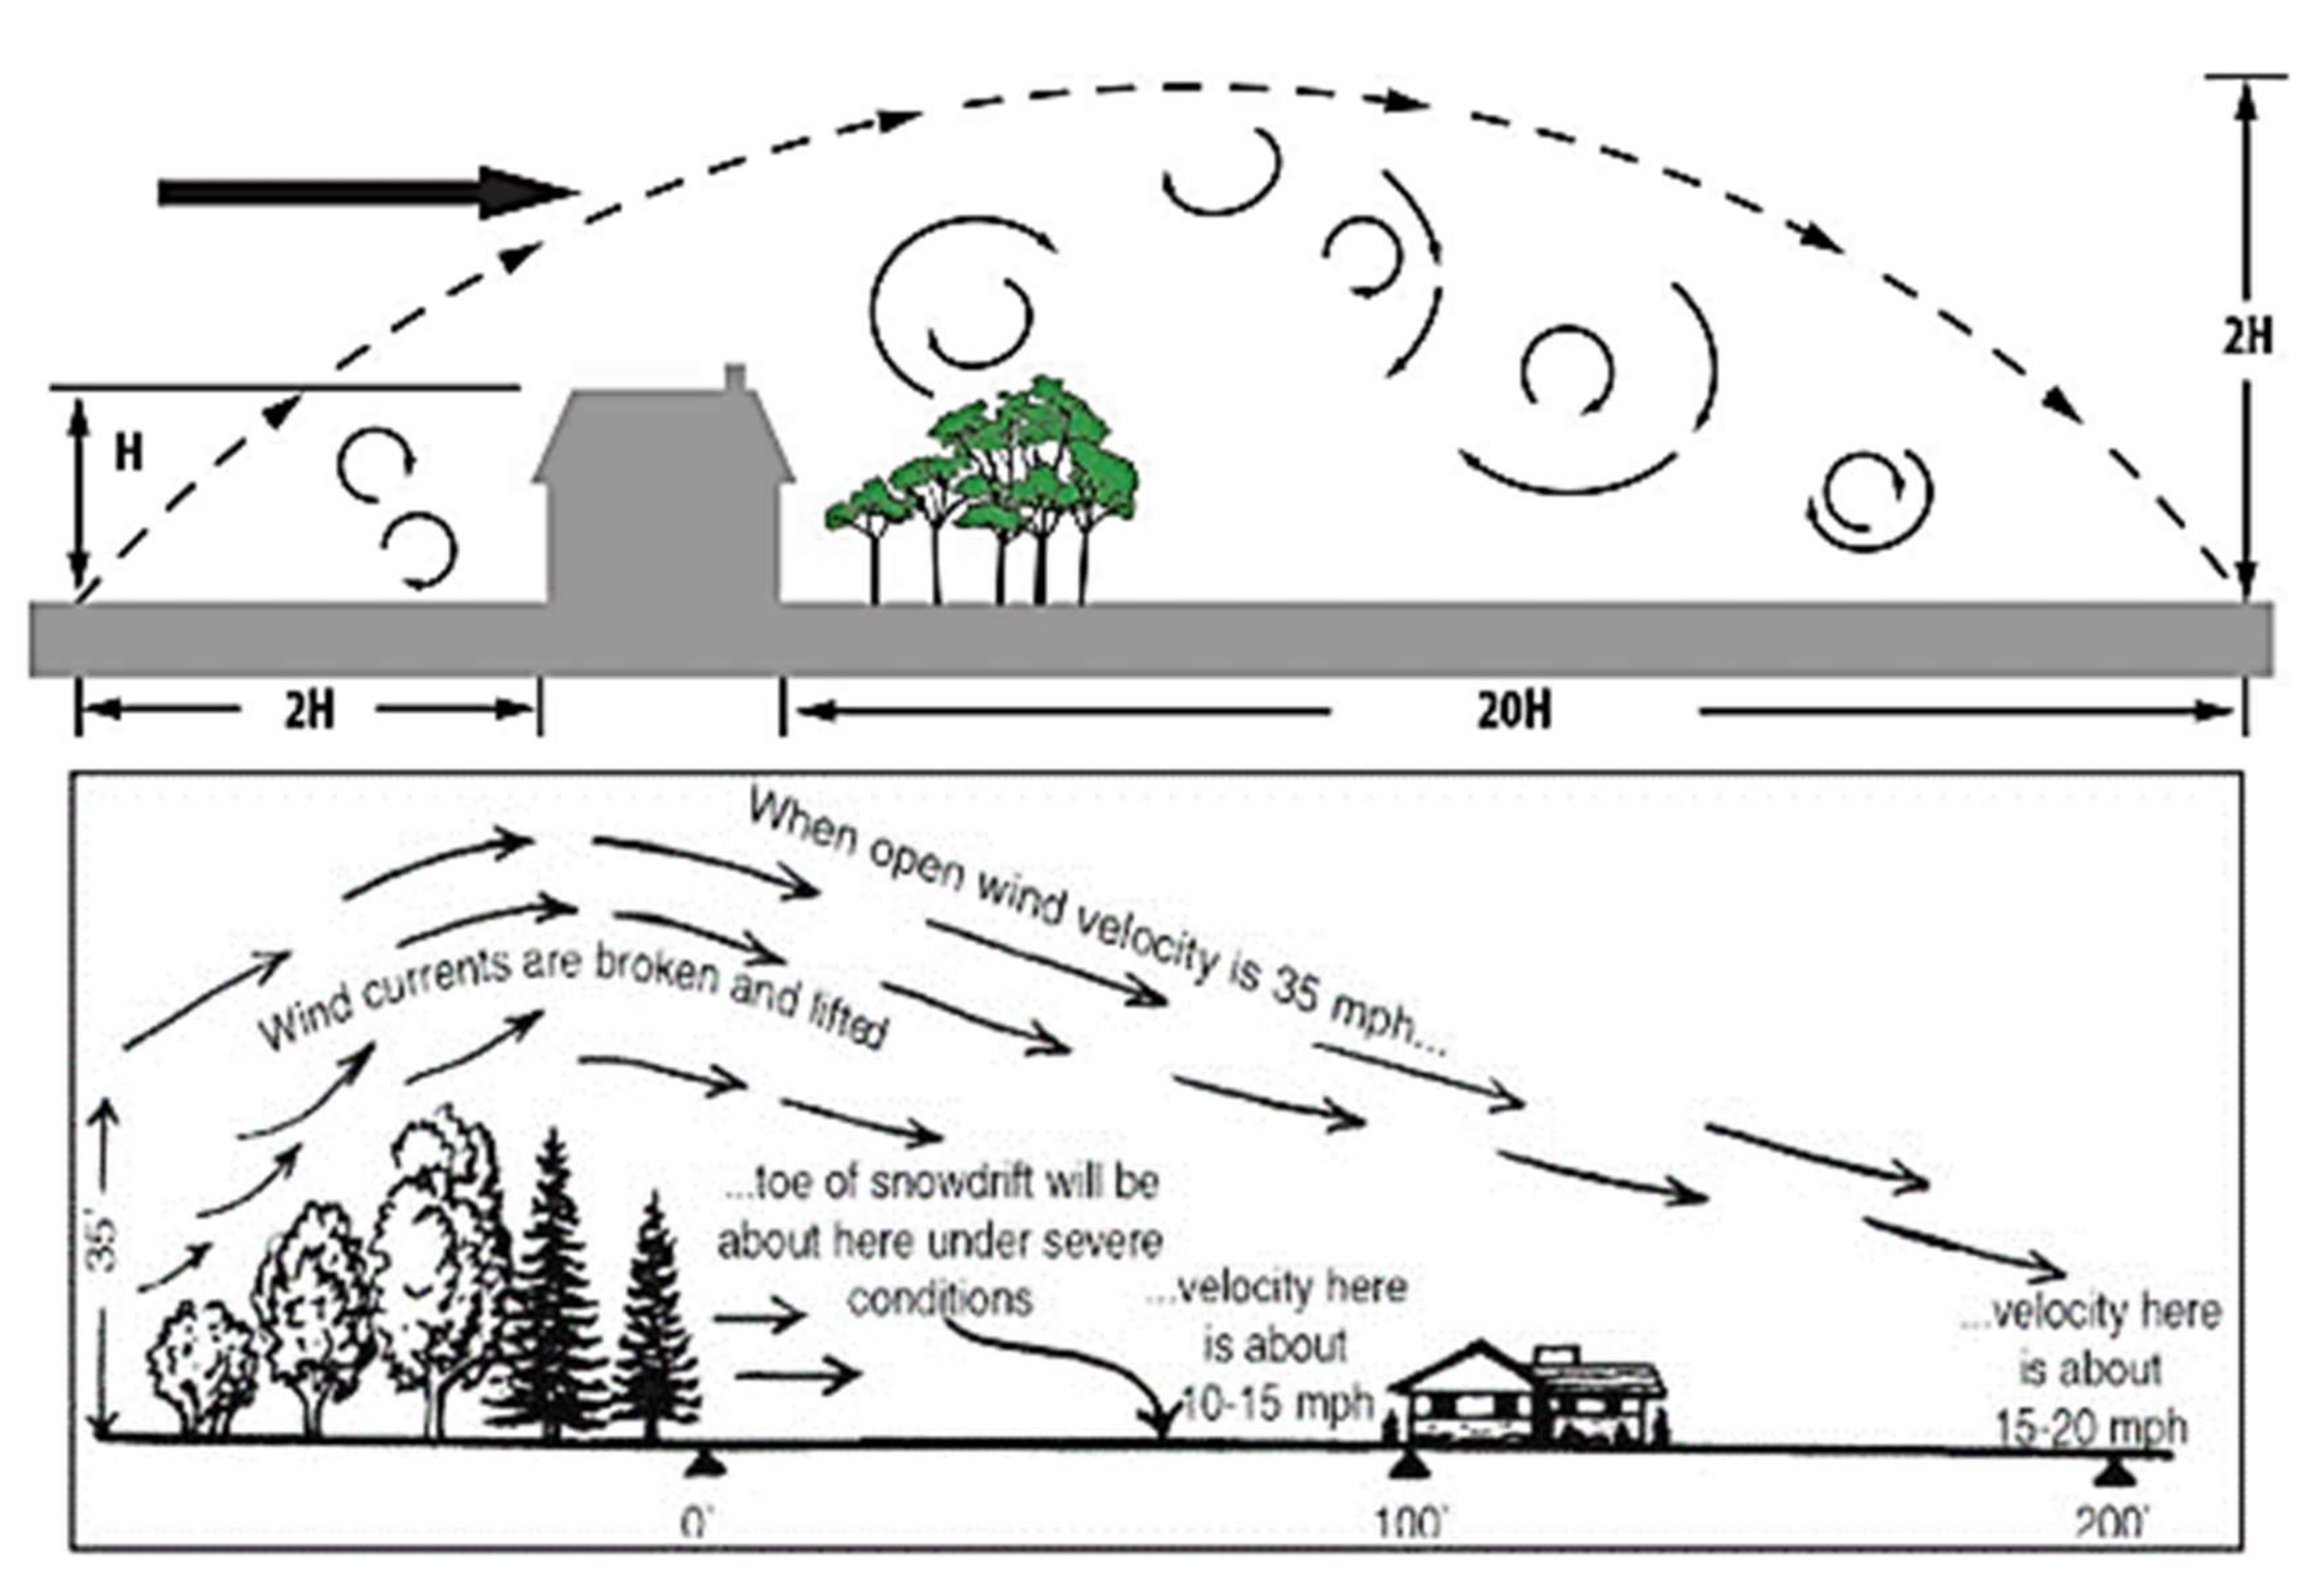
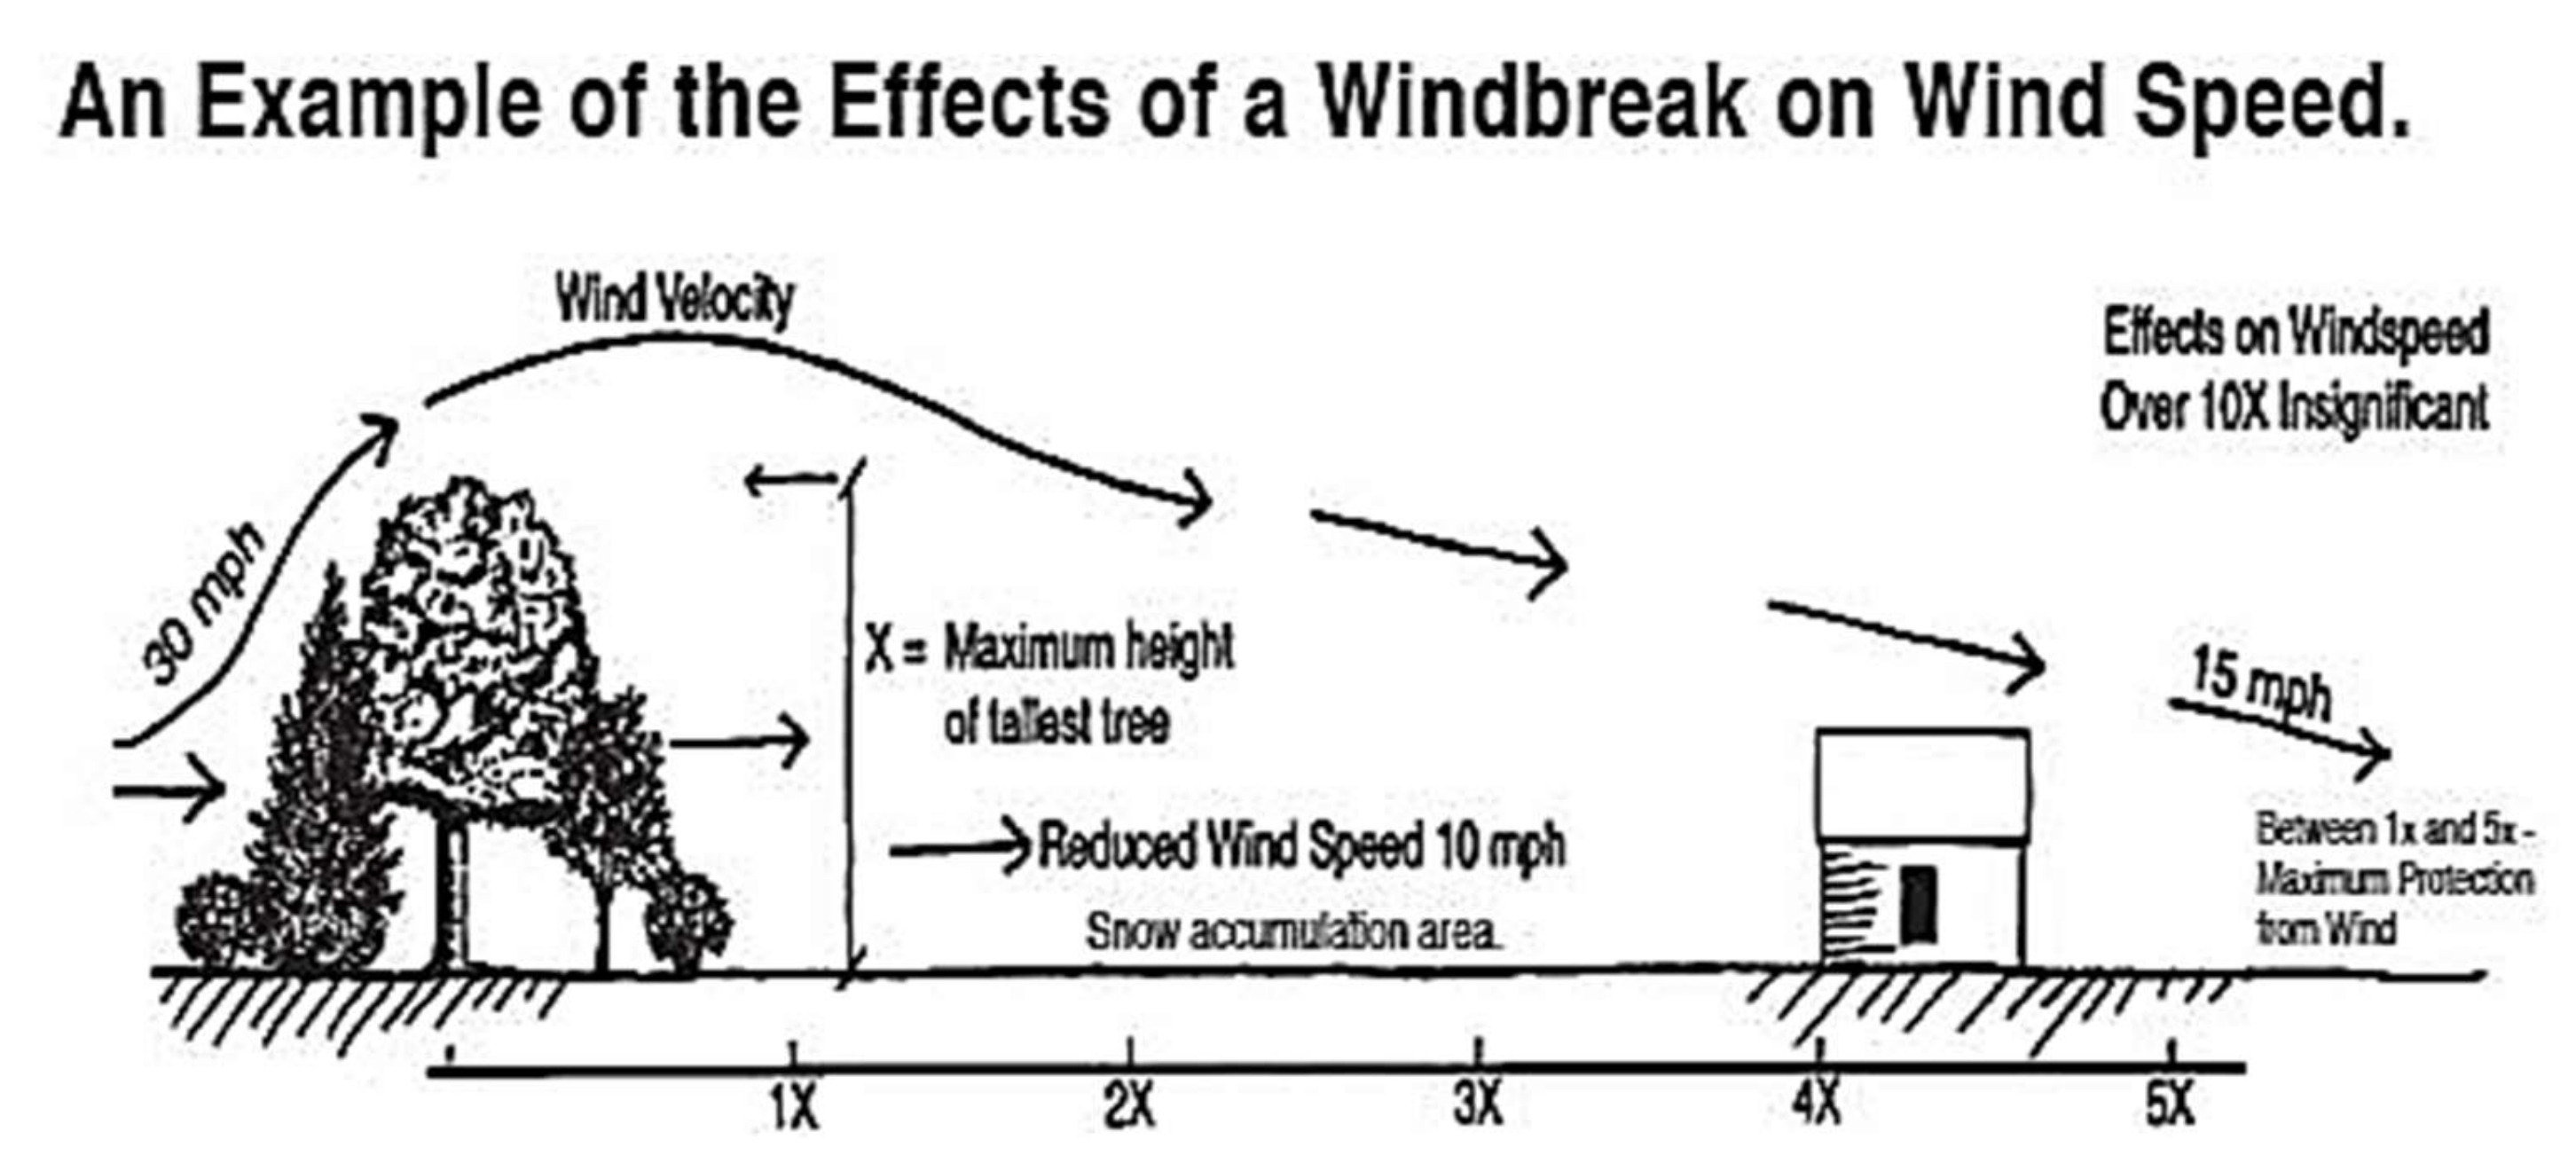
  • Reduced soil erosion—Windbreaks deflect wind 10 to 20 times their height downwind, preventing erosion. They also remove dirt particles that have been blasted into the air by the wind.
  • Crop protection—Windbreaks can boost crop yields by as much as 44%. Wind protection decreases agricultural water use, improves a plant’s capacity to produce food, and may improve pollination. Reduced sand and soil abrasion can improve the quality of fruit and other high-value crops.
  • Appearance—Trees offer visual screening and permanency in the railway area’s landscape.

5.3. Creating Windbreaks

Windbreaks require planning to ensure that they are advantageous to certain places. The primary objective of the windbreak should be considered first. The spacing between roads and rail lines are some of the important elements to consider.

5.4. Windbreak Design

The type of windbreak used is determined by the goals. A reasonably continuous row of trees and/or plants positioned to offer wind protection or other advantages is a basic condition of any windbreak (we will not cover fences or windbreaks of non-woody plants here, but the principles are similar). Height, density, direction, and length are the most significant parameters in windbreak design for wind protection. For complete protection, large regions must have a windbreak every 10 to 20 Hs, as indicated in Figure 12. Figure 12 makes it evident that the current situation is solely utilized to protect residential areas and agricultural fields. As an original recommendation for our work, it is proposed in this research that it be changed to increase the height and be employed in railways.
Height—A using of conservative wind shear is extrapolated to estimate the wind resource at turbine hub height, which is based on the state wind maps related to site assessors. In this case, the wind speed can be adjusted for the height difference between the turbine height and the map, as the building integration is discouraged in the wind industry by most experts due to insufficient wind resource at the height of building.
Density—Except for full fences or walls, all windbreaks allow some wind to get through. Windbreaks with a higher percentage of solid to open space block more wind, although density is not necessarily a desirable thing. Low pressure on the downwind side pulls the wind back down as it is diverted up and over a windbreak. In thick windbreaks, the low pressure is stronger, pulling the wind down fast and lowering the sheltered area size. Allowing some wind to get through lowers the low pressure and expands the protected region. The number of tree rows, branch and leaf density (controlled by tree species), and tree spacing within rows all influence density. Windbreak density is the ratio of a windbreak’s solid section to its whole area, and it is difficult to quantify. A windbreak with zero density has the largest apertures and allows the most wind to pass through, whereas a windbreak with 100% density allows no wind to get through (both situations are impossible). A 50% thick windbreak should theoretically allow around half of the wind to pass through. Windbreaks with a density of 60% to 80% provide excellent protection across a limited area, such as a farmhouse or residential lot. A windbreak with a density of 40% to 60% may protect a vast area, such as a crop field. Windbreak concentrations of less than 20% give minimal protection from the wind. As seen in Figure 13, very dense windbreaks induce a deep, but narrow drift to be deposited near the windbreak, generally within 3 H to 5 H.

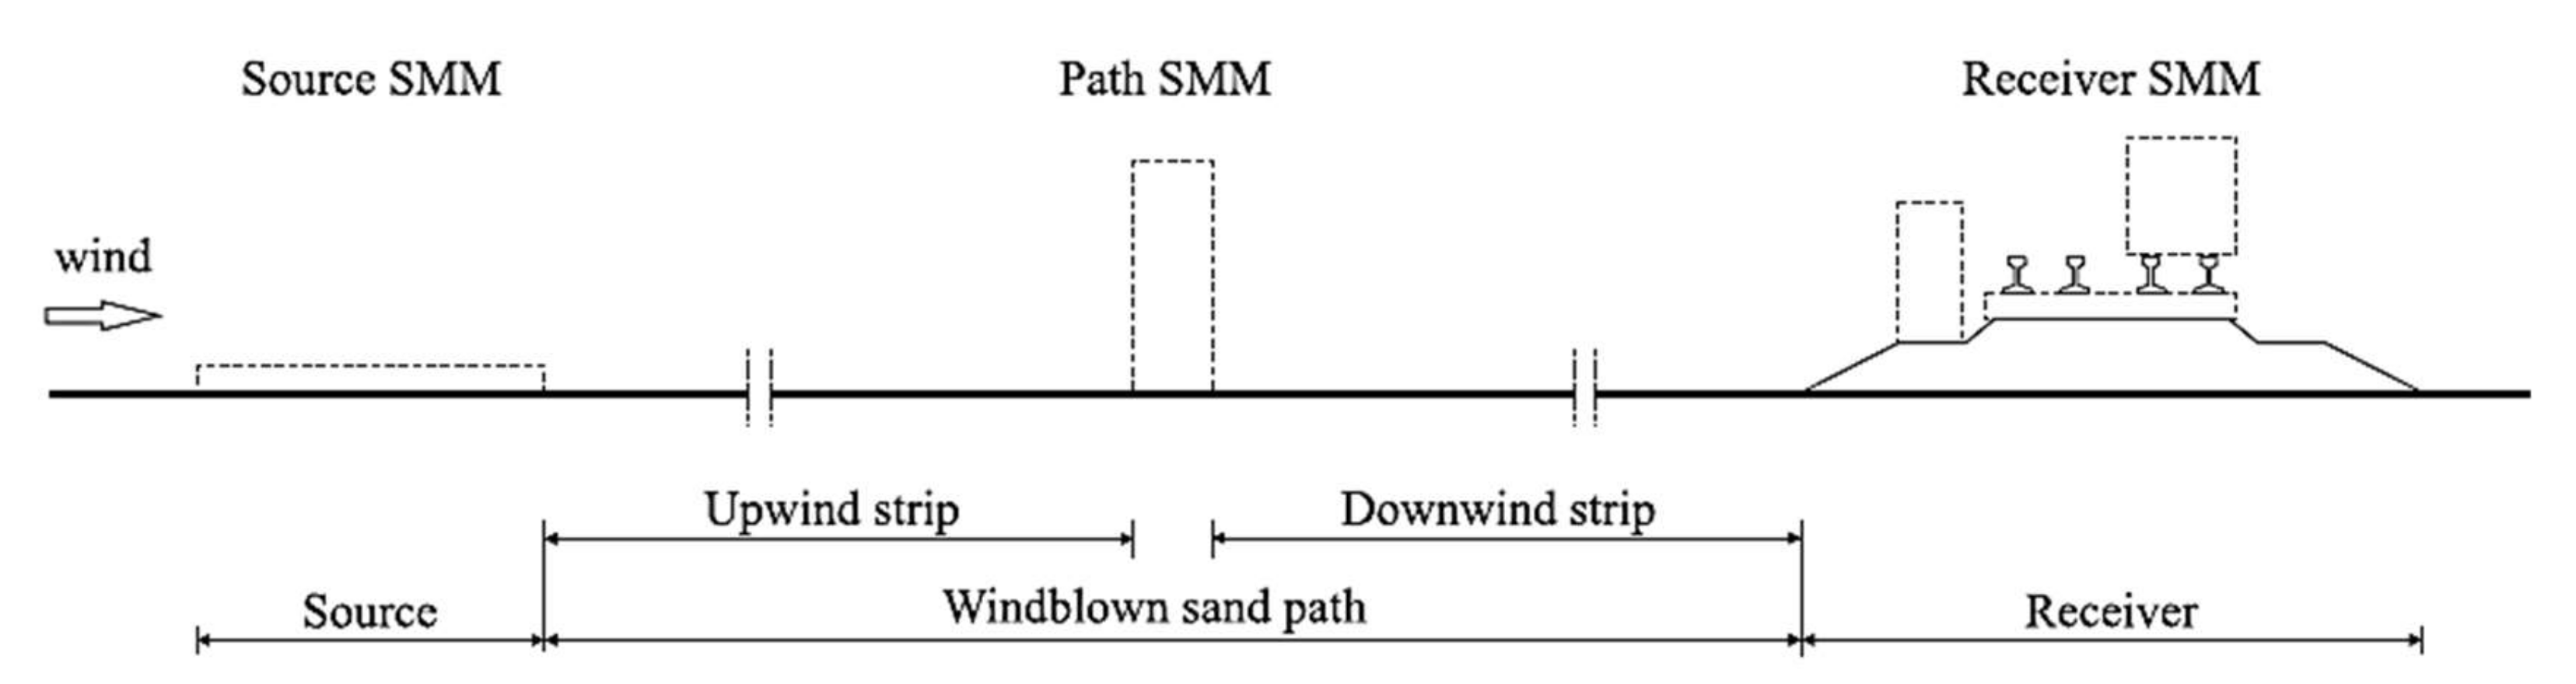
6. Proposed Method to Path Sandstorms over Railways

Path sand mitigation measures (SMMs) are designed to promote sand sedimentation by restricting windblown sand movement and, in turn, driving the local wind flow, reducing the longitudinal component of the wind’s velocity and/or promoting wind flow recirculation. In particular, a sand-transfer barrier was proposed for the accumulation-free transfer of sand over the road, and then the idea modified using the mechanical method to install surfaces such as solid barriers, porous fences, and other devices such as dykes, ditches, and ridges. Researchers further classify path SMMs into two subcategories based on geometric criteria, due to the large number and variety of measures suggested in the literature:
  • Solid barriers and porous fences are examples of above-ground surface-like SMMs (Figure 14a,b).
  • Ditches, dykes, and ridges are examples of volume-like SMMs (Figure 14c,d).
It is important to note that such a classification is also in line with the sedimentation process they cause. Surface-like SMMs encourage sand deposition along upwind and/or downwind strips (see Figure 15), whereas volume-like SMMs enable sand to settle over and/or inside them.
The proposed path SMMs may be constructed in two major configurations, as illustrated in Figure 16, regardless of their shape. Both configurations tend to maintain a 90° angle of attack between the prevailing wind direction and the SMM longitudinal axis.
In this article, two sets of solutions can be suggested based on the types of wind barriers presented in the previous sections and the predicted distance of the downwind strip for each type. The groups are separated by the upper barrier, with the first using trees and the second using solid concrete walls. Each group has two types of dykes, the first of which is porous (i.e., riprap type A followed by riprap type B) and the second of which is solid (i.e., sand cofferdam covered by shotcrete), as well as a ditch to be built before each dyke. Based on the analysis completed on the construction site, the designer may select the appropriate type of windbreak and path SMM. The wind velocity, SMM source, and downwind strip distance to the railway region are all important factors to consider when selecting a windbreak type.
The first type of windbreak over the dyke is trees. The windbreaks should be made out of trees that can be grown easily in the region. This kind may be utilized in a rainy area and it is simple to locate the water the plants need to thrive. The chosen trees must be able to withstand the summer and should have a solid track record of adapting to the site and soils. A variety of tree and shrub species should be selected to ensure that the windbreak will still be effective even if one fails repeatedly. It is recommended to blend deciduous and coniferous plants, and the plant selection should be based on the desired use. Whenever feasible, it is recommended to choose native plants.
The windbreak’s height will increase as the trees become taller, protecting a bigger area. The ultimate height should be taken into account. If quicker results are desired, higher, faster-growing trees may be required. The height should be taken into account when defining the length of the rows. Given that taller trees and longer windbreaks protect a greater area, taller trees and longer windbreaks are preferable. Afterwards, the spacing between the actual rows should be considered. The protected minimum length to be effective in the downwind strip can be calculated by multiplying the estimated height by three. This may be changed to fit the demands of the region. Another important issue is density, as the density of a windbreak can actually impact its efficacy. The spacing of trees in a shelterbelt can also affect its efficiency. Between tree rows and between individual trees, spacing is a consideration. On the windward side of windbreaks with a dense population of trees, a buildup of air can occur. Then, on the leeward side, a low-pressure region forms. The wind is then pushed over the tree line by the buildup from the windward side, while the leeward side of low pressure pulls the air downward.
A concrete wall with the ability to have varying alignments over its length utilizing different construction angles is another way to achieve better shelter from a windbreak. A bigger protected area can be created by connecting numerous one-directional, straight windbreaks at an angle. As a result, the protection downwind is reduced, and turbulence is created. A ditch constructed in the upwind strip can be used as a temporary shelter for the sand that gathers in the upwind strip from the turbulence.
Based on the velocity Equation (1), a theoretical investigation of the effect and maximum downwind strip that different heights of barriers may accomplish can be conducted. The wind velocity employed in this analysis is 52 m/s, which is the figure suggested by SBC301 [24]. The estimates of the wind velocity over a one-meter-high barrier are shown in Table 1. Figure 17 also displays a comparison of the findings based on different wind shear exponent values, which can vary from 0.2 to 0.5.
The proportion of the velocity increase is mostly determined by the wind shear exponent value, as seen in this graph. As a result, Equation (2) is proposed to estimate the percentage of increase in wind velocity (Vinc%) based on two components, Q1 and n. The values of Q1 and n as a function of the wind shear exponent are predicted using Equations (3) and (4).
V i n c   % = Q 1 b h n
where:
Q 1 = 93.617 α 1.0706
n = 0.025 α 2 + 0.0945 α + 0.919
Based on the predicted velocity and barrier height, the designer may choose the optimum technique to prevent the harmful consequences of a sandstorm on the railway zone. With respect to the impact of sandstorms on the railway network, the different solutions provided by the protective barriers will help improve the safety and reliability performance of the railway system. In this case, Table 2 summarizes some of the recommendations for the respective stakeholders, such as the Saudi Arabian Railway (SAR), the Ministry of Transport (MoT), and the Saudi Arabian Public Transport Authority (PTA).

7. Conclusions

Sand dune accumulation on railway tracks is considered a major challenge that requires a complete knowledge of wind–sand flow behavior, as it significantly affects the safety of the railway sector and leads to reduced train speeds. In order to develop a safe, speedy, reliable, efficient, and sustainable railway system, different methods were examined in this paper for preventing railway tracks from the effects of sand drift; each can be used based on the site conditions and dust storms. In this paper, SMMs were implemented to promote sand sedimentation by restricting windblown sand movement and, in turn, driving the local wind flow. The longitudinal component of the wind’s velocity can be reduced and wind flow recirculation promoted using solid barriers and porous fences combined with ditches and dykes. From this study, and based on the previous studies conducted by others, the following conclusions can be drawn:
  • In railway areas, windbreaks can deflect the wind 10 to 20 times their height downwind, and therefore are applicable for use; moreover, windbreaks can induce a deep, but narrow drift to be deposited near the windbreak, generally three to five times the windbreak height.
  • The wind speed at the height of interest (e.g., barrier height) should be calculated using wind shear exponents ranging from 0.2 to 0.5 depending on the topography and surface roughness aspects.
  • A new equation based on two parameters, Q 1 and n, as a function of the wind shear exponent is suggested to predict the percentage of wind velocity increase ( V i n c   % ).
Future study will be carried out to explore an alternate approach that uses recycled materials in addition to the resources that are already accessible in each region of Saudi Arabia.

Author Contributions

Conceptualization, H.A., A.E. and M.A.; Methodology, H.A. and A.E.; Project administration, A.E.; Resources, H.A. All authors have read and agreed to the published version of the manuscript.

Funding

This study was funded by Taif University, Researchers Support Project Number (TURSP2020/196) Taif University, Taif, Saudi Arabia.

Institutional Review Board Statement

Not applicable.

Informed Consent Statement

Not applicable.

Data Availability Statement

Not applicable.

Acknowledgments

Authors would like to thank Taif University, Researchers Support Project Number (TURSP-2020/196) Taif University, Taif, Saudi Arabia.

Conflicts of Interest

The authors declare no conflict of interest.

References

  1. MEED Insight. MENA Rail and Metro Projects Report 2014. Available online: https://www.meed.com/mena-rail-and-metro-projects-report-2014/ (accessed on 26 February 2014).
  2. Labban, A. Dust Storms over Saudi Arabia: Temporal and Spatial Characteristics, Climatology and Synoptic Case Studies. Ph.D. Dissertation, RMIT University, Melbourne, Australia, 2015. [Google Scholar]
  3. Varoujan, S.; Al-Ansari, N.; Knutsson, S. Sand and dust storm events in Iraq. Nat. Sci. 2013, 5, 1084–1094. [Google Scholar]
  4. Alaamer, A. Measurement of natural radioactivity in sand samples collected from Ad-Dahna Desert in Saudi Arabia. World J. Nucl. Sci. Technol. 2012, 2, 187–191. [Google Scholar] [CrossRef]
  5. Middleton, N. Dust storms in the Middle East. J. Arid. Environ. 1986, 10, 83–96. [Google Scholar] [CrossRef]
  6. Furman, H. Dust storms in the Middle East: Sources of origin and their temporal characteristics. Indoor Built Environ. 2003, 12, 419–426. [Google Scholar] [CrossRef]
  7. Ackerman, S.; Cox, S. Surface weather observations of atmospheric dust over the southwest summer monsoon region. Meteorol. Atmos. Phys. 1989, 41, 19–34. [Google Scholar] [CrossRef]
  8. Alharbi, H. Airborne Dust in Saudi Arabia: Source Areas, Entrainment, Simulation and Composition. Ph.D. Dissertation, Monash University, Melbourne, Australia, 2008. [Google Scholar]
  9. Mohalfi, S.; Bedi, H.; Krishnamurti, T.; Cocke, S. Impact of shortwave radiative effects of dust aerosols on the summer season heat low over Saudi Arabia. Mon. Weather Rev. 1998, 126, 3153–3168. [Google Scholar] [CrossRef]
  10. Draxler, R.; Dale AGillette, J.; Kirkpatrick, S.; Jack, H. Estimating PM10 air concentrations from dust storms in Iraq, Kuwait and Saudi Arabia. Atmos. Environ. 2001, 35, 4315–4330. [Google Scholar] [CrossRef]
  11. Barnum, H.; Nathaniel SWinstead, J.; Wesely, A.; Hakola, R.; Colarco, B.; Toon, P.; Brooks, G.; Hasselbarth, L.; Toth, B. Forecasting dust storms using the CARMA-dust model and MM5 weather data. Environ. Model. Softw. 2004, 19, 129–140. [Google Scholar] [CrossRef]
  12. Maghrabi, A.; Alharbi, B.; Tapper, N. Impact of the March 2009 dust event in Saudi Arabia on aerosol optical properties, meteorological parameters, sky temperature and emissivity. Atmos. Environ. 2011, 45, 2164–2173. [Google Scholar] [CrossRef]
  13. Notaro, M.; Alkolibi, F.; Fadda, E.; Fawzieh, B. Trajectory analysis of Saudi Arabian dust storms. J. Geophys. Res. Atmos. 2013, 118, 6028–6043. [Google Scholar] [CrossRef]
  14. Yu, Y.; Notaro, M.; Liu, Z.; Kalashnikova, O.; Alkolibi, F.; Fadda, E.; Bakhrjy, F. Assessing temporal and spatial variations in atmospheric dust over Saudi Arabia through satellite, radiometric, and station data. J. Geophys. Res. Atmos. 2013, 118, 13–253. [Google Scholar] [CrossRef]
  15. Awad, A.; Mashat, A. The synoptic patterns associated with spring widespread dusty days in central and eastern Saudi Arabia. Atmosphere 2014, 5, 889–913. [Google Scholar] [CrossRef] [Green Version]
  16. Shalaby, A.; Rappenglueck, B.; Eltahir, E. The climatology of dust aerosol over the arabian peninsula. Atmos. Chem. Phys. Discuss. 2015, 15, 1523–1571. [Google Scholar] [CrossRef] [Green Version]
  17. Amanollahi, J.; Kaboodvandpour, S.; Qhavami, S.; Bakhtiyar, M. Effect of the temperature variation between Mediterranean Sea and Syrian deserts on the dust storm occurrence in the western half of Iran. Atmos. Res. 2015, 154, 116–125. [Google Scholar] [CrossRef]
  18. Vorhees, C. The Impacts of Global Scale Climate Variations on Southwest Asia; Naval Postgraduate School: Monterey, CA, USA, 2006. [Google Scholar]
  19. Hasanean, M.; Almazroui, M.; Jones, P.; Alamoudi, A. Siberian high variability and its teleconnections with tropical circulations and surface air temperature over Saudi Arabia. Clim. Dyn. 2013, 41, 2003–2018. [Google Scholar] [CrossRef]
  20. Li, R.; Lu, S.; Han, B.; Gao, Y. Connections between the South Asian summer monsoon and the tropical sea surface temperature in CMIP5. J. Meteorol. Res. 2015, 29, 106–118. [Google Scholar] [CrossRef]
  21. Mehdipour, R.; Baniamerian, Z. A new approach in reducing sand deposition on railway tracks to improve transportation. Aeolian Res. 2019, 41, 100537. [Google Scholar] [CrossRef]
  22. Bruno, L.; Horvat, M.; Raffaele, L. Windblown sand along railway infrastructures: A review of challenges and mitigation measures. J. Wind. Eng. Ind. Aerodyn. 2018, 177, 340–365. [Google Scholar] [CrossRef]
  23. MirakhmedovichMirakhmedov, M. Sand Drift and Measures to Mitigate Its Impact on the Railway Track. Turk. J. Comput. Math. Educ. 2021, 12, 3156–3161. [Google Scholar]
  24. ArabNews. Saudi Arabia to Triple Size of Its Rail Network. Available online: https://www.arabnews.com/node/2003401/business-economy (accessed on 13 May 2022).
  25. Saudi Loading Code No. SBC301. 2018. Available online: https://gda.com.sa/pdf/SBC301.pdf (accessed on 13 May 2022).
  26. Kok, F.; Parteli, J.; Michaels, I.; Karam, B. The physics of wind-blown sand and dust. Rep. Prog. Phys. 2012, 75, 106901. [Google Scholar] [CrossRef] [Green Version]
  27. Tsoar, H.; Pye, K. Dust transport and the question of desert loess formation. Sedimentology 1987, 34, 139–153. [Google Scholar] [CrossRef]
  28. Goudie, S. Dust storms: Recent developments. J. Environ. Manag. 2009, 90, 89–94. [Google Scholar] [CrossRef] [PubMed]
  29. ENV 1991-2-5; Eurocode 1: Action on Structures—Part1–5: General Actions—Thermal Actions. The European Union: Maastricht, The Netherlands, 2003.
  30. EN 1991-1-2; Eurocode 1: Actions on Structures. General Actions-Actions on Structures Exposed to Fire. The European Union: Maastricht, The Netherlands, 2002.
  31. Tsoar, H. Bagnold, RA 1941: The physics of blown sand and desert dunes. London: Methuen. Prog. Phys. Geogr. 1994, 18, 91–96. [Google Scholar] [CrossRef]
  32. Shao, Y. (Ed.) Physics and Modelling of Wind Erosion; Springer: Dordrecht, The Netherlands, 2008. [Google Scholar]
  33. Chiras, D. Wind Power Basics: A Green Energy Guide; New Society Publishers: Gabriola, BC, Canada, 2010. [Google Scholar]
  34. Wegley, H.L.; Ramsdell, J.V.; Orgill, M.M.; Drake, R.L. Siting Handbook for Small Wind Energy Conversion Systems (No. PNL-2521 (Rev. 1)); Battelle Pacific Northwest Labs.: Richland, WA, USA, 1980. [Google Scholar]
Figure 1. Map of deserts in Saudi Arabia [4].
Sustainability 14 09436 g001
Figure 2. Different methods of installing fences [21].
Sustainability 14 09436 g002
Figure 3. Hejaz railway station in the Arabian Desert [22].
Sustainability 14 09436 g003
Figure 4. Map of construction and future proposed railways in KSA [24].
Sustainability 14 09436 g004
Figure 5. Proposed data flow chart (DFC) of all methodological steps.
Sustainability 14 09436 g005
Figure 6. Map of wind velocity recommended by SBC301 [25] in KSA.
Sustainability 14 09436 g006
Figure 7. (a) Sand transport modes of motion (redrawn from: Pye, Ref. [25]), (b) wind–sand interaction in saltation.
Sustainability 14 09436 g007
Figure 8. Effect of surface friction on low-level wind [33].
Sustainability 14 09436 g008
Figure 9. Formation of a new wind profile above ground level [33].
Sustainability 14 09436 g009
Figure 10. Vertical profiles of air flowing over a cliff for all four stages [34].
Sustainability 14 09436 g010
Figure 11. Ground clutter and turbulence. Trees, houses, barns, silos, billboards, garages, and other structures are referred to as ground clutter [34].
Sustainability 14 09436 g011
Figure 12. Zone of disturbed flow over a small building [33].
Sustainability 14 09436 g012
Figure 13. Dense windbreak provides good wind protection and snow drift control. Adapted from Montana State University Extension Bulletin 366.
Sustainability 14 09436 g013
Figure 14. Categories of the geometric criteria of windbreaks [22]. (a) Porous barrier, (b) Solid fence barrier, (c) Earthwork barrier (Dyke), and (d) Ditch earthwork.
Sustainability 14 09436 g014
Figure 15. Relation between source, path, and receiver SMMs [22].
Sustainability 14 09436 g015
Figure 16. Proposed path SMM. (a) Sand backfill and trees barriers, (b) Riprap and trees barriers, (c) Sand backfill and concrete wall barriers; (d) Riprap backfill and concrete wall barriers.
Sustainability 14 09436 g016aSustainability 14 09436 g016b
Figure 17. Comparison between percentage of wind velocity increase and barrier height at different values of wind shear exponent.
Sustainability 14 09436 g017
Table 1. Case study using basic wind velocity of 52 m/s.
Barrier Height (m)Wind Measured Height (m)Wind Velocity (m/s)
α = 0.2 α = 0.3 α = 0.4 α = 0.5
4.005.0054.3755.6056.8558.14
5.006.0053.9354.9255.9356.96
6.007.0053.6354.4655.3156.17
7.008.0053.4154.1354.8555.59
8.009.0053.2453.8754.5155.15
Table 2. Summary of recommendations vs. the respective stakeholders.
Stakeholder GroupsRecommendations
Saudi Arabian Public Transport Authority (PTA)The PTA was established to regulate public transport services for passengers within and between the cities of the Kingdom, supervise them, and provide services at an appropriate cost, as well as to provide budgets and resources to railway projects, and the proposed protection barriers are suggested alternative solutions to develop the railway transport network in Saudi Arabia.
Saudi Arabian Railway (SAR)The SAR is responsible for operating and maintaining the railway system, as well as enhancing railroad safety and minimizing human errors leading to accidents. In this case, it is recommended to exchange the existing method of removing sand from the railway using a sand removal machine with the building protection barriers that are proposed in this paper.
Ministry of Transport The MoT is responsible for dealing with development projects in the government sector. It is recommended that the MoT takes this study into account due to the potential long-term benefits.
Publisher’s Note: MDPI stays neutral with regard to jurisdictional claims in published maps and institutional affiliations.

