
IoT Based Automatic Diagnosis for Continuous Improvement


 ,
, 

Abstract
:1. Introduction
2. Literature Review
2.1. Detailed Diagnosis of Manufacturing Workstations
2.2. Lean Manufacturing, Lean&Green, and Industry 4.0
2.3. The Relevance of IoT in the Detailed Diagnosis for Continuous Improvement
2.4. IoT-Related Devices Availability
3. Automatic Detailed Diagnosis Requirements and Architecture
3.1. Requirements Definition with Support of Lean Professionals
- Scenario 1—minimize time and cost spent in the DD (usually half a day or one day of data collection);
- Scenario 2—assuring data representativeness (by observing the workstation for one or two weeks).
- To be a non-intrusive solution, both to operators and machines, because it should not interfere with regular tasks and, for the latter, most of the machines’ PLC and controls are out of reach for Lean professionals (being either too complex to access or requiring dozens of thousands of euros be spent by the equipment manufacturer);
- To be flexible and easy to use, because usually, the internal or external Lean professionals’ team does not have expertise in programming and data processing. Additionally, the monitoring is to be carried out for a couple of weeks in one workstation to support a specific problem-solving project, and should be easy to move to another workstation to support another problem-solving project. One must remember that a permanent DD diagnosis of a workstation creates a tremendous amount of useless data if the performance respects the production KPI target values;
- To be a low-cost solution, to have a short pay-back period by avoiding unessential monitoring by lean professionals, and to allow there to be several ADD sets in the company;
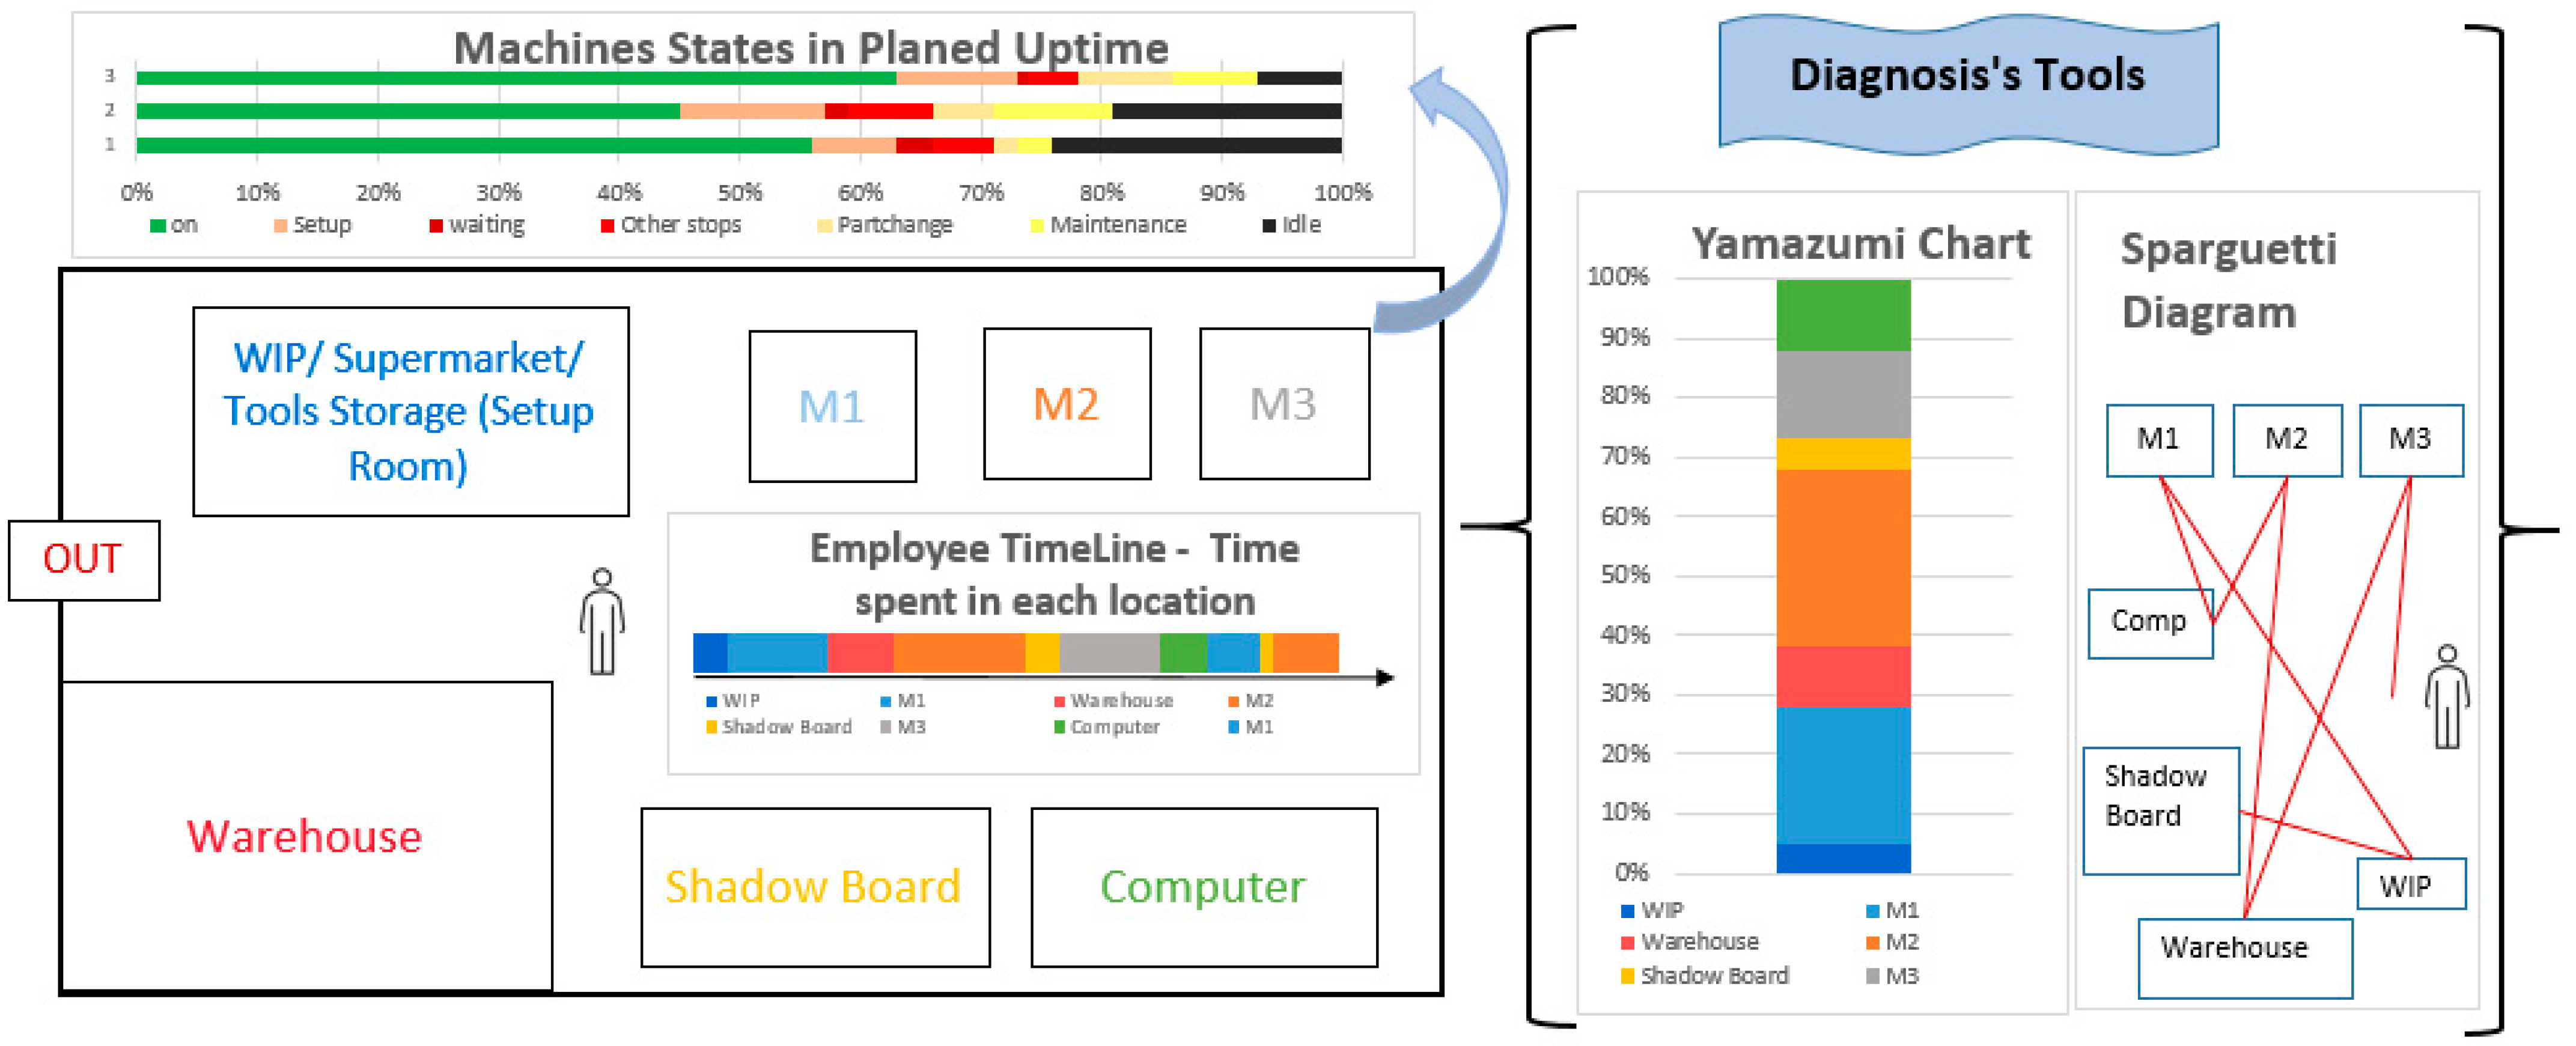
- To allow for the reporting and analysis of machine time and operator movements/time for several operational statuses (operation, setup, micro stops, waiting, maintenance, etc.) and for several typical locations, avoiding the need to build by “pen&paper” the typical Yamazumi charts, spaghetti diagrams, etc., yet giving similar information [41,42,43];
- To allow the quantification of wasted material, accepted/rejected parts, energy consumption, and consumables use, among other resources related to efficiency aspects [16];
- To allow (optionally) the Lean professionals to control the DD’s progress in data collection, via monitoring dashboards for easy data visualization and decision-making [85].
3.2. Automatic Detailed Diagnosis Architecture and Costs
4. Validation Experiment and Case Study
4.1. Preliminary Tests
4.2. Industrial Case Study in a Mould-Making Company
4.2.1. Total Uptime
4.2.2. Micro-Stops (MS) and Operator Location
4.2.3. Setups
5. Conclusions
Author Contributions
Funding
Informed Consent Statement
Data Availability Statement
Conflicts of Interest
Appendix A

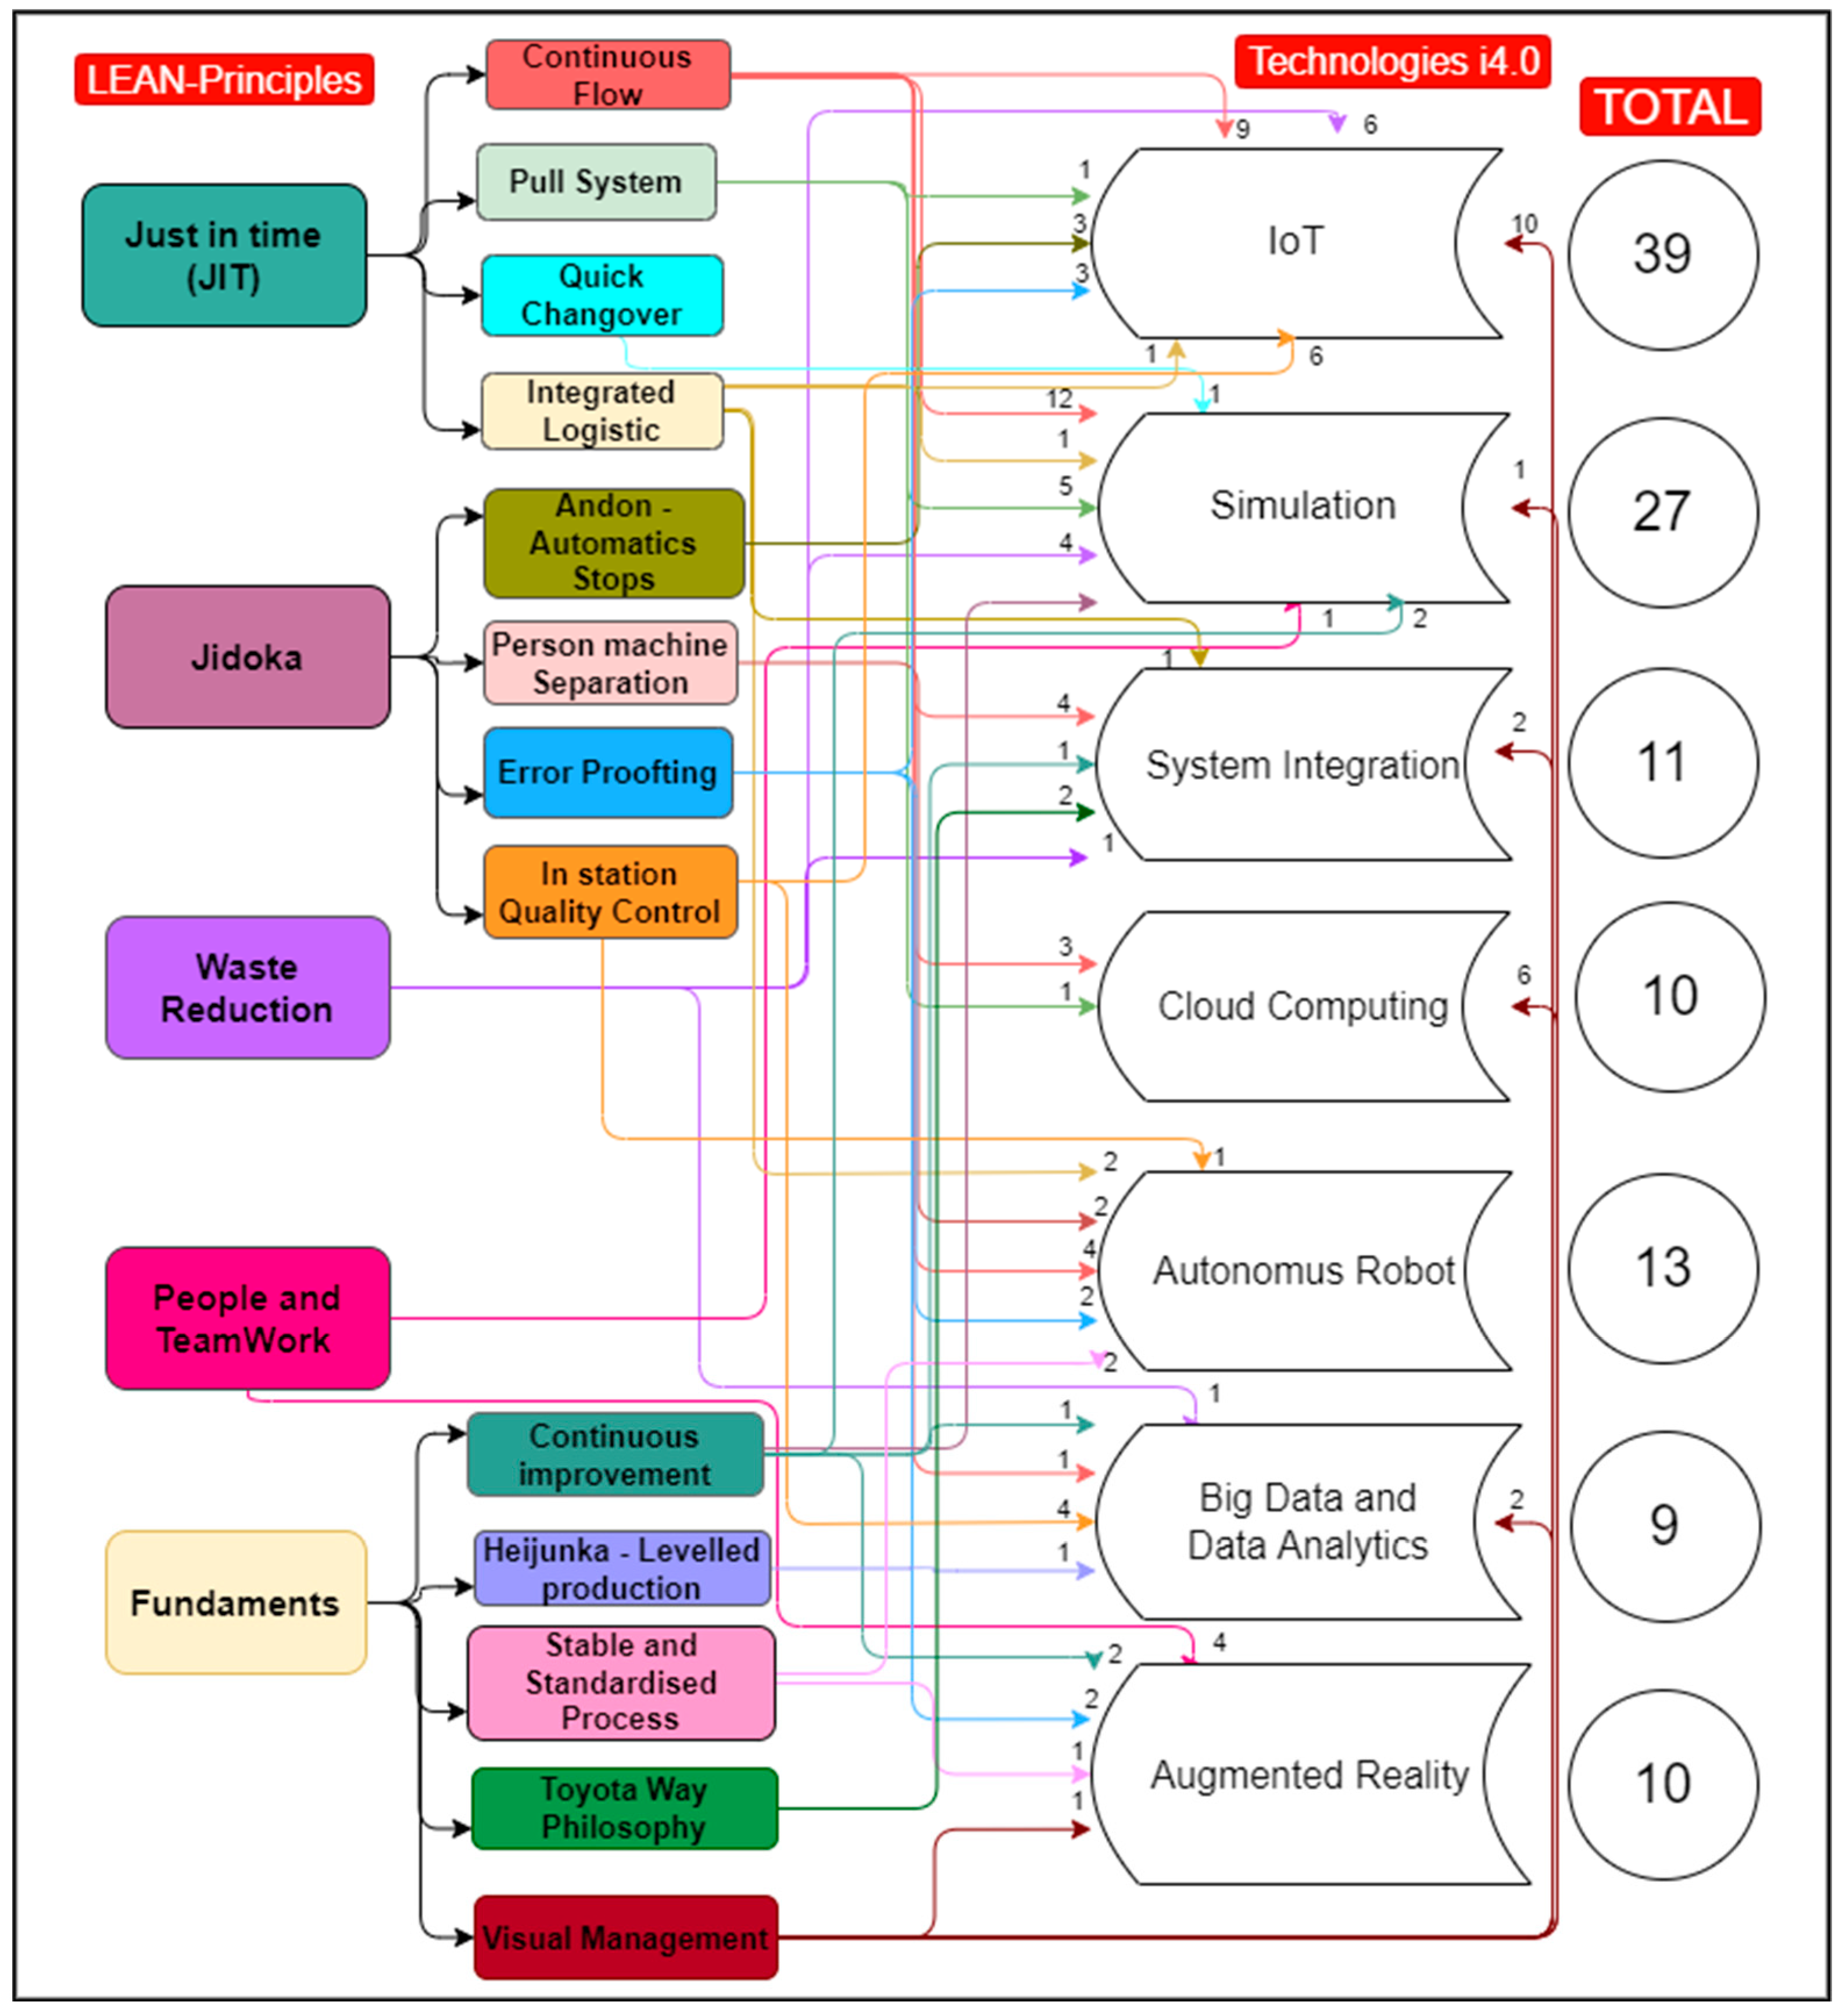
| Technologies | Definition |
|---|---|
| Autonomous Robots | Robots that operate automated processes and interact with humans or other robots in a self-learning manner |
| Simulation | Enables the virtualization of processes and products to test hypotheses |
| Big Data and Analytics | Set of technologies and tools capable of processing and analyzing large volumes of data |
| Cloud Computing | Services that provide access to databases of machines, systems, software, and tools through networks such as the internet |
| Internet of Things (IoT) | Network infrastructure for communication between identifiable things |
| Vertical and Horizontal System Integration | Integration at all levels of manufacturing, both vertically, among the different areas of the industry, and horizontally, encompassing the various stakeholders |
| Augmented Reality | Insertion of the virtual world into the real environment through the combination of 3D elements |
| Additive Manufacturing | Use of 3D printing for the large-scale printing of parts |
| Cyber security | Services and technologies aimed at protecting users, systems, equipment, networks and industrial data from illicit intrusion |
| Name/Company/Objectives | Features | Sensors |
|---|---|---|
| Cisco—Cisco Industrial Asset Vision All- in-one solution that simplifies asset and facility monitoring in outdoor or indoor environments. | Choice of 11 sensors and Cisco LoRaWan gateway. Backed by Osco security. Cloud-based dashboard. Deploy the sensors and the gateway in min, using a QR code. Automated alerts. | Temperature and humidity. Door and window. Water leakage. Light level. Room occupancy. Machine or product temperature. Machine vibration. |
| Movus—Fit Machine Continuous condition monitoring solution that monitors temperature, vibration, and acoustics. Uses AI/ML to understand and monitor asset operation and health 24/7. | Multiple sensor types. Quick install using magnets. Cloud-based dashboard. Can use existing Wi-Fi infrastructure or the Movus gateway. QR code for quick access to machine data. ML-based failure prediction. | Temperature and humidity, (indoor) pressure. Machine temperature. Accelerometer. Microphone. |
| Bosch—Sense Connect Detect (SCD)- Attaches to most machines/components. Collects data, wirelessly via Bluetooth and visualized via mobile app, to reduce maintenance costs, maximize machine production, and drive better business decisions. | Equipped with a few sensors and Bluetooth technology. Easy data visualization via mobile app. Easy install (sticker), resistant and attaches to most assets. Battery included. | Light intensity. Temperature. Magnetometer. Accelerometer. |
| Bosch—Connected Industrial Sensor Solution (CISS) Small multi-sensor device for harsh industrial environments. Provides machine condition monitoring + early detection and localization of potential issues. Data gathered, via Bluetooth and presented on an app, enables further development of predictive and remote maintenance. | Equipped with several sensors and Bluetooth technology. Easy data visualization via mobile app. Easy to install, resistant (−20° to 80°) but no battery (needs wiring). | Temperature and humidity (indoor). Light intensity. Machine or product temperature. Pressure. Accelerometer. Gyroscope. Magnetometer. Microphone. |
| Bosch—Cross Domain Development Kit (XDK) Combines a wide array of MEMS sensors with a microcontroller. An ARM Cortex M3 processor analyzes, processes and transmits the sensor data. Monitors, controls and analyzes products remotely via Bluetooth or wireless network. | Equipped with sensors. BT and wireless network. Includes ready-to-use software package. Easy installation. Device needs to be programmed. Includes rechargeable battery. | Temperature and humidity (indoor). Light intensity. Machine or product temperature. Pressure. Accelerometer. Gyroscope. Magnetometer. Microphone. |
| Bosch—Intelligent Vibration Analysis System (IVAS)—PROTOTYPE Compact and robust equipment 2 MEMS acceleration sensors, for high -bandwidth and high-resolution vibration measurements. Integrates into existing communication infrastructure and offers possibilities to implement use case-specific algorithms on the sensor device. | Two accelerometers (high bandwidth + sensitivity). No wireless technology. No web interface or dashboard. Easy installation. Device needs to be programmed. No battery. | |
| Bosch—TRACI Wireless and secure sensor solution equipped with LoRa and BLE connectivity for location and asset tracking. | Equipped with sensors, GNSS and BT/wireless network technology. Alerts for accident, maintenance, geophone and temperature. Very robust and battery life of up to 5 years. | Product and machine temperature. Accelerometer. Microphone. |
| Sensolus—SNIT 3 Ultra/Compact Low-power, plug and play solution to manage smaller assets. Universal solution for tracking and locating valuable non-powered assets in indoor and outdoor locations in an extremely simple way. | GPS and sensors. Compact format, does not include pressure sensor. Simple web interface and cloud-based dashboard with alerts. Quick install (plug and play solution) and 5-year battery life. | Product and machine temperature. Pressure. Accelerometer. Magnetometer. Microphone. |
| Eliko—UWB RTLS 2D pilot kit The 2D pilot is a great way to test a micro positioning use case. | Battery-powered tags; RTLS Server and software for four anchors; four-port PoE switch. RTLS manager for system configuration and visualization. Four anchors with ethernet and Wi-Fi connectivity options. | |
| Ifm-io—key + accessories Tank monitoring using a capacitive continuous level sensor. Measurement of compressed air consumption and leakage monitoring using a compressed air meters. Fan monitoring using vibration diagnosis sensors. Valve monitoring using valve sensors. | Equipped with sensors that need to be wired to the gateway. Web-based dashboard for data visualization and analysis. Non- intrusive but requires installation. Sends SMS/Mail Alerts. | Compressed air and leakage. Water level. Machine vibration. Valve. |
| Advantech—WISI 2410—LoRaWAN Wireless Condition Monitoring Sensor Replaces traditional human inspection, allowing manufacturers to achieve remote detection and 24 h monitoring. Diagnosing through ISO 10816 helps system integrators get started quickly, reducing the entry threshold for preventive maintenance. | Sensors Quick install and plug and play approach. Simple web interface and cloud-based dashboard. Coverage up to 5 km with 2 years of battery life. | Machine temperature. Accelerometer. |
| I-care Wi-care 100 Series System Plug and play wireless monitoring solution. Automated tracking of critical equipment, from continuous monitoring to once-a-week intervals, collecting reliably, deployed/configured quickly, permanently or used for spot checks during inspection. | Five sensors. Gateway (Wi-care 920). Signal transmission extender available. Quick install and plug and play approach. Simple cloud-based dashboard with real-time alerts/notifications. | Machine temperature. Machine vibration. Speed. Ultra sound. |
| Advantech Wzzard HVAC/Refrigeration/Energy/Condition-Based Monitoring Starter Kit Provides a non-intrusive, easily scalable and simple to install solution for monitoring. HVAC/refrigeration/energy/condition-based equipment without disrupting facility operations. | Starter kit with sensors. Simple cloud-based dashboard with alerts via SMS/Mail. SmartSwarm Gateway (connecting up to 100 sensors). | Temperature and humidity (indoor). Door and window. Current intensity. Machine temperature. Machine vibration. Energy consumption. |
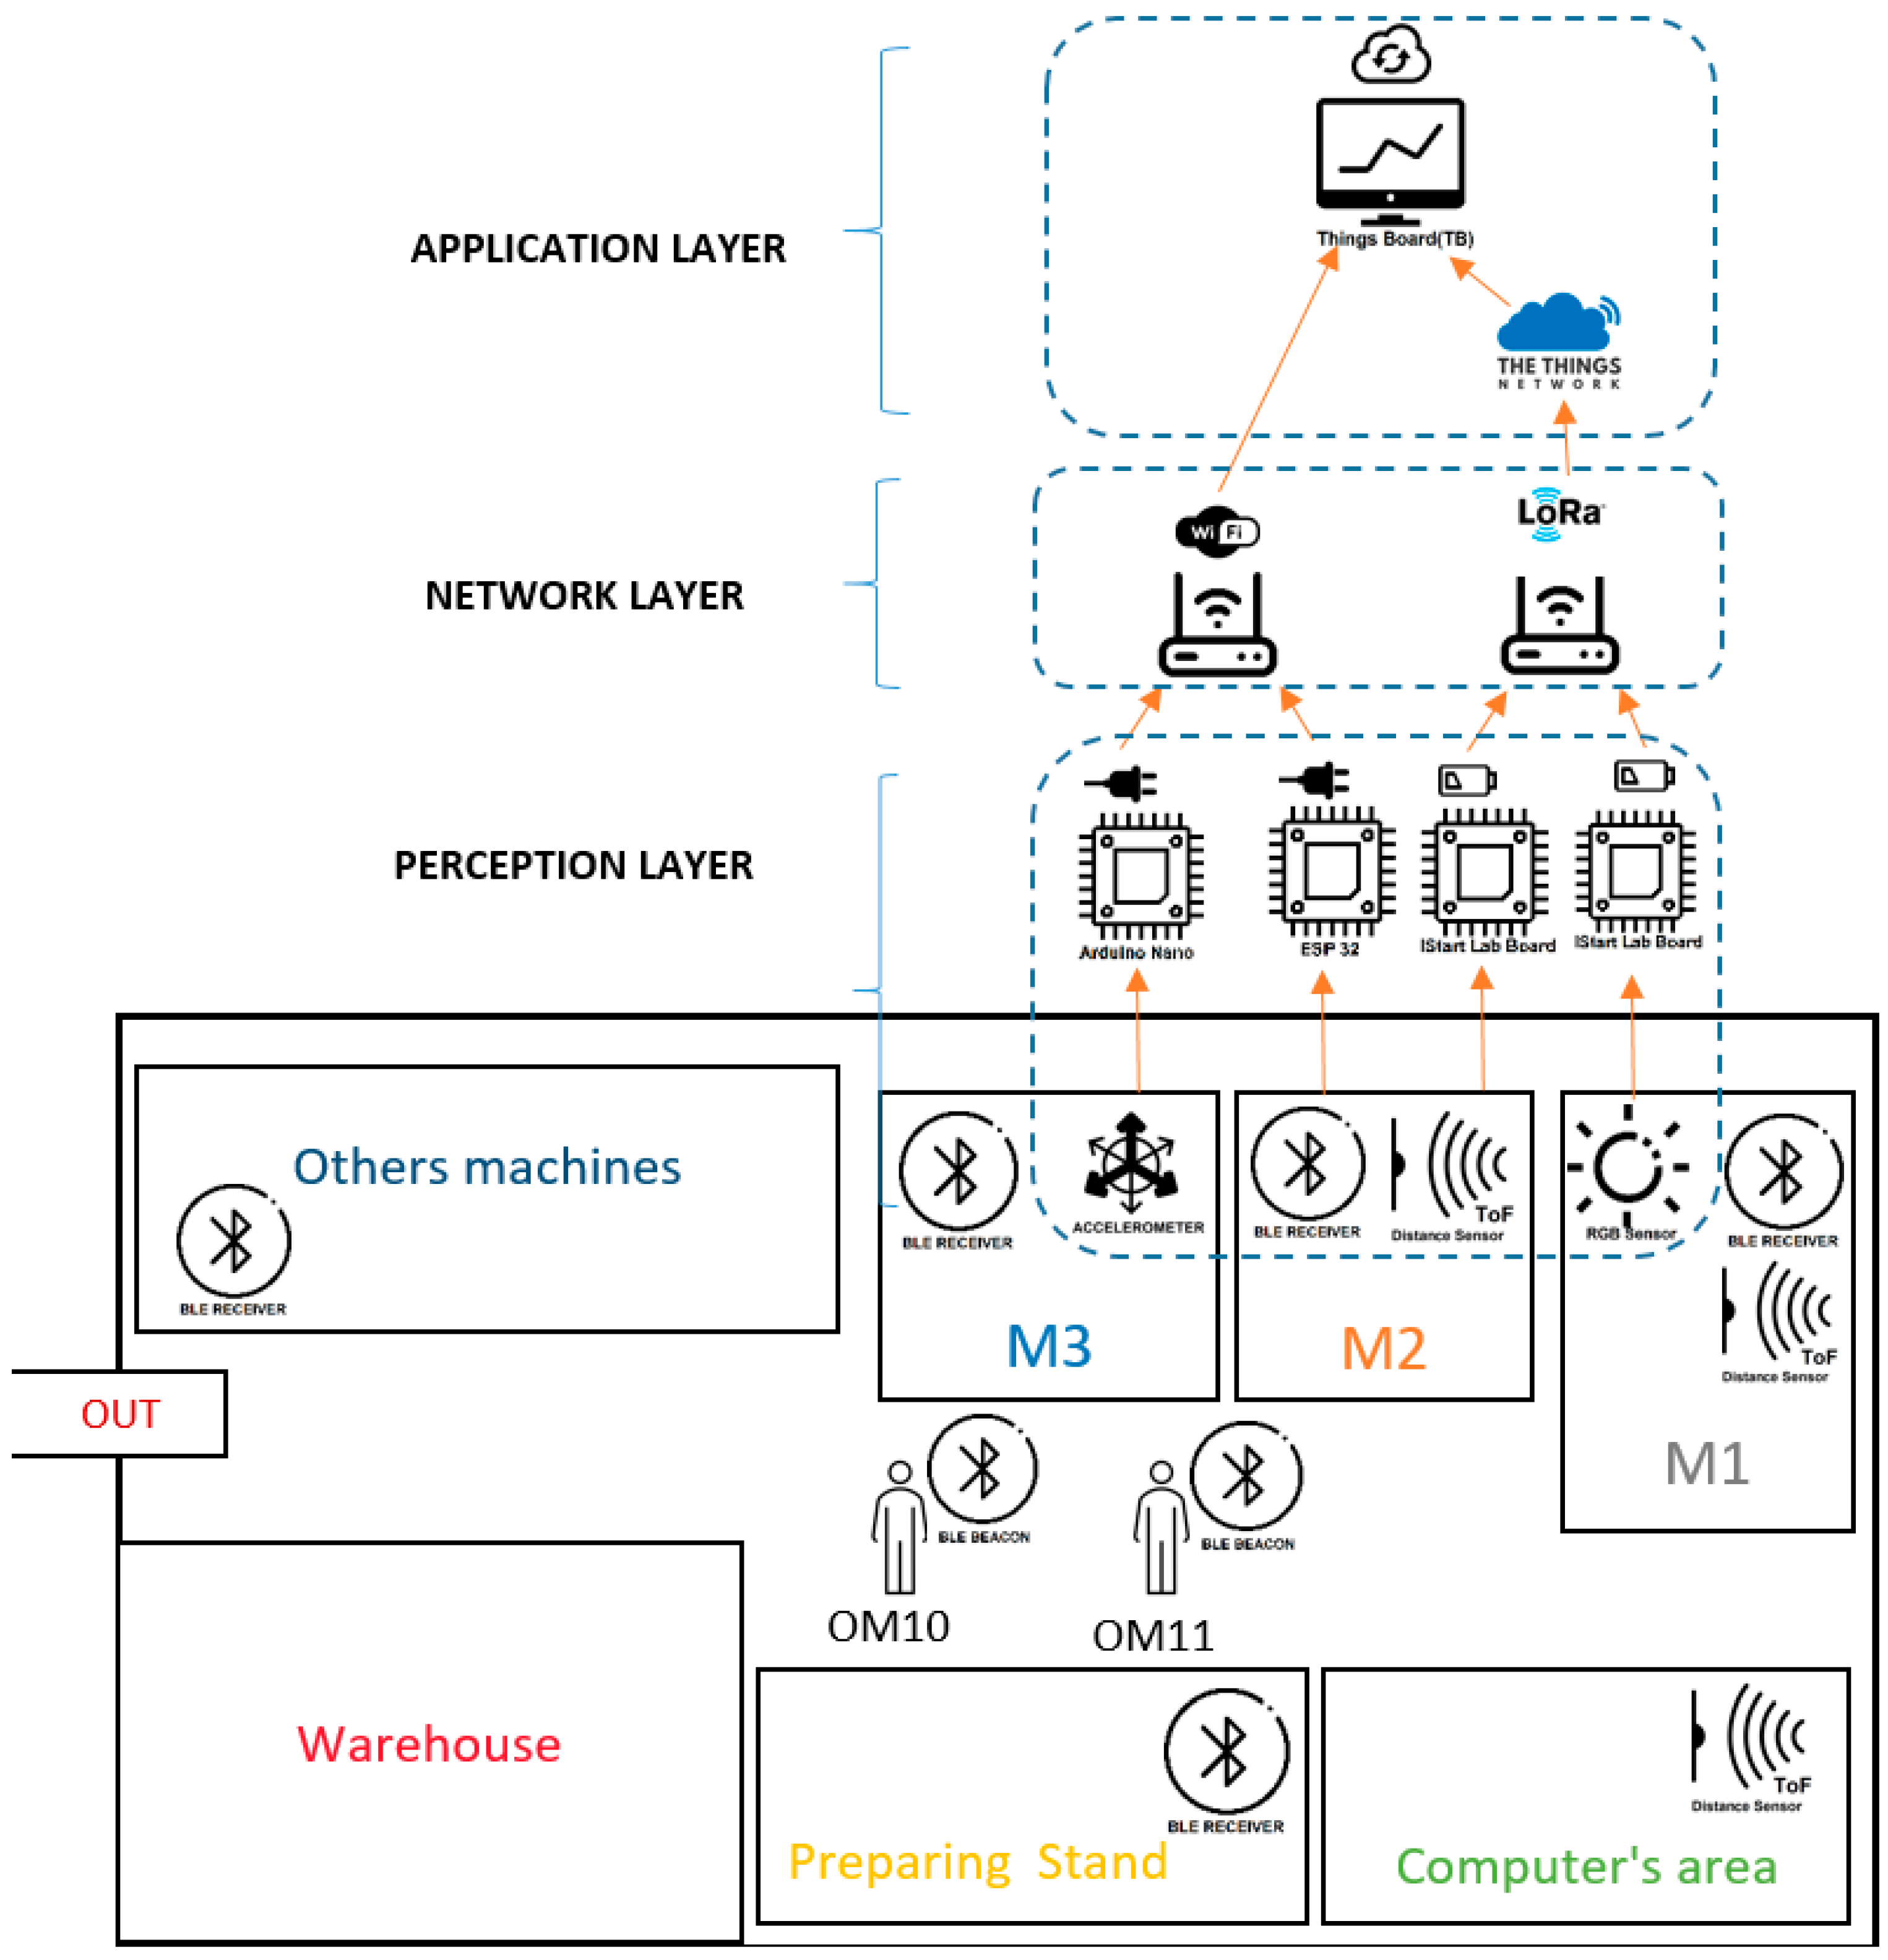
| Component | Sensor | Detection | MCU | Protocol | Power |
|---|---|---|---|---|---|
| RGB (red, green, blue) node | APDS9960 | Checks the state of the machine status LED, which has four distinct states: off, red, green, blue | ATSAMD21G18 | LoRa LoRaWAN | Two AA Lithium batteries (autonomy 4.8 months) |
| Vibration and noise node | LSM6DSOXTR | Six-axis accelerometer and microphone for machine uptime and downtime detection | RP2040 | Wi-fi MQTT | Plugged |
| Bluetooth low-energy (BLE) system | BLE Antenna | Presence of operators in specific locations | ESP32 | Wi-fi MQTT | Plugged |
| Time-of-Flight (ToF) node | VL53L1X | This sensor measures the distance to the first object in front of it | ATSAMD21G18 | LoRa LoRaWAN | Two AA Lithium batteries (autonomy 11.7 months) |
References
- Lewis, M.A. Lean production and sustainable competitive advantage. Int. J. Oper. Prod. Manag. 2000, 20, 959–978. [Google Scholar] [CrossRef]
- Krafick, F.J. Triumph of the Lean Production System. Sloan Manag. Rev. 1988, 30, 41–52. [Google Scholar]
- Sony, M. Industry 4.0 and lean management: A proposed integration model and research propositions. Prod. Manuf. Res. 2018, 6, 416–432. [Google Scholar] [CrossRef] [Green Version]
- Taghavi, V.; Beauregard, Y. The Relationship between Lean and Industry 4.0: Literature Review. In 5th North American Conference on Industrial Engineering and Operations Management in Detroit; IEOM Society International: Southfield, MI, USA, 2020; pp. 808–820. Available online: http://www.ieomsociety.org/detroit2020/papers/189.pdf (accessed on 30 June 2022).
- Rother, M.; Shook, J. Learning to See: Value Stream Mapping to Add Value and Eliminate Muda; Lean Enterprise Institute: Cambridge, MA, USA, 2003. [Google Scholar]
- Miqueo, A.; Torralba, M.; Yagüe-Fabra, J.A. Lean manual assembly 4.0: A systematic review. Appl. Sci. 2020, 10, 8555. [Google Scholar] [CrossRef]
- Hambach, J.; Kümmel, K.; Metternich, J. Development of a Digital Continuous Improvement System for Production. Procedia CIRP 2017, 63, 330–335. [Google Scholar] [CrossRef]
- Gallo, T.; Cagnetti, C.; Silvestri, C.; Ruggieri, A. Industry 4.0 tools in lean production: A systematic literature review. Procedia Comput. Sci. 2021, 180, 394–403. [Google Scholar] [CrossRef]
- Rahman, M.S.B.A.; Mohamad, E.; Rahman, B.A. Development of IoT—Enabled data analytics enhance decision support system for lean manufacturing process improvement. Concurr. Eng. Res. Appl. 2021, 29, 208–220. [Google Scholar] [CrossRef]
- Saravanan, G.; Parkhe, S.S.; Thakar, C.M.; Kulkarni, V.V.; Mishra, H.G.; Gulothungan, G. Implementation of IoT in production and manufacturing: An Industry 4.0 approach. Mater. Today Proc. 2022, 51, 2427–2430. [Google Scholar] [CrossRef]
- Rüßmann, M.; Lorenz, M.; Gerbert, P.; Waldner, M.; Justus, J.; Engel, P.; Harnisch, M. Future of Productivity and Growth in Manufacturing. 2015. Available online: https://www.bcg.com/publications/2015/engineered_products_project_business_industry_4_future_productivity_growth_manufacturing_industries (accessed on 30 June 2022). [CrossRef]
- Amaral, A.; Jorge, D.; Peças, P. Small medium enterprises and industry 4.0: Current models’ ineptitude and the proposal of current models ’ ineptitude and the proposal of a methodology to successfully implement. Procedia Manuf. 2019, 41, 1103–1110. [Google Scholar] [CrossRef]
- Amaral, A.; Peças, P. SMEs and Industry 4.0: Two case studies of digitalization for a smoother integration. Comput. Ind. 2021, 125, 103333. [Google Scholar] [CrossRef]
- Sanders, A.; Elangeswaran, C.; Wulfsberg, J. Industry 4.0 implies lean manufacturing: Research activities in industry 4.0 function as enablers for lean manufacturing. J. Ind. Eng. Manag. 2016, 9, 811–833. [Google Scholar] [CrossRef] [Green Version]
- Duarte, S.; Cruz-Machado, V.C. An investigation of lean and green supply chain in the Industry 4.0. In Proceedings of the International Symposium on Industrial Engineering and Operations Management (IEOM), Rabat, Marocco, 11–13 April 2017; pp. 255–265. [Google Scholar]
- John, L.; Sampayo, M.; Peças, P. Lean & Green on Industry 4.0 Context—Contribution to Understand L & G Drivers and Design Principles. Int. J. Math. Eng. Manag. Sci. 2021, 6, 1214–1229. [Google Scholar] [CrossRef]
- Leong, W.D.; Teng, S.Y.; How, B.S.; Ngan, S.L.; Rahman, A.A.; Tan, C.P.; Ponnambalam, S.; Lam, H.L. Enhancing the adaptability: Lean and green strategy towards the Industry Revolution 4.0. J. Clean. Prod. 2020, 273, 122870. [Google Scholar] [CrossRef]
- Mollenkopf, D.; Stolze, H.; Tate, W.L.; Ueltschy, M. Green, lean, and global supply chains. Int. J. Phys. Distrib. Logist. Manag. 2010, 40, 14–41. [Google Scholar] [CrossRef]
- Xu, X.; Lu, Y.; Vogel-Heuser, B.; Wang, L. Industry 4.0 and Industry 5.0—Inception, conception and perception. J. Manuf. Syst. 2021, 61, 530–535. [Google Scholar] [CrossRef]
- Breque, M.; de Nul, L.; Petridis, A. Industry 5.0: Towards a sustainable, human-centric and resilient European industry. Eur. Comm. Publ. Off. 2021. [Google Scholar] [CrossRef]
- Ante, G.; Facchini, F.; Mossa, G.; Digiesi, S. Developing a key performance indicators tree for lean and smart production systems. IFAC Pap. Online 2018, 51, 13–18. [Google Scholar] [CrossRef]
- Menon, S.; Shah, S.; Coutroubis, A. Impacts of I4.0 on Sustainable Manufacturing to Achieve Competitive Advantage. In Proceedings of the International Conference on Operations and Supply Chain Management (OSCM 2018), Cranfield, UK, 9–12 September 2018. [Google Scholar]
- Mayr, A.; Weigelt, M.; Kühl, A.; Grimm, S.; Erll, A.; Potzel, M.; Franke, J. Lean 4.0-A conceptual conjunction of lean management and Industry 4.0. Procedia CIRP 2018, 72, 622–628. [Google Scholar] [CrossRef]
- Valamede, L.S.; Akkari, C.A.S. Lean 4.0: A New Holistic Approach for the Integration of Lean Manufacturing Tools and Digital Technologies. IJMEMS 2020, 5, 851–868. [Google Scholar] [CrossRef]
- Peças, P.; Gamb, M.; Sampayo, M.; Jorge, D. PDCA 4. 0: A New Conceptual Approach for Continuous Improvement in the Industry 4.0 Paradigm. Appl. Sci. 2021, 11, 7671. [Google Scholar] [CrossRef]
- Vinodh, S.; Antony, J.; Agrawal, R.; Douglas, J.A. Integration of continuous improvement strategies with Industry 4.0: A systematic review and agenda for further research. TQM J. 2021, 33, 441–472. [Google Scholar] [CrossRef]
- Rittberger, M.S.S. Continuous Improvement of Lean Processes with Industry 4.0 Technologies. In Proceedings of the 11th International Doctoral Students Workshop on Logistics, Magdeburg, Germany, 18 June 2018; pp. 1–6. Available online: https://www.researchgate.net/publication/339178811_Impacts_of_I40_on_Sustainable_Manufacturing_to_achieve_Competitive_Advantage (accessed on 30 June 2022).
- Dogan, O.; Gurcan, O.F. Data perspective of lean six sigma in industry 4.0 era: A guide to improve quality. In Proceedings of the International Conference on Industrial Engineering and Operations Management, Paris, France, 26–27 July 2018; pp. 943–953. Available online: http://www.ieomsociety.org/paris2018/papers/170.pdf (accessed on 30 June 2022).
- Hu, Q.; Mason, R.; Williams, S.J.; Found, P. Lean implementation within SMEs: A literature review. J. Manuf. Technol. Manag. 2015, 26, 980–1012. [Google Scholar] [CrossRef] [Green Version]
- Pena, D.C.; Silva, D.R.; Rigo, P.M.; Henrique, R.; Lima, P. Estudo de tempos e método no setor de envase de uma indústria de produtos para higiene oral. Rev. Produção Ind. Serviços 2016, 3, 26–37. [Google Scholar]
- Boenzi, F.; Mossa, G.; Mummolo, G.; Romano, V.A. Workforce Aging in Production Systems: Modeling and Performance Evaluation. Procedia Eng. 2015, 100, 1108–1115. [Google Scholar] [CrossRef] [Green Version]
- Digiesi, S.; Facchini, F.; Mossa, G.; Mummolo, G.; Verriello, R. A Cyber—Based DSS for a Low Carbon Integrated Waste Management System in a Smart City. IFAC Pap. Online 2015, 48, 2356–2361. [Google Scholar] [CrossRef]
- Parmenter, D. Key Performance Indicators—Developing, Implementing, and Using Winning KPIs; John Wiley & Sons: Hoboken, NJ, USA, 2007. [Google Scholar]
- Peron, M.; Sgarbossa, F.; Strandhagen, J.O. Decision support model for implementing assistive technologies in assembly activities: A case study. Int. J. Prod. Res. 2022, 60, 1341–1367. [Google Scholar] [CrossRef]
- Staedele, A.E.; Ensslin, S.R.; Forcellini, F.A. Knowledge building about performance evaluation in lean production An investigation on international scientific research. J. Manuf. Technol. Manag. 2019, 30, 798–820. [Google Scholar] [CrossRef]
- Bassuk, J.A.; Washington, I.M. The A3 Problem Solving Report_A 10-Step ScientificMethod to Execute Performance Improvements in anAcademic Research Vivarium. PLoS ONE 2013, 8, e76833. [Google Scholar] [CrossRef]
- Digiesi, S.; Facchini, F.; Mossa, G.; Mummolo, G. A RULA-Based Optimization Model for Workers’ Assignment to an Assembly Line. In Proceedings of the XVII International Scientific Conference on Industrial Systems, Novi Sad, Serbia, 4–6 October 2017; Volume 17, pp. 8–13. Available online: http://www.iim.ftn.uns.ac.rs/is17 (accessed on 30 June 2022).
- Dresch, A.; Veit, D.R.; Lima, P.N.d.; Lacerda, D.P.; Collatto, D.C. Inducing Brazilian manufacturing SMEs productivity with Lean tools. Int. J. Product. Perform. Manag. 2019, 68, 69–87. [Google Scholar] [CrossRef]
- Goldacker, F.; de Oliveira, H.J. Set-up: A path to the lean manufacturing. FAE 2008, 11, 1–14. Available online: https://revistafae.fae.edu/revistafae/article/view/332 (accessed on 30 June 2022).
- Huang, S.H.; Dismukes, J.P.; Shi, J.; Su, Q.; Razzak, M.A.; Bodhale, R.; Robinson, D.E. Manufacturing productivity improvement using effectiveness metrics and simulation analysis. Int. J. Prod. Res. 2003, 41, 513–527. [Google Scholar] [CrossRef]
- Sabadka, D.; Molnár, V.; Fedorko, G.; Jachowicz, T. Optimization of production processes using the yamazumi method. Adv. Sci. Technol. Res. J. 2017, 11, 175–182. [Google Scholar] [CrossRef] [Green Version]
- Adnan, A.; Arbaai, N.; Ismail, A. Improvement of overall efficiency of production line by using line balancing. Asian Res. Publ. Netw. (ARPN) J. Eng. Appl. Sci. 2016, 11. Available online: http://www.arpnjournals.org/jeas/research_papers/rp_2016/jeas_0616_4510.pdf (accessed on 30 June 2022).
- Pyzdek, T. Diagramas de Espaguete. In The Lean Healtcare Handbook. Management for Professionals; Springer: Cham, Switzerland, 2021; pp. 25–28. [Google Scholar] [CrossRef]
- Barnes, R.M. Movement and Time Study: Work Design and Measurement, 1st ed.; Editora Blucher: São Paulo, Brazil, 1977. [Google Scholar]
- Liker, J.K. The Toyota Way: 14 Management Principles from the World’s Greatest Manufacturer; McGraw-Hill: New York, NY, USA, 2004. [Google Scholar]
- Blaga, P. The importance of human resources in the continuous improvement of the production quality. Procedia Manuf. 2020, 46, 287–293. [Google Scholar] [CrossRef]
- Bhuiyan, N.; Baghel, A. An overview of continuous improvement: From the past to the present. Manag. Decis. 2005, 43, 761–771. [Google Scholar] [CrossRef] [Green Version]
- Stock, T.; Seliger, G. Opportunities of Sustainable Manufacturing in Industry 4.0. Procedia CIRP 2016, 40, 536–541. [Google Scholar] [CrossRef] [Green Version]
- Pereira, A.C.; Romero, F. A review of the meanings and the implications of the Industry 4.0 concept. Procedia Manuf. 2017, 13, 1206–1214. [Google Scholar] [CrossRef]
- Ogrean, C.; Herciu, M. Romania’s SMEs on the Way to EU’s Twin Transition to Digitalization and Sustainability. Stud. Bus. Econ. 2021, 16, 282–295. [Google Scholar] [CrossRef]
- Ortega-Gras, J.J.; Bueno-Delgado, M.V.; Cañavate-Cruzado, G.; Garrido-Lova, J. Twin Transition through the Implementation of Industry 4.0 Technologies: Desk-Research Analysis and Practical Use Cases in Europe. Sustainability 2021, 13, 13601. [Google Scholar] [CrossRef]
- Kamble, S.S.; Gunasekaran, A.; Gawankar, S.A. Sustainable Industry 4.0 framework: A systematic literature review identifying the current trends and future perspectives. Process Saf. Environ. Prot. 2018, 117, 408–425. [Google Scholar] [CrossRef]
- Lu, Y. Industry 4.0: A survey on technologies, applications and open research issues. J. Ind. Inf. Integr. 2017, 6, 1–10. [Google Scholar] [CrossRef]
- Narula, S.; Prakash, S.; Dwivedy, M.; Talwar, V.; Tiwari, S.P. Industry 4.0 adoption key factors: An empirical study on manufacturing industry. Emerald Insight 2020, 17, 697–725. [Google Scholar] [CrossRef]
- Kamble, S.S.; Gunasekaran, A.; Ghadge, A.; Raut, R. A performance measurement system for industry 4.0 enabled smart manufacturing system in SMMEs- A review and empirical investigation. Int. J. Prod. Econ. 2020, 229, 107853. [Google Scholar] [CrossRef]
- Dalmarco, G.; Ramalho, F.R.; Barros, A.C.; Soares, A.L. Providing industry 4.0 technologies: The case of a production technology cluster. J. High Technol. Manag. Res. 2019, 30, 100355. [Google Scholar] [CrossRef]
- Amaral, A.; Peças, P. A Framework for Assessing Manufacturing SMEs Industry. Appl. Sci. 2021, 11, 6127. [Google Scholar] [CrossRef]
- Rosin, F.; Forget, P.; Lamouri, S.; Pellerin, R. Impacts of Industry 4.0 technologies on Lean principles. Int. J. Prod. Res. 2020, 58, 1644–1661. [Google Scholar] [CrossRef]
- Agostinho, V.; Baldo, C.R. Assessment of the impact of Industry 4.0 on the skills of Lean professionals. Procedia CIRP 2021, 96, 225–229. [Google Scholar] [CrossRef]
- Ionel, D.S.; Opran, C.G.; Valimareanu, B.C. Lean Manufacturing 4.0—Dynamic physical and cybernetic system for Industry 4.0. IOP Conf. Ser. Mater. Sci. Eng. 2020, 916, 10. [Google Scholar] [CrossRef]
- Anosike, A.; Alafropatis, K.; Garza-Reyes, J.A.; Kumar, A.; Luthra, S.; Rocha-Lona, L. Lean manufacturing and internet of things—A synergetic or antagonist relationship? Comput. Ind. 2021, 129, 103464. [Google Scholar] [CrossRef]
- Wagner, T.; Herrmann, C.; Thiede, S. Industry 4.0 impacts on lean production systems. Procedia CIRP 2017, 63, 125–131. [Google Scholar] [CrossRef]
- Okano, M.T. IOT and Industry 4.0: The Industrial New Revolution. In Proceedings of the International Conference on Management and Information Systems, Istanbul, Turkey, 17–20 October 2017; pp. 75–82. Available online: http://www.icmis.net/icmis17/icmis17cd/pdf/S188.pdf (accessed on 30 June 2022).
- Peralta, G.; Iglesias-Urkia, M.; Barcelo, M.; Gomez, R.; Moran, A.; Bilbao, J. Fog computing based efficient IoT scheme for the Industry 4.0. IEEE Int. Work. Electron. Control. Meas. Signals Appl. Mechatron. 2017, 1–6. [Google Scholar] [CrossRef]
- Hwang, G.; Lee, J.; Park, J.; Chang, T.-W. Developing performance measurement system for Internet of Things and smart factory environment. Int. J. Prod. Res. 2017, 55, 2590–2602. [Google Scholar] [CrossRef]
- Mrugalska, B.; Wyrwicka, M.K. Towards Lean Production in Industry 4.0. Procedia Eng. 2017, 182, 466–473. [Google Scholar] [CrossRef]
- CEFRIO. Prendre Part à la Révolution Manufacturière? Du Rattrapage Technologique à l’Industrie 4.0 chez les PME [Getting on the Manufacturing Revolution? Technological Catching Up with Industry 4.0 by SME]. CEFRIO 2016. Available online: https://espace2.etsmtl.ca/id/eprint/14578/1/Prendre-part-à-la-révolution-manufacturière-Du-rattrapage-technologique-à-l’Industrie-4.0-chez-les-PME.pdf (accessed on 30 June 2022).
- Al-Ahmari, A.M.; Abidi, M.H.; Ahmad, A.; Darmoul, S. Development of a virtual manufacturing assembly simulation system. Adv. Mech. Eng. 2016, 8, 1–13. [Google Scholar] [CrossRef] [Green Version]
- Narula, S.; Puppala, H.; Kumar, A.; Luthra, S.; Dwivedy, M.; Prakash, S.; Talwar, V. Are Industry 4.0 technologies enablers of lean? Evidence from manufacturing industries. Int. J. Lean Six Sigma 2022. [Google Scholar] [CrossRef]
- Tripathi, V. A Sustainable Methodology Using Lean and Smart Manufacturing for the Cleaner Production of Shop Floor Management in Industry 4.0. Mathematics 2022, 10, 347. [Google Scholar] [CrossRef]
- Javaid, M.; Haleem, A.; Singh, R.P.; Rab, S.; Suman, R.; Khan, S. Exploring relationships between Lean 4.0 and manufacturing industry. Ind. Rob. 2022, 49, 402–414. [Google Scholar] [CrossRef]
- Rifqi, H.; Zamma, A.; Souda, S.B.; Hansali, M. Positive Effect of Industry 4.0 on Quality and Operations Management. Int. J. Online Biomed. Eng. 2021, 17, 133–147. [Google Scholar] [CrossRef]
- Tripathi, V. A Novel Smart Production Management System for the Enhancement of Industrial Sustainability in Industry 4.0. Math. Probl. Eng. 2022, 2022, 6424869. [Google Scholar] [CrossRef]
- Zarrar, A.; Rasool, M.H.; Raza, S.M.M.; Rasheed, A. IoT-Enabled Lean Manufacturing: Use of IoT as a Support Tool for Lean Manufacturing. In Proceedings of the 2021 International Conference on Artificial Intelligence of Things (ICAIoT), Virtual Conference, 3–4 September 2021; Volume 2021, pp. 15–20. [Google Scholar] [CrossRef]
- Fukuzawa, M.; Sugie, R.; Park, Y.; Shi, J. An Exploratory Case Study on the Metrics and Performance of IoT Investment in Japanese Manufacturing Firms. Sustainability 2022, 14, 2708. [Google Scholar] [CrossRef]
- Simonetto, M.; Peron, M.; Fragapane, G.; Sgarbossa, F. Digital Assembly Assistance System in Industry 4.0 Era: A Case Study with Projected Augmented Reality. Adv. Manuf. Autom. X 2021, 644–651. Available online: https://ntnuopen.ntnu.no/ntnu-xmlui/bitstream/handle/11250/2729767/Simonetto_DigitalAssemblyAssistanceSysteminIndustry4.0era.pdf?sequence=1 (accessed on 30 June 2022).
- Simonetto, M.; Arena, S.; Peron, M. A methodological framework to integrate motion capture system and virtual reality for assembly system 4.0 workplace design. Saf. Sci. 2022, 146, 105561. [Google Scholar] [CrossRef]
- Vlachos, I.P.; Pascazzi, R.M.; Zobolas, G.; Repoussis, P.; Giannakis, M. Lean manufacturing systems in the area of Industry 4.0: A lean automation plan of AGVs/IoT integration. Prod. Plan. Control 2021, 9537287. [Google Scholar] [CrossRef]
- Cifone, F.D.; Hoberg, K.; Holweg, M.; Staudacher, A.P. ‘Lean 4.0’: How can digital technologies support lean practices? Int. J. Prod. Econ. 2021, 241, 108258. [Google Scholar] [CrossRef]
- Lu, Y.; Liu, Z.; Min, Q. A digital twin-enabled value stream mapping approach for production process reengineering in SMEs. Int. J. Comput. Integr. Manuf. 2021, 34, 764–782. [Google Scholar] [CrossRef]
- Meister, M.; Bessle, J.; Cviko, A.; Boing, T.; Metternich, J. Manufacturing Analytics for problem-solving processes in production. Procedia CIRP 2019, 81, 1–6. [Google Scholar] [CrossRef]
- Chen, B.; Wan, J.; Shu, L.; Li, P.; Mukherjee, M.; Yin, B. Smart Factory of Industry 4.0: Key Technologies, Application Case, and Challenges. IEEE Access 2017, 6, 6505–6519. [Google Scholar] [CrossRef]
- Rüttimann, B.G.; Stöckli, M.T. Lean and Industry 4.0—Twins, Partners, or Contenders? A Due Clarification Regarding the Supposed Clash of Two Production Systems. J. Serv. Sci. Manag. 2016, 9, 485–500. [Google Scholar] [CrossRef] [Green Version]
- de Ugarte, B.S.; Artiba, A.; Pellerin, R. Manufacturing execution system—A literature review. Prod. Plan. Control 2009, 20, 525–539. [Google Scholar] [CrossRef]
- Ray, P.P. A survey on Internet of Things architectures. J. King Saud Univ. Comput. Inf. Sci. 2018, 30, 291–319. [Google Scholar] [CrossRef] [Green Version]
- Lin, J.; Yu, W.; Zhang, N.; Yang, X.; Zhang, H.; Zhao, W. A Survey on Internet of Things: Architecture, Enabling Technologies, Security and Privacy, and Applications. IEEE Internet Things J. 2017, 4, 1125. [Google Scholar] [CrossRef]


| Vibration and Noise Node | RGB Node | ToF Node | BLE System | Gateway | |
|---|---|---|---|---|---|
| Arduino Nano RP2040 Connect | IStartlab Board with Antenna | IStartlab Board with Antenna | ESP32 | LtAP LR8 LTE kit by MikroTik | |
| Device Board (EUR) | 22 | 19 | 19 | 12 | |
| Sensor or Beacon (EUR) | X | RGB Sensor | ToF Sensor | 1x Beacon | |
| 4 | 7 | 13 | |||
| Power Cable & Adapter (EUR) | 7 | X | X | 7 | |
| Box (EUR) | 2 | 4 | 4 | ||
| Total (EUR) | 31 | 27 | 30 | 34 | 230 |
| Type | Sensors | Function | Nodes | Requirements |
|---|---|---|---|---|
| Machine Monitoring Tests IStartLab | Luminosity Sensor | Underground room | LDR | Machine status |
| Light-dependent resistor (LDR) working as a luminosity sensor | ||||
| Distance Sensor | Measure the height of the base plate of the printer | ToF | Machine status | |
| Machine Monitoring (State) | LED Associated with RGB Sensor | To follow the color of the machine’s state indicator from the app | RGB | Machine status |
| Variation of Accelerometer Values | Monitoring variations in the accelerometer values | Vibration | Machine status | |
| Employee Location Monitoring | Beacon | To identify whether a beacon was at a certain location in a particular instant | BLE | Operator monitoring, flexible, non-intrusive and low cost |
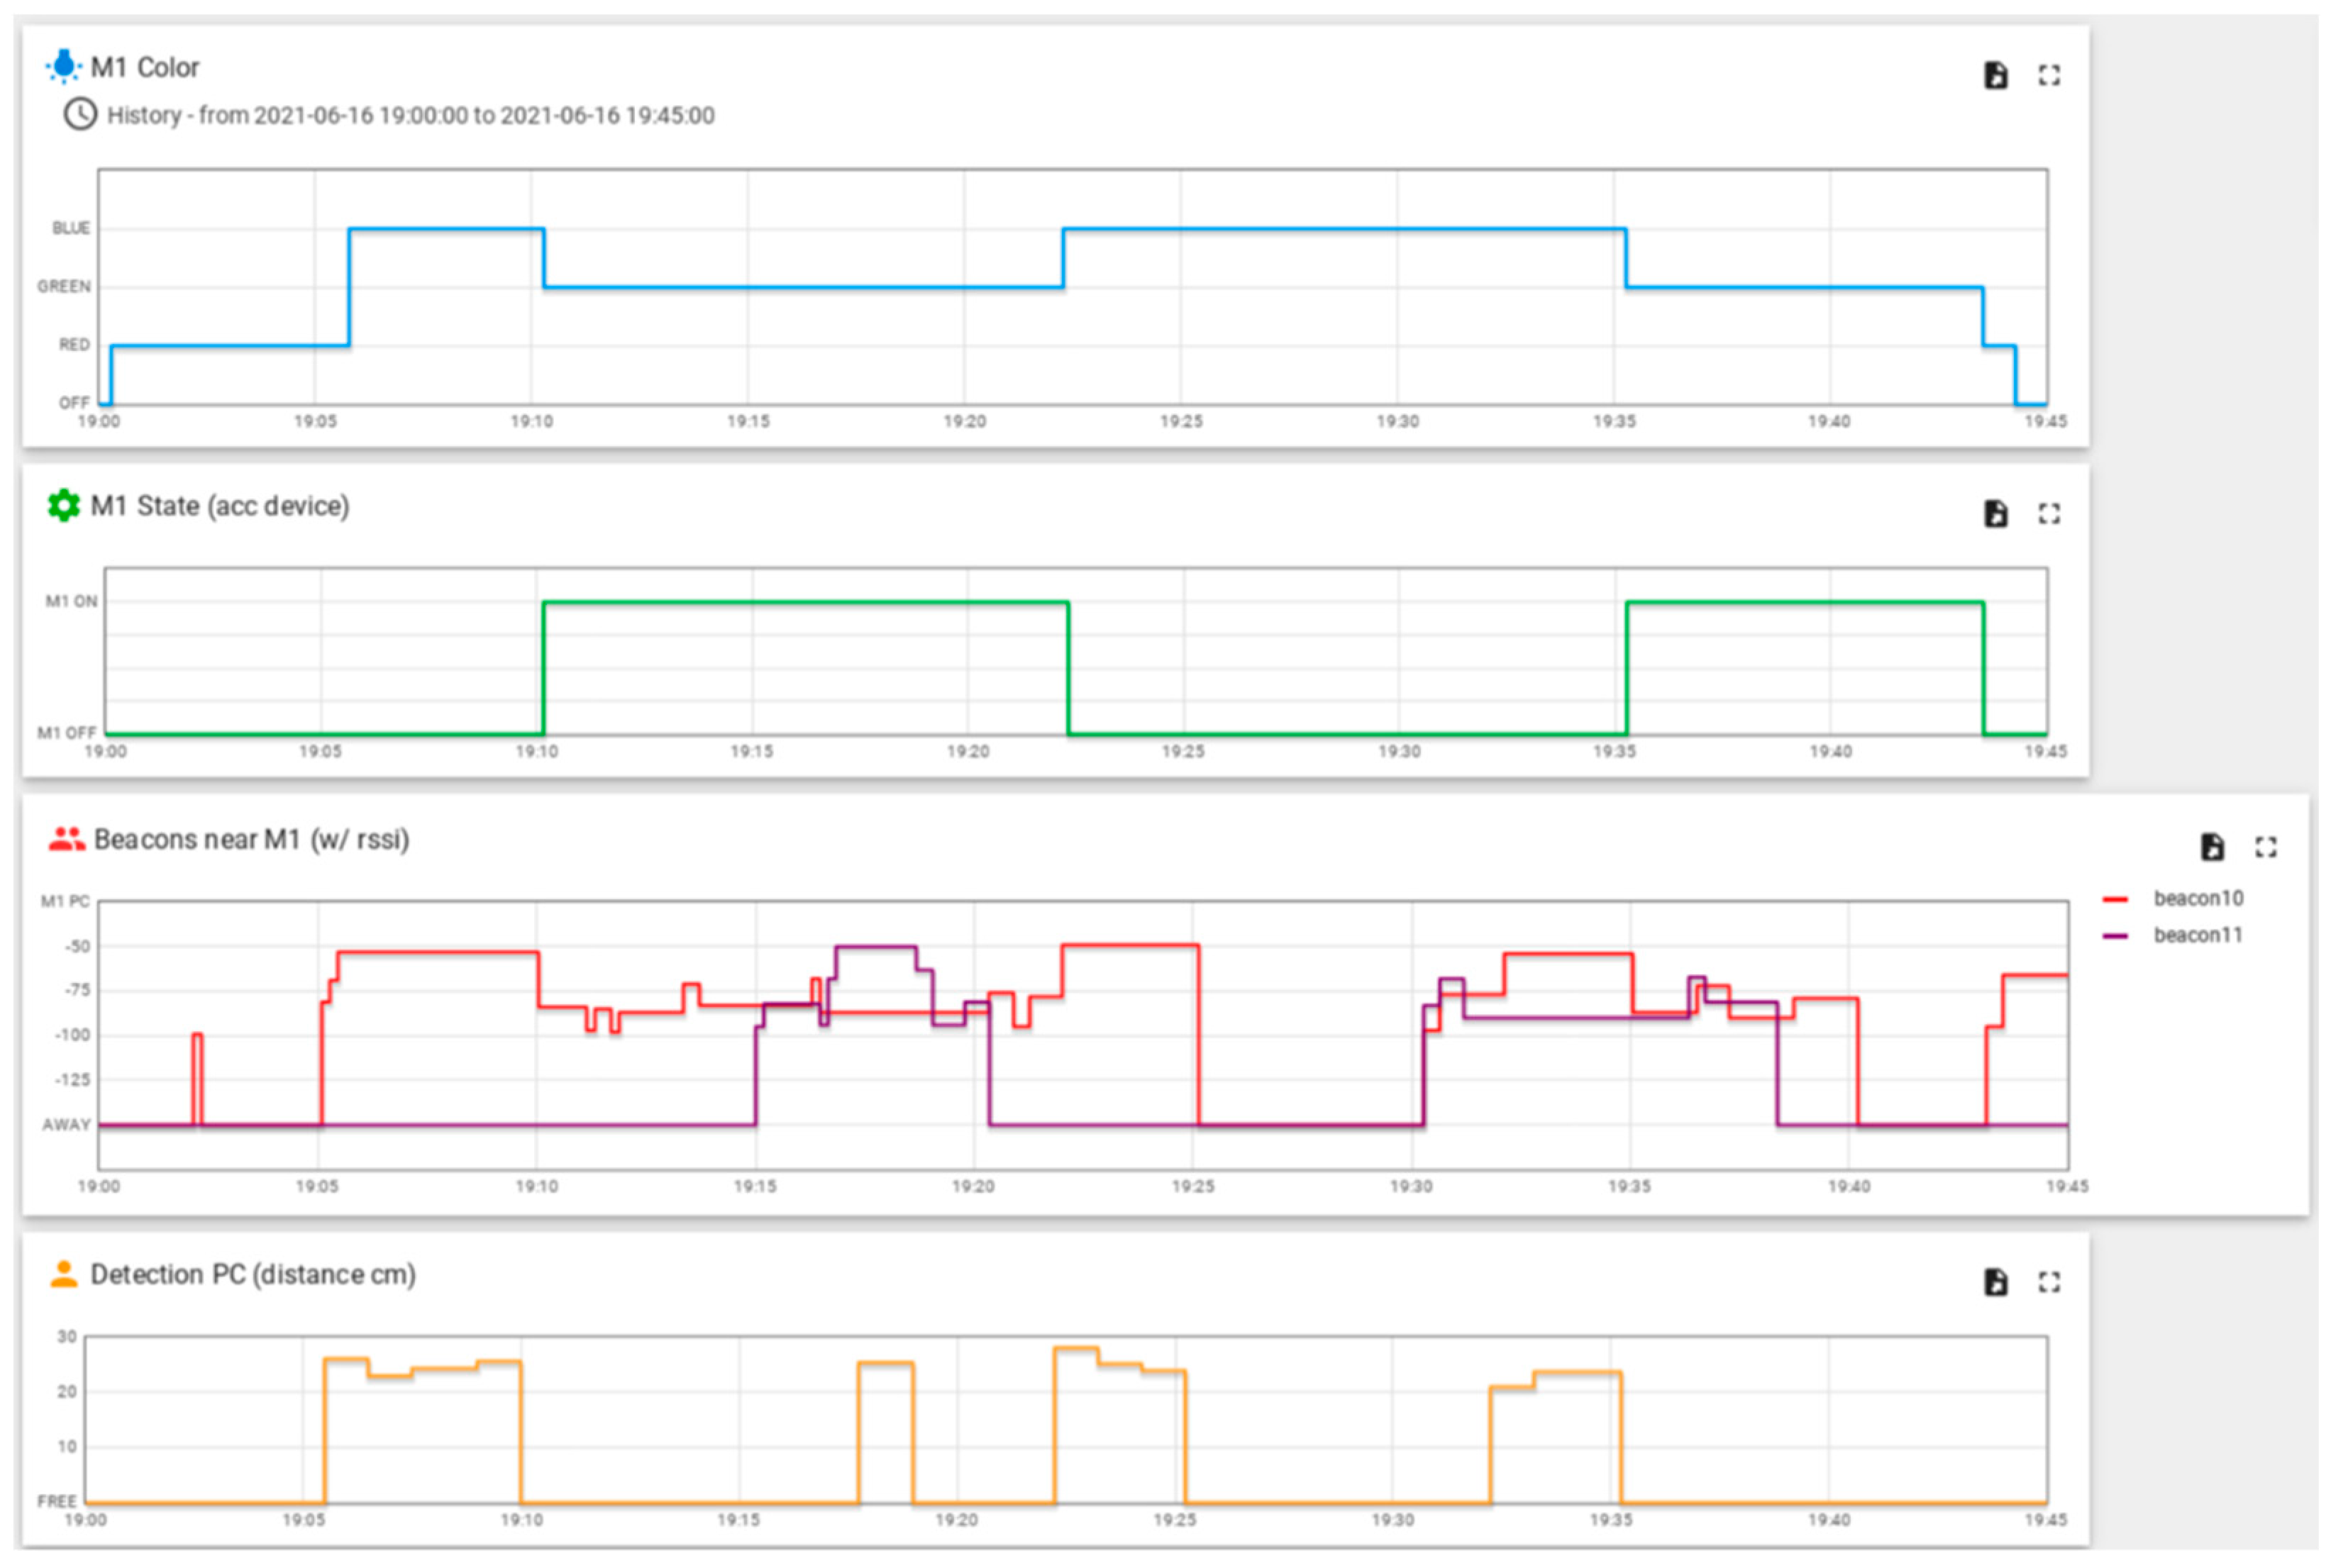
| N | Timestamp | Event | Sensor | Time Read |
|---|---|---|---|---|
| 1 | 19:00 | M1 RED | RGB | 19:01 |
| 2 | 19:05 | O10 NEAR M1 | BEACON | 19:05 |
| in front of COMPUTER | ToF | 19:05+ | ||
| 3 | 19:06 | M1 BLUE | RGB | 19:06+ |
| 4 | 19:10 | O10 away from computer | BEACON + ToF | 19:10 |
| M1 ON | VIBRATION | 19:10+ | ||
| M1 GREEN | RGB | 19:10++ | ||
| 5 | 19:15 | O11 NEAR M1 | BEACON | 19:15 |
| 6 | 19:17 | O11 in front of computer | ToF | 19:17 |
| 7 | 19:20 | O11 away from M1 | BEACON | 19:20+ |
| 8 | 19:22 | O10 in front of computer | ToF | 19:22 |
| M1 BLUE | RGB | 19:22 | ||
| M1 OFF | VIBRATION | 19:22 | ||
| 9 | 19:25 | O10 away from M1 | BEACON | 19:25+ |
| 10 | 19:30 | O10 and O11 NEAR M1 | BEACON | 19:30+ |
| 11 | 19:32 | O10 in front of computer | ToF | 19:32 |
| 12 | 19:35 | O10 away from computer | ToF | 19:35 |
| M1 GREEN | RGB | 19:35+ | ||
| M1 ON | VIBRATION | 19:35 | ||
| 13 | 19:38 | O11 away from M1 | BEACON | 19:38 |
| 14 | 19:40 | O10 AWAY FROM M1 | BEACON | 19:40+ |
| 15 | 19:43 | O10 NEAR M1 | BEACON | 19:43 |
| M1 RED | RBG | 19:43+ | ||
| M1 OFF | VIBRATION | 19:43+ | ||
| 16 | 19:45 | M1 COLOR OFF | RGB | 19:45 |
| Variables | Description | Prototype Node |
|---|---|---|
| M1-RGB | Indicates the color and timestamp of the changes in the light indicator of machine 1 that correspond to the state of the machine. {0: off, 1: red, 2: green, 3: blue} | RGB node |
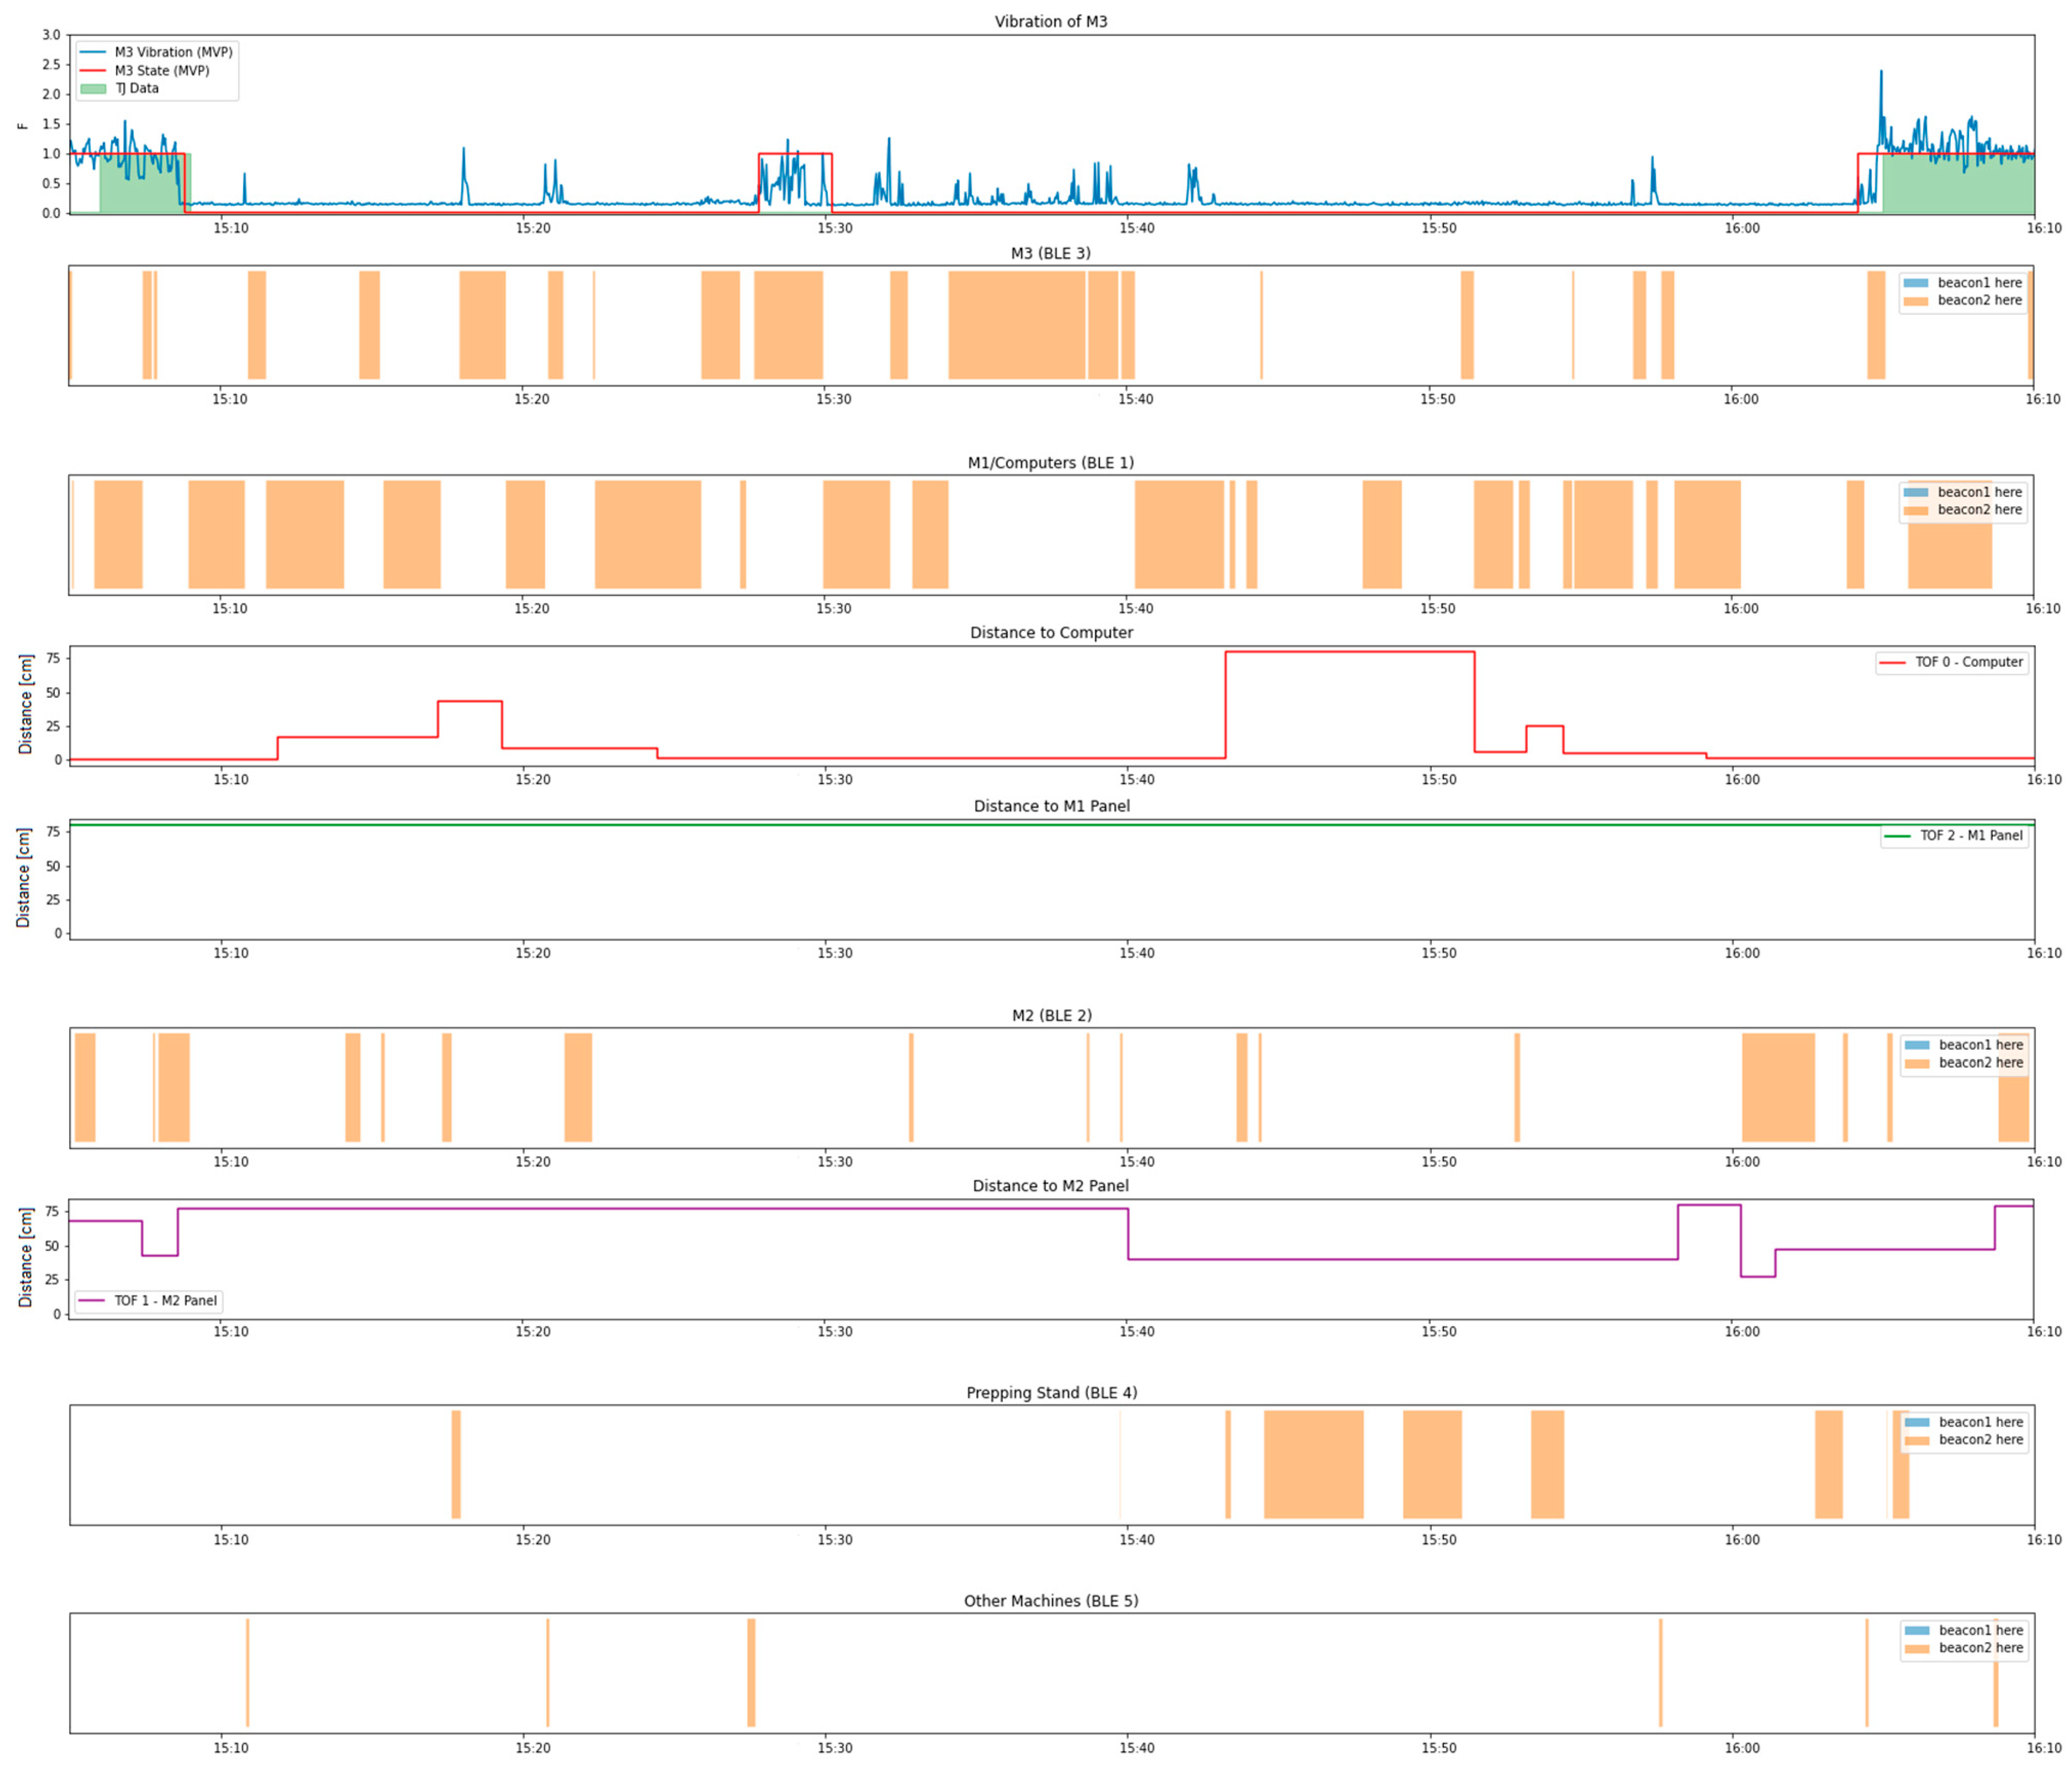
| M3V M3N | Contains the timestamp, vibration values (M3V) and noise energy values (M3N) captured from the frame of machine 3, which needs processing to provide categorical information about the machine’s state. | Vibration and noise node |
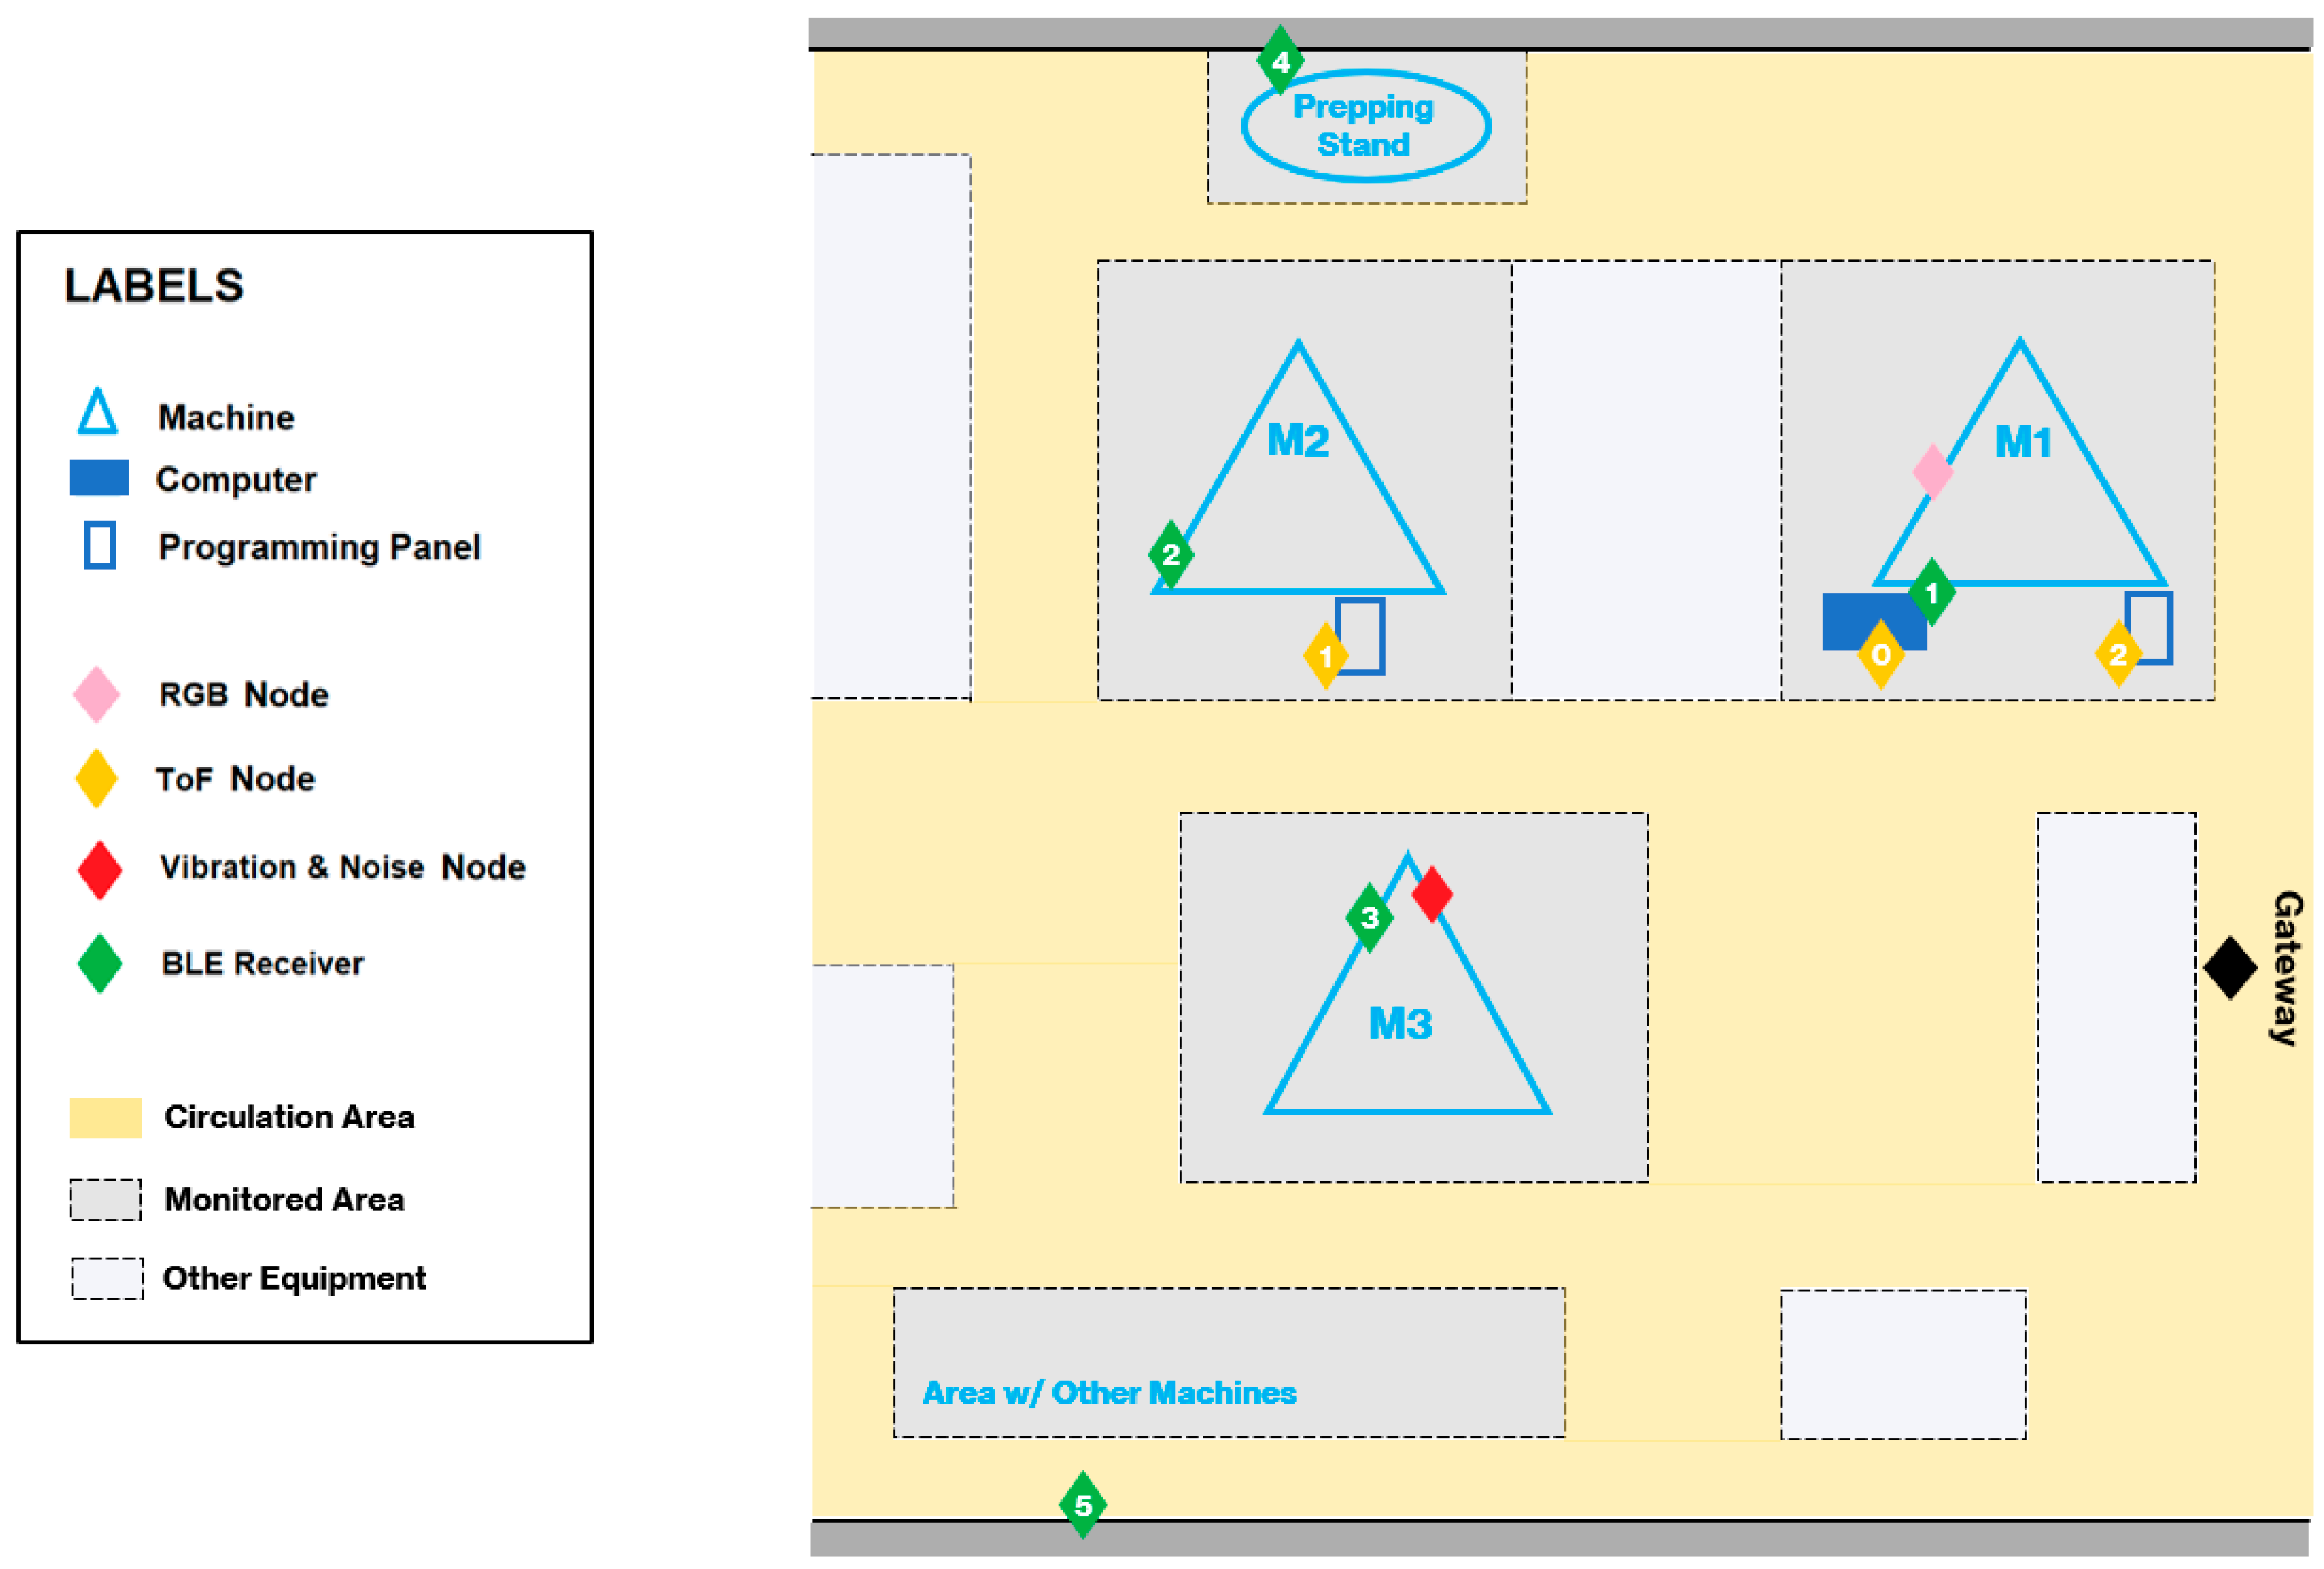
| Loc 1 Loc 2 Loc 3 Loc 4 Loc 5 | Contains the timestamp, the beacon ID (1—employee 1 or 2—employee 2), the state (0—away, 1—near) and the RSSI values captured by the BLE Receivers located near machine 1 (Loc 1), machine 2 (Loc 2), machine 3 (Loc 3), the prepping stand (Loc 4) and in the an extra area with some other machines (Loc 5). | BLE Receiver 1 BLE Receiver 2 BLE Receiver 3 BLE Receiver 4 BLE Receiver 5 |
| ToF 0 ToF 1 ToF 2 | Contains the timestamp and the distance to the first object in front of the devices attached the computers of machine 1 (ToF 0), and programing panels of machine 2 (ToF 1) and Machine 1 (ToF 2). | ToF node 0 ToF node 1 ToF node 2 |
| Machine 1 | Machine 3 | |||||||
|---|---|---|---|---|---|---|---|---|
| Weeks | ADD Prototype (RGB Node) | Company | Δ | Δ(%) | ADD Prototype (V&N Node) | Company | Δ | Δ(%) |
| 1 | 7 h 34 m | 7 h 32 m | 2 m | 0.1% | 41 h 28 m | 41 h 27 m | 1 m | 0.01% |
| 2 | 22 h 09 m | 22 h 10 m | 1 m | 0.03% | 46 h 18 m | 45 h 17 m | 1 h 1 m | 0.84% |
| 3 | 47 h 20 m | 42 h 35 m | 4 h 45 m | 3.95% | ||||
| 4 | 36 h 40 m | 36 h 53 m | 13 m | 0.18% | ||||
| 1 a 4 | 29 h 43 m | 29 h 42 m | 1 m | 0.10% | 171 h 45 m | 166 h 12 m | 5 h 33 m | 1.16% |
| Prototype | Company | Δ(%) | |
|---|---|---|---|
| Number of MS | 109 | 108 | 0.9% |
| MS Total Time | 13 h 50 m | 14 h 55 m | 7.3% |
| Total MSs | Mean MS Duration | Median MS Duration | |
|---|---|---|---|
| MS with Employee Action | 79 | 8 m 30 s | 7 m |
| MS without Employee Action | 30 | 4 m | 3 m 12 s |
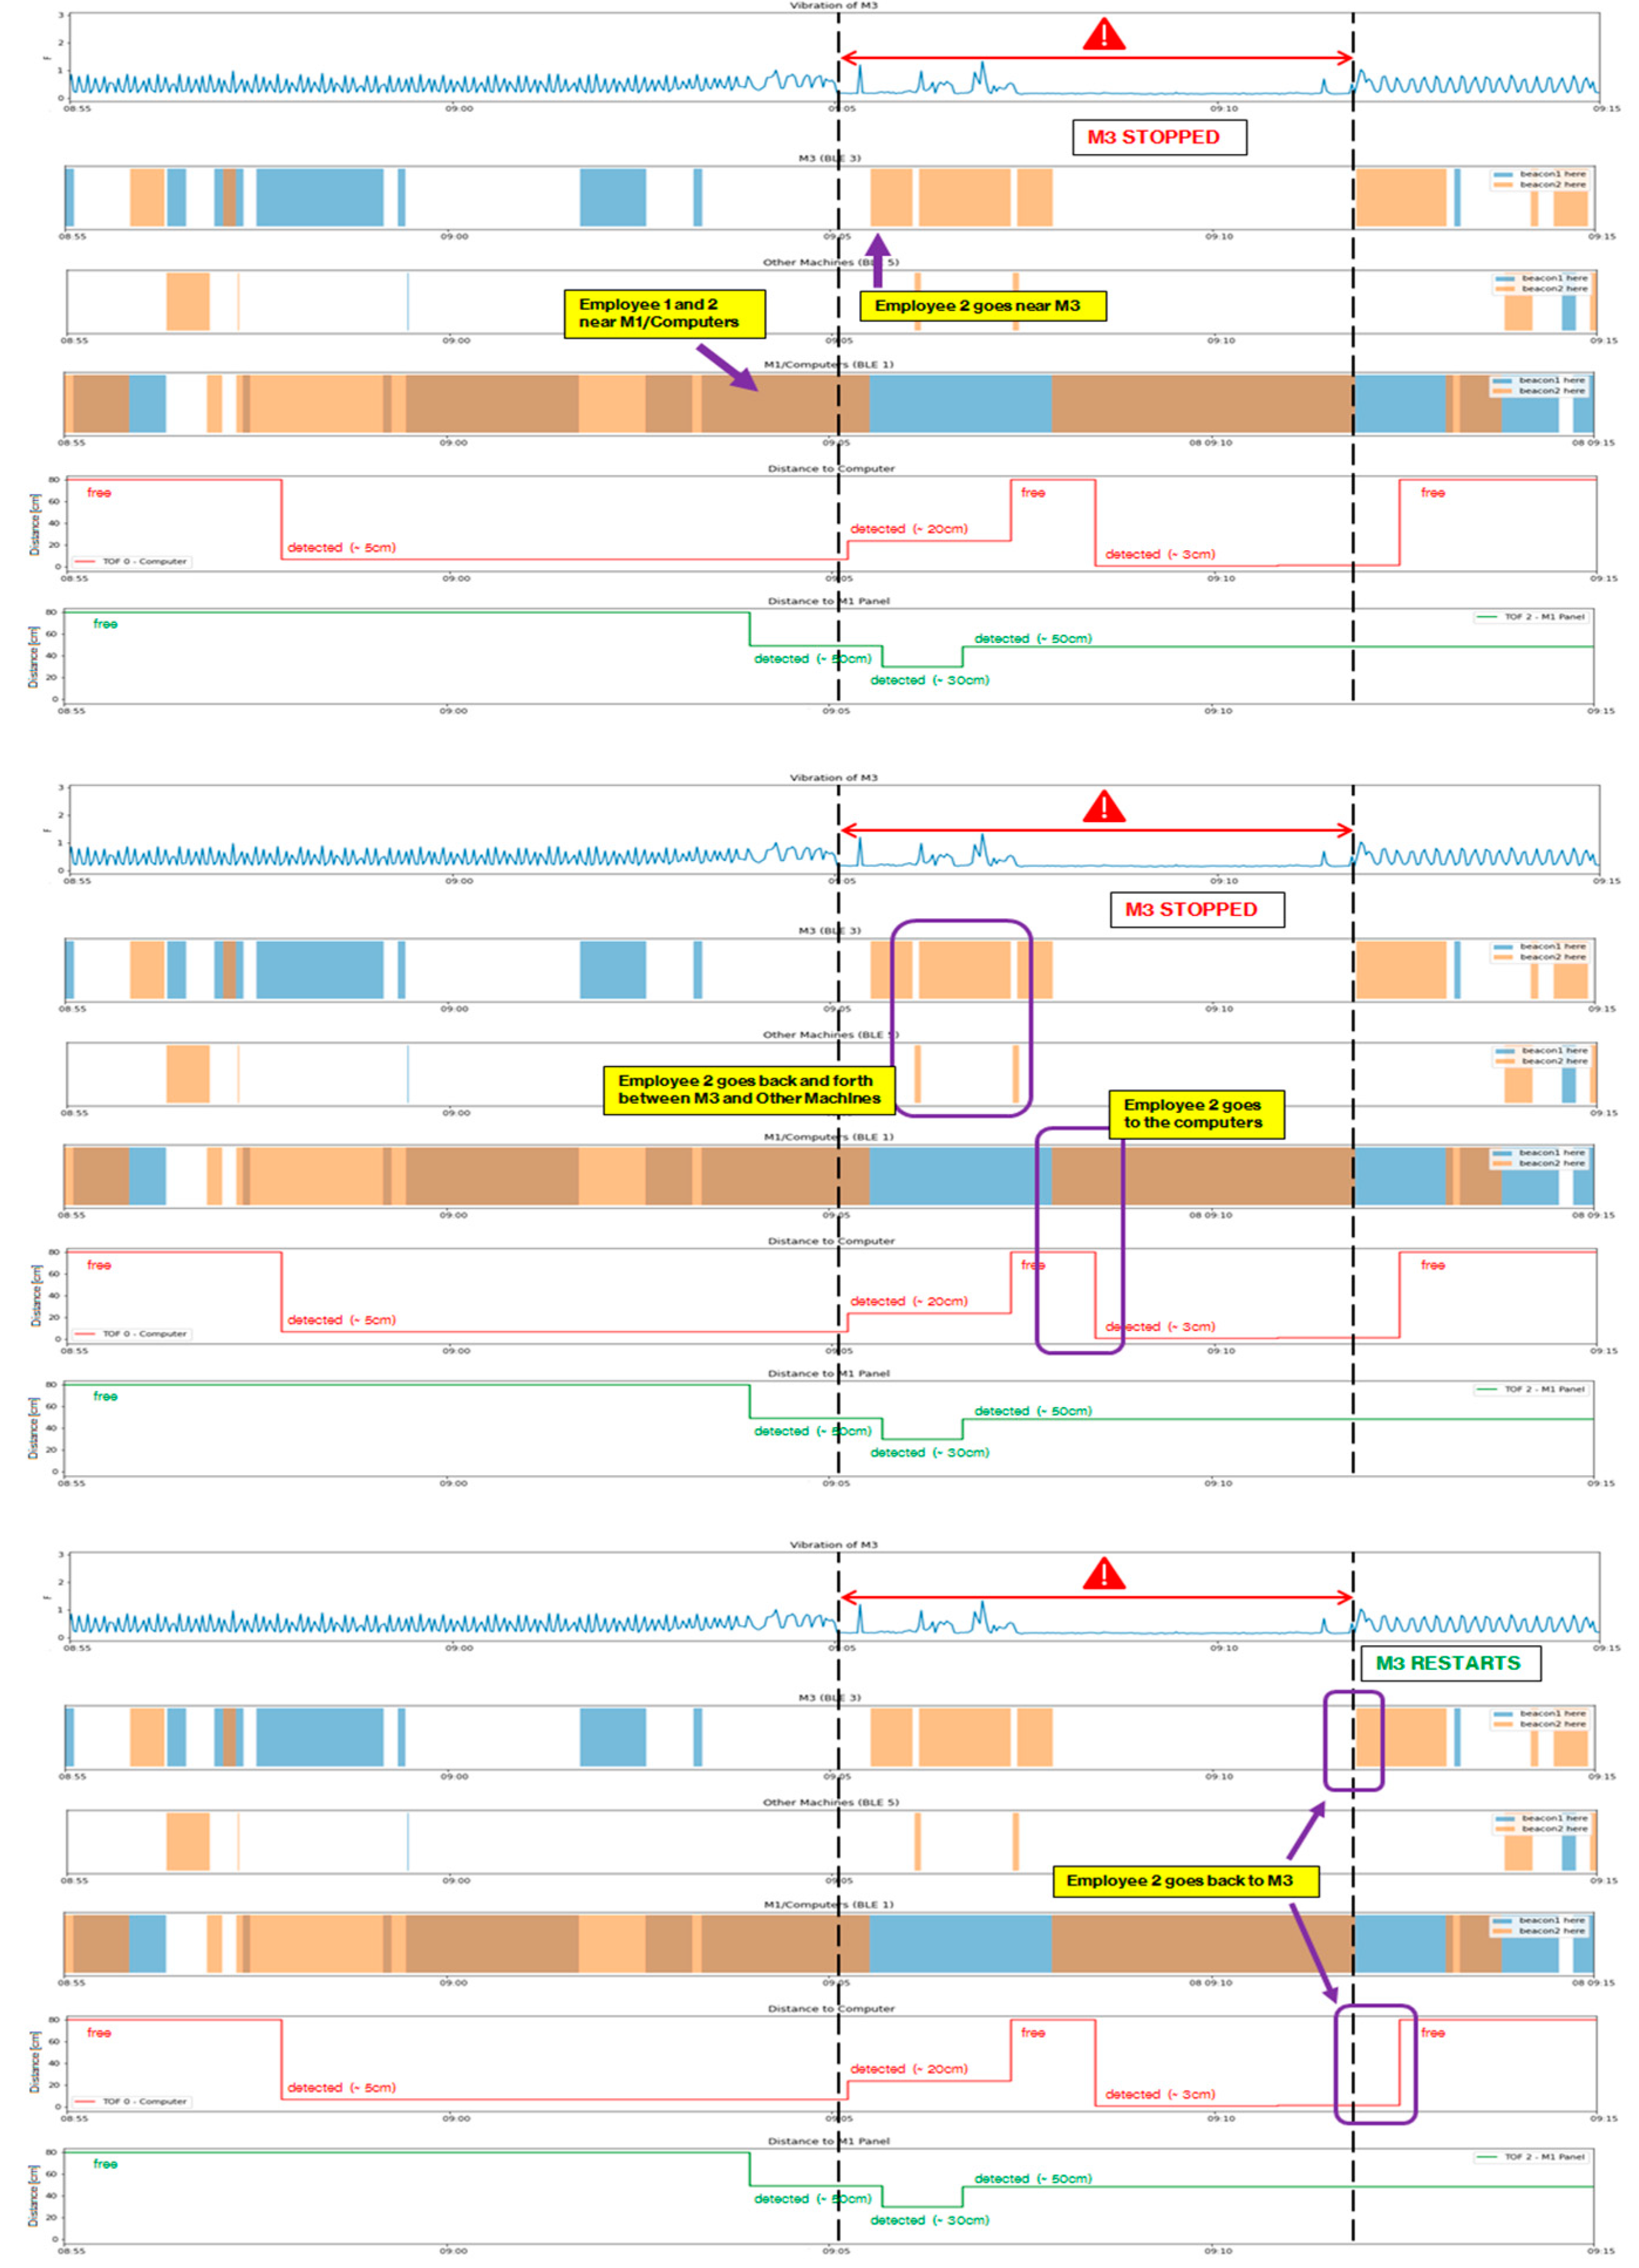
| N° | Timestamp | Event |
|---|---|---|
| 1 | 08:55–9:00 | O10 Displacement M3 to M1/computers |
| O11 NEAR M1 | ||
| 2 | 09:05 | M3 MICRO STOPS |
| 3 | 09:06 | O11 NEAR M3 |
| 4 | 09:06–09:07 | O11 Displacement M3 to other machines |
| 5 | 09:08 | O11 NEAR M1/Computers |
| 6 | 09:08–09:12 | O11 in front of computer |
| 7 | 09:12 | O11 NEAR M3 |
| 8 | 09:12 | M3 RESTARTS |
Publisher’s Note: MDPI stays neutral with regard to jurisdictional claims in published maps and institutional affiliations. |
© 2022 by the authors. Licensee MDPI, Basel, Switzerland. This article is an open access article distributed under the terms and conditions of the Creative Commons Attribution (CC BY) license (https://creativecommons.org/licenses/by/4.0/).
Share and Cite
Martinho, R.; Lopes, J.; Jorge, D.; de Oliveira, L.C.; Henriques, C.; Peças, P. IoT Based Automatic Diagnosis for Continuous Improvement. Sustainability 2022, 14, 9687. https://doi.org/10.3390/su14159687
Martinho R, Lopes J, Jorge D, de Oliveira LC, Henriques C, Peças P. IoT Based Automatic Diagnosis for Continuous Improvement. Sustainability. 2022; 14(15):9687. https://doi.org/10.3390/su14159687
Chicago/Turabian StyleMartinho, Rita, Jéssica Lopes, Diogo Jorge, Luís Caldas de Oliveira, Carlos Henriques, and Paulo Peças. 2022. "IoT Based Automatic Diagnosis for Continuous Improvement" Sustainability 14, no. 15: 9687. https://doi.org/10.3390/su14159687