Article

Electrophysiological Brain Response to Error in Solving Mathematical Tasks

by
Francisco J. Alvarado-Rodríguez
1,2,
Karla P. Ibarra-González
3,
Cristina Eccius-Wellmann
3,
Hugo Vélez-Pérez
4,* and
Rebeca Romo-Vázquez
4,*
1
Departamento de Ciencias Computacionales, CUCEI, Universidad de Guadalajara, Guadalajara 44430, Jalisco, Mexico
2
Departamento de Electromecánica, Universidad Autónoma de Guadalajara, Zapopan 45129, Jalisco, Mexico
3
Facultad de Ciencias Economicas y Empresariales, Universidad Panamericana, Zapopan 45010, Jalisco, Mexico
4
Departamento de Bioingeniería Traslacional, CUCEI, Universidad de Guadalajara, Guadalajara 44430, Jalisco, Mexico
*
Authors to whom correspondence should be addressed.
Mathematics 2022, 10(18), 3294; https://doi.org/10.3390/math10183294
Submission received: 27 June 2022 / Revised: 3 September 2022 / Accepted: 7 September 2022 / Published: 11 September 2022

Abstract

:
Objective: to identify energy patterns in the electrophysiological bands of the brain as possible indicators of overconfidence in students when they receive feedback indicating they have erred while solving a mathematical task. Methodology: EEG were recorded from 20 subjects while they performed mathematical exercises. Energy changes in the delta and theta bands before, during, and after solving the task were analyzed. Results: when the answers to the exercises were shown, an increase of energy in the delta band was observed in participants with correct answers but a reduction in that band in those who answered incorrectly. Subjects with incorrect answers received feedback and then attempted to solve a second, similar, exercise. Subjects who answered correctly showed an increase of energy theta, while those with incorrect answers showed a decrease. Conclusions: the energy changes when subjects erred while solving a mathematical task could serve as a quantitative indicator for characterizing overconfidence.
MSC:
97U70; 97C30; 97D70

1. Introduction

One of the main challenges in the field of education involves developing quantitative indicators that make it possible to objectively evaluate learning processes and thus improve students’ performance [1]. The most common indicators employed to identify levels of learning include the number of correct answers and response times [2]. However, these indicators do not contemplate the cognitive processes or cerebral dynamics that could allow us to better understand learning processes. Cerebral dynamics can be studied using such techniques as electroencephalography (EEG), magnetoencephalography (MEG), and functional magnetic resonance (fMRI). Of these options, EEG is the one best-known and most often utilized, due to its high temporal resolution, non-invasiveness, low cost, and portability. These properties make EEG the preferred technique for performing studies of this nature in educational spaces [3]. Analyses of cerebral activity based on EEG recordings has led to the identification of specific patterns during learning processes [1] that are generating great interest, especially in the field of virtual learning since they offer a means to monitor and evaluate students’ performance remotely that does not depend on subjective self-evaluation questionnaires [4].
EEGs have been used to understand learning processes for over three decades [5]. Patterns of cerebral activation have been associated with such cognitive processes as working memory, solving exercises in situations that subjects find complicated or confusing [6,7], evaluating states of attention [4], and assessing anxiety generated by working with mathematics [8]. Those approaches have opened the possibility of detecting patterns based on EEG recordings that identify the element of overconfidence in students. Defining overconfidence (OC) requires analyzing the following question: if students accept as valid certain concepts and procedures that they have developed in a deficient way, then how accurate can their self-evaluations of those processes be? Research has shown that a significant bias exists when people consider their procedures to be correct [9]. Students may be “sure” that their approach and answers to math exercises are correct, when in reality this is not so. This bias is called overconfidence [10] and is understood as a distortion between subjective and real success, or as students’ inability to distinguish whether a process is performed correctly or not [11]. If students judge their answers to be correct when, in fact, they are incorrect, they will show “surprise” when they learn that they erred. This behavior is related to OC, such that the greater the bias of confidence, the greater the “surprise” reaction when it is revealed that their answer was wrong. In their work, Moore and Schatz [12] mention that the more confident one is in their beliefs, the more surprise there is when these beliefs turn out to be incorrect. They also confirm that the prevailing hypothesis in the literature is that predictions made with greater confidence produce greater surprise when they are incorrect. Finally, they conclude that prior confidence and posterior surprise are completely associated and that, when one is right, greater prior confidence produces less posterior surprise, but, if one is wrong, greater prior confidence produces more posterior surprise.
The human brain is designed to detect and evaluate challenging situations and events that could produce some type of reward. This leads people to generate behaviors that are appropriate for specific scenarios, such as fleeing from threats or approaching opportunities [13]. Committing an error can be considered a dangerous or threatening situation because mistakes tend to be sanctioned or punished [14]. When individuals perceive an error, their brain generates an alarm signal through the electrical potential that leads them to understand their mistake as a threatening situation influenced by individual or contextual factors that modulate intensity [13] or after receiving both positive and negative feedback on their decisions and that they have a self component [15]. This potential involves the anterior cingulate cortex, which is closely-linked to the limbic system and prefrontal cortex [13]. The limbic system is in charge of functions that include the emotions and memory. The planning of behavior, decision-making, reasoning, working memory, and exercise-solving are all functions associated with this brain region [16] that also play fundamental roles in the process of teaching and learning mathematics and, therefore, in solving math exercises. In addition, when an error is committed, the resulting cerebral activation can be translated into emotions that affect attention and memory, thus negatively impacting the learning of mathematics [17].
The potentials associated with error and feedback can be estimated using EEGs [18] and are related to changes in cerebral activity, specifically in the delta (1–3 Hz) and theta (4–7 Hz) bands [19]. The theta band is associated with responses of an emotional nature [20] and states of attention [21,22,23]. In addition, a positive correlation has been found between an increase in theta in center-frontal regions and a relative increase in task difficulty, after feedback on the mistakes made [15], as the number of errors and reaction times in the development of tasks that require mental effort and vigilance increase [24]. In other findings, increases in the energy of the delta band during mental tasks have been associated with processes of functional cortical difference, or inhibition of the sensorial entrances that can interfere with concentration in internal processes [25].
Against this background, the present study focused on analyzing the behavior of the delta and theta bands in relation to the electrical potential generated by errors while students were solving math exercises, and the element of OC that some students present when they consider their answers to the exercise posed to be correct when, in fact, they are not. This approach led us to ask: what energy patterns in the delta and theta bands can be identified as possible indicators of overconfidence (OC) in students when they realize that they have erred on a math task?

2. Materials and Methods

2.1. Participants

Participants were 20 healthy engineering students (13 young men, 7 young women) with an average age of 18.73 ( ± 0.65 ) years. They had no reports of any cognitive illness, and their intellectual coefficients were tested with the Raven’s Progressive Matrices Test: Advanced Scale, a non-verbal test that assesses intelligence and reasoning. All subjects scored in grade III, which means a percentile score between 50–74 that corresponds to average normal intellectual ability. All participants mastered the algebraic bases required to solve the tasks presented. Before participating, they signed an informed consent that explained the entire experimental protocol.

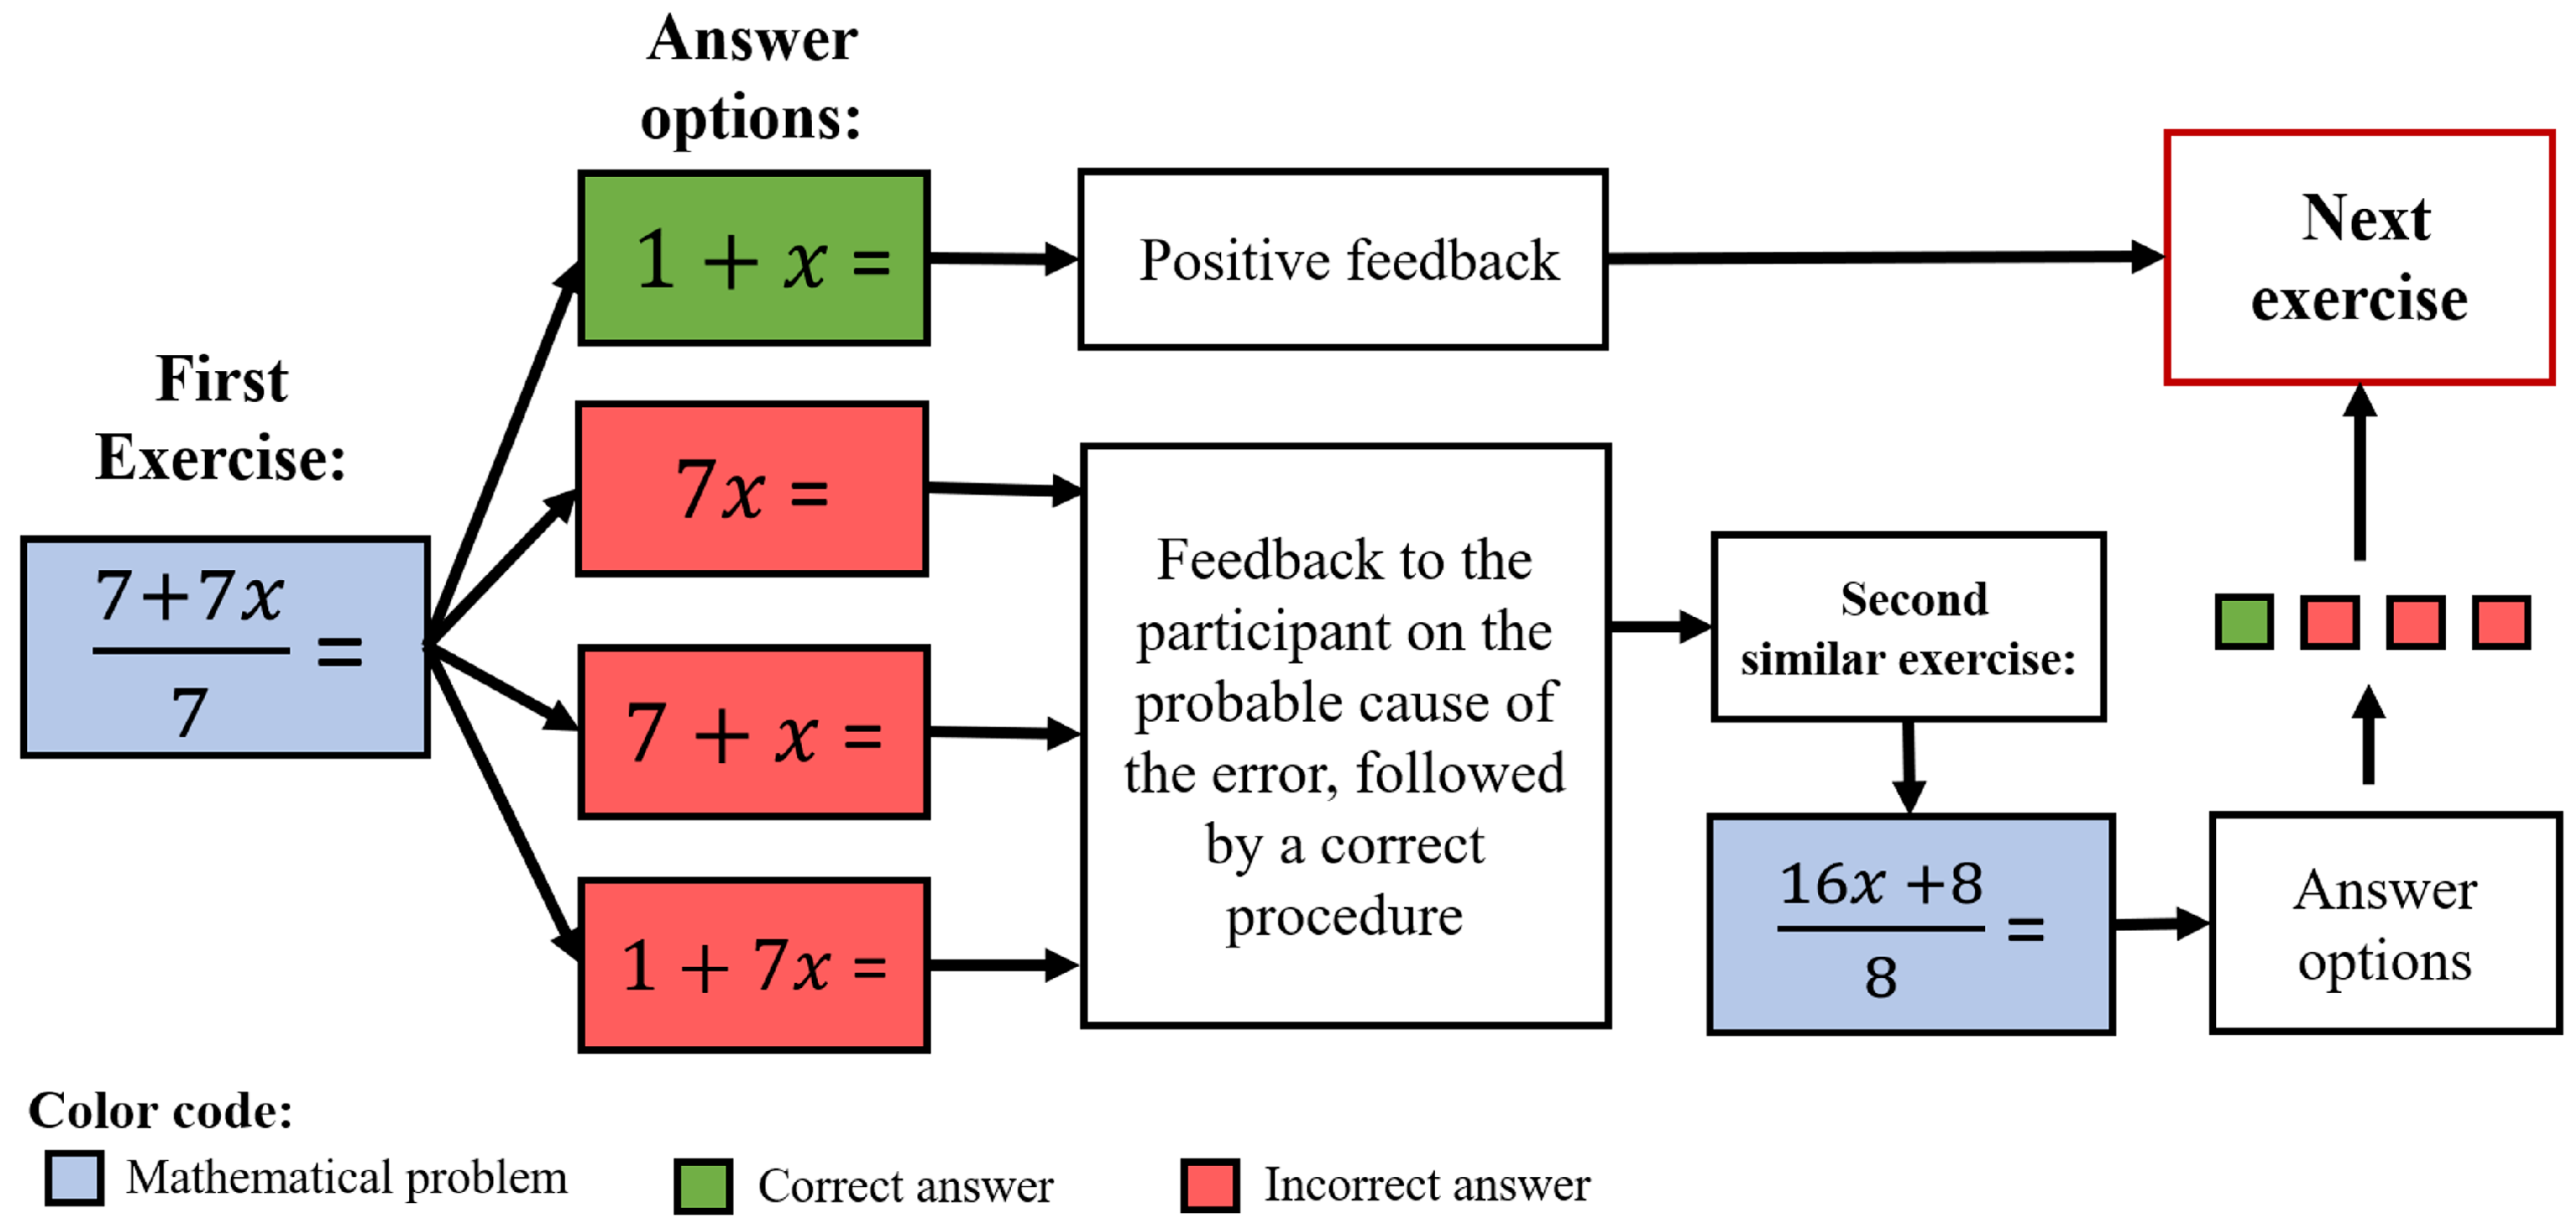
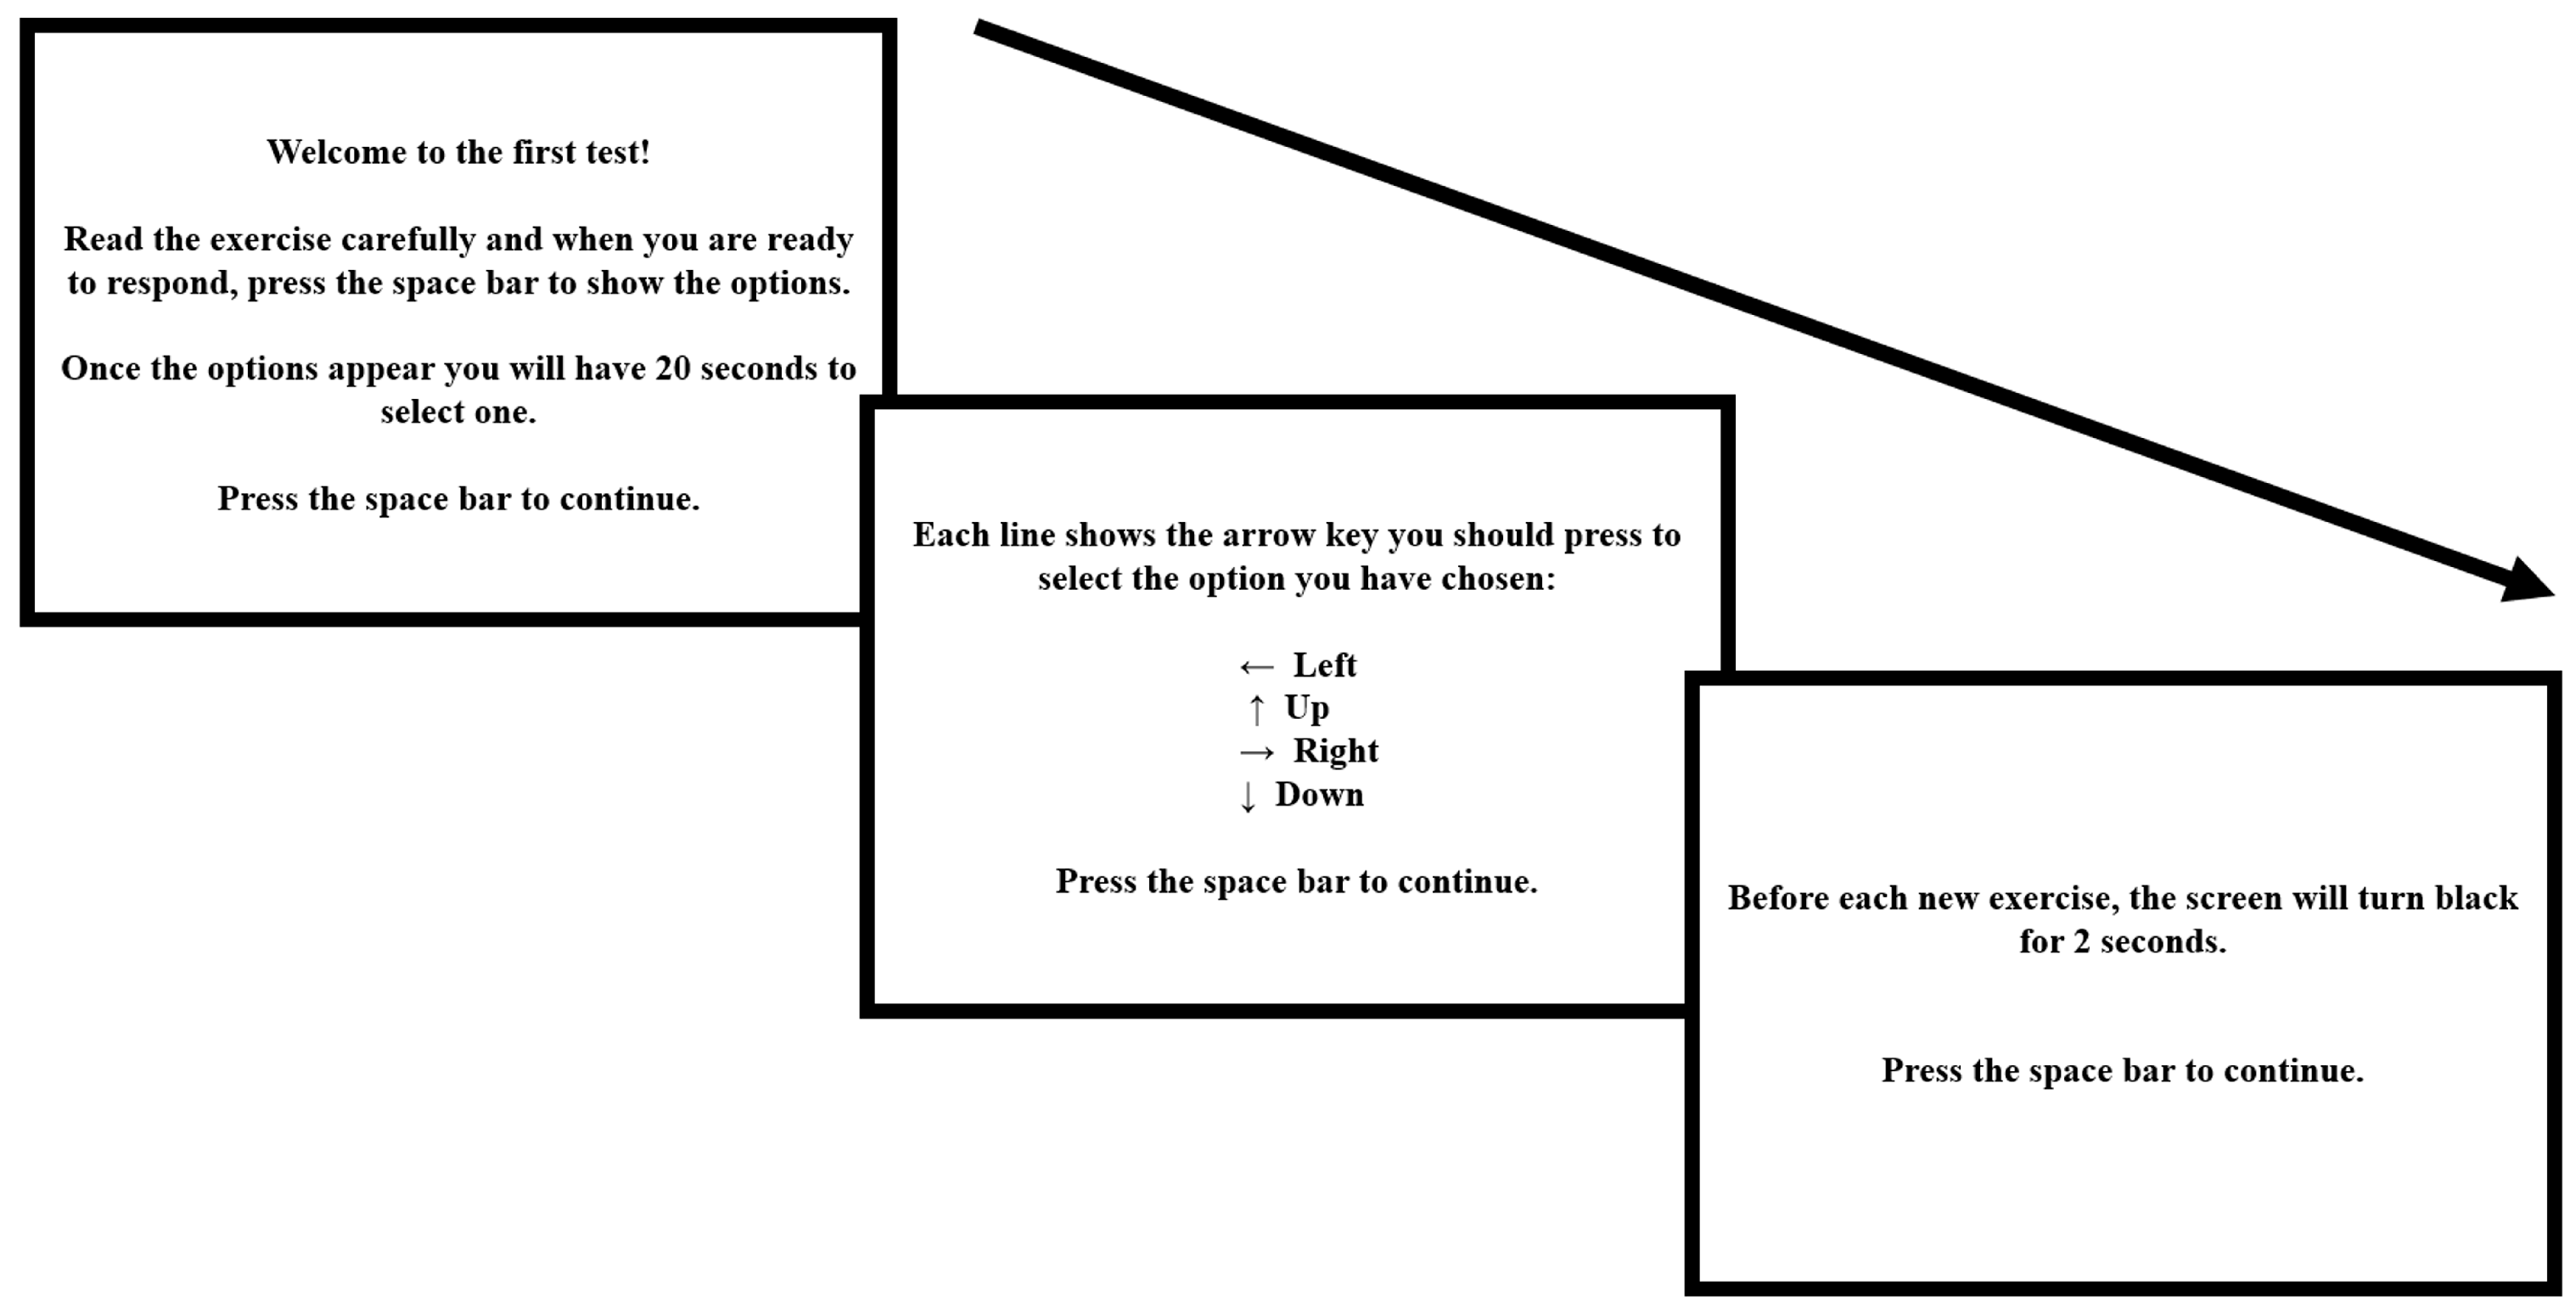
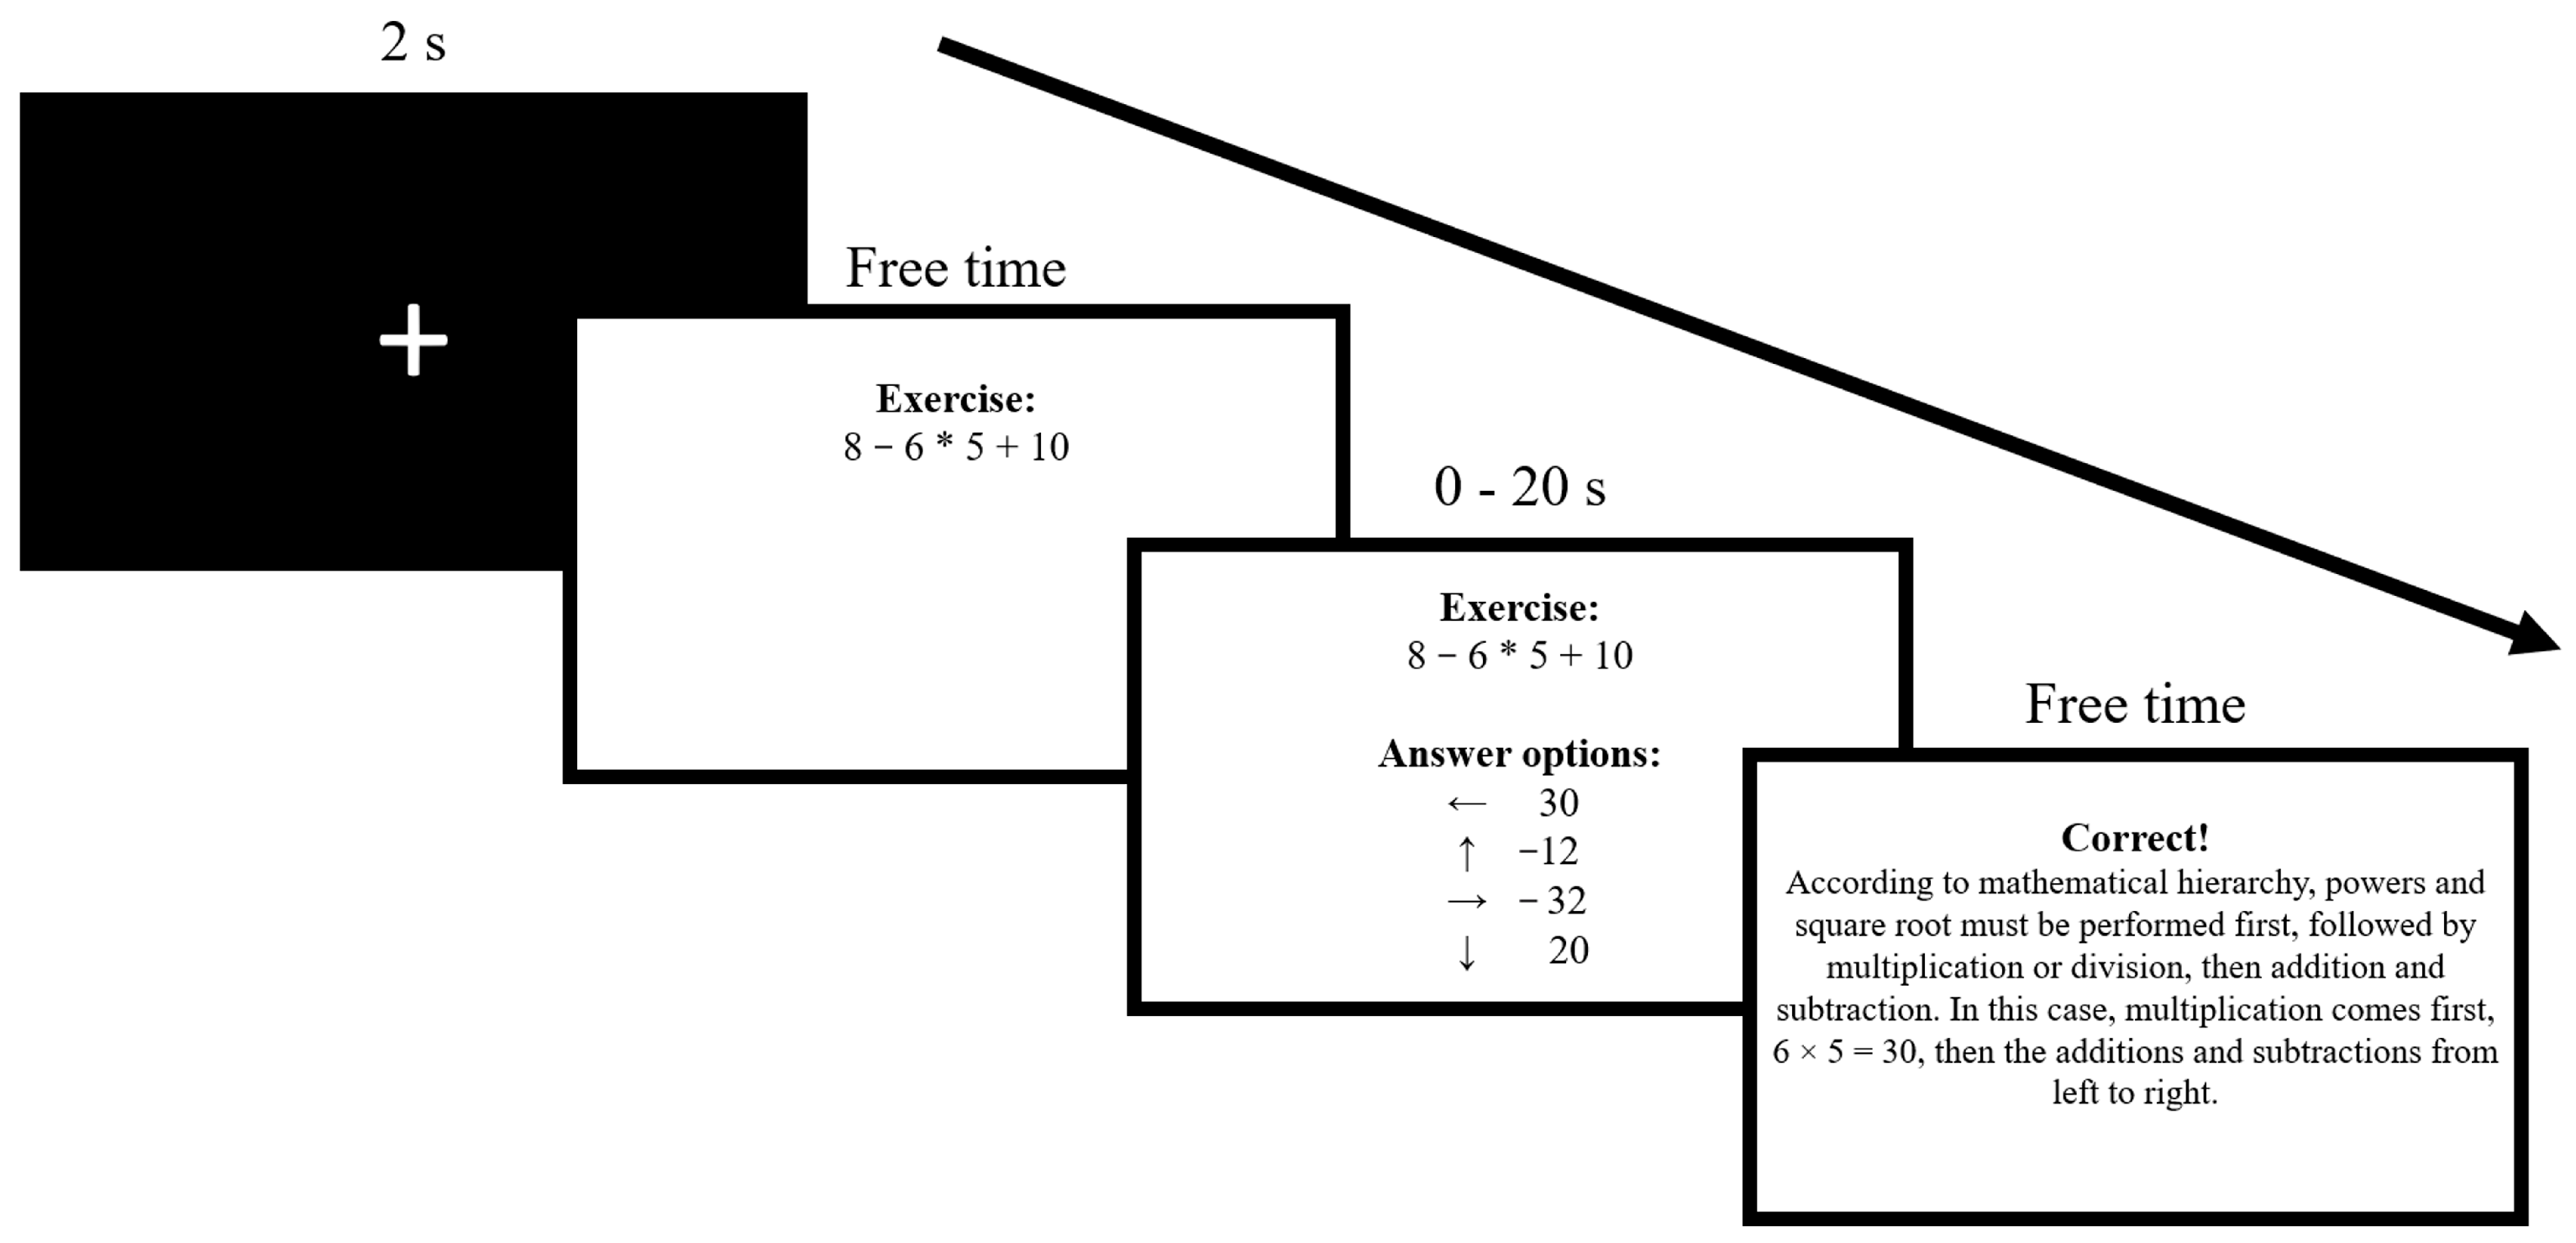
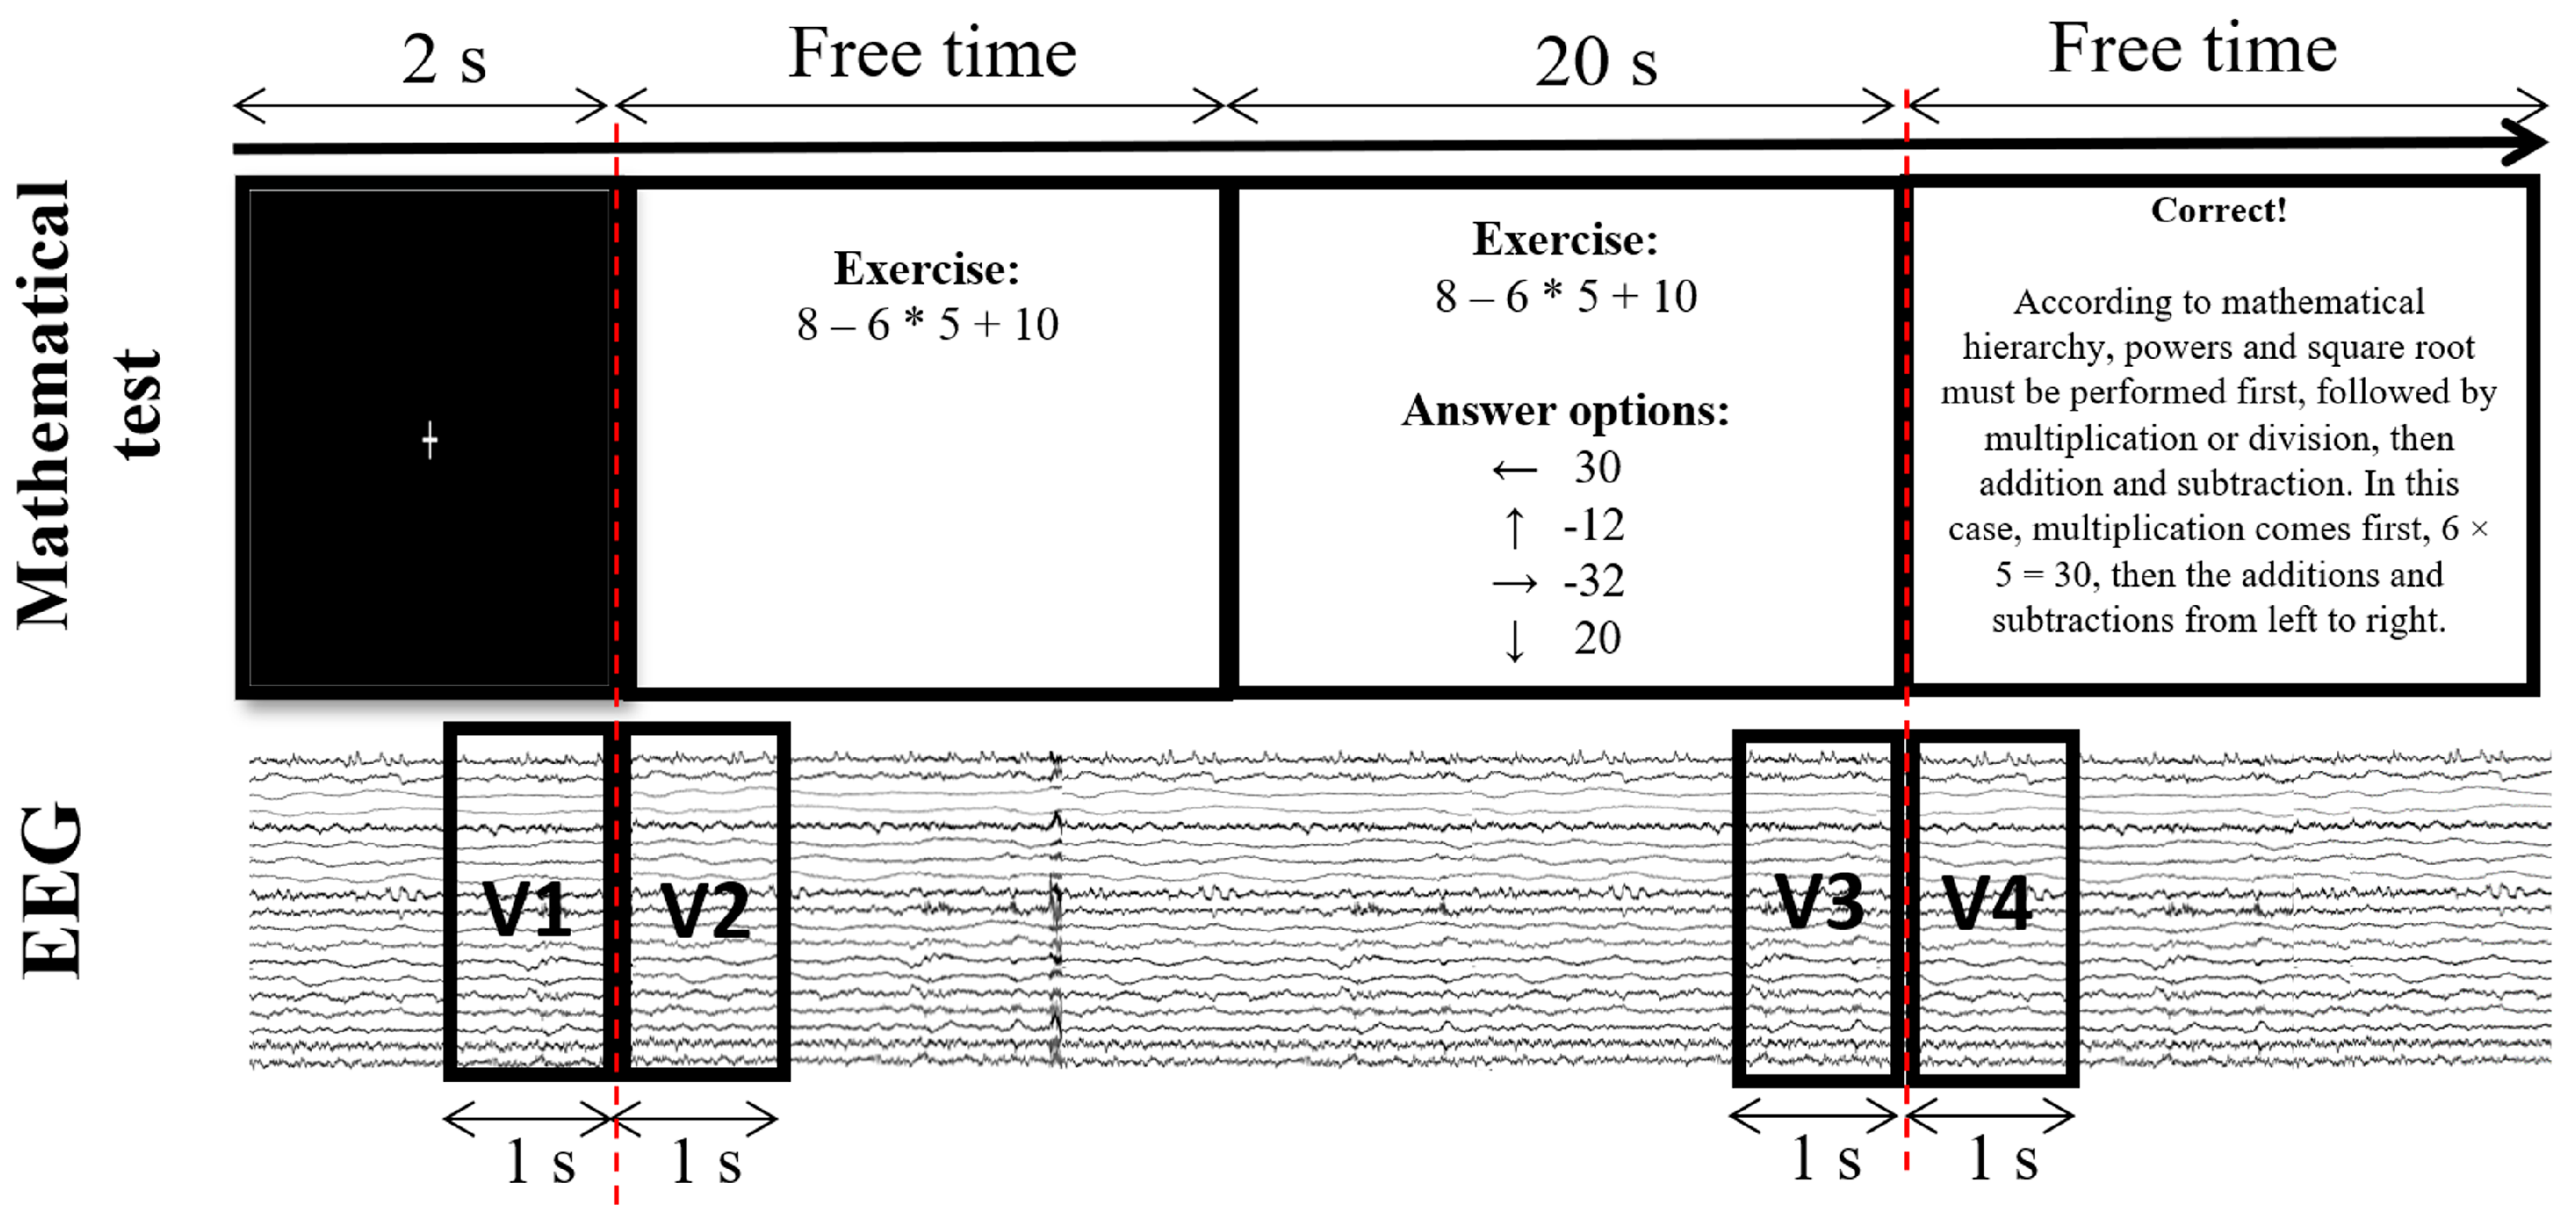
2.2. Experimental Task

The task designed consisted of 10 multiple-choice exercises whose solutions required arithmetic or algebraic operations that correspond to secondary- and high school-level mathematical content (Appendix A). The exercises included concepts of mathematical hierarchy, simplification of algebraic fractions, factorization, and handling radicals. The response options for each exercise presented the correct answer and three incorrect options. The latter is based on the most common errors that students make (Figure 1). In the exercise shown in Figure 1 (blue square), students tend to make one of the three errors indicated in the red boxes, common mistakes often repeated in similar exercises. Each erroneous answer reflects a specific misconception of the simplification of algebraic fractions, so the feedback given after the specific error corresponded to the concrete misconception. In other words, the feedback given depended on the answer option selected.
Each one of the 10 exercises was designed so that the student could find an answer (correct or incorrect) among the four most common responses. These kinds of “typical” errors are easily recognized by the students who make them. Indeed, thanks to the “easy” cancelation process they use, they may be confident that their answer is correct.
Prior to initiating the task, participants were shown instructions on a computer screen. These directions included indicating whether or not they considered or expected their answers correct. Hereupon, a training exercise was performed. They had unlimited time to read and understand them (Figure 2). When they indicated that they were ready to begin the task, they were asked to press the space bar on the keyboard. Before each exercise, the screen went dark, showing only a white cross in the center where subjects were asked to focus their gaze for 2 s. After this 2-s pause, the exercise was displayed, and they had an unlimited amount of time to read and solve the exercise mentally. When the subject felt ready, she/he pressed the space bar again and the screen showed the four answer options for that exercise. Participants were allowed 20 s to choose their answer. If the answer selected was correct, the screen presented feedback that consisted of a brief explanation of the solution to the exercise intended to reinforce the subject’s knowledge. At the conclusion of this sequence, the participant passed to the next exercise by pressing the space bar to make the dark screen with the white cross appear (Figure 3).
In contrast, when the answer chosen was incorrect, the screen presented pertinent feedback by showing an explanation of the probable cause of the subject’s error. Following that, a second exercise was displayed in a similar context to the previous one (Figure 4). Students were instructed to solve this second exercise as well. In this case, however, whether or not the answer was correct, the task proceeded to the next item in a different context.

2.3. Recording Cerebral Activity

Subjects’ cerebral electrical activity was recorded simultaneously with the performance of the task using a professional, GRASS-COMET brand, clinical-grade electroencephalograph (EEG) at a sampling frequency of 200 Hz, utilizing 19 electrodes placed following the 10-20 International System (Fp1/2, F3/4, F7/8, C3/4, P3/4, T3/4, T5/6, O1/2, Fz, Cz, and Pz). To reduce external interference, all recordings and tasks were conducted in an illuminated, acoustically-controlled room. Subjects were seated on a chair in front of the monitor where the instructions and tasks were displayed. To reduce artifacts in the EEG recordings, and to prevent distractions (perturbations) that could affect the development of the testing process, they were instructed to make as few movements as possible and to limit blinking.

2.4. Behavioral Analysis

Descriptive analyses were elaborated using IBM® SPSS® Statistics 23 for the relative number of correct and incorrect answers and each participant’s reaction times. Behavioral measures were analyzed using a non-parametric test (Wilcoxon ranks), due to the small sample size.

2.5. Electrophysiological Analysis

For the electrophysiological analysis, we considered only those EEG segments where subjects responded to the exercises. All segments were of 1-s duration to guarantee the quasi-stationarity of the EEG signals [26,27,28] and to be able to correctly implement a frequency analysis. (Figure 5). Based on these segments, we selected 1-s windows at four instants of interest: (a) before seeing the math exercise (V1); (b) after seeing the math exercise (V2); (c) before choosing an answer (V3); and (d) when the feedback appeared in response to their selection (V4). Although participants were urged to minimize their movements, some artifacts related to cerebral activity were recorded. To eliminate the influence of ocular and muscular artifacts and electrical interference, the windows selected were subjected to a pre-processing stage [29]. This step was based on the Blind Source Separation (BSS) technique. The main BSS hypothesis states that the artifact sources are independent from brain sources, either normal or pathologic. The goal is to recover the original sources (brain and artefactual), given only sensor observations.
After pre-processing, the power spectrum of each channel was calculated using Fast Fourier Transformation (FFT). To evaluate the effects of OC, each one of the four windows was averaged (µV1, µV2, µV3, µV4) in four different conditions: (1) first exercise answered correctly; (2) first exercise answered incorrectly; (3) second exercise answered correctly; and (4) second exercise answered incorrectly. The next step involved estimating the average power spectrum of each window described in order to obtain the relative energy of each band: delta (1–3 Hz), theta (4–7 Hz), alpha (8–13 Hz), and beta (14–30 Hz). Relative energy was calculated by Equation (1), where E B r represents the relative energy of the band of interest, EB the absolute energy of that band of interest, and E δ , E θ , E α , and E β the absolute energies of each band:
E B r = E B E δ + E θ + E α + E β
Since the study was designed to identify cerebral electrical activity in the presence/absence of mathematical errors, the approach focused on, and was limited to, the behavior of the center-medial region of the brain, represented by electrodes F3, Fz, F4, C3, Cz, C4, P3, Pz, and P4. All statistical analyses were performed with a two-sided Wilcoxon signed rank test on the indices of changes in the relative energy of the EEGs between participants’ correct and incorrect answers. The EEGs recorded when subjects did not respond in any of the conditions explored were excluded from the corresponding analysis.

3. Results

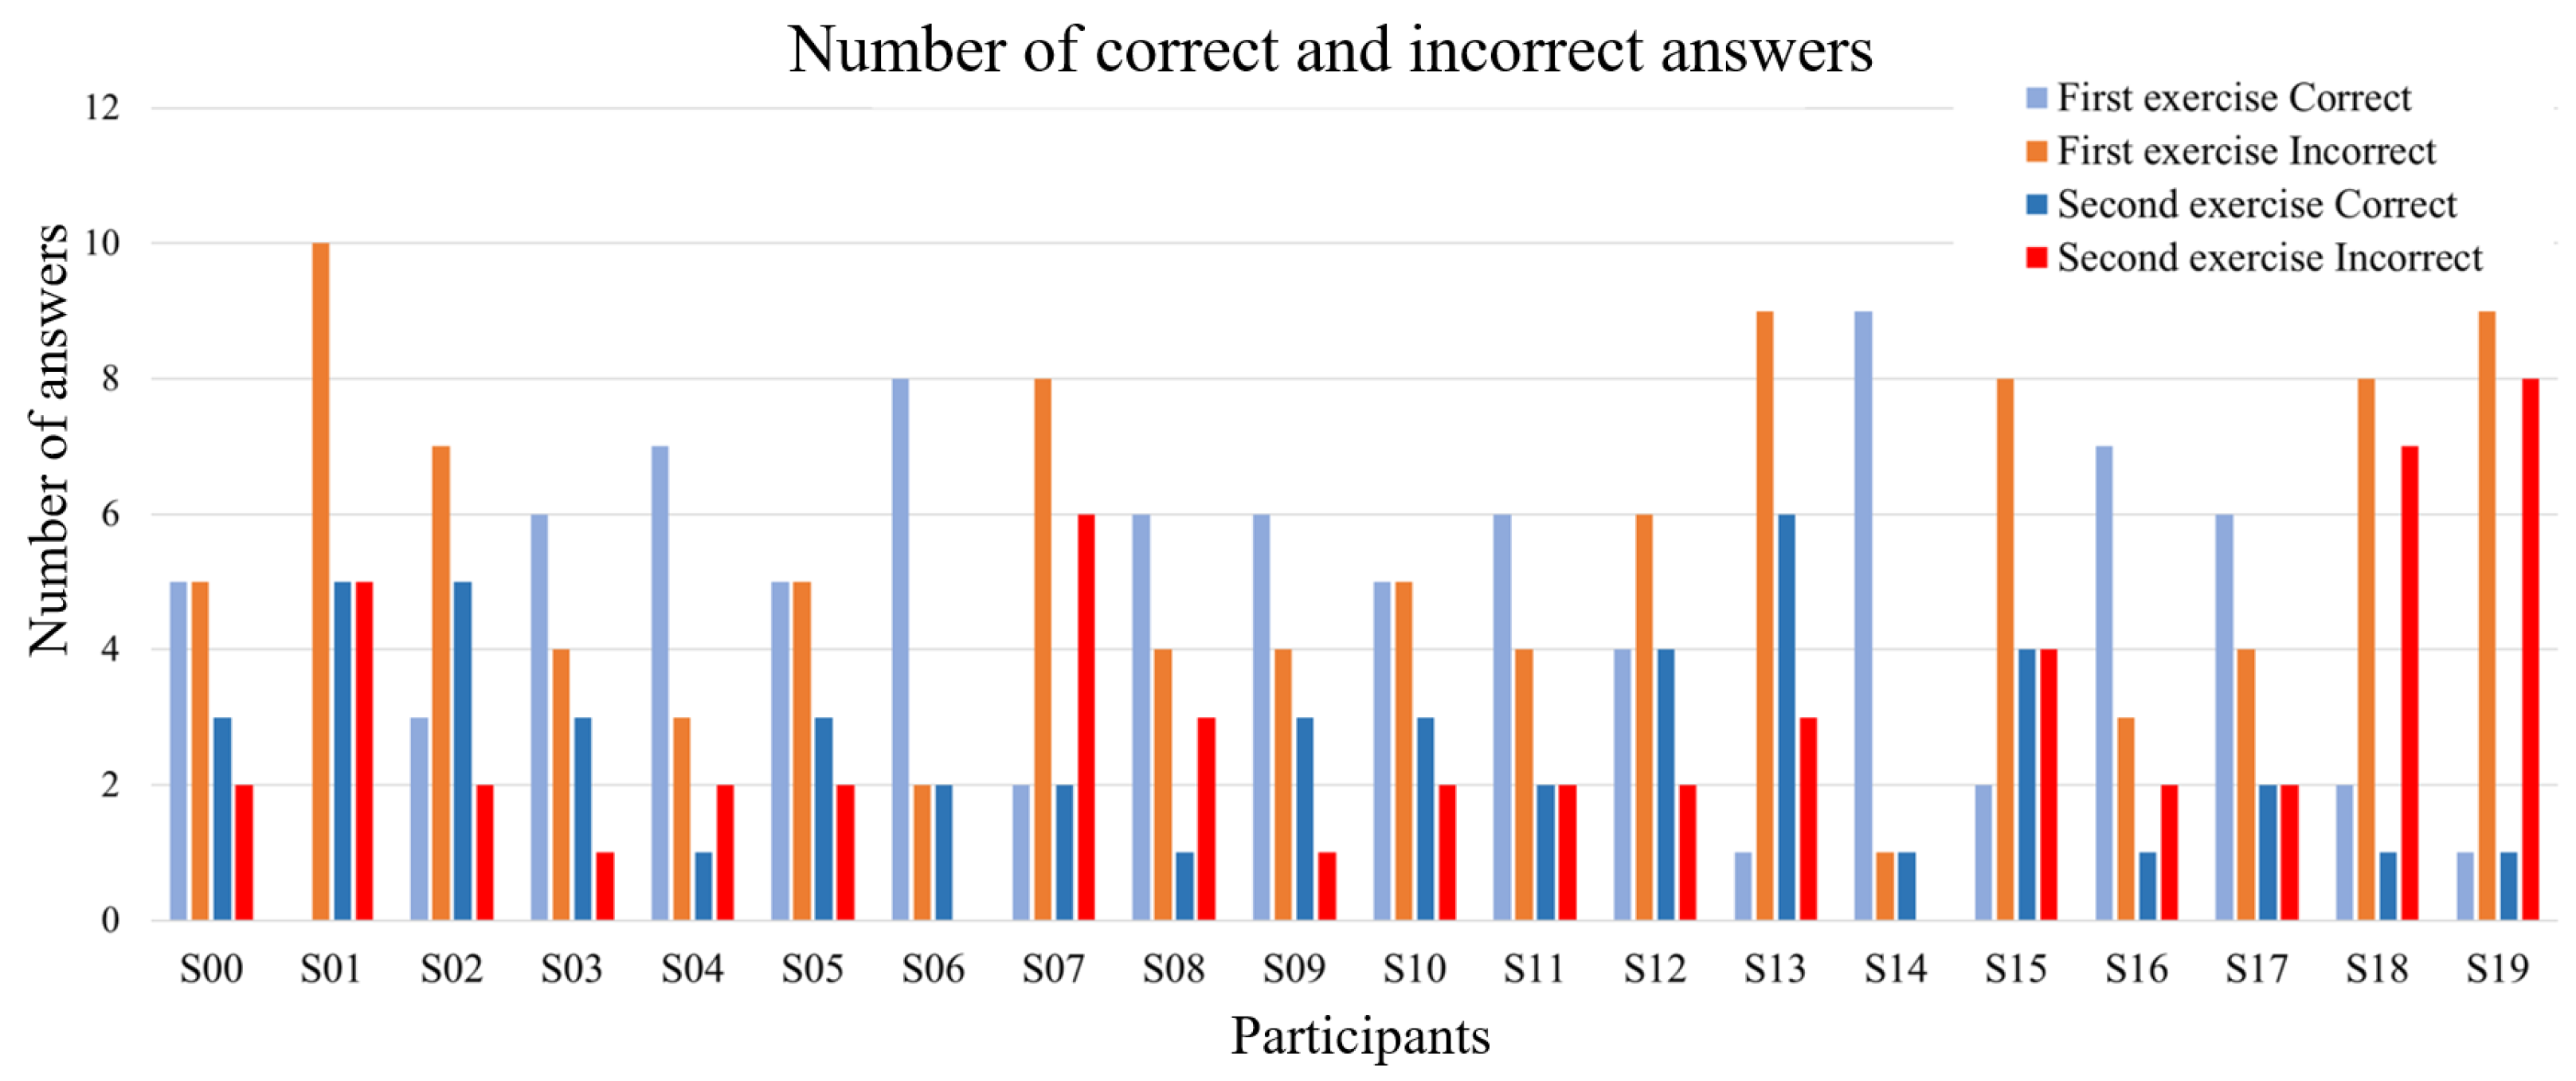
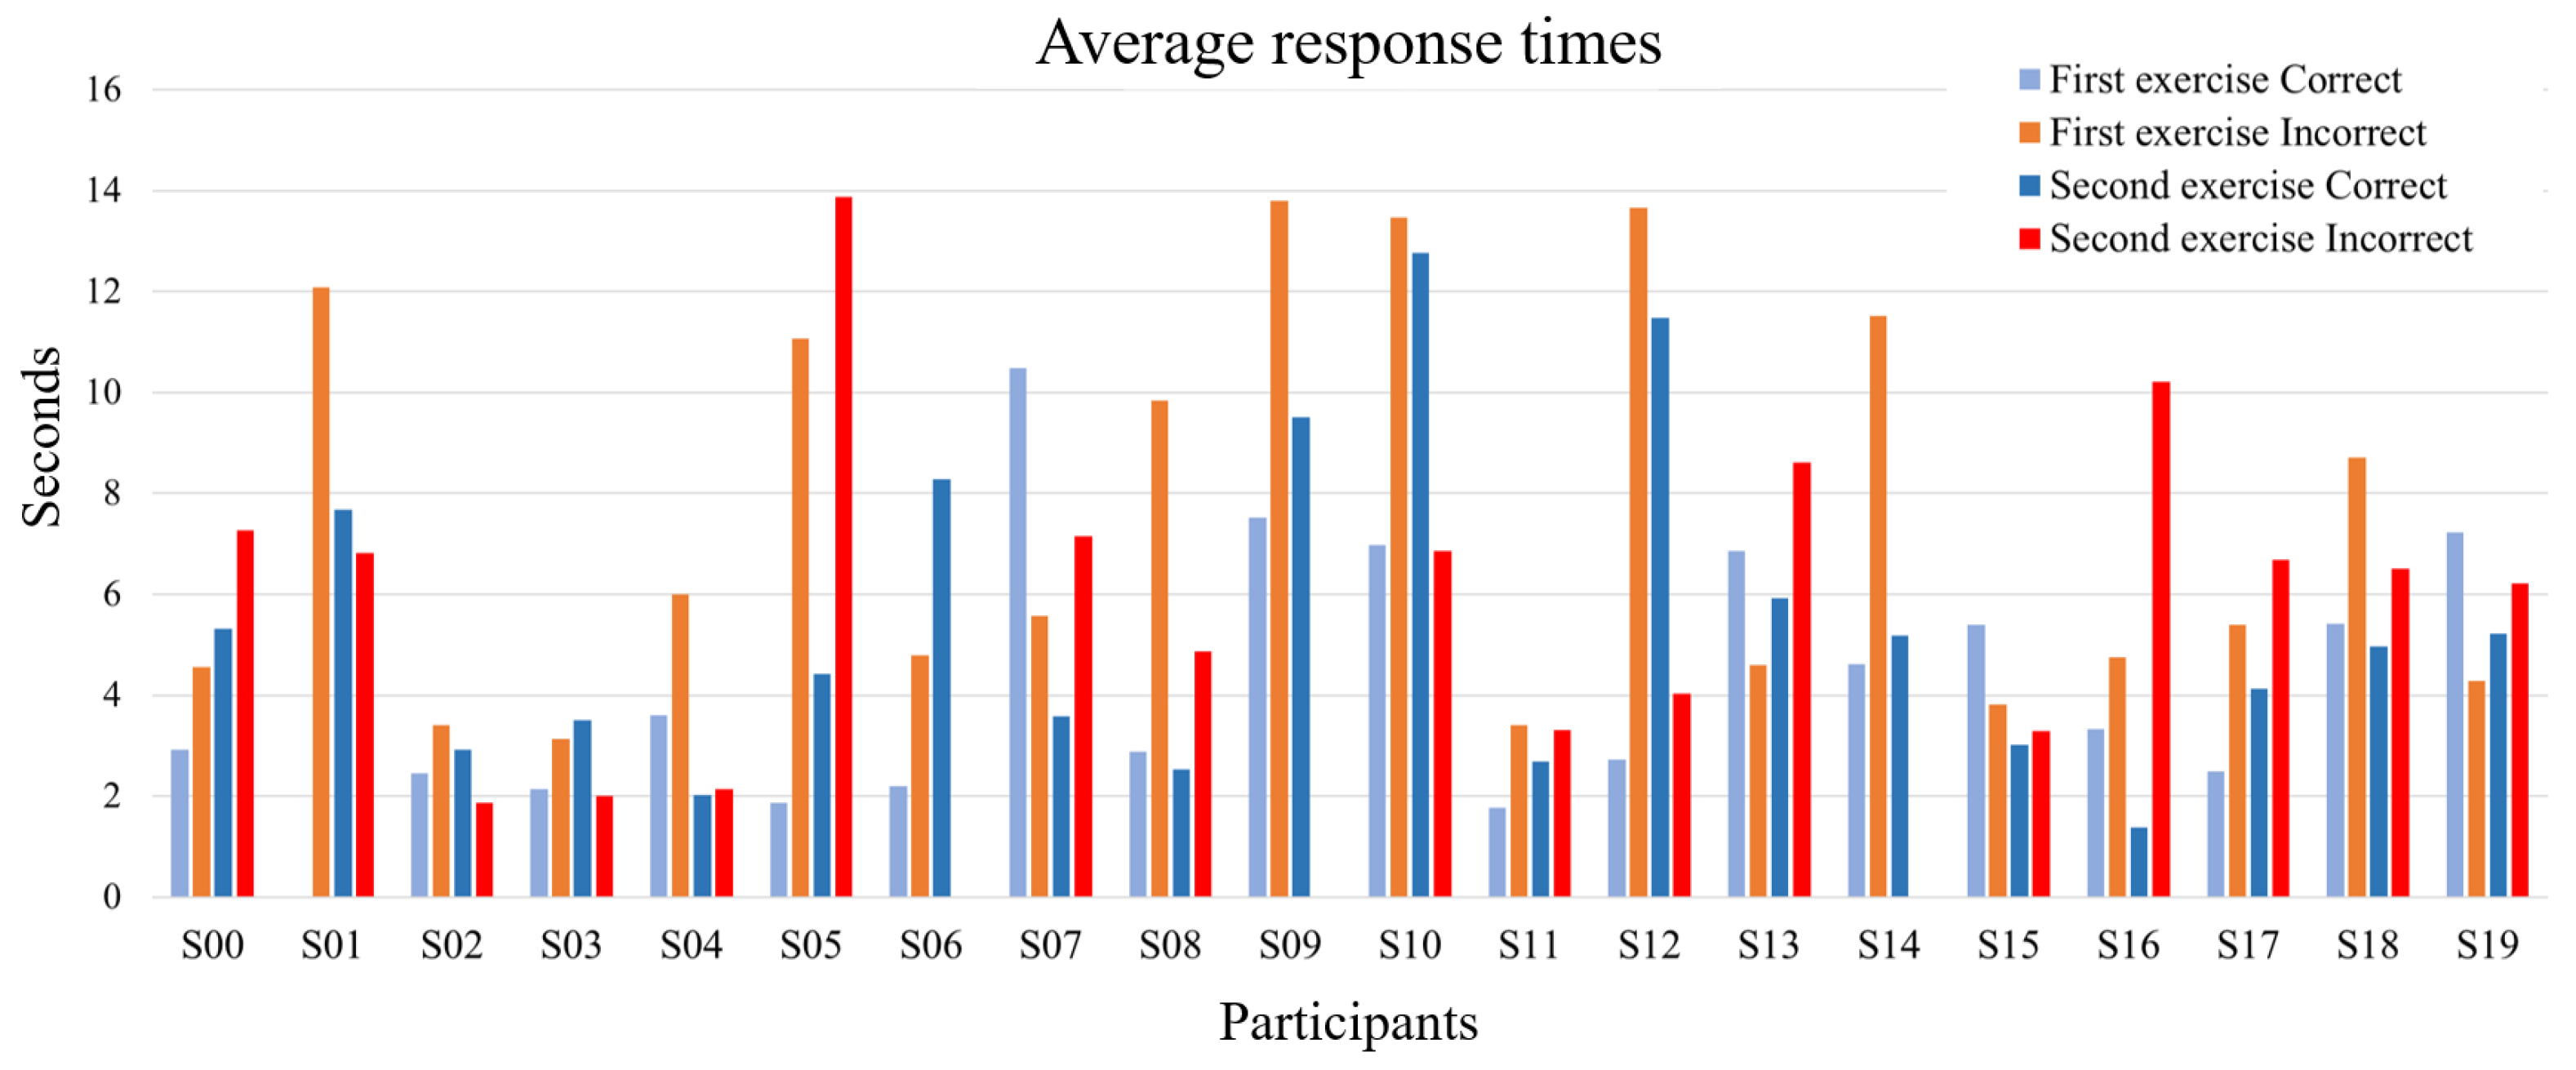
3.1. Behavioral Results

For the first part of each exercise, we obtained an average number of correct answers of 4.55 (±2.54), and of incorrect answers of 5.45 (±2.54). For the second part of each exercise, we obtained averages of 2.65 (±1.53) and 2.8 (±2.16) for correct and incorrect responses. However, no statistical difference was observed between the number of relative correct and incorrect responses neither in the first part (z-value = 0.787, p = 0.431 ) nor in the second part of the task (z-value = −0.467, p = 0.640 ), as the graph in Figure 6 shows.
With respect to reaction times, in the first exercise, we observed averages of 4.36 s (±2.46 s) and 7.39 s (±3.89 s) for correct and incorrect answers, respectively. For the second exercise, these values were 5.32 s (±3.13 s) and 5.98 s (±3.15 s). No differences in response times were observed between the first and second exercises (z-value = −0.255, p = 0.798 ). There was, however, a difference in reaction times between correct and incorrect responses on the first exercise analysis (z-value = 2.613, p < 0.01 ) revealed an increase in response times during incorrect selections, but not in the second exercise (z-value = 0.224, p = 0.82 ). as the graph in Figure 7 shows.

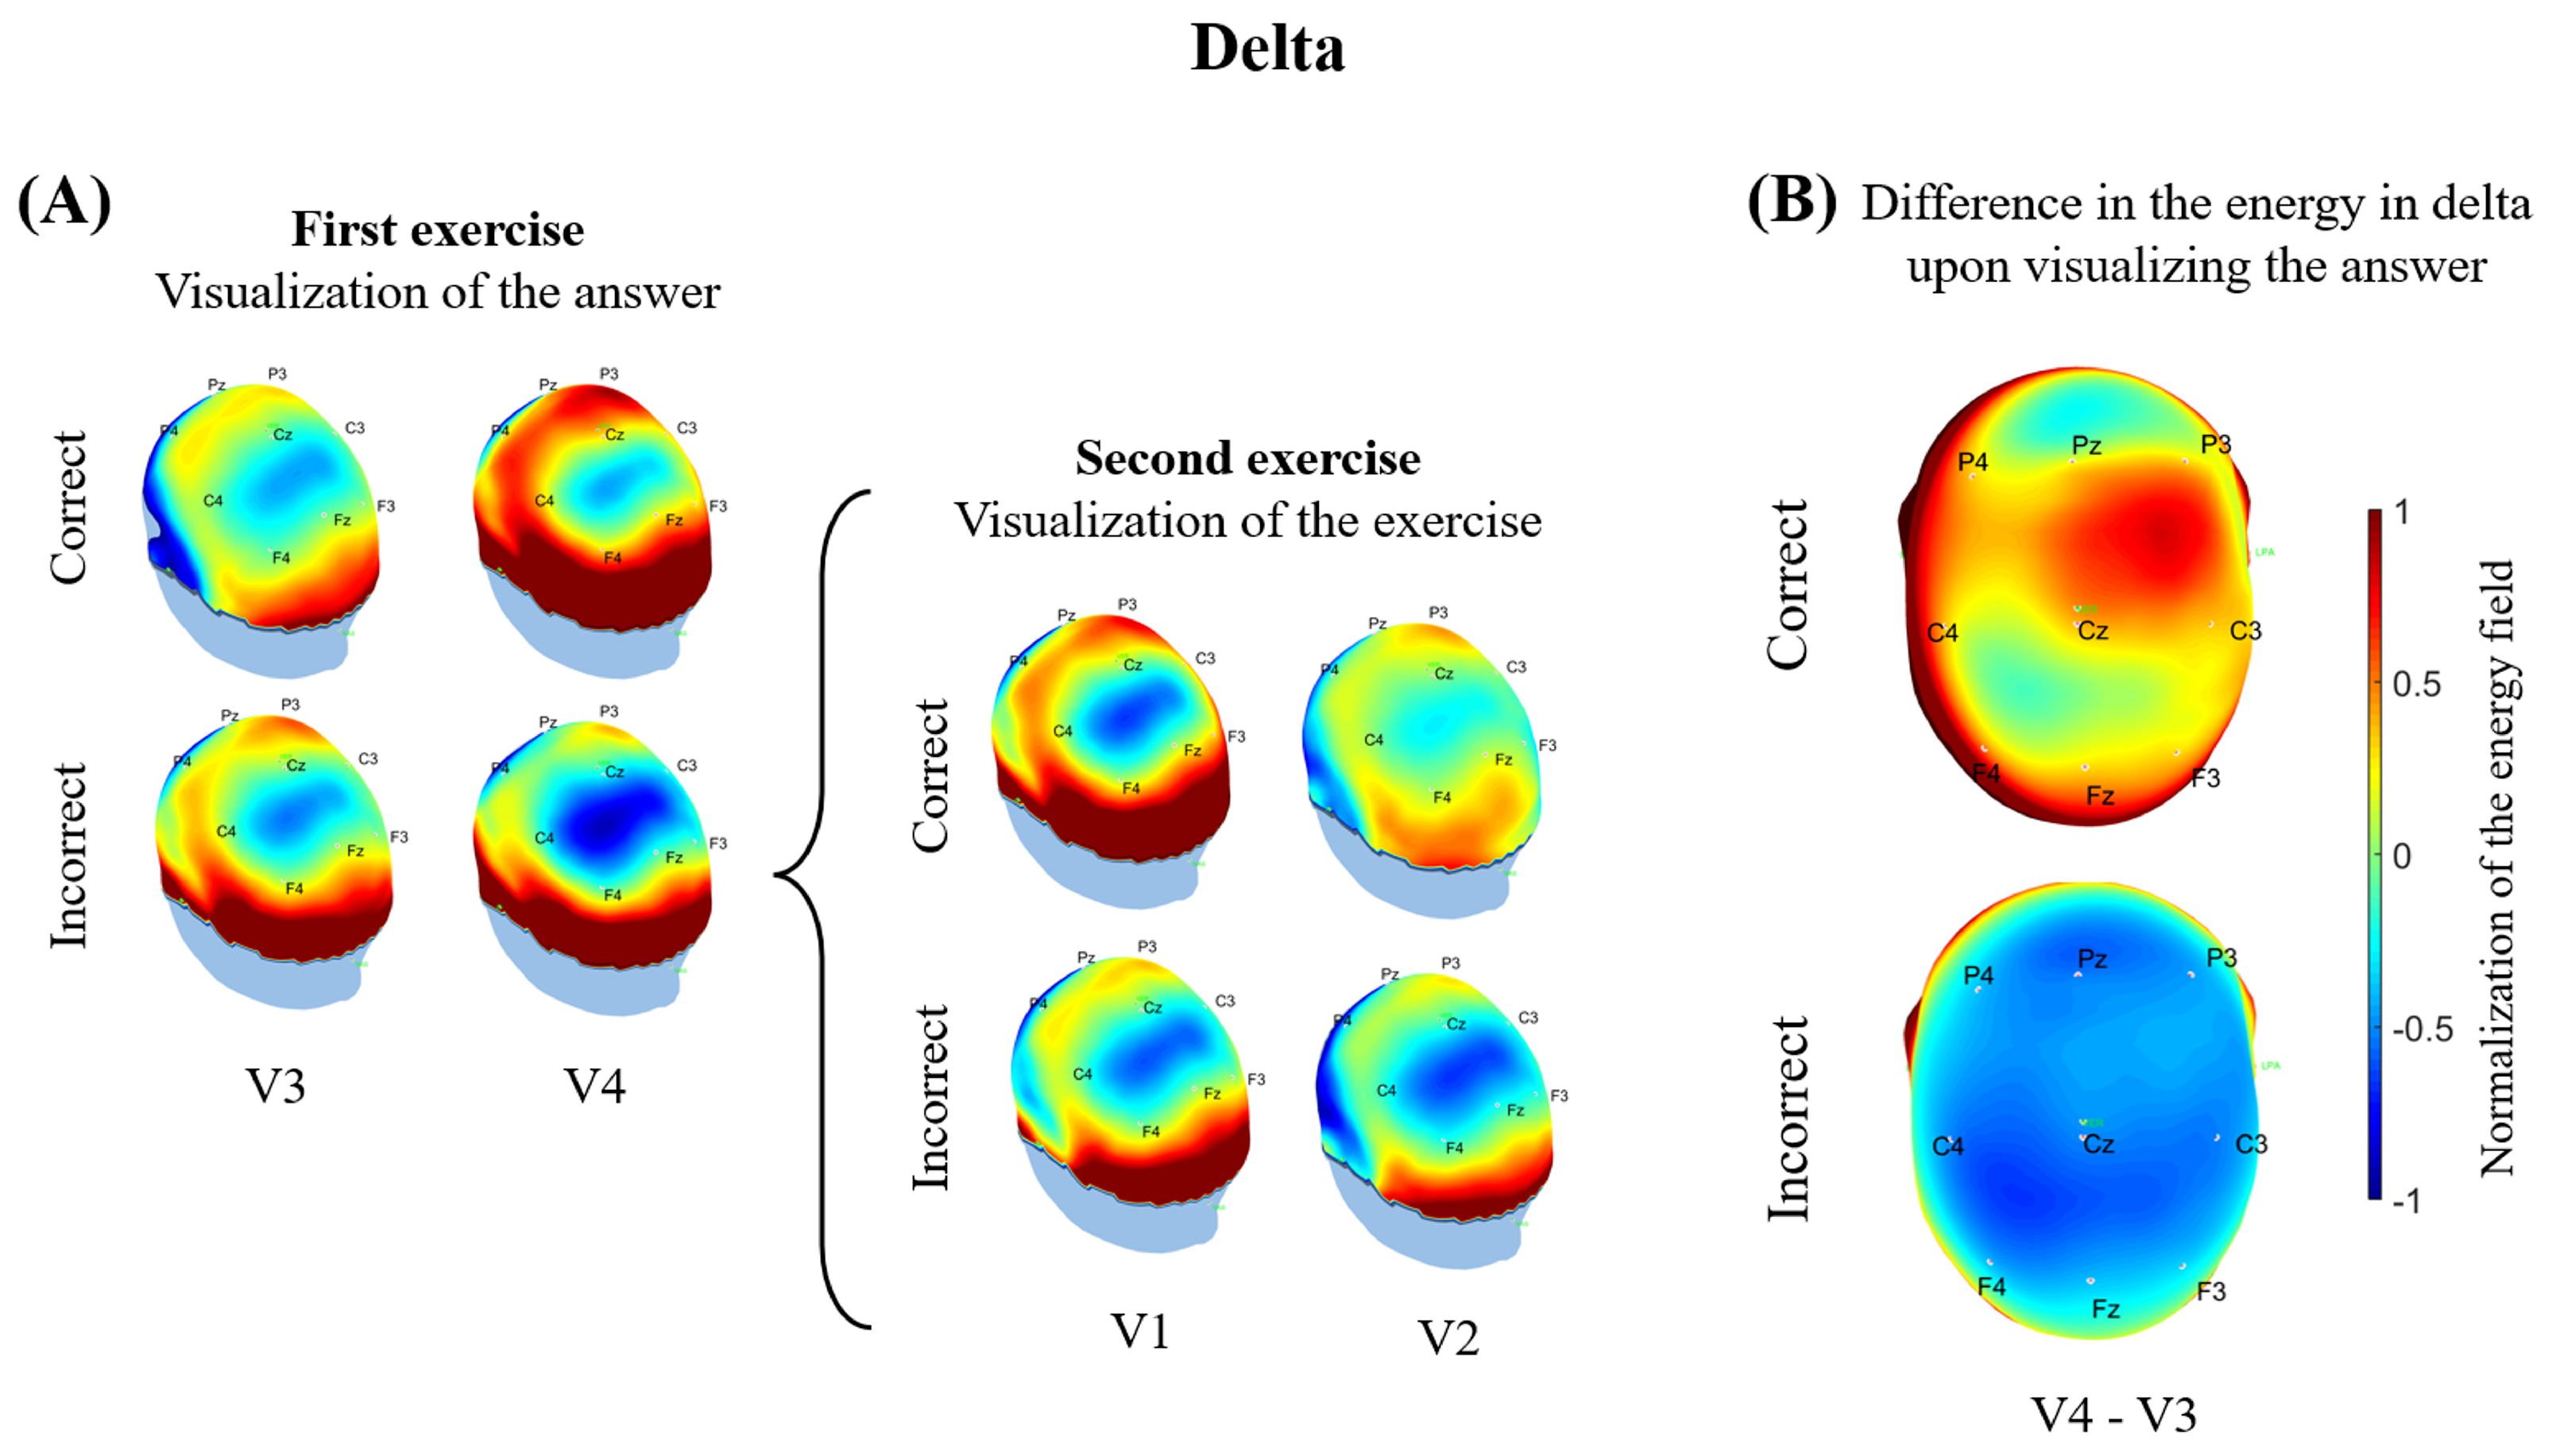
3.2. Electrophysiological Results

Electrophysiological activity was analyzed at the instant when subjects were shown whether their answers to the first exercise were correct or incorrect (V4). This showed an increase in energy in the subjects that responded correctly (z-value = −2.017, p < 0.05 ). This difference was also estimated in terms of the relative energy between the moments prior and posterior to feedback on a correct answer (V4–V3, see Figure 8A). In this analysis, the delta band presented an important trend (z-value = 1.551, p = 0.12 ) between the participants who answered correctly and those who responded incorrectly, as the former showed an increase in the relative energy of delta, while the latter presented a reduction upon learning that their answers were incorrect (see Figure 8B).
Turning to the relative energy of the theta band, no significant change was detected at the moment when participants learned whether their answers were correct or incorrect. However, following the temporal order of the task, prior to the second exercise in the cases where the initial answer was incorrect, but after receiving feedback (window V1 of the second exercise), a significant difference among participants did appear in the behavior of the relative energy of this band (z-value = 2.430, p < 0.05 ), as the subjects who answered the second exercise correctly presented a reduction in the relative energy of theta compared to those who responded incorrectly. In this context, the participants who answered the second exercise incorrectly showed higher relative energy levels in theta (Figure 9A).
We also analyzed the change in the cerebral activity of the participants who had to solve the second exercise, focusing on the change in energy between the windows prior and posterior to the visualization of that exercise (V2–V1 of the second exercise). Although no significant difference in the relative energy of delta was obtained, there was an important trend in the change of relative energy in theta, (z-value = 1.913, p = 0.05 ) as this increased in the subjects who answered correctly, but decreased in those who responded incorrectly (Figure 9B).

4. Discussion

This paper presents the results of an investigation designed to estimate and analyze the relative energy of the delta and theta bands in students who, after executing a mathematics task, likely judged their answers to be correct, only to find out later that they had erred while solving the task. This approach reflects the fact that these two bands have been related to electrical potentials generated in the presence of errors during the execution of evaluation tests. In response to the research question regarding whether the energy patterns in the delta band could help identify the element of overconfidence (OC), the study determined that the most significant changes in delta cerebral activity occurred in the instants prior and posterior to learning whether the answer selected was correct or incorrect. Although this band has been little studied because it lies in the range of the frequencies affected by ocular artifacts [30], the implementation of advanced techniques for eliminating such artifacts with only minimal data loss—blind source separation [29], for example—improves the exploration of behavioral patterns during the performance of cognitive tasks.
The behavior of the energy in the delta band during the solving of the math exercises coincides with findings reported in the literature, which indicate that, during the execution of math tasks, the energy in this band increases to facilitate concentration processes [31]. This behavior was observed in a more accentuated way in the group that responded incorrectly, perhaps because those subjects required higher levels of concentration. In another aspect, the reduction of the energy of the delta band seen in the participants who responded incorrectly upon receiving feedback that their answers were erroneous could be interpreted as an indicator of how the subjects who made errors “woke up” from a previous process of concentration and inhibition of external, non-relevant stimuli during the execution of mental tasks, since this cognitive process is associated with this band [30,32,33], and this reaction allows them to focus on external stimuli like feedback [31,34].
The literature also correlates the energy in delta with motivational processes, affirming that motivational impulses lead to an increase in this energy [35]. Based on this, we can conjecture that the increase observed in delta when participants were informed that their answers were correct could be associated with the sensation of having received a reward for their performance.
Turning to the behavior of the theta band, some studies have related this to codification and processes of the recovery of new information [36,37]. This could explain the increase in the energy of this band observed in the participants who answered the second exercise correctly, by associating it with a possible process of recovery of the information acquired during feedback. However, it has also been related to the solving of previously-trained math tasks [38], so it could reflect the process of understanding the feedback.
Energy in the theta band has also been related to greater cognitive demands [33,36], a premise that could link the electrophysiological behavior observed in the subjects who resolved the second exercise correctly, compared to those who did not, to a more demanding cognitive process that may reflect their understanding of the math rules that needed to be applied to reach correct solutions. This same line of reasoning could explain why the participants who answered the second exercise incorrectly showed higher levels of energy in this band, likely expressing the large cognitive demand required to understand the feedback provided.
This study allowed us to identify changes in the cerebral electrophysiological delta and theta bands during the solving (correct or incorrect) of mathematics exercises. Thus, it opens the possibility of exploring cognitive processes from new, distinct perspectives, and of finding new ways to identify and quantify them. The results obtained suggest that it may be possible to achieve an objective description based on the cerebral changes that occur in the presence of possible OC when students consider that their answers to math exercises are correct when, in fact, they are erroneous.
In addition, this analysis suggests the existence of a time-solution relation with correct or incorrect answers that could be a topic for future research. In this context, the methodology adopted herein could be evaluated for its potential to enhance the evaluation of learning processes. However, we recognize that our results are not conclusive, and that additional studies are required to probe each one of the phases of the experimental task more deeply and explore each stage of the cognitive process using a more punctual, controlled approach.

Author Contributions

Conceptualization, K.P.I.-G., C.E.-W., H.V.-P. and R.R.-V.; methodology, F.J.A.-R., K.P.I.-G., C.E.-W., H.V.-P. and R.R.-V.; software, F.J.A.-R.; validation, H.V.-P. and R.R.-V.; formal analysis F.J.A.-R.; investigation F.J.A.-R., K.P.I.-G., C.E.-W., H.V.-P. and R.R.-V.; writing—original draft preparation, F.J.A.-R., K.P.I.-G., C.E.-W., H.V.-P. and R.R.-V.; writing—review and editing, K.P.I.-G., C.E.-W., H.V.-P. and R.R.-V.; supervision K.P.I.-G., C.E.-W., H.V.-P. and R.R.-V.; project administration, R.R.-V. and H.V.-P. All authors have read and agreed to the published version of the manuscript.

Funding

We thank the National Science and Technology Council (CONACyT) for the support received through scholarship CVU-746539.

Institutional Review Board Statement

This experimental protocol was submitted for review to, and approved by, the Research Ethics Committee of the Hospital Dr. Ángel Leaño. The evaluation was performed in accordance with the requirements of CONBIOETHICS, Good Clinical Practice, and ICH guidelines (protocol code CEI/2022/002 and approval date 4 March 2022.

Informed Consent Statement

Informed consent was obtained from all subjects involved in the study.

Data Availability Statement

Conflicts of Interest

The authors declare that they have no conflict of interest with respect to the authorship and/or publication of this article.

Appendix A

The algebraic and arithmetical mistakes that students make are usually classified as common or typical errors caused by misconceptions. Since students often make the same errors on similar exercises, items can be generated and used to predict when they will make such typical errors.
The task items were chosen intentionally to detect these problems in participants’ algebraic processes [39], anticipating that some of them would mistakenly believe their answers were correct; that is, they would show overconfidence. Given this overconfidence in their answers, we hypothesized that upon learning that they had, in fact, erred, they would show brain reactions that would be measurable by EEG. Reflecting this, the following items were chosen:
  • Two items to test the concepts of mathematical hierarchy or order of operations, where common mistakes include calculating from left-to-right (item 1) and considering the sign as part of the quantity to be squared (item 2).
  • Three items to evaluate the simplification of rational algebraic expressions that do not require factorization. The main error expected was a strikeout scheme.
  • Two items tested simplifying rational algebraic expressions that required factorization, one with a notable product, the other with compound common factor factorization. In one item, simplifying the algebraic fraction required factorizing a perfect square trinomial. Expected errors were a “simplification” by means of a crossed-out scheme of the quadratic terms in the numerator and denominator or incorrect factorization. In the other, factorization was by a common factor that required identifying a compound common term.
  • In this item, the numerator was not factorable, so only the expression in the numerator could be reduced.
  • The challenge in this item was that factorization required knowledge of the laws of exponents. A common error consists of “simplifying” one of the numerator terms with the denominator term (i.e., wrong strikeout scheme).
  • The last item was designed to generate a linearization error [40]; that is, the most common answers involve a conceptual error called concatenation.
The mathematical exercises presented to participants who answered the first exercise incorrectly and the second exercises presented after feedback.
( 1 ) 8 6 × 5 + 10 = 44 + 22 ÷ 11 6 =
( 2 ) 3 4 = 4 2 5 2 =
( 3 ) 7 + 7 x 7 = 16 x + 8 8 =
( 4 ) ( w + 9 ) 6 ( w + 9 ) 6 = ( a + 5 ) 4 ( a + 5 ) 4 =
( 5 ) y 1 1 y = y 2 49 7 y =
( 6 ) b 2 b 2 4 b + 4 = 7 7 x 2 14 x + 28 =
( 7 ) x 7 + 9 x + 6 ( x 7 + 9 ) x 7 + 9 = x 8 + 3 + 9 ( x 8 + 9 ) x 8 + 9 =
( 8 ) ( 6 x + 7 ) 5 ( 5 x + 2 ) 6 ( 6 x + 7 ) 2 = ( 8 x + 2 ) 3 ( 3 x + 7 ) 8 ( 8 x + 2 ) 2 =
( 9 ) e x e 2 x e x = e x e w x e x =
( 10 ) x 2 + y 2 = a 4 + b 4 =

References

  1. Lin, F.R.; Kao, C.M. Mental effort detection using EEG data in E-learning contexts. Comput. Educ. 2018, 122, 63–79. [Google Scholar] [CrossRef]
  2. Galán, F.C.; Beal, C.R. EEG estimates of engagement and cognitive workload predict math problem solving outcomes. In International Conference on User Modeling, Adaptation, and Personalization; Springer: Berlin/Heidelberg, Germany, 2012; pp. 51–62. [Google Scholar]
  3. Sakkalis, V. Review of advanced techniques for the estimation of brain connectivity measured with EEG/MEG. Comput. Biol. Med. 2011, 4, 1110–1117. [Google Scholar] [CrossRef]
  4. Khedher, A.B.; Jraidi, I.; Frasson, C. Tracking students’ mental engagement using EEG signals during an interaction with a virtual learning environment. J. Intell. Learn. Syst. Appl. 2019, 11, 89991. [Google Scholar] [CrossRef]
  5. Lubar, J.F.; Bianchini, K.J.; Calhoun, W.H.; Lambert, E.W.; Brody, Z.H.; Shabsin, H.S. Spectral analysis of EEG differences between children with and without learning disabilities. J. Learn. Disabil. 1985, 18, 403–408. [Google Scholar] [CrossRef]
  6. Dutta, S.; Hazra, S.; Nandy, A. Human cognitive state classification through ambulatory eeg signal analysis. In International Conference on Artificial Intelligence and Soft Computing; Springer: Cham, Switzerland, 2019; pp. 169–181. [Google Scholar]
  7. Yeh, M.K.C.; Gopstein, D.; Yan, Y.; Zhuang, Y. Detecting and comparing brain activity in short program comprehension using EEG. In Proceedings of the 2017 IEEE Frontiers in Education Conference (FIE), Indianapolis, IA, USA, 18–21 October 2017; pp. 1–5. [Google Scholar]
  8. Choi-Koh, S.S.; Ryoo, B.G. Differences of math anxiety groups based on two measurements, MASS and EEG. Educ. Psychol. 2019, 39, 659–677. [Google Scholar] [CrossRef]
  9. Garavalia, L.; Ray, M.; Murdoch, T.; Gredler, M. A comparative analysis of achievement calibration accuracy in developmental and nondevelopmental college students. Res. Teach. Dev. Educ. 2004, 21, 29–39. [Google Scholar]
  10. Macbeth, G.; Cortada de Kohan, N.; Kohan Cortada, A. Efecto de la experticia matemática en el sesgo de sobreconfianza. Perspect. Psicol. 2007, 4, 13–18. [Google Scholar]
  11. Kruger, J.; Dunning, D. Unskilled and unaware of it: How difficulties in recognizing one’s own incompetence lead to inflated self-assessments. J. Personal. Soc. Psychol. 1999, 77, 1121. [Google Scholar] [CrossRef]
  12. Moore, D.A.; Schatz, D. Overprecision increases subsequent surprise. PLoS ONE 2020, 15, e0227084. [Google Scholar] [CrossRef]
  13. Weinberg, A.; Meyer, A.; Hale-Rude, E.; Perlman, G.; Kotov, R.; Klein, D.N.; Hajcak, G. Error-related negativity (ERN) and sustained threat: Conceptual framework and empirical evaluation in an adolescent sample. Psychophysiology 2016, 53, 372–385. [Google Scholar] [CrossRef]
  14. Briceño, M.T. El uso del error en los ambientes de aprendizaje: Una visión transdisciplinaria. Rev. Teor. Didáct. Cienc. Soc. 2009, 14, 9–28. [Google Scholar]
  15. Wang, Y.; Cheung, H.; Yee, L.T.S.; Tse, C.Y. Feedback-related negativity (FRN) and theta oscillations: Different feedback signals for non-conform and conform decisions. Biol. Psychol. 2020, 153, 107880. [Google Scholar] [CrossRef]
  16. Ortiz, E. How the Brain’s Performance during Mathematics and Reading Fluency Tests Compare. Am. Educ. Res. Assoc. 2011. Online Submission. [Google Scholar]
  17. Zan, R.; Brown, L.; Evans, J.; Hannula, M.S. Affect in mathematics education: An introduction. Educ. Stud. Math. 2006, 63, 113–121. [Google Scholar] [CrossRef] [Green Version]
  18. Gehring, W.J.; Coles, M.G.; Meyer, D.E.; Donchin, E. A brain potential manifestation of error-related processing. Electroencephalogr. Clin. Neurophysiol.-Suppl. Only 1995, 44, 261–272. [Google Scholar]
  19. Trujillo, L.T.; Allen, J.J. Theta EEG dynamics of the error-related negativity. Clin. Neurophysiol. 2007, 118, 645–668. [Google Scholar] [CrossRef] [PubMed]
  20. Stenberg, G. Personality and the EEG: Arousal and emotional arousability. Personal. Individ. Differ. 1992, 13, 1097–1113. [Google Scholar] [CrossRef]
  21. Nakashima, K.; Sato, H. The effects of various mental tasks on appearance of frontal midline theta activity in EEG. J. Hum. Ergol. 1992, 21, 201–206. [Google Scholar]
  22. Asada, H.; Fukuda, Y.; Tsunoda, S.; Yamaguchi, M.; Tonoike, M. Frontal midline theta rhythms reflect alternative activation of prefrontal cortex and anterior cingulate cortex in humans. Neurosci. Lett. 1999, 274, 29–32. [Google Scholar] [CrossRef]
  23. Kubota, Y.; Sato, W.; Toichi, M.; Murai, T.; Okada, T.; Hayashi, A.; Sengoku, A. Frontal midline theta rhythm is correlated with cardiac autonomic activities during the performance of an attention demanding meditation procedure. Cogn. Brain Res. 2001, 11, 281–287. [Google Scholar] [CrossRef]
  24. Maurer, U.; Brem, S.; Liechti, M.; Maurizio, S.; Michels, L.; Brandeis, D. Frontal midline theta reflects individual task performance in a working memory task. Brain Topogr. 2015, 28, 127–134. [Google Scholar] [CrossRef] [PubMed]
  25. Harmony, T. The functional significance of delta oscillations in cognitive processing. Front. Integr. Neurosci. 2013, 7, 83. [Google Scholar] [CrossRef] [PubMed]
  26. Kaplan, A.Y. The problem of segmental description of human electroencephalogram. Hum. Physiol. Fiziol. Cheloveka 1999, 25, 107–114. [Google Scholar]
  27. Fingelkurts, A.A.; Fingelkurts, A.A. EEG oscillatory states: Temporal and spatial microstructure. Int. J. Psychophysiol. 2008, 3, 150. [Google Scholar] [CrossRef]
  28. Gonen, F.F.; Tcheslavski, G.V. Techniques to assess stationarity and gaussianity of EEG: An overview. Int. J. Bioautom. 2012, 16, 135. [Google Scholar]
  29. Vázquez, R.R.; Velez-Perez, H.; Ranta, R.; Dorr, V.L.; Maquin, D.; Maillard, L. Blind source separation, wavelet denoising and discriminant analysis for EEG artefacts and noise cancelling. Biomed. Signal Process. Control 2012, 7, 389–400. [Google Scholar] [CrossRef]
  30. Dolce, G.; Waldeier, H. Spectral and multivariate analysis of EEG changes during mental activity in man. Electroencephalogr. Clin. Neurophysiol. 1974, 36, 577–584. [Google Scholar] [CrossRef]
  31. Fernández, T.; Harmony, T.; Rodríguez, M.; Bernal, J.; Silva, J.; Reyes, A.; Marosi, E. EEG activation patterns during the performance of tasks involving different components of mental calculation. Electroencephalogr. Clin. Neurophysiol. 1995, 94, 175–182. [Google Scholar] [CrossRef]
  32. Vogel, W.; Broverman, D.M.; Klaiber, E.L. EEG and mental abilities. Electroencephalogr. Clin. Neurophysiol. 1968, 24, 166–175. [Google Scholar] [CrossRef]
  33. Harmony, T.; Fernández, T.; Silva, J.; Bernal, J.; Díaz-Comas, L.; Reyes, A.; Erzsébet, M.; Mario, R.; Rodríguez, M. EEG delta activity: An indicator of attention to internal processing during performance of mental tasks. Int. J. Psychophysiol. 1996, 24, 161–171. [Google Scholar] [CrossRef]
  34. Hinault, T.; Lemaire, P. What does EEG tell us about arithmetic strategies? A review. Int. J. Psychophysiol. 2016, 106, 115–126. [Google Scholar] [CrossRef] [PubMed]
  35. Knyazev, G.G. EEG delta oscillations as a correlate of basic homeostatic and motivational processes. Neurosci. Biobehav. Rev. 2012, 36, 677–695. [Google Scholar] [CrossRef] [PubMed]
  36. Klimesch, W.; Doppelmayr, M. Encoding of new. Neuroreport 1996, 7, 1235–1240. [Google Scholar] [CrossRef] [PubMed]
  37. Polanía, R.; Nitsche, M.A.; Korman, C.; Batsikadze, G.; Paulus, W. The importance of timing in segregated theta phase-coupling for cognitive performance. Curr. Biol. 2012, 22, 1314–1318. [Google Scholar] [CrossRef]
  38. Grabner, R.H.; De Smedt, B. Oscillatory EEG correlates of arithmetic strategies: A training study. Front. Psychol. 2012, 3, 428. [Google Scholar] [CrossRef]
  39. Eccius-Wellmann, C. Mathematikdidaktische Fehleranalysen zur Schulalgebra: Schülerwissen und Lehrerprofessionswissen; VDM Verlag Dr. Müller: Riga, Latvia, 2008. [Google Scholar]
  40. Bagni, G.T. ‘Simple’Rules and General Rules in Some High School Students’ Mistakes. J. Math.-Didakt. 2000, 21, 124–138. [Google Scholar] [CrossRef]
Figure 1. Structure of the mathematics task. Example of an exercise with multiple answer options and feedback. The green block represents the correct answer, while the red ones correspond to common incorrect answers.
Mathematics 10 03294 g001
Figure 2. Instructions given to participants. Representation of the order in which the task instructions were displayed on the monitor.
Mathematics 10 03294 g002
Figure 3. Task structure in the case of correct responses. Structure of the presentation of the mathematical approaches to the proof when a correct answer was given.
Mathematics 10 03294 g003
Figure 4. Task structure in the case of incorrect responses. Structure of the feedback presentation and a second approach following an incorrect response by the participant.
Mathematics 10 03294 g004
Figure 5. Mathematical exercise and structure of the windows of analysis. Representation of the selection of the 1-s windows of EEG recording in a simultaneous visualization of the math task. V1 represents the EEG recording window before viewing the mathematical approach, V2 corresponds to the window of the first instant of the display of the approach on the screen, V3 is the window of the instant of response selection, and V4 contains the feedback when the participant learned whether the response given was correct or incorrect (V1–V4 have a duration of 1 s).
Mathematics 10 03294 g005
Figure 6. Behavioral results. Number of correct and incorrect answers by each participant in the first and second approaches (following an incorrect answer).
Mathematics 10 03294 g006
Figure 7. Average response times. Average response time per subject classified as correct and incorrect, in the first and second approaches (after an incorrect response).
Mathematics 10 03294 g007
Figure 8. Relative energy of the delta band. EEG activity of the delta band in the central region. (A) Representation of delta brain activity at the moment of visualizing (i) the first correct vs. incorrect response, and (ii) the second response after the incorrect response; (B) representation of the difference in V4–V3 delta brain activity, where a positive change in energy is observed at the visualization of a correct response. The right representation shows a negative change in energy upon visualizing an incorrect response.
Mathematics 10 03294 g008
Figure 9. Relative energy of the theta band. EEG activity of the theta band in the central region. (A) representation of theta brain activity at the time of visualizing (i) the first correct vs. incorrect response, and (ii) the second response after the incorrect response; (B) representation of the difference in V2–V1 theta brain activity, where a positive change in energy is observed in the visualization of the second question, when she/he answered correctly (at this moment, she/he does not know if the answer is correct), while on the contrary, there is a negative change in energy at the moment of visualizing the second question when she/he answered incorrectly.
Mathematics 10 03294 g009
Publisher’s Note: MDPI stays neutral with regard to jurisdictional claims in published maps and institutional affiliations.

