Article

Strength of Composite Columns Consists of Welded Double CF Sigma-Sections Filled with Concrete—An Experimental Study

by
Mohamed A. Reda
1,2,
Ahmed M. Ebid
2,*,
Sherif M. Ibrahim
1 and
Mohamed A. El-Aghoury
1
1
Structural Engineering Department, Faculty of Engineering, Ain Shams University, Cairo 11535, Egypt
2
Structural Engineering & Construction Management Department, Faculty of Engineering & Technology, Future University in Egypt, Cairo 11865, Egypt
*
Author to whom correspondence should be addressed.
Designs 2022, 6(5), 82; https://doi.org/10.3390/designs6050082
Submission received: 23 August 2022 / Revised: 9 September 2022 / Accepted: 13 September 2022 / Published: 21 September 2022
(This article belongs to the Special Issue Sustainable Design in Building and Urban Environment)

Abstract

:
In-filled tubes section is a very successful configuration for axially loaded members such as columns and struts. Steel shell tube filled with concrete has many advantages, such as eliminating the need for shuttering, reinforcement bars or ties besides increasing both flexural and axial capacities and enhancing the ductility. The main disadvantage of in-filled tubes is the need for a shell thick enough to prevent the local buckling and hence the local decomposition. Previous studies tried to solve this problem using intermediate stiffeners or shear connectors. This research presents another approach to solve this problem using double cold-formed sigma-sections (face to face) as steel shell tubes. Sixteen specimens with different lengths, cross section dimensions and shell thicknesses were tested under both concentric and eccentric compression loads. Ultimate capacities, lateral deformations and normal strains were recorded. The theoretical capacities were calculated using AISC-LRDF-94, EN-1994-04 and CSI-COL software considering full composite action, and the deviations from the experimental results were 24%, 24% and 13%, respectively.

1. Introduction

Composite steel and concrete members, such as Concrete-filled Steel Tubes (CFST), have been widely used since the early decades of the 20th century in constructing both buildings and bridges [1]. Combining the high tensile strength of steel with the high compressive strength of concrete gives the (CTSF) members the advantages of low cost, high ductility and hence high performance under seismic loads [2,3]. Several research studies were carried out to study the behavior (CFST) columns with different cross sections (circular, square and rectangular).
Lin et al., 2005 [4] carried out an experimental study using 50 (CFST) specimens to investigate the effect of cross-sectional shape (circular or square), dimensions, yield strength and local slenderness ratio (D/t) on the axial capacity of the column. They developed an equation to predict the axial capacity considering the studied factors. The results of this research were valid for short columns only. Zhang and Guo, 2007, 2011 [5,6] tested 26 rectangular section (CFST) specimens with different slenderness ratios (L/r), aspect ratios (b/d), steel to concrete ratios (As/Ac) and relative eccentricity ratios (e/d) to figure out the effect of each parameter on the capacity of the column. They compared the test results with international codes. However, the study considered only rectangular sections. Bahrami et al., 2011 [7] presented a theoretical study using non-linear finite element analysis models to investigate the behavior and capacity of (CFST) columns under axial compressive loading. Different cross sections, number of stiffeners and thicknesses of steel sheets were tested to investigate their effects on both behavior and capacity. The study was concerned with square columns only. Ren et al., 2014 [8] tested 44 axially loaded short (CFST) columns with special cross sections (triangular, fan-shaped, D-shaped, 1/4 circular and semi-circular). They reported the failure mode and ultimate capacity for each column, but their conclusions are valued for stub (short) columns only.
Double-tube composite sections were investigated by Wang et al., 2017 [9], Ding et al., 2019 [10] and Ci et al., 2020 [11]. They presented experimental studies to investigate the capacity of concrete-filled double-tube circular columns under axial compression loads considering the effect of concrete strength, yield strength, inner and outer tube thickness, and the ratio between the diameters of inner and outer tubes. The tested samples were simulated using 3D-FEM models, and the experimental results were compared with both numerical models and international design codes. The tested samples were only short circular and rectangular columns.
Cold-formed short, square composite columns were studied by Tao et al., 2009 [12]. They suggested a design procedure for stiffened concrete-filled thin-walled steel tubular columns based on experimental study results. They found that adding fibers to concrete can effectively increase ductility.
Stainless-steel shells were used instead of traditional steel shells in (CFST) members to increase the corrosion resistance and add some architectural effects. Young and Ellobody, 2005 [13] tested a number of rectangular cold-formed stainless-steel tubes filled with concrete under axial compression and suggested design recommendations for such short columns. Dai et al., 2020 [14] tested and analyzed the compressive behavior of 18 specimens of stainless-steel short and circular columns filled with concrete. He et al., 2020 [15] studied the buckling effect on slender circular (CFST) with stainless-steel shell and high-strength concrete using 12 experimental tests. They identified different failure modes and presented a set of load deformation curves. In the same context, Kazemzadeh et al., 2020 [16] presented a series of experimental and numerical investigations on the local and post local buckling of stainless-steel composite columns to investigate the axial slenderness limit of different column cross sections (box, circular and I-section).
El-Aghoury et al., 2016 [17,18] studied both the ultimate capacity and buckling behavior of axially loaded columns consisting of combined CFS sigma pure steel sections (empty shells). They used 3D numerical modeling to investigate both the global and local buckling behavior of the double sigma section.
This research presented a novel composite cross section that has never been tested before; this novel section consists of double cold-formed sigma-sections (face to face) filled with concrete. The aim of this study is to experimentally investigate the ultimate capacity of the previously described composite column considering the effect of the global slenderness ratio of the column (L/r), aspect ratio of the cross section (b/d), local slenderness ratio (c/t) and relative eccentricity ratio (e/d). Besides that, the experimental capacities were compared with theoretical capacities calculated using AISC-LRFD, EN-1994 and CSI-COL software, considering full composite action behavior.

2. Materials and Methods

2.1. Concrete

Table 1 presents the mix proportions of the used concrete, where the fineness modulus of the used sand was 2.30 and the measured slump was 37 mm. Figure 1 summarizes the grain size distribution and the physical properties of both coarse and fine aggregates. The design strength of the concrete mix was 20 Mpa. The actual compressive cube strength and elastic modulus of concrete were measured by testing 150 mm size cubes and 150 × 150 × 300 mm size prisms, respectively. The average cube compressive strengths were 17.2 and 21.1 Mpa after 7 and 28 days, respectively. The measured concrete elastic modulus (Ec) after 28 days was 21.3 Gpa.

2.2. Steel

All sigma sections were fabricated using 1.5, 2.0 and 2.5 mm thick steel sheets. Three coupon samples for each thickness were tested according to ASTM E8 [19], using a displacement-controlled servo-hydraulic tensile testing machine. The loading rate was 0.8 mm/min to measure yield stress (Fy) and ultimate strength (Fu). Table 2 summarizes the test results.

2.3. Test Specimens

The experimental program was designed to study the effect of global slenderness ratio (λ), local slenderness ratio (c/t), aspect ratio (d/b) and load eccentricity ratio (e/d), where © is the longest straight portion of the steel shell. Accordingly, 16 specimens were fabricated and tested in the labs of the Housing and Building National Research Center (HBRC), Giza, Egypt. Each specimen consists of two cold-formed sigma sections welded face to face using a single bevel butt weld and filled with concrete. The specimen’s dimensions were selected within the shown ranges in Table 3.
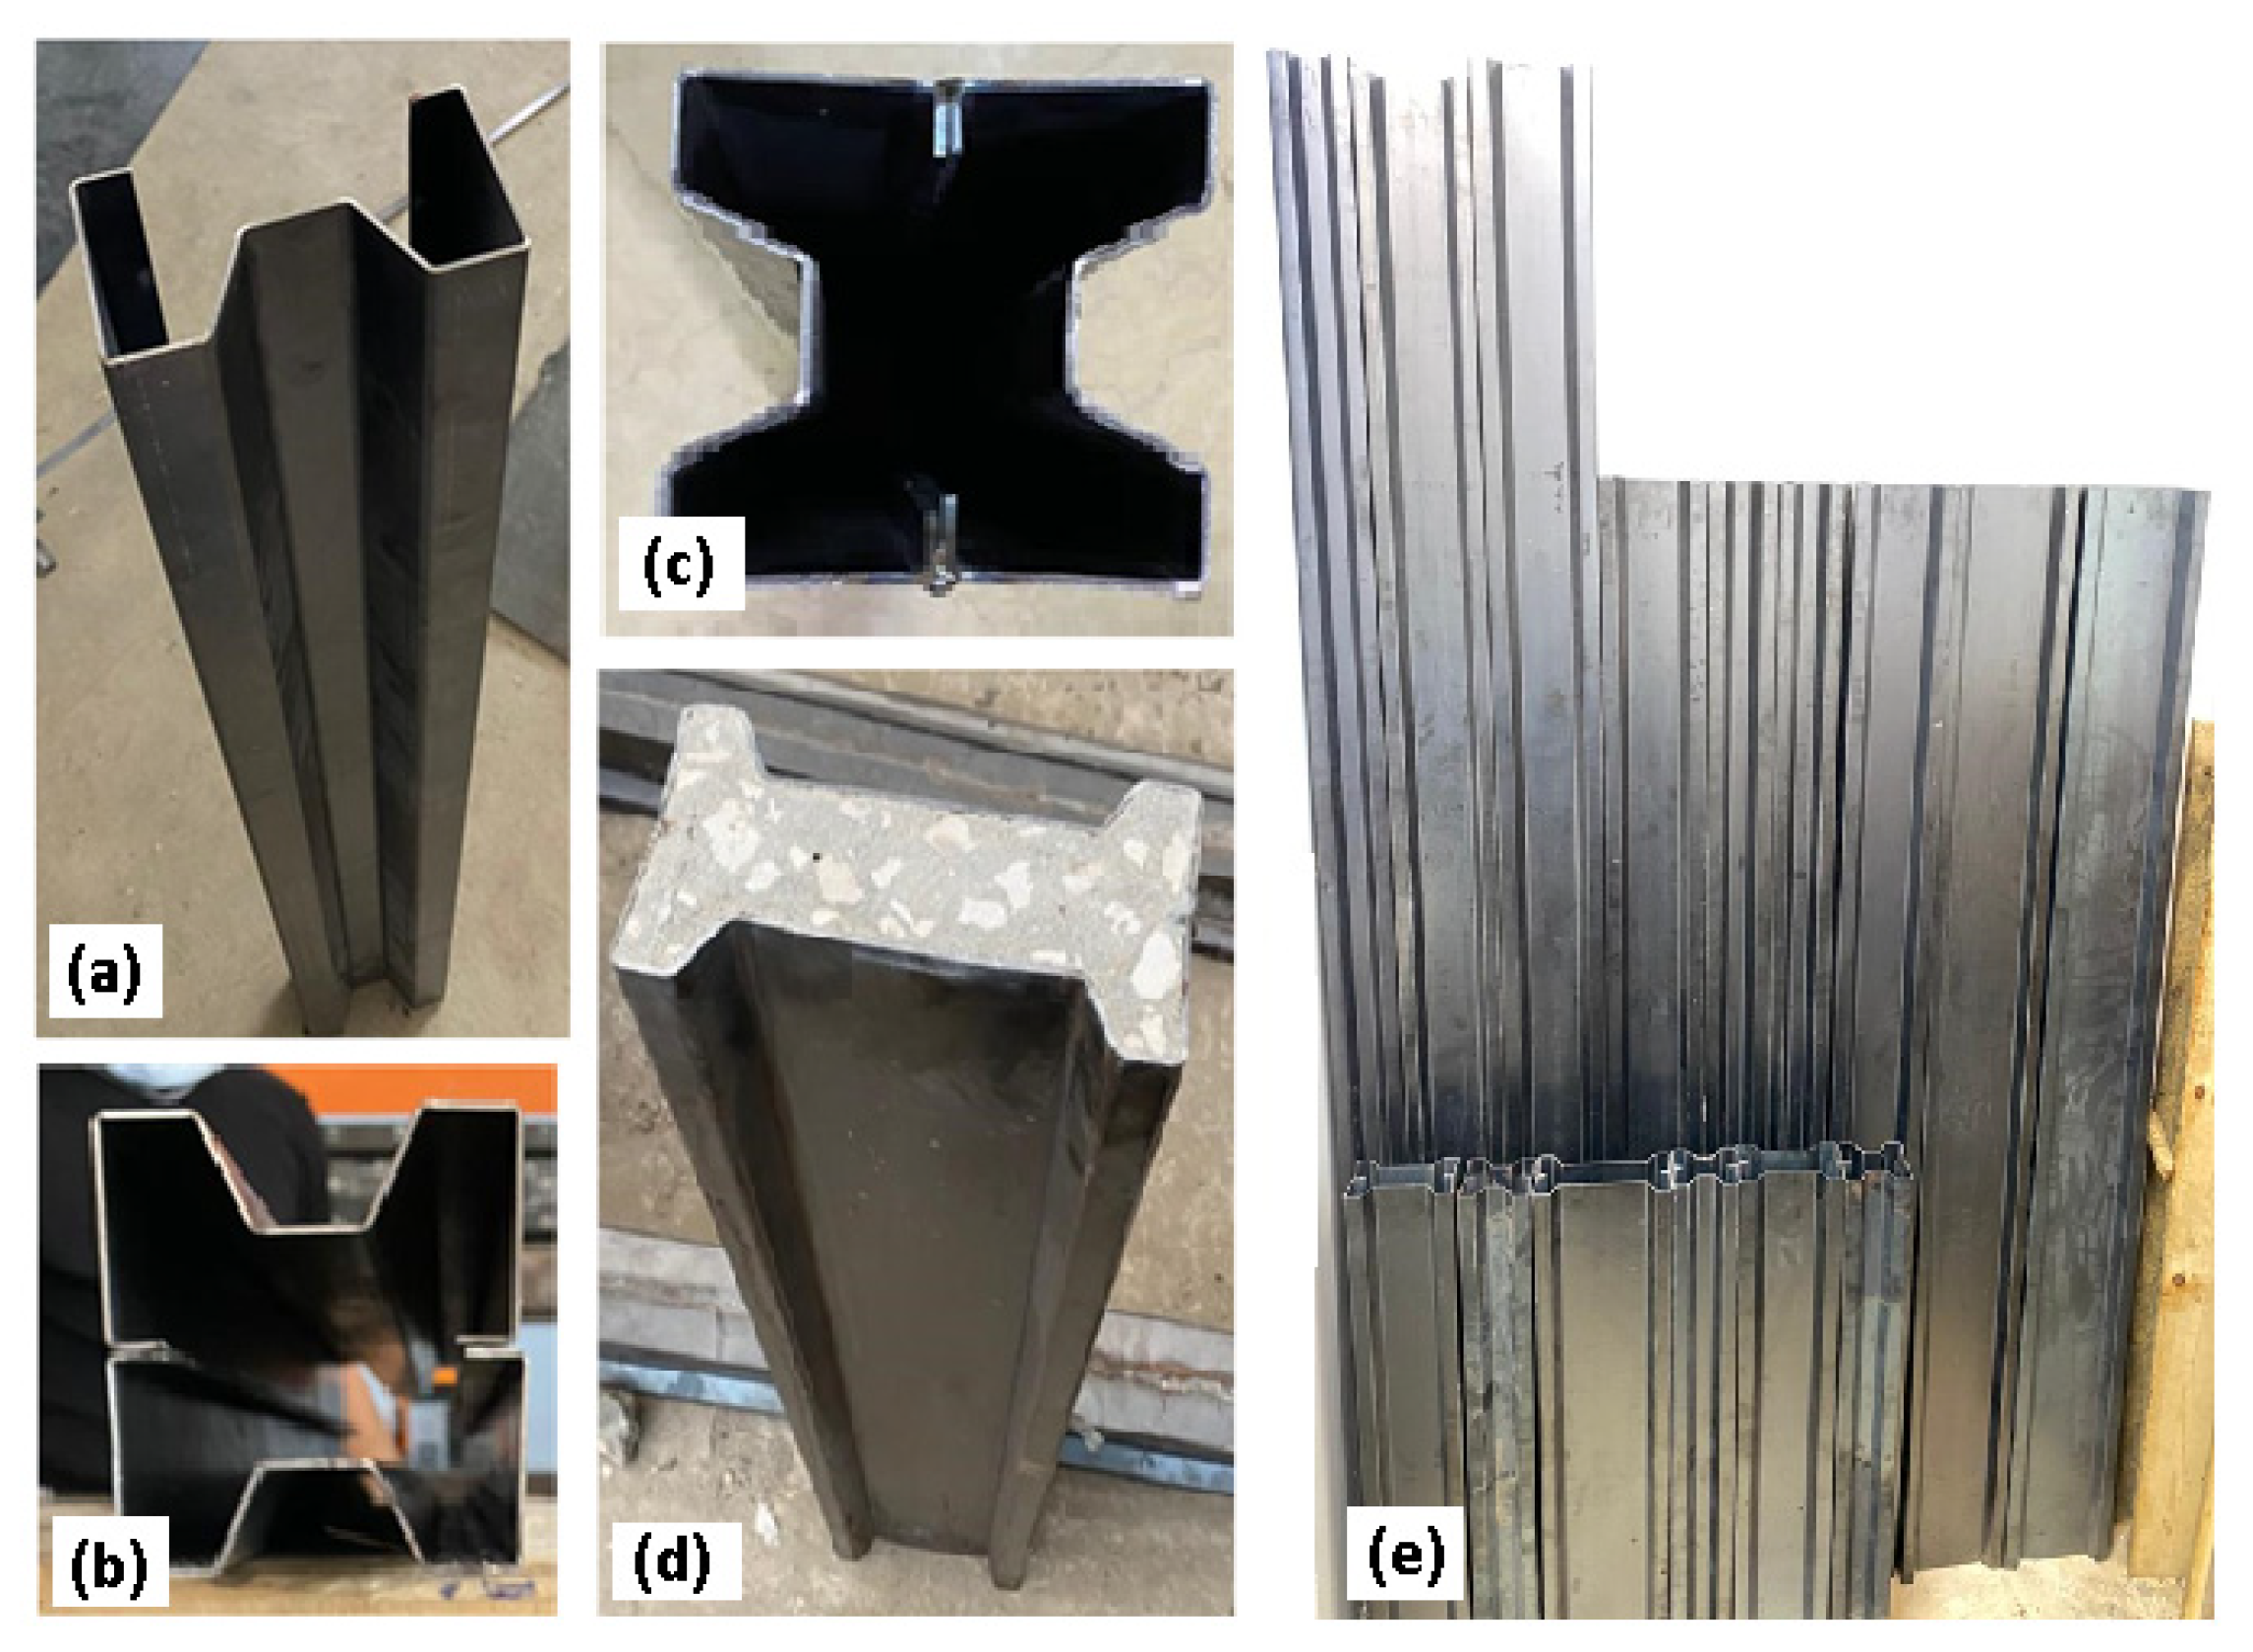
All specimens have the same cross section width (b) of 100 mm. Table 4 summarizes the configurations of each specimen, while Figure 2 shows the specimens manufacturing process and all fabricated steel shells tube.

2.4. Test Setup and Instrumentation

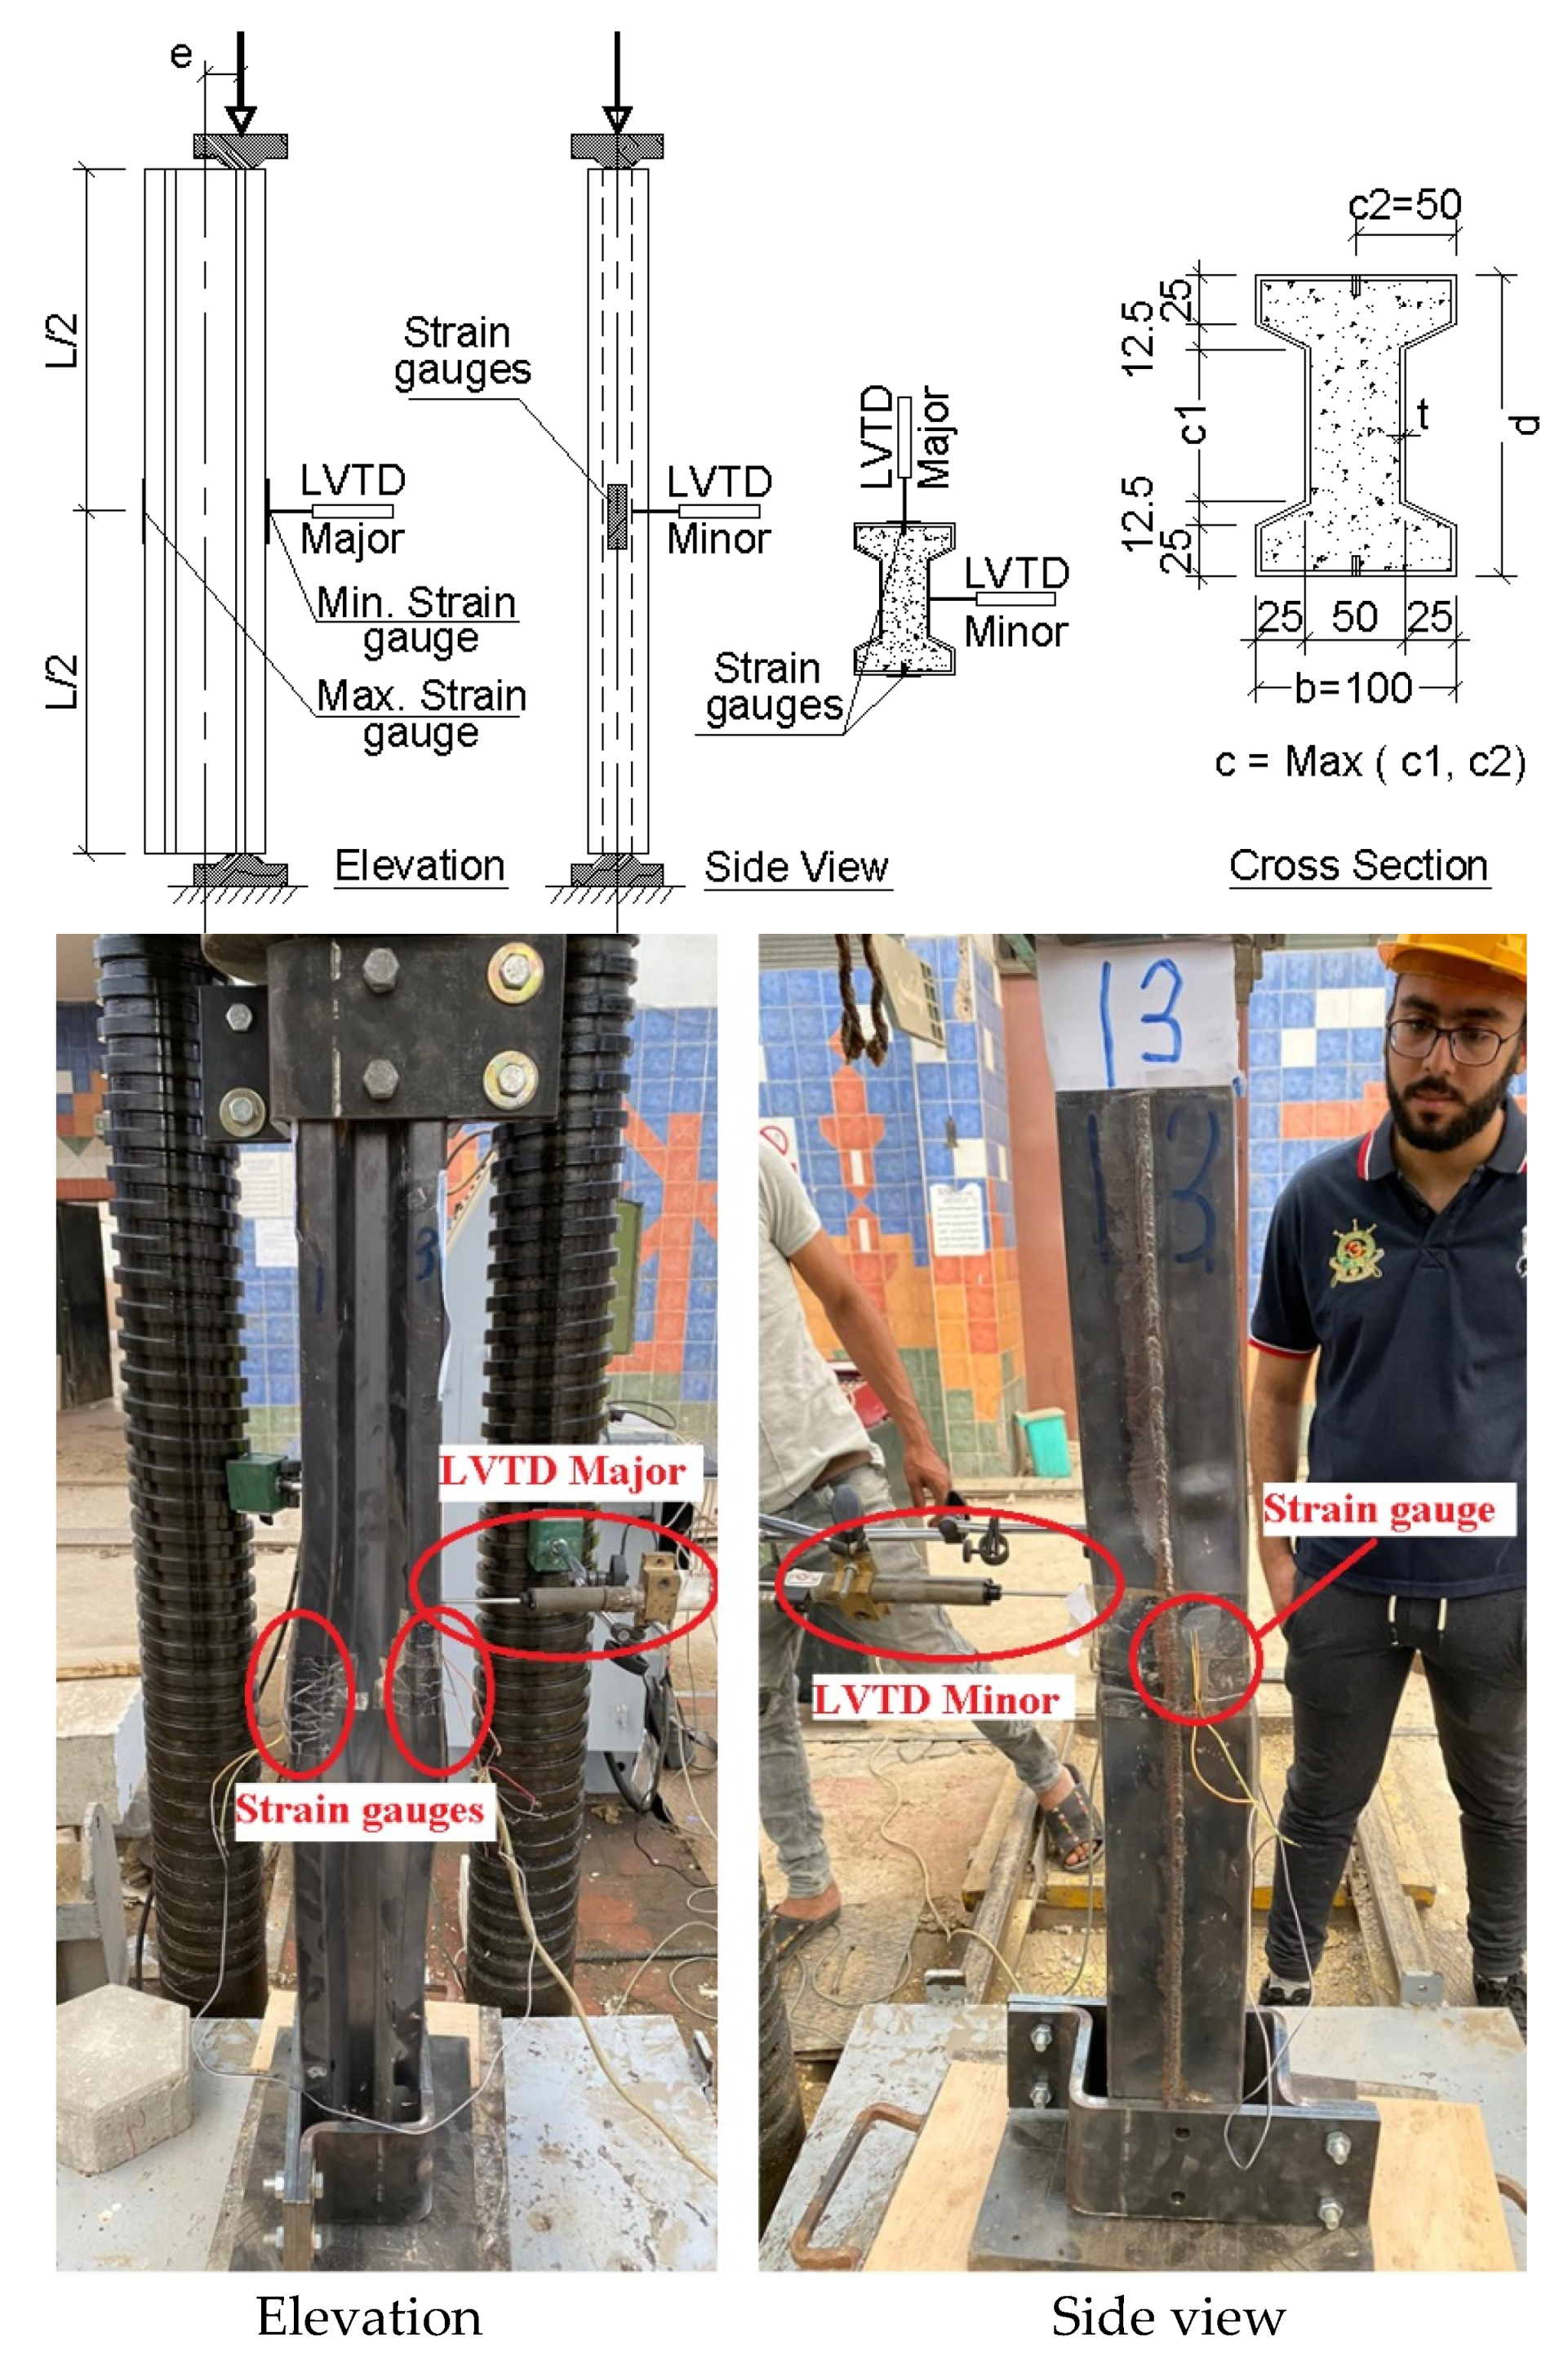
Each specimen was equipped with two strain gauges at mid height of the column on the 100 mm width faces measuring the maximum and minimum axial strains due to concentric and eccentric loads. In addition, two LVTDs were used to measure the lateral deformations at mid height of the column in both major and minor directions of the cross section. Finally, the testing frame is equipped with a load cell to measure the applied load. Figure 3 illustrates test setup and instrumentation.

2.5. Test Procedure

All specimens were tested under axial compression (concentric or eccentric) load up to failure using an AMSLER compression testing machine with 5000 kN capacity. To ensure full contact between the column head and loading plate, the top and bottom 20 mm was cut from each specimen using a concrete saw to obtain a smooth and leveled loading surface.
Two-ball seats were welded to the upper and lower steel loading heads at the required eccentricity to achieve the hinged support. The lower ball seating was fixed to the lower machine head to prevent any displacement of the specimens during testing. The upper plate is allowed to rotate around a fixed sphere. This ensures that the applied load is always passing through the desired location (concentric or eccentric) and perpendicular to the specimen cross section. The specimens were loaded up to failure with a loading rate of 50 kN per minute.

3. Experimental Results

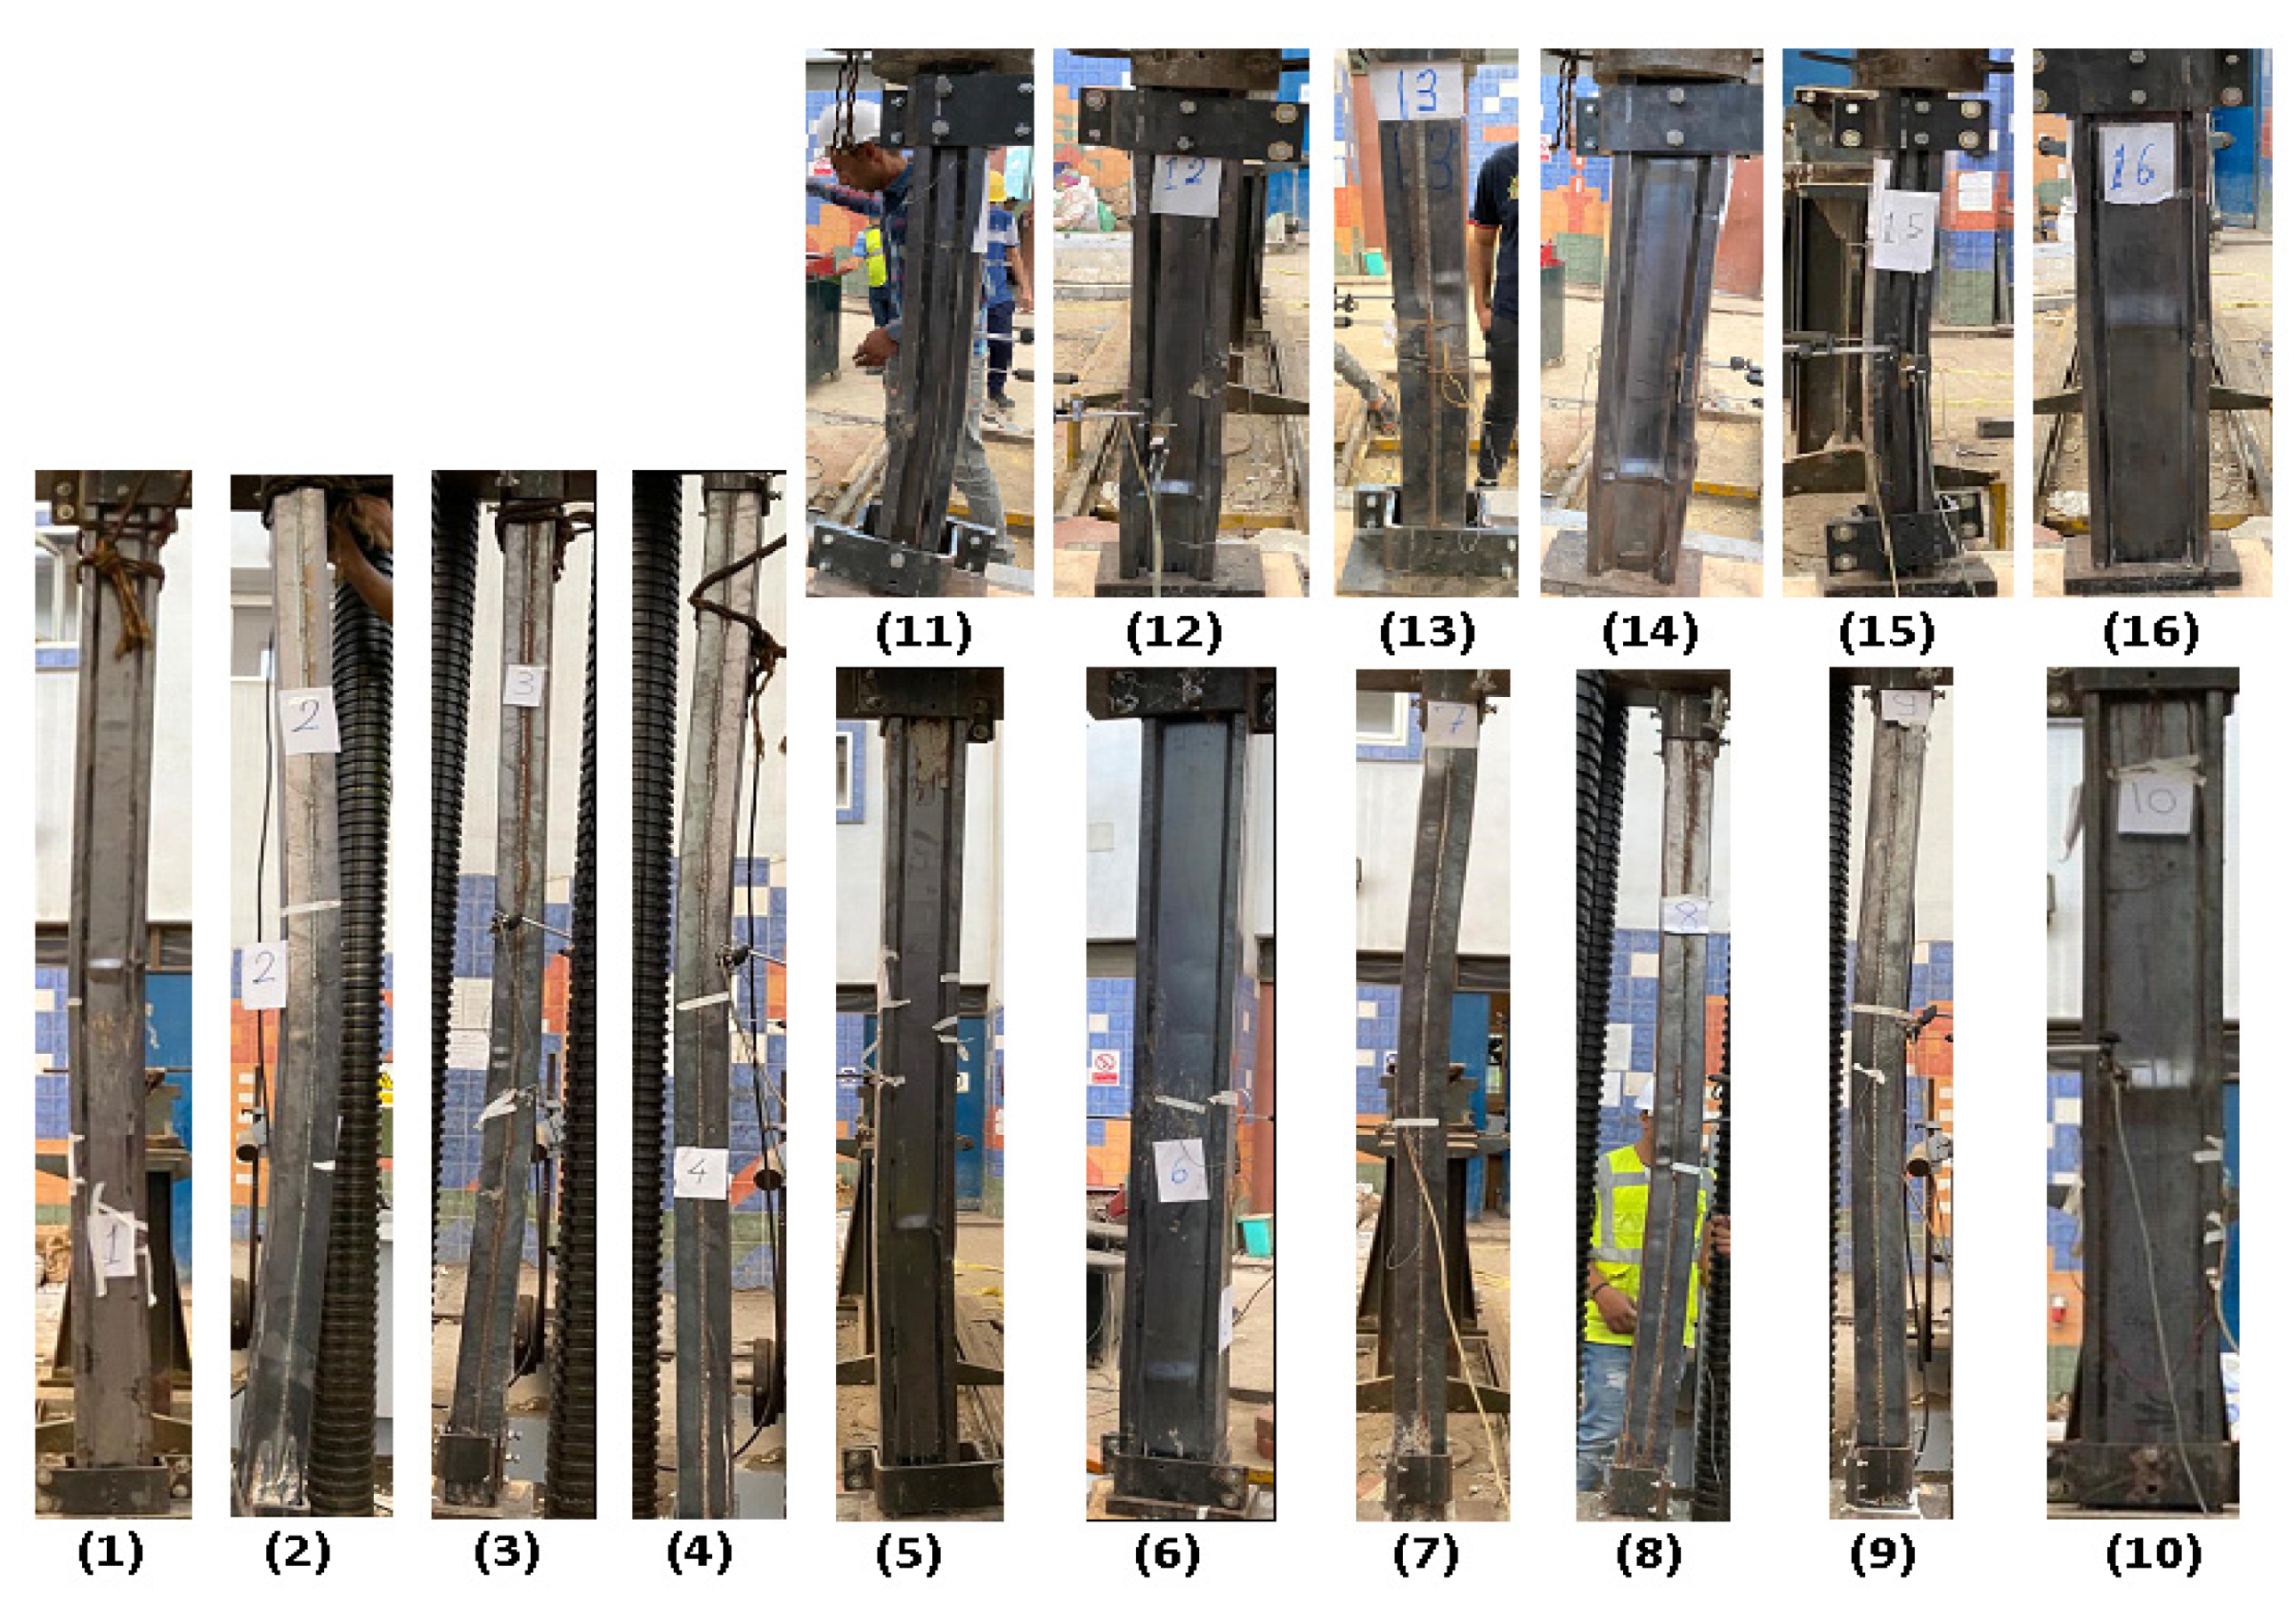
For each specimen, failure load, failure mode, maximum lateral deformations and axial strains were recorded as summarized in Table 5, where LVTD minor and major readings are the lateral movements of the mid-height specimen in minor and major cross section axis, respectively. Negative strain and positive strain values correspond to compressive stresses and tensile stresses, respectively. Figure 4 shows the failure modes of tested specimens.
The failure mode of each specimen was investigated based on the measured axial strains and lateral deformations as follows:
  • The lateral deformation due to eccentricity (in major direction) is estimated for each specimen using Equation (1):
    Δ major = P exp   e   L 2 8   EI  
    where (EI) is the fully bonded composite flexural stiffness; hence, if the measured Δ-major was close to or exceeded this value, that indicated flexural failure.
  • The lateral deformation due to global buckling (in a minor direction) is estimated for each specimen using Equation (2):
    Δ minor = λ 2   b 30,000  
    where (λ) is the fully bonded composite global slenderness ratio. If the measured Δ-minor was near or more than this value, that indicated global buckling failure.
  • Yield strain equals (Fy/Es) which is (0.33/210 = 1570 μ-strain). If the minimum measured strain was within this range or more, this value indicated overstressing failure.
  • Finally, if none of the above conditions occurred, this indicated a local buckling failure.
The marked numbers in Table 5 illustrate the critical values used in classifying the failure mode.

4. Theoretical Analysis

The ultimate capacities of the 16 tested columns were estimated according to the AISC-LRFD-94 code [20] and EN-1994-04 code [21] using the well-known CSI-COL. The capacities from the three theoretical methods were compared to experimental capacities. Table 6 summarizes these results.

4.1. AISC-LRFD-94 Code

The design philosophy of this code depends on estimating the equivalent strength of the composite column (Fym) and equivalent elastic modulus (Em), as shown in Equations (3) and (4), while the equivalent radius of gyration is the same as an empty steel shell.
Fym = Fy + c1 fyr (Ar/As) + c2 Fc (Ac/As)
Em = Es + c3 Ec (Ac/As)
where
  • fs and As are yield strength and cross sectional area of steel section
  • Fc and Ac are compressive strength and cross sectional areas of concrete
  • fyr and Ar are yield strength and cross sectional area of reinforcement bars
  • c1 = 1.00, c2 = 0.68 and c3 = 0.40 for in-filled composite columns.
For a small eccentric load, where the vertical load is more than 20% of the axial capacity of the section, the well-known interaction formula shown in Equation (5) is used.
(P/Pn) + 0.89 (Mx/Mxn) + 0.89 (My/Myn) = 1.0
where
  • P, Mx and My are the actual vertical load and bending moments in X and Y directions
  • Pn is the axial capacity of a section considering buckling, as shown in Equations (6) and (7)
  • Mxn and Myn are the flexural capacity of column section in X and Y directions without axial load and considering plastic stress distribution
Pn = Fcr As
Fcr = (1 − 0.348 λm2) Fym for λm ≤ 1.1
= 0.648 Fymm2 for λm > 1.1
where
  • λm is the normalized slenderness ratio = L   ( Fy / Em ) π r .

4.2. EN-1994-04 Code

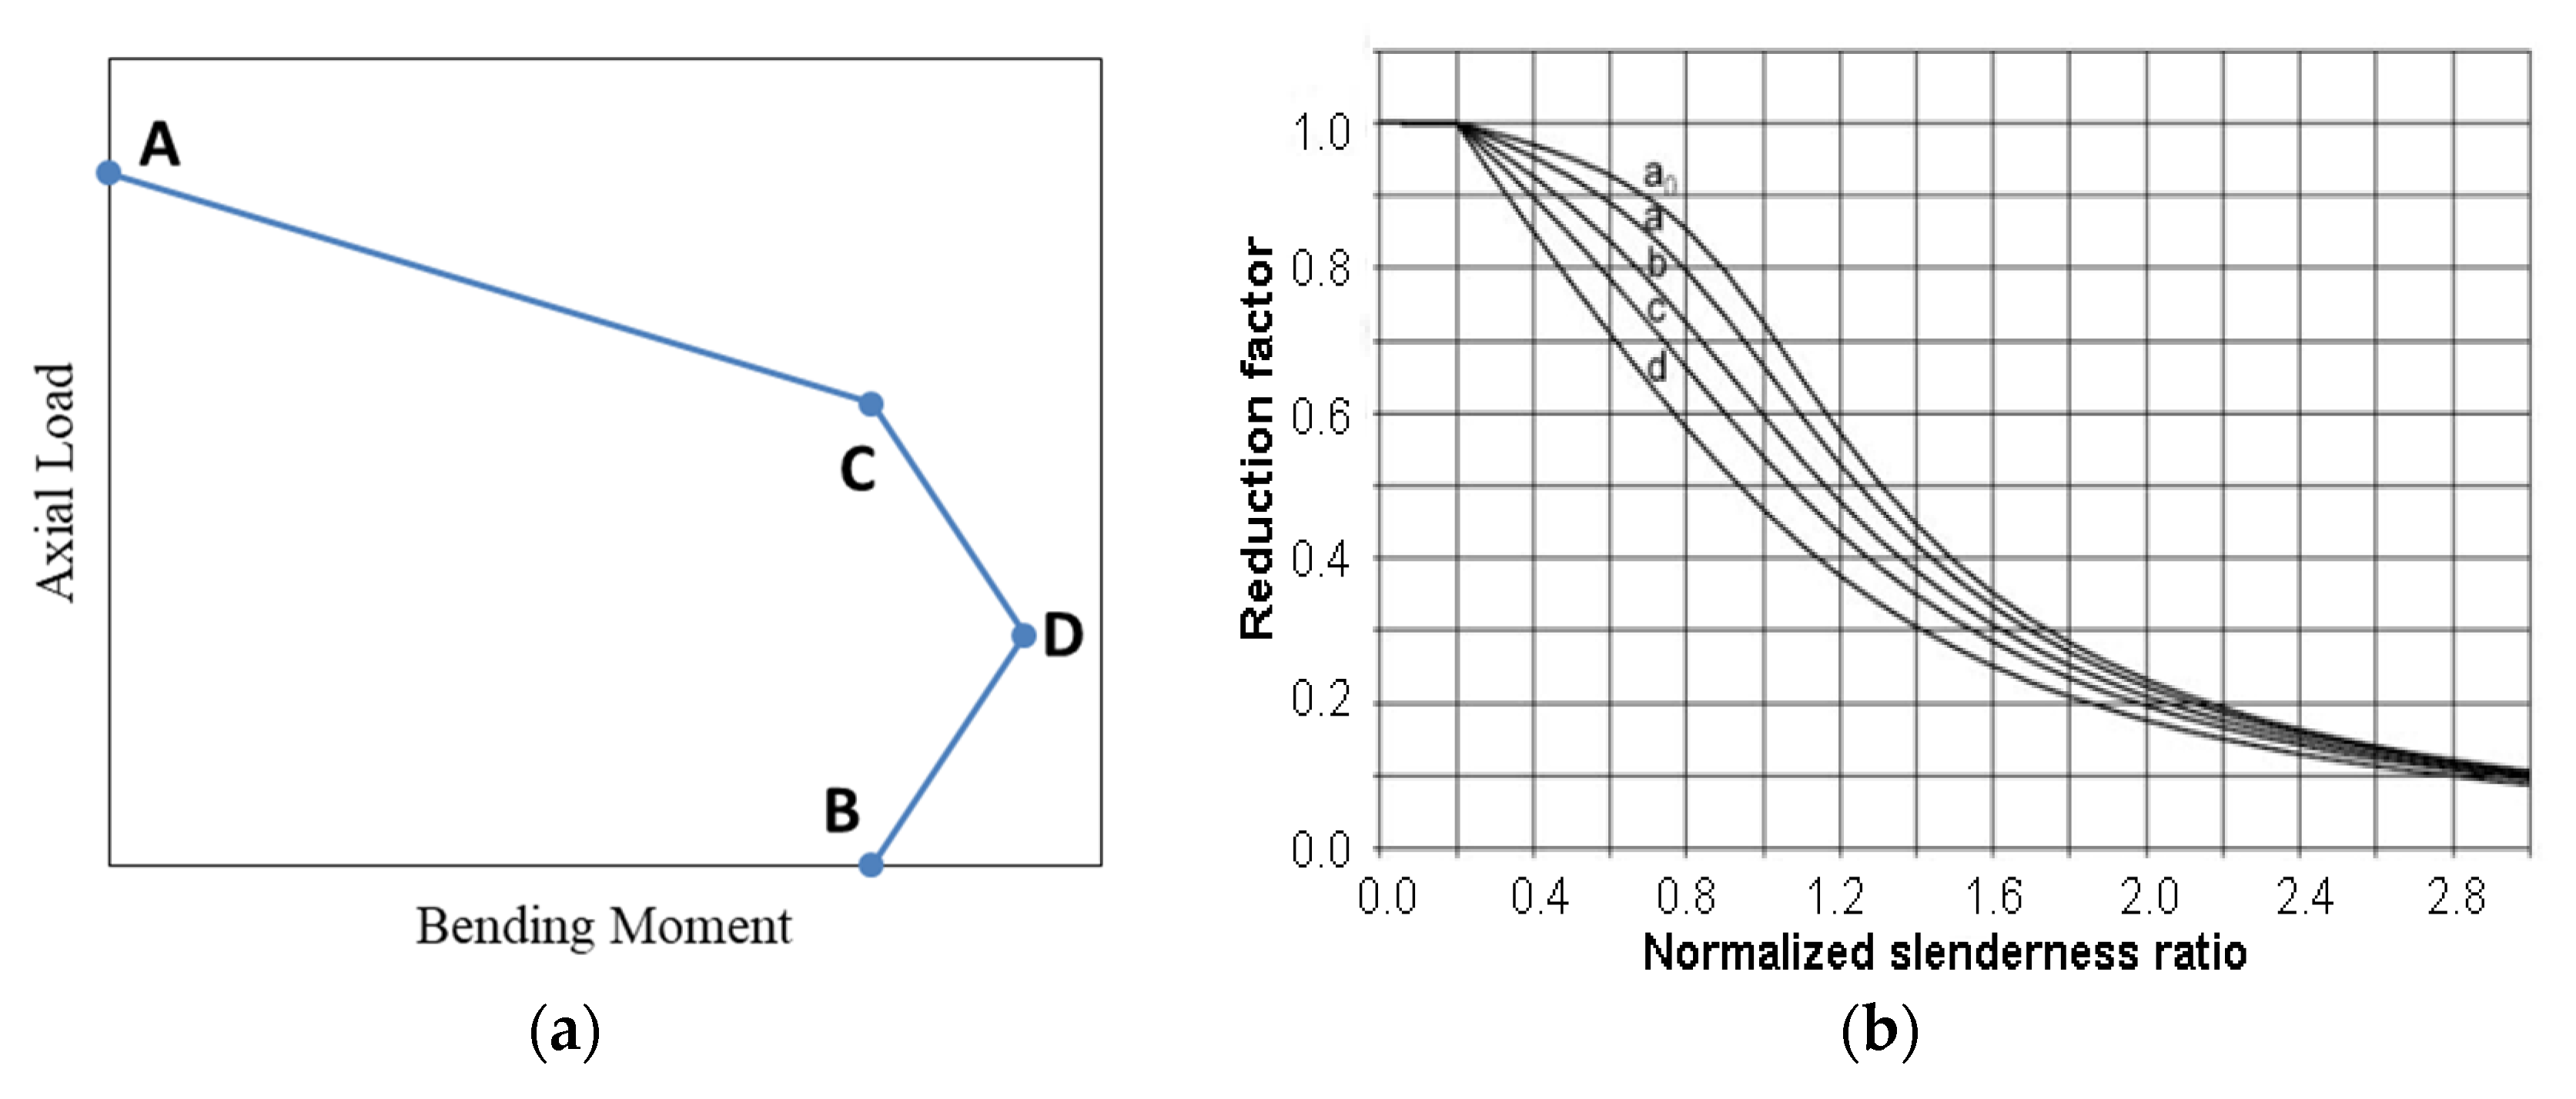
Unlike the AICS-LRFD code, EN-1994 depends on drawing an interaction diagram for the composite section with vertical load, considering the buckling effect on Y-axis and the bending moment on X-axis, as shown in Figure 5a.
Point (A) presents the pure axial capacity of the composite section considering the buckling effect as shown in Equation (8)
Pn = X (0.85 fc’ Ac + Fyr Ar + Fy As)
where X is the buckling reduction factor from curve “b” (for in-filled hollow sections) in Figure 5b.
Point (B) presents the pure plastic flexural capacity of the composite section without axial load. Point (C) has the same moment value as (B), and axial load equals the axial capacity of only the concrete section. Finally, point (D) has half the axial capacity of (C) and the plastic flexural capacity of the composite section, considering the effect of the corresponding axial load.
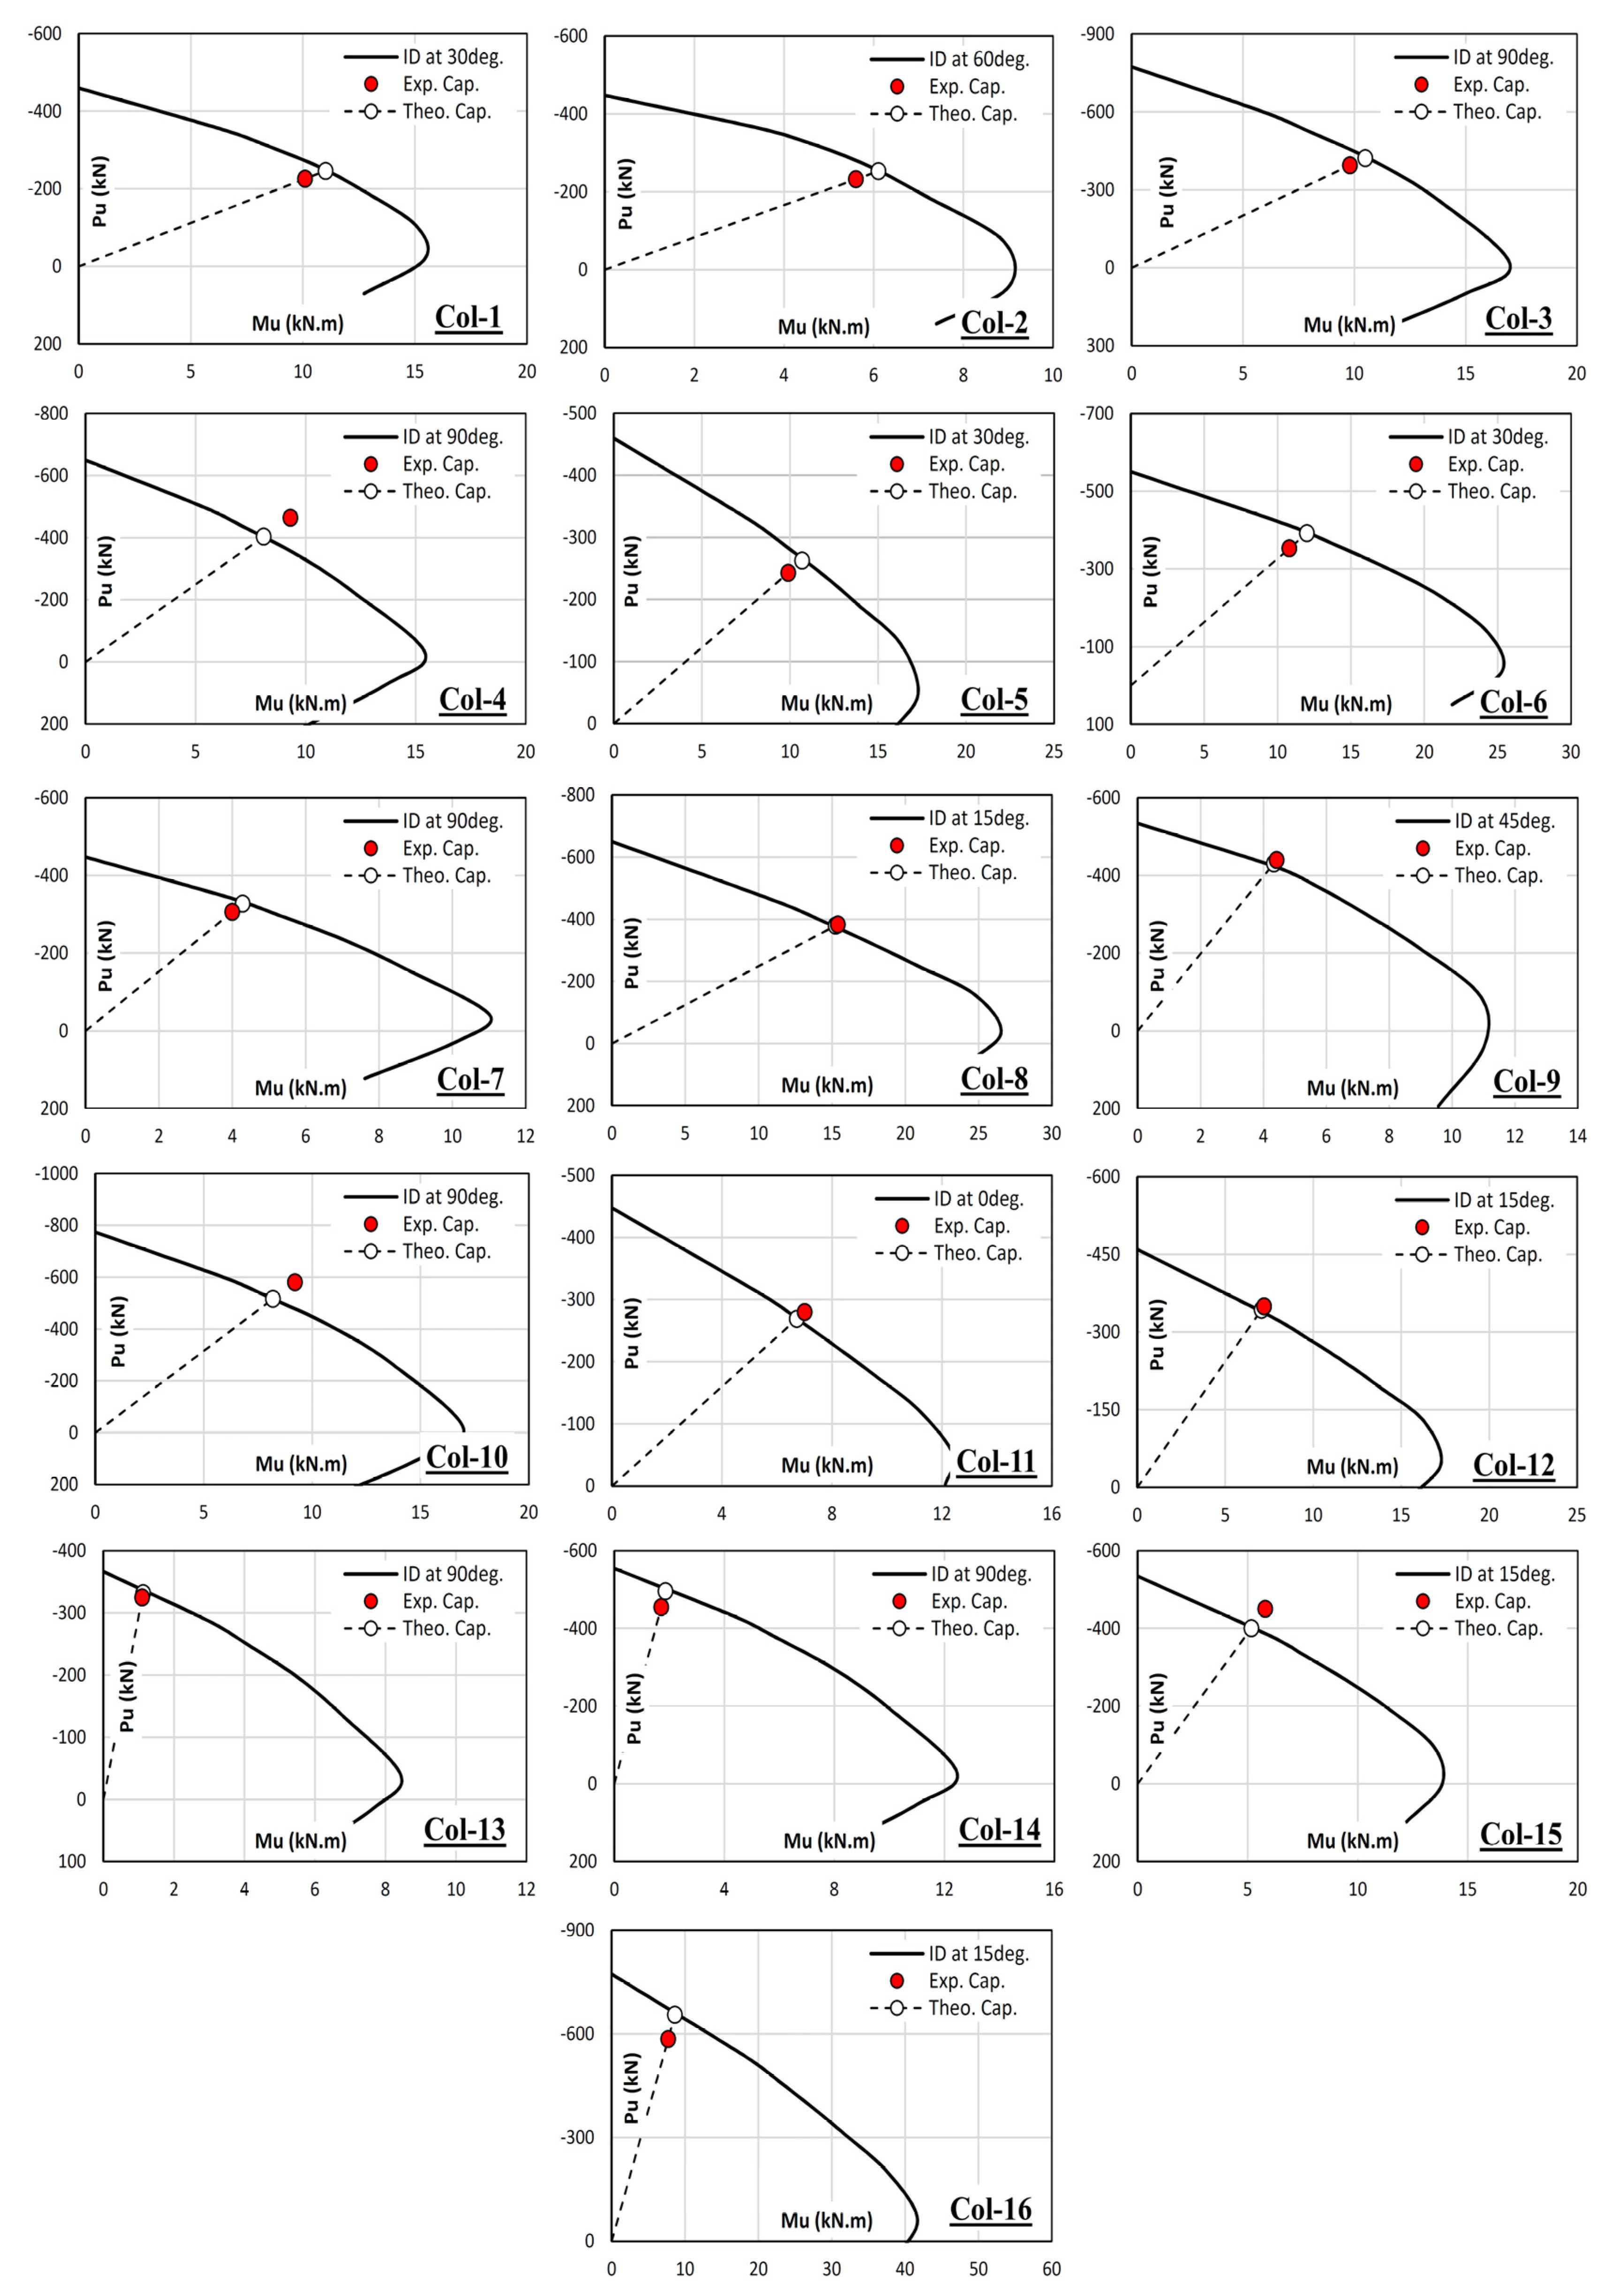
Once the interaction diagram is generated, the capacity of the section at a certain eccentricity could be determined by drawing a straight line from the origin with a slope equals to (N/M = 1/e) and finding its intersection with the interaction diagram.

4.3. Using CSI-COL Software (Computers & Structures INC., California, USA)

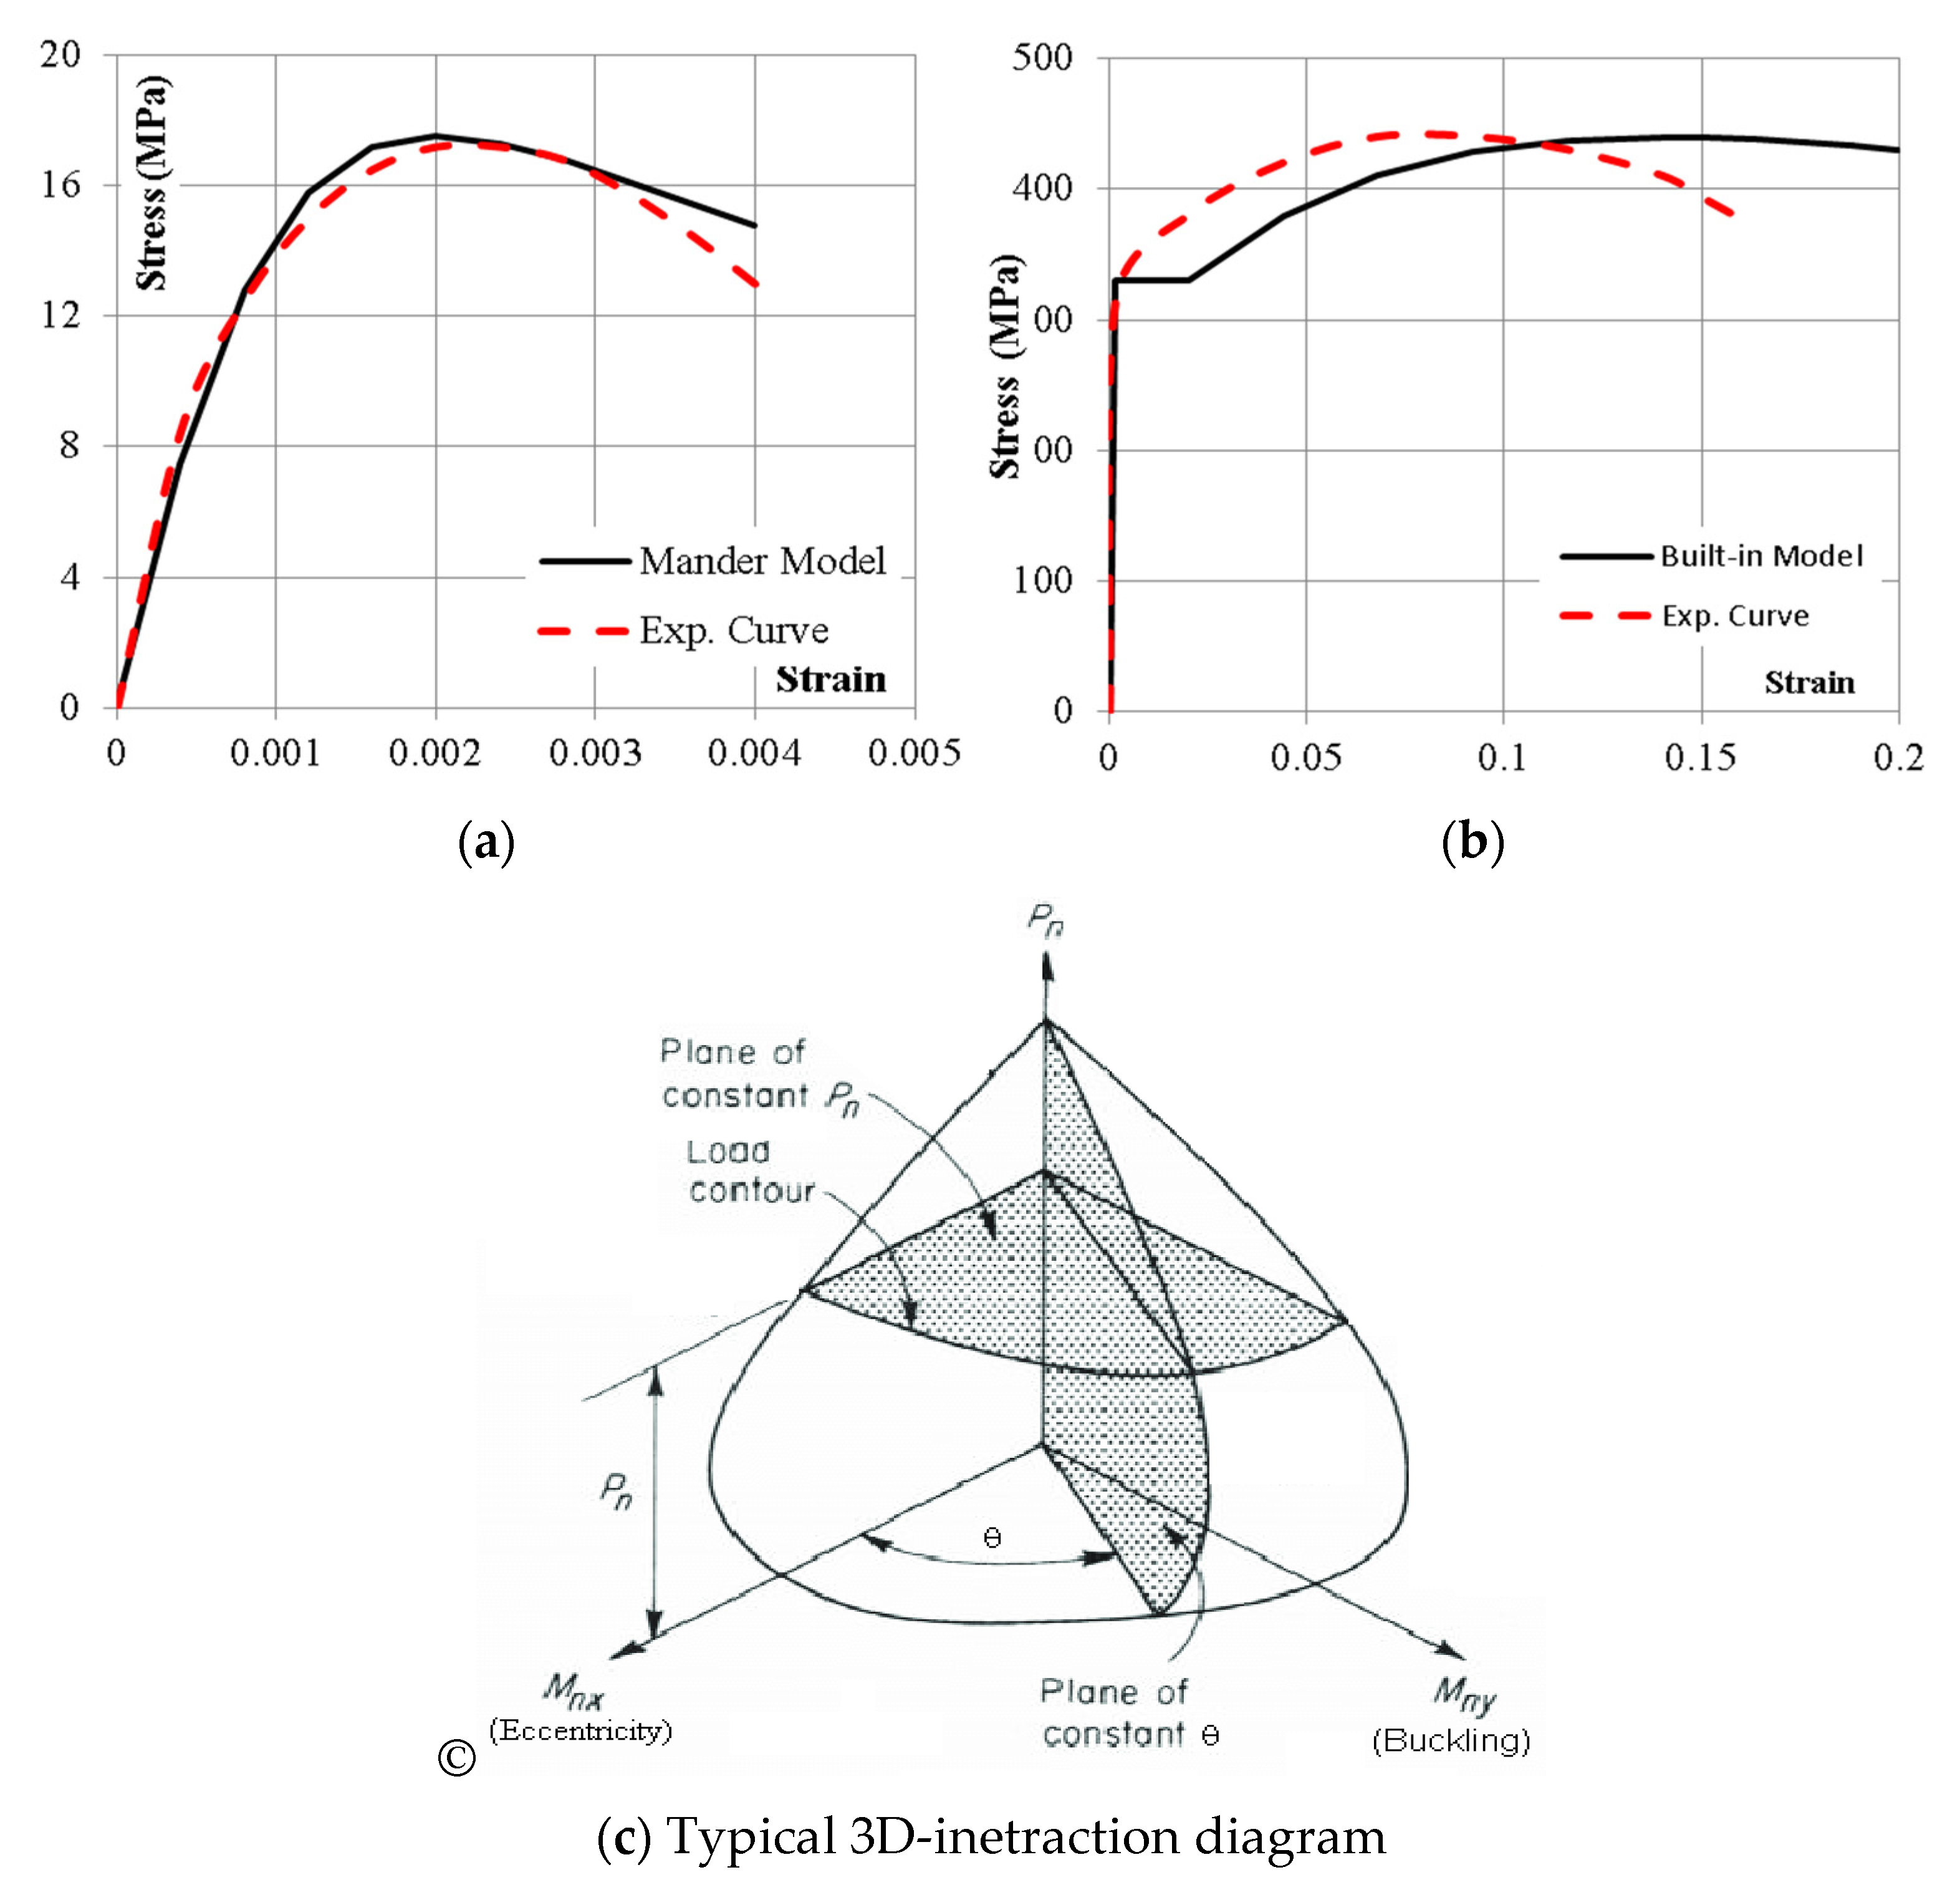
A 3D-interaction diagram (PMM-interaction diagram) was generated for each specimen using the well-known CSI-COL Ver. 6.2 software considering the built-in Mander model for unconfined concrete behavior and the built-in structural steel model. The stress–strain curve of the Mander model [22] is automatically generated for certain (fc’ and Ec) values, while the structural steel model requires (Fy and Fu) to generate the stress–strain curve. Figure 6 presents both the generated and the experimental stress–strain curves for steel and concrete and a typical 3D-interaction diagram.
In order to present both experimental and theoretical capacities graphically as shown in Figure 7, a certain section in the 3D interaction diagram is constructed. The angle of this section (θ) depends on the value of eccentricity moment (Mmajor = P × e) and buckling moment (Mminor = P × Δminor), as shown in Equation (9):
θ = tan−1 (Mminor/Mmajor)
In the constructed 2D interaction diagram, the presented bending moment is the resultant moment as shown in Equation (10):
Mresult = (Mminor2 + Mmajor2)0.5

5. Discussion

The summarized experimental results in Section 3 included the measured failure loads, maximum lateral deformations, extreme axial strains and the investigated models of failure. However, in order to study the impact of each considered parameter on the axial capacity and failure mode, the reduction factor (Pexp/Pmax) was calculated for each specimen, where Pmax is the maximum axial capacity of the composite section without considering the buckling effect as per Equation (11).
Pmax = 0.85 fc’ Ac + Fy As
Figure 8a presents the relation between the buckling reduction factor and the global normalized slenderness ratio for different relative eccentricities. The best fitting curves indicated the following:
  • The reduction factor (Pexp/Pmax) decreases with increasing the global normalized slenderness ratio regardless of the relative eccentricity.
  • For centric loading (e/d = 0) the reduction factor ranged between 90% and 60% for global normalized slenderness ratio of 0.4–1.1, respectively, which matches (EN-1994) curve “b” in Figure 5b.
  • For small eccentricity (e/d = 0.13), where the axial force acts inside the core of the section, the reduction factor is slightly less than the centric case, which indicates that plastic failure due to vertical load dominates the behavior.
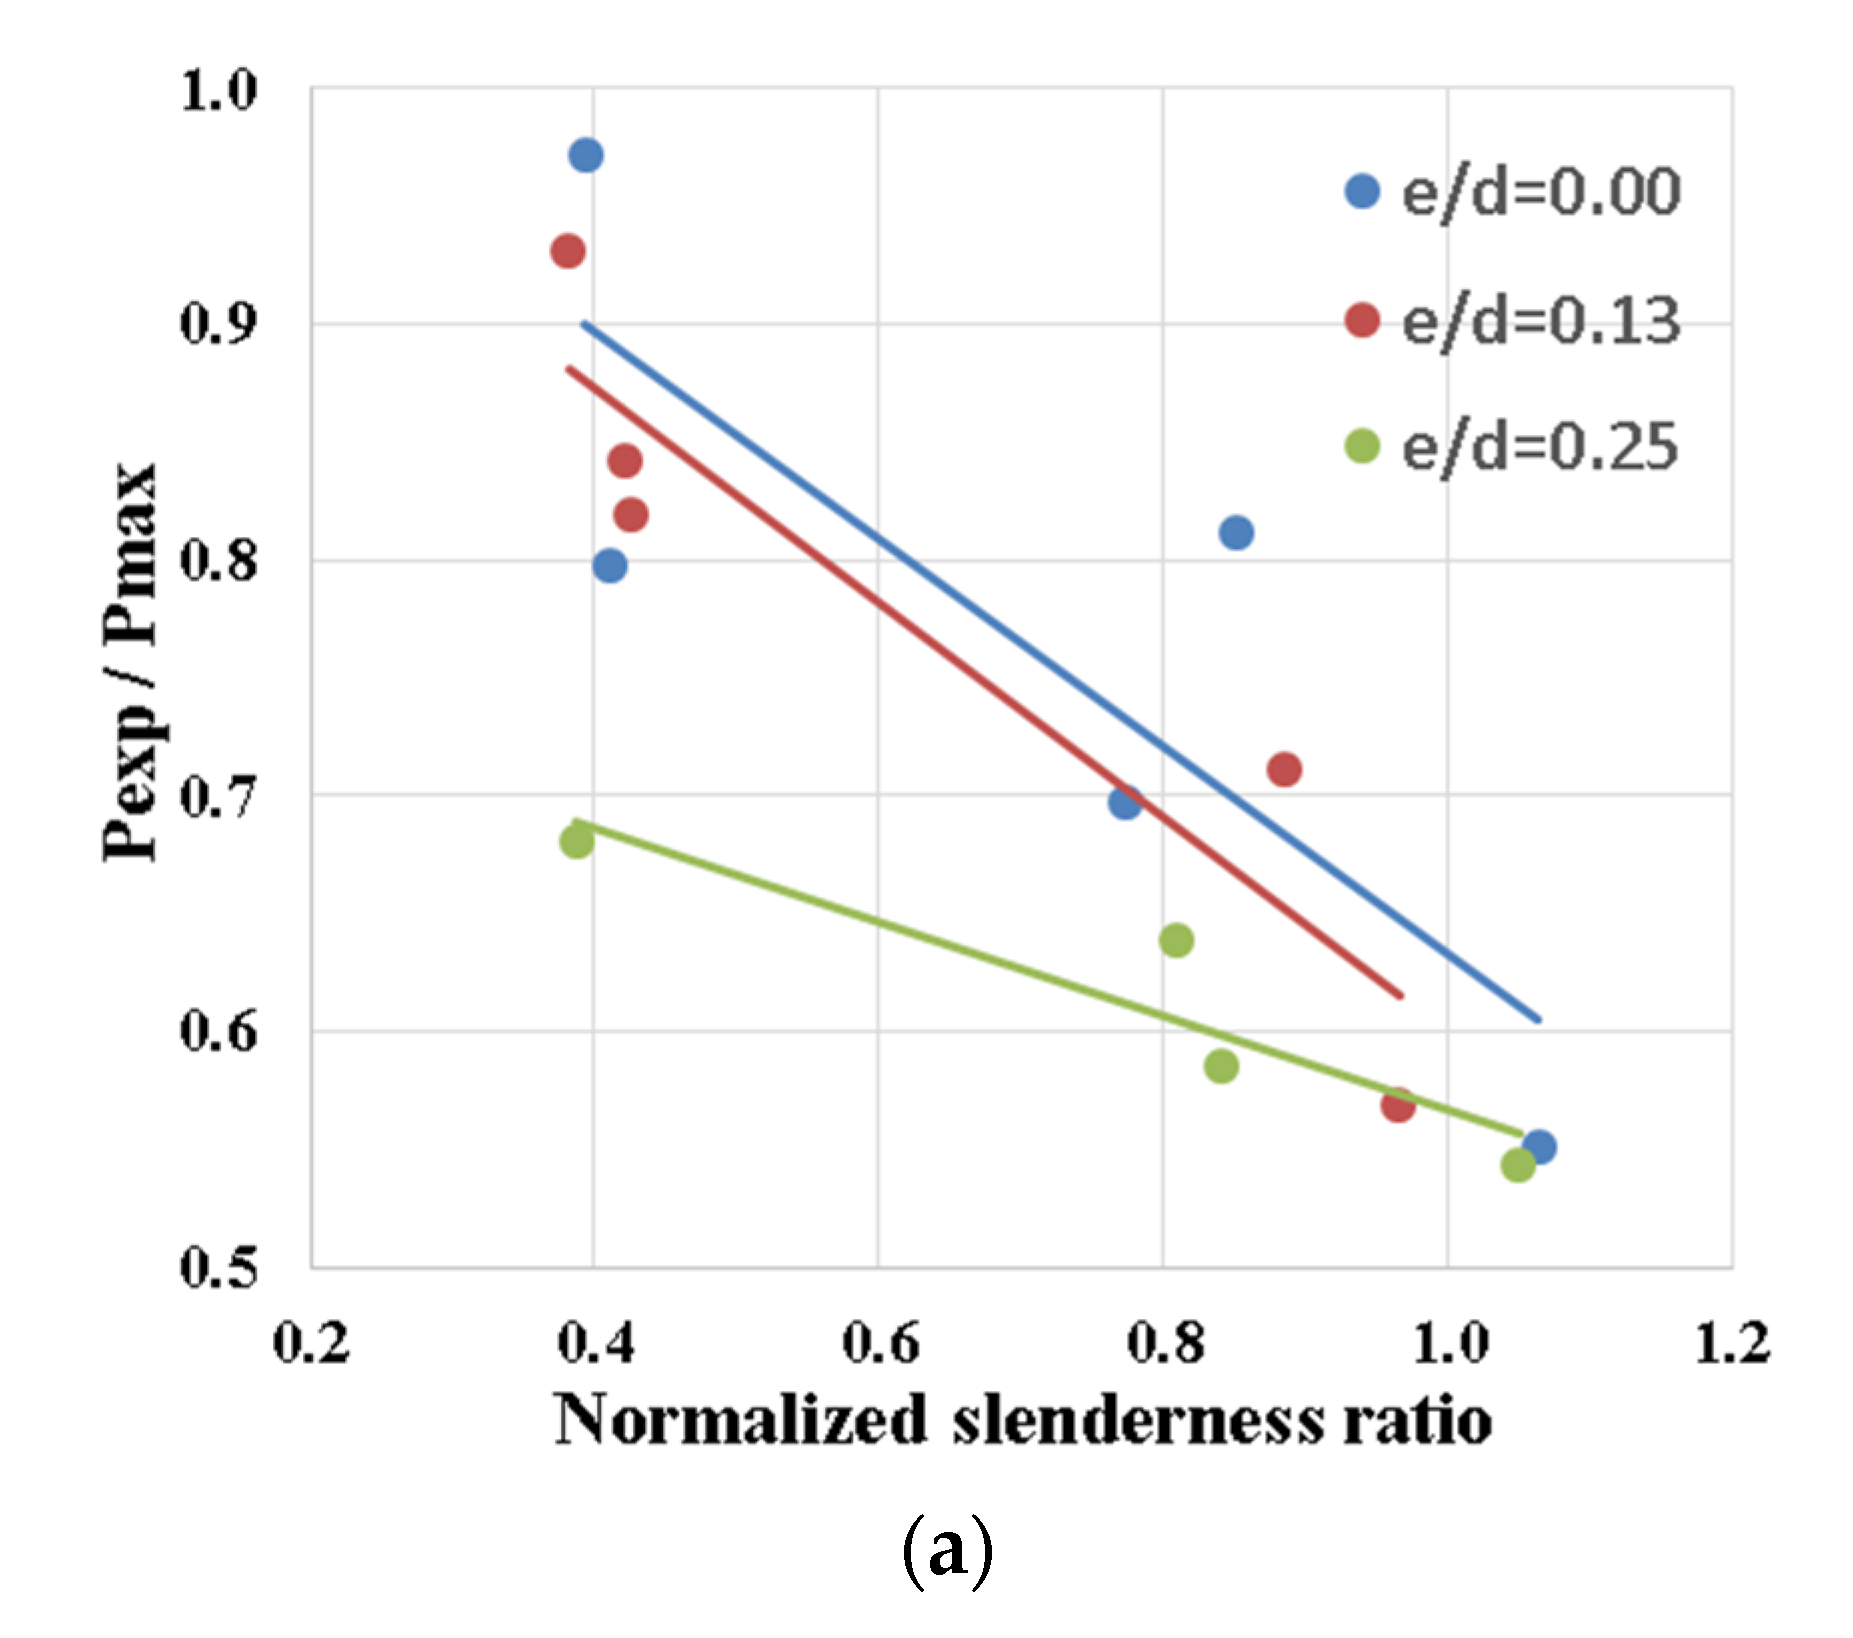
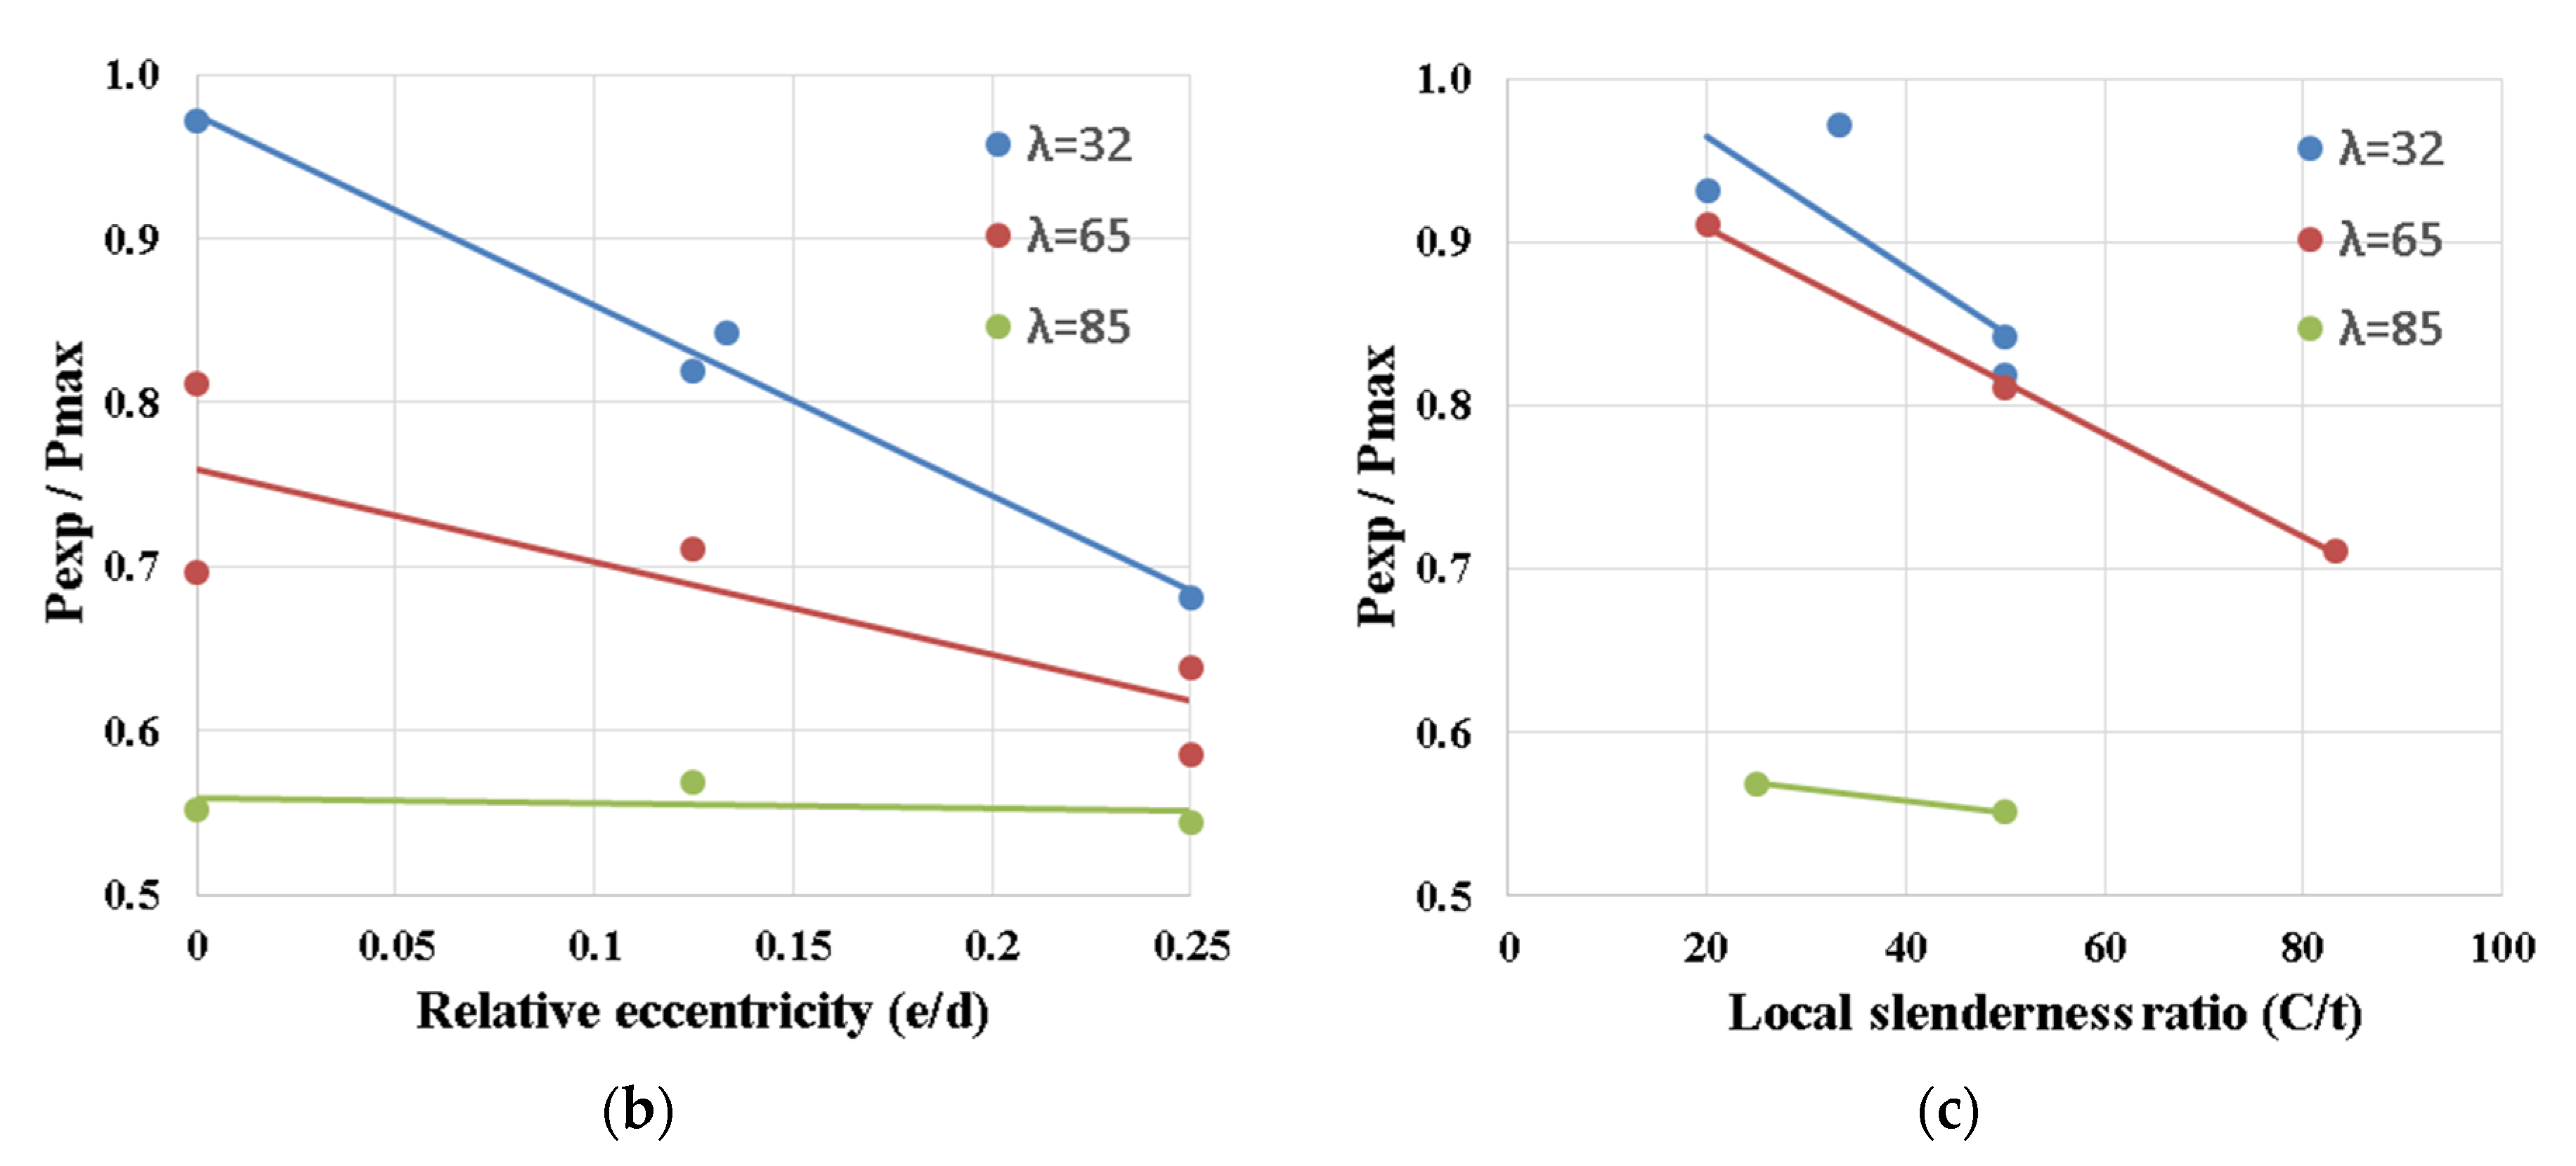
Figure 8. Relation between (Pexp/Pmax) and (a) normalized slenderness ratio, (b) relative eccentricity and (c) local slenderness ratio.
Designs 06 00082 g008aDesigns 06 00082 g008b
  • For critical eccentricity (e/d = 0.25), where the axial force acts on the core edge of the section, the reduction factor is significantly reduced, which indicates that flexural plastic failure dominates the behavior.
  • Finally, all fitting lines almost intersected at a normalized slenderness ratio of 1.1, which matches the elastic buckling limit of AISC that showed in Equation (7).
Figure 8b illustrates the relationship between the buckling reduction factor and relative eccentricities for different global slenderness ratios. The best fitting curves indicated the following:
  • The rate of reduction factor decreasing is decreased with increasing the slenderness ratio. The maximum decreasing rate was observed for the lowest slenderness ratio (λ = 32 or λ = 0.4), while the reduction factor was almost constant for the highest slenderness ratio (λ = 85 or λ = 1.05).
  • The slenderness limit that separates plastic failure from elastic buckling is about (λ = 90 or λ = 1.10), which matches the recommendations of the AISC code.
Figure 8c shows the relation between buckling reduction factor and local slenderness ratio for different global slenderness ratios. It could be noted that the impact of the local slenderness ratio (C/t) is clearly observed in the case of low and medium global slenderness ratios (λ = 32, 65 or λ = 0.4, 0.8), where the failure occurred due to overstressing. On the other hand, for high global slenderness ratios (λ = 85 or λ = 1.05), the effect of local buckling was very minor as the columns failed due to elastic buckling.
The comparison between both experimental results from Section 3 and theoretical analysis from Section 4 indicates the following points:
  • Both experimental and analytical results showed that the core of the considered composite section lies at e/d = 0.25. At this relative eccentricity, the minimum normal stress is almost zero (as shown in Table 5, specimens 1, 8 and 11).
  • The summarized results in Table 6 and Figure 9 show wed deviation of 24% between the experimental capacities and the calculated ones using AISC and EN-1994 codes, while the deviation was about 13% for the CSI-COL capacities.
  • The enhanced accuracy of CSI-COL may be justified as follows:
    -
    CSI-COL considered the Mander model for concrete behavior, which is so close to the experimental one (as shown in Figure 6a). On the other hand, most design codes (including AISC and EN-1994) considered a simplified equivalent block distribution to simulated concrete behavior.
    -
    CSI-COL considered a non-linear stress–strain relation for steel sections, while design codes used simplified bilinear elastic–perfect plastic relation.
    -
    The formulas in design codes were developed based on regular cross sections (rectangular or circular in-filled tubes), while CSI-COL considered the actual non-regular cross section of double sigma face-to-face.
    -
    The software used generates a 3D-interaction diagram, while AISC uses an interaction formula and EN-1994 uses a simplified polygon 2D interaction diagram.
  • Although CSI-COL showed better accuracy than design codes, it still has a significant deviation from the experimental results. This deviation could be justified as follows:
    -
    The built-in stress–strain curve for steel sections in CSI-COL has a significant deviation from the actual one, as shown in Figure 6b.
    -
    CSI-COL does not consider the effect of local buckling of the thin steel shell.
    -
    There must be some imperfections and random errors in manufacturing and testing the samples, which cannot be considered in any theoretical analysis.

6. Conclusions

This paper studied both experimental and theoretical behaviors of composite columns consisting of two cold-formed sigma sections welded face to face and filled with concrete. The study considered axial and eccentric compression loading for different slenderness ratios. The results of this study could be summarized in the following points.
  • Experimental tests, design codes and CSI-COL software results indicated that overstressing plastic failure is distinguished from elastic buckling failure at a normalized slenderness ratio of about 1.1 (λ ≈ 90).
  • Both theoretical calculations and strain measurements showed that the core edge of this section is located at relative eccentricity (e/d) equals 0.25.
  • The calculated capacities using CSI-COL software, AISC-LRFD-94 and EN-1994-04 had deviations of (13%, 24% and 24%) from the experimental capacities, respectively.
  • Although the local buckling failure was experimentally observed for local slenderness ratio (c/t = 80), none of the three used theoretical methods was able to capture this behavior. An advanced non-linear 3D FEM modeling may be needed to simulate this phonon.
  • The good matching between experimental and CSI-COL capacities indicated that the studied section could achieve full composite behavior without using any shear connectors.
  • The results of this study are limited by the size of the tested sample; more full-scale samples should be tested to verify the accuracy of the concluded results.
  • Further studies may be carried out using more advanced 3D-FEM modeling to investigate the local buckling behavior of this section.

Author Contributions

Conceptualization, M.A.E.-A.; methodology and editing, A.M.E.; formal analysis and investigation, M.A.R.; supervision, S.M.I. All authors have read and agreed to the published version of the manuscript.

Funding

This research received no external funding.

Data Availability Statement

Not applicable.

Conflicts of Interest

The authors declare no conflict of interest.

References

  1. Alimohammadi, H.; Hesaminejad, A.; Yaghin, M.L. Effects of different parameters on inelastic buckling behavior of composite concrete-filled steel tubes. Int. Res. J. Eng. Technol. 2019, 6, 603–609. [Google Scholar]
  2. Liu, D.; Gho, W.; Yuan, J. Ultimate capacity of high-strength rectangular. J. Constr. Steel Res. 2003, 59, 1499–1515. [Google Scholar] [CrossRef]
  3. Zhu, L.; Ma, L.; Bai, Y.; Li, S.; Song, Q. Large diameter concrete-filled high strength steel tubular stub. Thin-Walled Struct. 2016, 108, 12–19. [Google Scholar] [CrossRef]
  4. Han, L.; Yao, G.; Zhao, X. Tests and calculations for hollow structural steel (HSS) stub columns filled with self-consolidating. J. Constr. Steel Res. 2005, 61, 1241–1269. [Google Scholar] [CrossRef]
  5. Zhang, S.; Guo, L. Behavior of High Strength Concrete-Filled Slender RHS Steel Tubes. Adv. Struct. Eng. 2007, 10, 337–351. [Google Scholar] [CrossRef]
  6. Guo, L.; Zhang, S.; Xu, Z. Behavior of Filled Rectangular Steel HSS Composite Columns under Bi-Axial Bending. Adv. Struct. Eng. 2011, 14, 295–306. [Google Scholar] [CrossRef]
  7. Bahrami, A.; Badaruzzaman, W.H.W.; Osman, S.A. Finite Element Analysis of Ultimate Load Capacity of Slender Concrete-Filled Steel Composite Columns. In Proceedings of the International Conference on Advanced Science, Engineering and Information Technology 2011, Bangi-Putrajaya, Malaysia, 14–15 January 2011. [Google Scholar] [CrossRef]
  8. Ren, Q.X.; Han, L.H.; Lam, D.; Hou, C. Experiments on special-shaped CFST stub columns under axial compression. J. Constr. Steel Res. 2014, 98, 123–133. [Google Scholar] [CrossRef]
  9. Wang, Z.B.; Tao, Z.; Yu, Q. Axial compressive behavior of concrete-filled double-tube stub columns with stiffeners. Thin-Walled Struct. 2017, 120, 91–104. [Google Scholar] [CrossRef]
  10. Ding, F.X.; Wang, W.J.; Lu, D.R.; Liu, X.M. Study on the behavior of concrete-filled square double-skin steel tubular stub columns under axial loading. In Structures; Elsevier: Amsterdam, The Netherlands, 2020; pp. 665–676. [Google Scholar] [CrossRef]
  11. Ci, J.; Jia, H.; Chen, S.; Yan, W.; Song, T.; Kim, K.S. Performance analysis and bearing capacity calculation on circular concrete filled double steel tubular stub columns under axial compression. In Structures; Elsevier: Amsterdam, The Netherlands, 2020; pp. 554–565. [Google Scholar] [CrossRef]
  12. Tao, Z.; Uy, B.; Han, L.H.; Wang, Z.B. Analysis and design of concrete-filled stiffened thin-walled steel tubular columns under axial compression. Thin-Walled Struct. 2009, 47, 1544–1556. [Google Scholar] [CrossRef]
  13. Young, B.; Ellobody, E. Experimental investigation of concrete-filled cold-formed high strength stainless steel tube columns. J. Constr. Steel Res. 2005, 62, 484–492. [Google Scholar] [CrossRef]
  14. Dai, P.; Yang, L.; Wang, J.; Zhou, Y. Compressive strength of concrete-filled stainless steel tube stub columns. Eng. Struct. 2020, 205, 110106. [Google Scholar] [CrossRef]
  15. He, A.; Liang, Y.; Zhao, O. Flexural buckling behaviour and resistances of circular high strength concrete-filled stainless steel tube columns. Eng. Struct. 2020, 219, 110893. [Google Scholar] [CrossRef]
  16. Azad, S.K.; Li, D.; Uy, B. Axial slenderness limits for austenitic stainless steel-concrete composite columns. J. Constr. Steel Res. 2020, 166, 105856. [Google Scholar] [CrossRef]
  17. El Aghoury, M.A.; Hana, M.T.; Amoush, E.A. Axial stability of columns composed of combined sigma CFS. In Proceedings of the Annual Conference of Structural Stability Research Council, Orlando, FL, USA, 12–15 April 2016. [Google Scholar]
  18. el Aghoury, M.A.; Hana, M.T.; Amoush, E.A. Strength of combined sigma cold formed section columns. In Proceedings of the EUROSTEEL 2017, Copenhagen, Denmark, 13–15 September 2017. [Google Scholar]
  19. ASTM E8/E8M−13a; Standard Test Methods for Tension Testing of Metallic Materials. ASTM International: West Conshohocken, PA, USA, 2022. [CrossRef]
  20. American Institute of Steel Construction (AISC). Manual of Steel Construction-Load & Resistance Factor Design-Volume I-Structural Members, Specifications, & Codes; American Institute of Steel Construction: Chicago, IL, USA, 1994; ISBN 1-56424-042-8. [Google Scholar]
  21. EN 1994-1-1:2004; Eurocode 4: Design of Composite Steel and Concrete Structures–Part 1-1: General Rules and Rules for Buildings. European Committee for Standardization (CEN): Brussels, Belgium, 2004.
  22. Mander, J.B.; Priestley, M.J.N.; Park, R. Theoretical stress-strain model of confined concrete. J. Struct. Eng. 1988, 114, 1804–1826. [Google Scholar] [CrossRef] [Green Version]
Figure 1. Grain size distribution of fine and coarse aggregates.
Designs 06 00082 g001
Figure 2. Specimens manufacturing process (a) Forming sigma sections, (b) assembling column section, (c) welding the two stigmas, (d) casting concrete and (e) all fabricated steel shells.
Designs 06 00082 g002
Figure 3. Testing setup, instrumentation and typical dimensions of specimen cross section.
Designs 06 00082 g003
Figure 4. Failure modes of tested specimens.
Designs 06 00082 g004
Figure 5. (a) Typical interaction diagram of EN-1994. (b) Buckling reduction factor of EN-1994.
Designs 06 00082 g005
Figure 6. Used material modes (a) for concrete, (b) for steel and (c) typical 3D interaction diagram.
Designs 06 00082 g006
Figure 7. CSI-COL interaction diagrams for the tested specimens.
Designs 06 00082 g007
Figure 9. Comparison between both experimental and theoretical capacities. (a) Using AISC-LRFD, (b) Using EN-1994, (c) Using CSI-COL software.
Designs 06 00082 g009
Table 1. The concrete mix proportions (by weight/m3).
ItemOPC
Grade R42.5
Coarse Aggregate (Crushed Stone)Fine Aggregate
(Natural Sand)
Potable
Water
UnitkgkgkgLiter
Value2501300650125
Table 2. Steel properties.
SampleThickness (mm)Fy (Mpa)Fu (Mpa)
11.5336445
22.0329438
32.5322431
Table 3. Considered values for studied variables.
VariableConsidered Values
Column height (L)1000, 2000 and 2500 mm
Cross section depth (d)100, 150 and 200 mm
Load eccentricity ratio (e/d)0.00, 0.125 and 0.25
Steel shell thickness (t)1.5, 2.0 and 2.5 mm
Table 4. Summary of tested specimens’ configurations.
Spec.Lbdtcerminλmaxd/bc/te/d
ID(mm)(mm)(mm)(mm)(mm)(mm)(mm)
125001001501.57537.529861.5500.25
225001001002.05012.532781.0250.13
325001002002.51250.029862.0500.00
425001001502.5750.031821.5300.00
520001001501.57537.529691.5500.25
620001002001.512525.028722.0830.13
720001001002.0500.032631.0250.00
820001001502.57537.531661.5300.25
920001001002.55012.532621.0200.13
1020001002002.51250.029692.0500.00
1110001001002.05025.032311.0250.25
1210001001501.57520.029341.5500.13
1310001001001.5500.031321.0330.00
1410001001502.0750.030331.5380.00
1510001001002.55012.532311.0200.13
1610001002002.512525.029342.0500.13
Table 5. Summary of experimental program results.
Spec.
ID
P ExpΔ Minor
Measured
Δ Minor
Calc.
Δ Major
Measured
Δ Major
Calc.
Strain-
Min
Strain-
Max
Mode of Failure
(KN)(mm)(mm)(mm)(mm)(με)(με)
12261825520−106210GB
22334021536−935−329GB, F
3394292570−731−661GB
4464282320−968−891GB
52433161314−952−293F
6353318712−1080−373LB
72853113150−807−788GB, F
838329141915−1709−2GB, F and C
9442113296−1497−518F, C
105807916680−937−922GB, F
112782393−161116F, C
123501423−1260−371F
133244310−935−827GB
144053310−913−891GB
154512372−1749−519F, C
165868464−1028−881GB, F
GB: global buckling; LB: local buckling; C: compression failure; F: flexural failure.
Table 6. Summary of theoretical analysis results.
Spec.EXP.AISCErrorEN-1994ErrorCSI-COL.Error
ID(kN)(kN)(%)(kN)(%)(kN)(%)
1226.0172.0−24%225.00%246.09%
2233.0233.00%284.022%253.09%
3394.0393.00%489.024%422.07%
4464.0365.0−21%423.0−9%404.0−13%
5243.0268.010%300.023%263.08%
6353.0310.0−12%354.00%392.011%
7285.0329.08%347.013%328.07%
8383.0351.0−8%324.0−15%379.0−1%
9442.0336.0−24%350.0−21%431.0−2%
10580.0539.0−7%570.0−2%516.0−11%
11278.0301.08%250.0−10%269.0−3%
12350.0343.0−2%332.0−5%343.0−2%
13324.0328.01%350.08%332.03%
14405.0494.09%517.014%496.09%
15451.0406.0−10%385.0−15%400.0−11%
16586.0690.018%714.022%655.012%
Publisher’s Note: MDPI stays neutral with regard to jurisdictional claims in published maps and institutional affiliations.