Article

Economic and Energy Performance of Heating and Ventilation Systems in Deep Retrofitted Norwegian Detached Houses †

by
Vegard Heide
1,*,
Håkon Selstad Thingbø
1,
Anne Gunnarshaug Lien
2 and
Laurent Georges
1
1
Department of Energy and Process Engineering, Faculty of Engineering, Norwegian University of Science and Technology, 7034 Trondheim, Norway
2
SINTEF Community, 7034 Trondheim, Norway
*
Author to whom correspondence should be addressed.
This paper is an extended version of our paper published in CLIMA 2022, REHVA 14 HVAC World Congress, Rotterdam, The Netherlands, 22–25 May 2021, https://doi.org/10.34641/clima.2022.350.
Energies 2022, 15(19), 7060; https://doi.org/10.3390/en15197060
Submission received: 26 August 2022 / Revised: 10 September 2022 / Accepted: 17 September 2022 / Published: 26 September 2022
(This article belongs to the Section G: Energy and Buildings)

Abstract

:
The aim of this study was to evaluate the life-cycle costs (LCC) and energy performance of different heating and ventilation systems (HVAC) in deep-energy renovation of Norwegian detached houses. Eight different HVAC combinations based on heat pumps are compared using two case buildings, with different performance levels for the building envelope. The case buildings are small wooden dwellings without a hydronic heating system, which is representative of existing Norwegian detached houses. The insulation level had only a limited effect on the relative performance of the various HVAC combinations. Many solutions with medium and higher investments have a payback time close to the technical lifetime. Uncertainty regarding investment costs is important and affects the relative performance between HVAC combinations. Electricity prices also have a decisive influence on the relative performance. Solutions with lower investment costs often lead to low total costs but higher energy use. However, solutions with medium investment cost lead to a significant reduction in energy use and only a minor increase in total costs. Improving the cost-effectiveness of these technologies (reduced investment costs, grants, increased electricity price) would unlock large energy-saving potential. The lack of hydronic distribution systems in existing Norwegian buildings is a barrier to implementing air-to-water and ground-source heat pumps. For the investigated cases, the current government subsidies in Norway do not seem large enough to make investments in deep-energy renovation profitable.

1. Introduction

Buildings are responsible for a large fraction of society’s energy use and CO2 emissions. Policies stimulating and demanding high energy performance in new buildings have existed for several years. The 2030 Climate and Energy Ambition for the European Union sets a target of reducing emissions by 55% by 2030 compared to 1990 [1]. There is a large potential for emissions reduction in the building sector, as the majority of buildings are old and have low energy efficiency. Residential buildings represent 75% of the building stock, and more than half of these were built before 1960 [2]. There has been increased focus on the energy performance of existing buildings in recent years, and a number of initiatives aim to encourage ambitious renovation. In Europe, the new Energy Performance of Buildings Directive (EPBD) of 2018 [3] has a strong focus on the renovation of existing buildings. Renovation rates are low, and a substantial increase in deep-energy renovations is needed to reach the goals. In order to accelerate deep-energy renovation, the European Commission has published a renovation-wave communication [4].
The Norwegian residential sector is characterized by a large share (49%) of detached wooden houses that are privately owned. These houses are responsible for more than half of the total energy use in the Norwegian building stock. The average energy use is around 200 kWh/m2·year [5]. The Norwegian building sector is not allowed to use fossil fuels anymore, as this was phased out in 2020 [6]. Most dwellings in Norway are thus heated using electricity. In this regard, Norway is a special case internationally, as the electricity mix is dominated by hydropower. Despite the resulting low carbon intensity of the Norwegian energy mix, reducing the energy consumption in buildings is regarded as important: this can provide more renewable energy for electrification of fossil-based transport and export to countries with fossil-based electricity production.
In Norway, many detached houses have direct electric heating, and some are supplemented with wood stoves. Heat pumps have also been installed in recent years, mostly air-to-air heat pumps [7]. Unlike many other countries, few detached houses from this period have a hydronic heat-distribution system installed [8]. A history of low electricity prices and high investments costs in heating, ventilation, and air-conditioning systems (HVAC) have contributed to this situation. A great number of Norwegian detached houses were built between 1950 and 1990 and are now ready for major renovation. However, only half of the renovation projects of Norwegian existing buildings perform energy upgrading [9]. If these houses were to undergo deep-energy renovation, it would contribute significantly to the national target of 10 TWh/year energy savings for existing buildings by 2030 [10].
A number of studies have investigated life-cycle costs (LCC) and energy performance in renovation, and many found ambitious measures (e. g., deep-energy renovation) cost-efficient [11,12,13,14,15,16]. However, few of them addressed detached houses in cold climates, and many used a generic approach with simplified cases and models. Many studies have analyzed energy performance without including cost assessment or investigating a single HVAC solution, but there are some exceptions. Dermentzis et al. [17] investigated the use of a compact (exhaust air) heat pump in a renovated multifamily house in Germany, and found the system to be cost-efficient due to prefabrication. Ekstrøm et al. [18] evaluated the renovation of detached houses to passive-house level in Sweden, and found exhaust-air heat pumps (EAHP) and also ground-source heat pumps (GSHP) the most cost-effective. Gustafsson et al. [19] compared energy performance of three HVAC systems for a renovated semidetached house, and found that balanced ventilation combined with a micro-heat pump and EAHP showed the lowest delivered energy in the Stockholm climate.
Still, these three studies analyzed only a few selected HVAC solutions, and did not make a systematic comparison of cost and energy performance of many HVAC solutions. A literature review on renovation criteria and methods by Antonov et al. [20] found that few studies compare the contribution of individual elements. Hamid et al. [21] also found the need for more evaluation of energy savings and cost-effectiveness on individual measures. Furthermore, studies done in other countries with a cold climate only partly cover the Norwegian renovation situation, as investment costs (prices) are higher, and the electricity prices are lower in Norway than in many neighboring countries.
Several studies have shown the technical potential for improving the energy performance of existing Norwegian detached houses [22,23]. Hrynyszyn and Felius [24] simulated the energy performance with different packages for energy retrofitting of a detached house from the seventies. They concluded that energy demand for heating can be reduced by almost 80%, and that the renovation standard developed by the Passive House Institute (EnerPHit) [25] is possible to achieve from a technical point of view. However, few studies have included an LCC calculation in the assessment. Several of these found that few measures are cost-efficient. Langdal [26] investigated the cost-effectiveness of energy renovation of Norwegian detached houses and found that only very limited measures were profitable: ceiling insulation and air-to-air heat pumps were cost-efficient. He also found government grants crucial for the profitability of the general upgrading. Mossing et al. [27] investigated costs of deep-energy renovation of a Norwegian detached house from the sixties, and analyzed some selected retrofit measures on both HVAC and the envelope. The calculated payback time for an air-to-air heat pump was only 3 years with the moderate envelope upgrade. However, for GSHP they found a payback time of 21 and 41 years, respectively, for moderate and ambitious envelope upgrades. Felius et al. [28] analyzed the potential of some selected energy renovation measures on detached and multifamily houses in Norway, and estimated that an air-to-air heat pump had greater energy-saving potential than reducing heat loss through the building envelope.
Another case study by Moschetti et al. [29] on energy renovation scenarios for a Norwegian house from the 1950s showed a generally higher net present cost for the scenarios with lower cumulative energy demand and global warming potential. A modest increase in net present cost did however give surprisingly large reductions in global warming potential and energy demand. Gonzales-Caceres et al. [30] analyzed different packages of renovation measures for an apartment building in Norway. They used an electricity price as high as 2.02 NOK/kWh (about 0.2 €/kWh) and claimed it was possible to reduce the delivered energy by 46% with internal rate of return of 5.7%. This study found insulation of external walls, floors, and roofs to be the most cost-efficient measure, while upgrading of windows was not found profitable.
In conclusion, case studies on deep-energy renovation of detached houses in Norway, analyzing the performance of different HVAC combinations and regarding both energy and cost performance, are very limited. To the authors’ best knowledge, no other studies have compared the energy and cost performance of different HVAC solutions for energy retrofits for Norwegian detached houses.
The aim of this study was to evaluate the performance of different HVAC solutions used in deep-energy renovation of Norwegian wooden detached houses in terms of life-cycle costs and energy performance, with the goal of understanding the pros, cons, and trade-offs between different HVAC combinations. The research questions are:
  • How is the performance of different HVAC solutions in terms of life-cycle costs and energy efficiency?
  • How is the performance of different renovation packages (i.e., building envelope + HVAC) in terms of life-cycle costs and energy efficiency?
  • How is this affected by the insulation level?
  • How is this affected by variation in parameters: electricity price (including new grid power tariffs), financial support from the government, existing hydronic distribution system or not?
The heating of Norwegian residential buildings used to be dominated by direct electric heating (and wood stoves). It was thus important to investigate whether heat pump solutions can compete with direct electric heating, with increased insulation in renovated buildings.
Ideally, energy measures on the building envelope and HVAC should be analyzed together in a holistic way. The established Energy Performance Building Directive (EPBD) cost-optimality method was aimed at standardizing and harmonizing the assessment of the economic performance of energy measures among EU member states. [31,32]. This method combines measures on the building envelope and the HVAC systems, and this ensures a cost-effective balance between these measures. However, when using this methodology, the analysis of the HVAC systems usually remains relatively simple. In addition, there is a large variability and uncertainty regarding the investment costs related to the building envelope, which are case-dependent and may also depend on architectural choices. The technical lifetime of energy measures on the building envelope may be significantly longer than for the HVAC system. This makes the LCC analysis more complex. For instance, scenarios with replacement of HVAC components should be considered during the economic lifetime of the project. Alternatively, if a short economic lifetime is considered, assumptions on residual values after the economic lifetime should be done for the measures on the building envelope. Therefore, it can also be instructive to understand the trade-off between different HVAC solutions without considering measures on the building envelope. Furthermore, during the design process, many architects focus first on the building envelope and then consider the HVAC system in a second step. For instance, in the OPPTRE architecture competition that provided the basis for this work [33], this methodology was followed by the participating teams. Although these interdisciplinary teams consisted of architects, engineers and carpenters, no holistic, iterative assessment balancing different focus groups was done. Thus, even though the decoupling of the cost-effectiveness analysis of the HVAC and envelope measures is not optimal, this two-step procedure still reflects the practice of many designers. Therefore, in this study a detailed assessment of relevant HVAC measures was done based on defined envelope upgrade packages. The analysis is detailed with regard to several factors:
  • It integrates the uncertainty on the HVAC investment costs, which can be large in small residential buildings. This aspect is not often considered in the literature.
  • The energy performance is assessed using a multizone building performance simulation (BPS) taking into account the detailed heat emission and distribution in the building. This aspect is important to evaluate the energy coverage factor, such as air-to-air heat pumps.
  • A considerable number of heat pump technologies are compared and simulated in detailed BPS software.
  • The simulated seasonal performance factors (SPF) of the heat pump systems are compared to the literature for cold climates to make sure that the numbers are realistic.
  • It considers a sensitivity analysis of the electricity price, the introduction of new grid tariffs to limit peak power, the presence of a hydronic system, and government financial support. Two representative case houses are used. Three different insulation (heating demand) levels are considered.
This paper is an extended version of our short conference paper published in CLIMA 2022 [34]. The remainder of the paper is organized as follows. In Section 2, the methods are introduced. Results are analyzed in Section 3 and discussed in Section 4. Then, conclusions are given in Section 5.

2. Methodology

This work is based on an architecture competition in the OPPTRE project: “Energy upgrading of wooden dwellings to nearly zero energy level” [33]. Energy renovations were proposed for six existing dwellings, typical for their construction year in the period from 1950 to 1990. The OPPTRE project defined a minimum energy performance requirement prior to the competition to challenge the participants. More information about OPPTRE and the energy performance of the delivered proposals of the competition can be found in Moschetti et al. [35]. Two of the houses of OPPTRE are used as case buildings in this study, presented in Figure 1.

2.1. Evaluation of Economic Performance

The procedures described in the Norwegian and European standard NS-EN 15459-1:2017 [36] are used to evaluate the economic performance of the HVAC solutions in combination with the three different renovation levels. The investment costs, the payback time and the global costs (also called total discounted costs) were used as indicators. The global costs for a given energy renovation combination are the present value of initial investment costs of the envelope and HVAC measures, annual maintenance costs, and energy costs over the defined calculation period. If equipment has a shorter lifetime than the calculation period, the replacement costs of equipment are also added. Finally, the present residual value of the equipment is subtracted from the global costs. The exchange rate between the Norwegian krone and euro has a relatively stable value of 10 NOK/€. It has been decided to show the results in NOK, as the conversion into euros is straightforward. The following assumptions and parameters have been considered (see also Table 1):
  • Government grants for energy-efficiency measures (called Enova grants) are not included in the baseline assessment, but are considered in the sensitivity analysis.
  • Electricity prices in Norway have historically been low. From 2012 to 2020, the average Norwegian price was 1.0 NOK/kWh [37]. However, the increase seen in the last few years is expected to continue, due to several new international connection cables. Therefore, a constant electricity price of 1.5 NOK/kWh is assumed for the baseline cases in this study. This is the price used where nothing else is specified.
  • The reference scenario for the calculation of the payback time is the building after the upgrade of the building envelope with mechanical extract ventilation and direct electric heating. Therefore, the cost for upgrading the building envelope is not considered in the payback time. Maintenance costs are not included in the payback time.
  • A discount rate of 3% is used. This reflects expected interest rates, and has been used in many similar studies, e.g., [38].

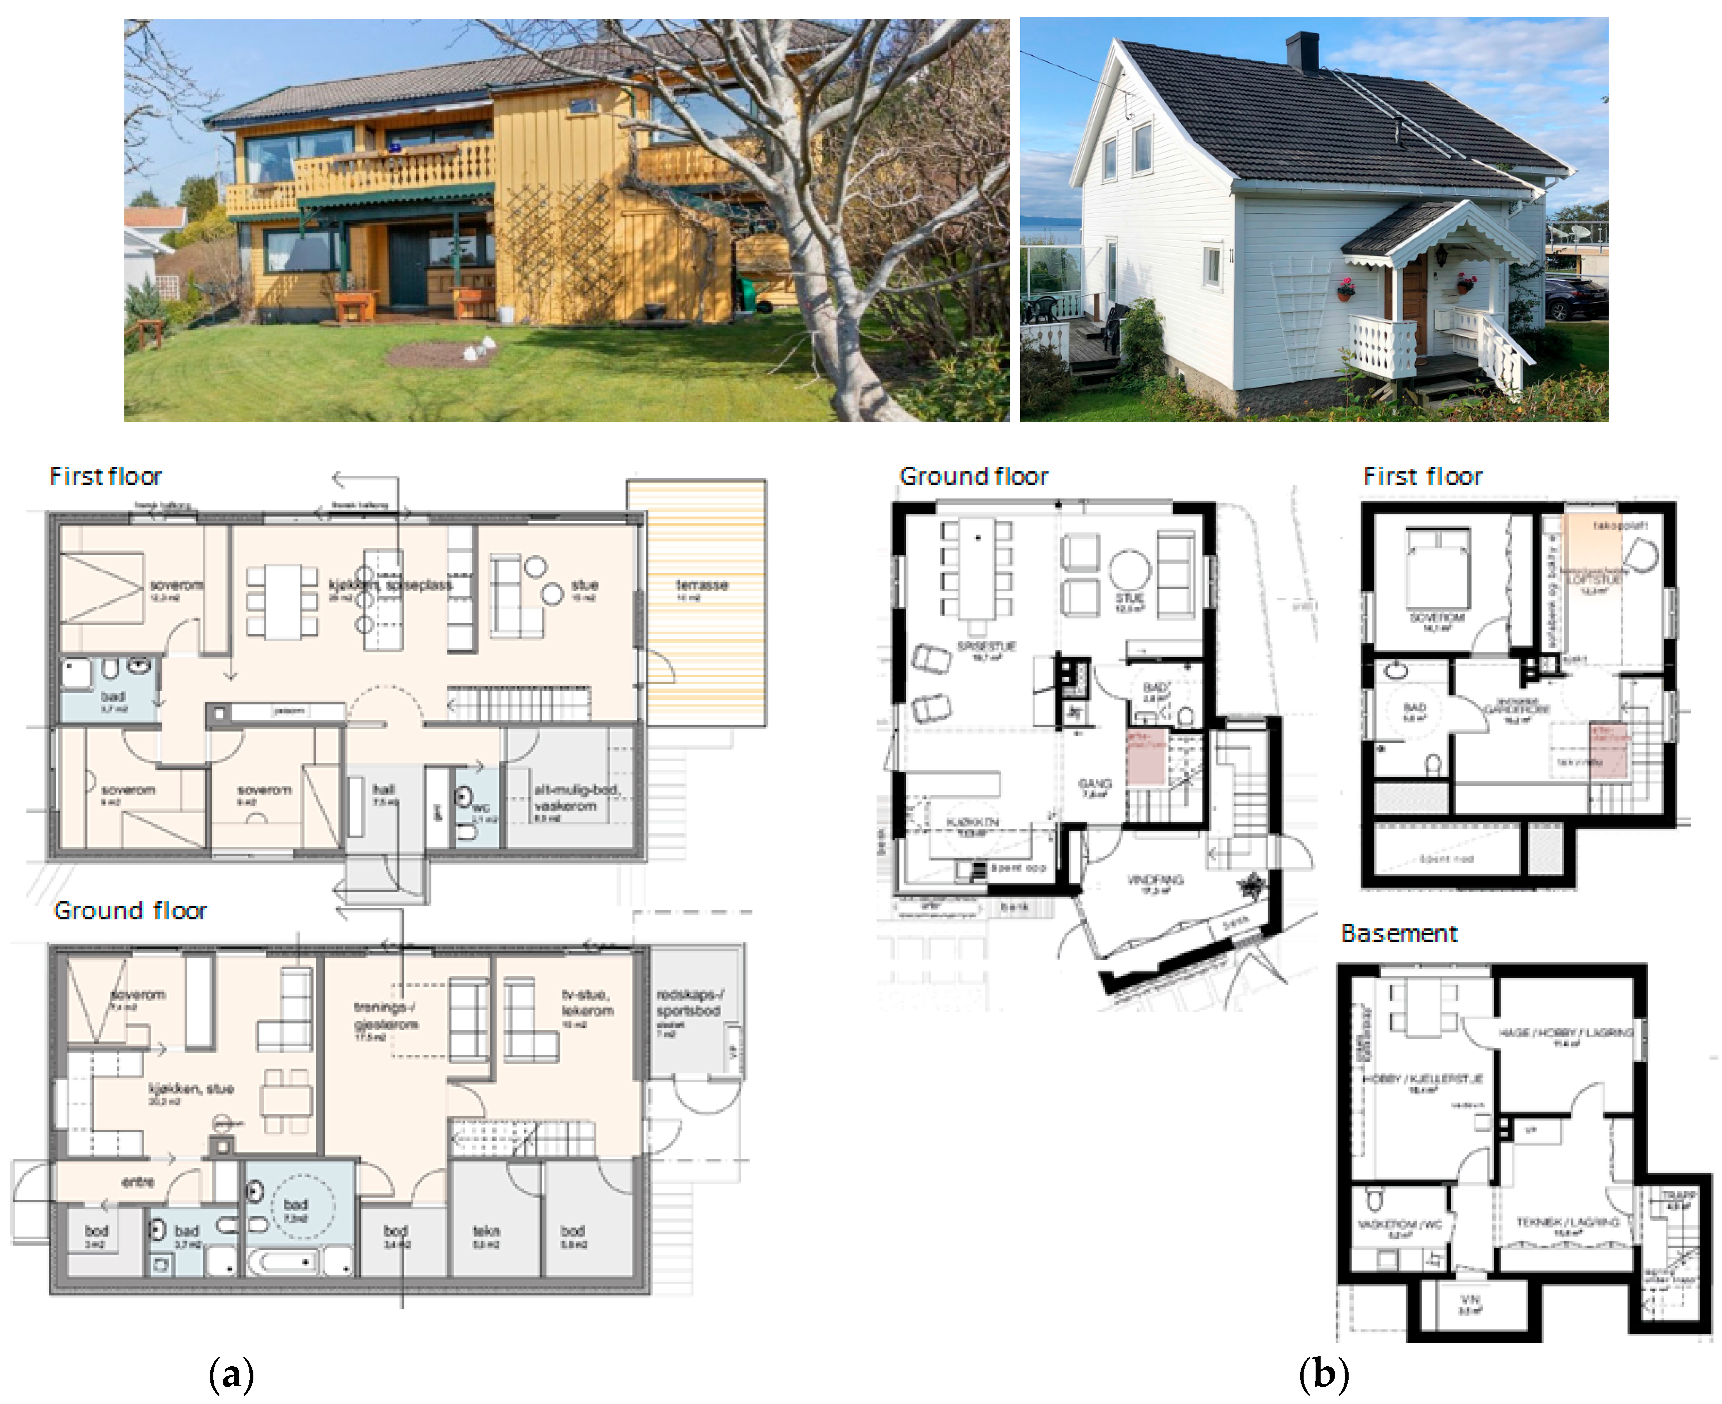
2.2. Two Case Houses

The two case houses were selected because they represent a certain diversity. The Malvik house was built in 1957, has two floors and a basement, and a total heated area of 184 m2. The Kristiansand house was built in 1972, has two floors, a cold attic, 214 m2 heated area, and basement floor with a studio apartment. See also Figure 1. The two houses had no hydronic distribution system installed. The Malvik house is smaller, but has a more complex shape and is more costly to insulate. Changing the basement from unheated to heated space demands some expensive insulation measures.

2.3. Three Building Envelope Upgrade Levels

In addition to the existing state, three performance levels of the retrofitted building envelope were analyzed: TEK10, OPPTRE, and PASSIV. TEK10 is mostly in accordance with Norwegian building regulations of 2010 (TEK10). OPPTRE is based on the proposals from OPPTRE’s architect competition [33]. PASSIV is mainly in accordance with the Norwegian passive house standard NS3700 [39]. Thermal properties of each performance level and space-heating demand with ventilation heat recovery are summarized in Table 2. The Tabula web page (part of Episcope project) has mapped generic building typologies for different countries, and presented annual delivered energy of 219 and 216 kWh/m2·year delivered for houses corresponding to Malvik and Kristiansand, respectively [40]. This corresponds well to the actual state of the case houses in this study with 290 kWh/m2·year for the Malvik house and 246 kWh/m2·year for the Kristiansand house.

2.4. Cost of Envelope Upgrade

Investment costs to upgrade the building envelope are included in the LCC analysis. Only measures improving energy efficiency are included (i.e., other measures due to necessary maintenance or renovation were not included). A lifetime of 60 years was assumed for the measures on the building envelope. The main part of this cost covers the thermal insulation with an expected lifetime longer than 60 years. To find the costs for the 20-year calculation period, the value is assumed to decrease linearly with time and the residual value at the end of the calculation period is discounted to the present value and subtracted from the investment costs.
The increased building envelope performance levels (TEK10, OPPTRE, and PASSIV) were eligible for grants from the government through the Enova agency of 100,000, 125,000 and 150,000 NOK, respectively. This is not included in the baseline case and will be considered in the sensitivity analysis.

2.5. Nine HVAC Combinations

The proposals from the OPPTRE architecture competition only included a few heating systems. Therefore, several solutions and combinations were added for this study. Nine different HVAC combinations were analyzed (Table 3). These combinations are mainly named after the heat pump technology, even though the combinations also include a ventilation measure. Eight have heat pumps and four of them have hydronic space-heating distribution. Seven have balanced ventilation with heat recovery and two have exhaust ventilation with heat pump. No systems are based on fossil fuel or biomass. All combinations have auxiliary electric resistance heaters for peak load during the coldest days of the year. This helps to avoid oversized systems, which could result in higher investment costs and/or too frequent on–off cycles of the heat pump unit.
Exhaust-air heat pumps (EAHP) use the exhaust ventilation air as the heat source, which is usually combined with mechanical exhaust ventilation. Compact heat pumps (CHP) combine a balanced ventilation unit with heat recovery, a DHW tank, and heating of the supply ventilation air, all in one cabinet. The heat pump uses the residual heat of the exhaust ventilation air (after passive ventilation heat exchanger) as the heat source. Since ventilation heat recovery already has removed some of the heat, the source temperature (during heating season) is lower than for an ordinary EAHP, but still higher than the outdoor air by a few degrees. Still, the total heat extracted from the ventilation air (using passive heat recovery and HP) is larger than using EAHP.
EAHP and CHPs, using the extract ventilation air as a heat source, are so far not used much in Norway. This heat source has a relatively high temperature and is relatively stable through the heating season and does not drop much when the outdoor temperature is low and the space-heating power demand is at its highest level.
One limitation when using ventilation air as the heat source is that the total heat available is limited to the heat contained in the ventilation air flow. In essence, the performance of these heat pumps is dependent on the ratio between the ventilation air volume flow and the heating demand. To reach acceptable energy efficiency, the heating demand of the building should be low enough to allow these heat pumps to cover a large fraction of the demand. In a cold climate this is only the case in highly insulated buildings [41,42]. In a poorly insulated building, the heating demand is too large for the heat pump to cover. This would result in a large fraction of peak heating using a direct electric heater. A high heat output also depends on a continuous high ventilation rate.

2.6. Cost of HVAC Combinations

Most LCC analyses do not consider uncertainty regarding investment costs, e.g., [11,12,13,14,15,16]. In this study, however, uncertainty on costs was considered by collecting several prices from the current Norwegian market. This enables a cost range for the investment to be defined, consisting of minimum, mean, and maximum values. This range reflects differences between different brands and qualities, but also differences in price between different suppliers, for the same product. The use of an investment cost range results in a range in payback time and global costs. As previously mentioned, maintenance costs, replacement costs, and residual value were included in the analysis.
Most of the costs were collected directly from suppliers and building companies or their webpages. Where this was not possible, generic costs from reports and statistics were used [43,44]. In a few cases, sources from Sweden and Denmark were also considered. It was clear that the prices on these markets overall were lower, and based on the data collected, a typical market conversion factor of 25% was used.
In the cases where the lifetime of the HVAC components was shorter than the calculation period of 20 years, replacement costs were added. Residual values after 20 years were discounted, assuming a linear decrease in the value with time. For GSHP, the borehole of 200 m and circulation loop is included in the investment costs. Total investment costs for HVAC combinations are shown in Table 4. Specific investment costs for HVAC combinations are shown in Figure 2. An example of total investment costs for both the envelope and HVAC systems is shown in Figure 3.
The nominal power of heat pumps was dimensioned according to the nominal heating demand in the building for the different envelope performances. This was done using parametric runs for different heat pump capacities for all building envelopes and cases. The heat pump capacity resulting in the lowest global cost was chosen for each case and is shown in Table 5. The sizing procedure resulted in an air-to-water heat pump with larger capacity for the TEK10 envelope performance level than in the other envelope scenarios. This was the case in both houses. Correspondingly, a larger GSHP was used for both houses for TEK10 and for the OPPTRE level for the Kristiansand house.
Floor heating in bathrooms and entrances is commonly regarded as a standard comfort measure in Norway. In entrances, this is done for drying shoes and melting snow, and in bathrooms because people are barefoot. Therefore, the study also regards floor heating in bathrooms and entrances as a comfort measure so that the related investment costs are not included. Government financial support through the Enova agency is available for most of the HVAC combinations, shown in Table 4. Again, these grants are not included in the baseline analysis, but are considered in the sensitivity analysis.
Four combinations include installing a hydronic heat-distribution system. This represents between 20% and 40% of the total investment costs for HVAC. As Figure 2 indicates, the Malvik house generally has a more expensive hydronic system per square meter, partly due to its different layout. For EAHPcomb, Malvik has a smaller and much less costly HP, due to lower total ventilation air volume (resulting from a smaller heating area and fewer bedrooms).
It was observed that the investment costs of the HVAC combinations clearly can be divided into three main groups (Figure 2):
  • Lower investment: BalVent, A2A, EAHPDHW
  • Medium investment: A2Asolar, CHP, EAHPcomb
  • Higher investment: A2W, CHPcomb, GSHP.

2.7. Heat Pump Efficiency

To evaluate the system performance of the heat pump systems, the energy coverage factor and SPF was calculated. The rated coefficients of performance (COP) used for the different heat pumps in these simulations are shown in Table 4. The energy coverage factor of a heat pump is defined as the ratio between the total annual energy for the heating system and the annual production of heat from the heat pump. The total heat emitted in all zones was logged along with the annual heat emitted by the condenser of the heat pump. For the scenarios without a hydronic heating system covering all zones, the heat from the other heat emitters, namely, electric panel heaters and floor heating, must be considered as well. The energy coverage factor computed using IDA ICE simulations is shown in Figure 4.
The SPF of a heat pump system is here defined as the ratio of the annual heating and cooling delivered to the building by the system and the annual electricity consumed by the system (by the base and peak load heat generation systems). To calculate the SPF, the annual heat emitted by the condenser of the heat pumps and the electric boiler, and the annual consumption of electricity by the heat pump and electric boiler were logged in IDA ICE. The boundary conditions for the SPF include the heat pump, the electric boiler, the hydronic distribution system, and any backup direct electric space-heating system. The boundary conditions are thus similar to the H3 boundary proposed by the IEE project SEPEMO-build [45]. The resulting SPF of the heat pump systems is shown in Figure 5. Among key factors influencing the SFP and the energy coverage factor is the power coverage factor of the heat pump and the type of space-heating distribution subsystem, the layout of the floor plan, and the share of DHW covered by heat pumps. As can be seen, the energy coverage factor and the system SPF are correlated.
To make sure that the simulation results are realistic, the SPF value can be compared to the literature, here shown in Table 5. The literature generally reports slightly more favorable SPF than found in our simulations. Even though these studies are all from cold climates, some consider milder climates than Oslo (e.g., Germany and Ireland). For CHP and EAHP, the SPF and the energy coverage factor rise with the increasing insulation level (Figure 4 and Figure 5). This could indicate that the low heating demand of the PASSIV envelope upgrade is better suited to the use of these heat pumps.
Table 5. SPF values monitored in cold climates reported in the literature (H3).
Hp TypeStudyNumb. HPBuildingLocationSPF LowSPF HighYearAuthor
Air to airField, monitor.5DetachedSweden2.1 2009Lidbom et al. [46]
Field, one year5 Sweden2.1 2010Nordman et al. [47]
Air to waterField, monitor. Swed./Switz./Scotl.3.13.32016Nordman et al. [48]
Field, monitor.70DetachedGermany2.14.22017Miara et al. [49]
Field, monitor.7DetachedSwitzerland2.83.52021Kuster et al. [50]
Field, monitor.3DetachedIreland2.55.02021O Donovan [51]
Ground sourceField, monitor. Switz./Scotl.3.34.72016Nordman et al. [48]
Field, monitor.81DetachedGermany2.25.42017Miara et al. [49]
Field, monitor.3DetachedCanada2.73.82021Abdel-Salam et al. [52]
Field, monitor.6DetachedSwitzerland4.34.92021Kuster et al. [50]
CompactField, monitor.1 Germany1.7 2018Dermentzis et al. [17]
Field, monitor.2DetachedIreland1.72.42021O Sullivan et al. [53]
Field/sim.1DetachedGermany 1.8 * 2.2 *2021Shirani et al. [54]
Exhaust airField, monitor.3 Sweden1.41.72005Sakellari and Lund. [55]
Simulations Multi-fam.Estonia1.912.092018Thalfeldt et al. [56]
Field, monitor.2Multi-fam.Finland 3.7 * 2021Pylsy and Kurnitski [57]
Simulations.1 Sweden 1.43 ** 2021Saini et al. [58]
* SCOP for the whole system.** H4.

2.8. Evaluation of the Energy Use

The energy performance was evaluated using the dynamic software IDA-ICE, in compliance with the Norwegian Technical Specification NS-NSPEK 3031 [59]. Ventilation airflow rates are adjusted to follow the requirements in the Norwegian building regulations [60]. Only the Oslo climate was used in the simulations, but this climate is representative of a large fraction of houses in Norway. The annual mean outdoor temperature is 6.3 °C, and the design outdoor temperature for space heating is −20.0 °C. The corresponding climatic zone following the ASHRAE classification is zone 6: cold [61]. Solar angles are very low in wintertime, and the mean total radiation on a horizontal surface is 110 W/m2. As electricity is the only energy carrier in this analysis, the relationship between delivered energy, primary energy, and greenhouse gas (GHG) emissions from operation is proportional. For the sake of conciseness, no specific primary energy or CO2eq-factor is considered, and energy efficiency is used as an indicator of environmental impact.

2.9. Power Tariff on Electricity-Grid Rent

The LCC depends directly on the electricity price. It is therefore important to include expected changes in the electricity price in the near future. In this context, power tariffs on the grid rent are planned to be introduced in Norway in the latter part of 2022 with the aim of reducing peak loads on the power grid. The main element is a stepwise fee based on peak load averaged over one hour, measured during the previous month. Another element in the electricity price is a grid rent per kWh with difference between day and night (including weekends). The grid companies will define the details of the tariffs, so there will be some variations between companies. Some grid companies have run pilot projects trying out a tariff scheme. Some of these have been used for a sensitivity analysis in this study, namely, the tariffs from the companies Glitre, Elvia, and Nettselskapet. They are presented in Table 6.

3. Results

3.1. Delivered Energy

The delivered energy is presented in Figure 7 and Figure 8. There is a large spread in the energy performance ranging from 51 to 135 kWh/m2·year annual delivered electricity. Several different combinations can be used to achieve a low energy demand. With their higher energy coverage factor and SPF, combinations with efficient heat pumps and hydronic distribution record the lowest energy use (i.e., GSHP, A2W, CHPcomb). This indicates that the contribution from these heat pumps is important.

3.2. Payback Time

Payback times for the HVAC combinations are shown in Figure 6. The combinations with the lowest payback times for both case houses are A2A, followed by BalVent. All payback times are longer than 10 years. Most of the combinations with a lower investment cost have a payback time below 20 years. The combinations with a high investment cost have payback times longer than 20 years. Many combinations have a payback time close to or longer than the calculation period, i.e., 20 years, which is critical.
The span in investment costs for HVAC measures results in significant spans in payback time. In many cases, the span inside a combination is larger than the difference between the combinations. This indicates uncertainty regarding which combinations are optimal. This shows that uncertainty regarding investment costs is important and affects the relative performance between HVAC solutions. For several combinations the maximum payback time is about 30% to 40% higher than the minimum payback time.
For most of the combinations where a heat pump is used for space heating, the payback time increases along with the increasing insulation level of the building envelope. The reason for this is the reduced space-heating needs for higher insulation levels, resulting in less energy saved by installing more efficient energy-supply solutions. This is clearly seen for combinations with a higher investment and a higher energy coverage factor: A2W, CHPcomb, EAHPcomb, and GSHP combinations. This indicates that efficient energy-supply solutions with higher investment costs are less profitable for buildings with low heating demand. The payback time of the combinations mainly covering DHW is less affected by the insulation level of the building envelope, as illustrated by the EAHPDHW. This is because the DHW heating needs are unaffected by the different levels of the envelope retrofit. For the BalVent combination, the payback time decreases with a better-performing building envelope. This can be explained by the reduced infiltration, causing a larger part of the air change to pass through the heat exchanger. For some combinations, the differences between the two case houses are significant:
  • For EAHPcomb, the Malvik house has a smaller and much less costly heat pump, due to lower total ventilation air volume (from a smaller total area and few bedrooms). This is the main reason for the shorter payback time for Malvik EAHPcomb.
  • The Malvik house has a slightly lower average specific ventilation air flow, due to fewer bedrooms than the Kristiansand house. This partly explains the long payback time for BalVent and CHP in the Malvik house. For the TEK10 envelope, the higher air infiltration of the Malvik house also explains this result.
  • The Malvik house has a more expensive hydronic system (per m2). This is part of the reason that combinations with hydronic systems do not have shorter payback time for Malvik, although the house has a higher heat loss per m2 than the Kristiansand house.
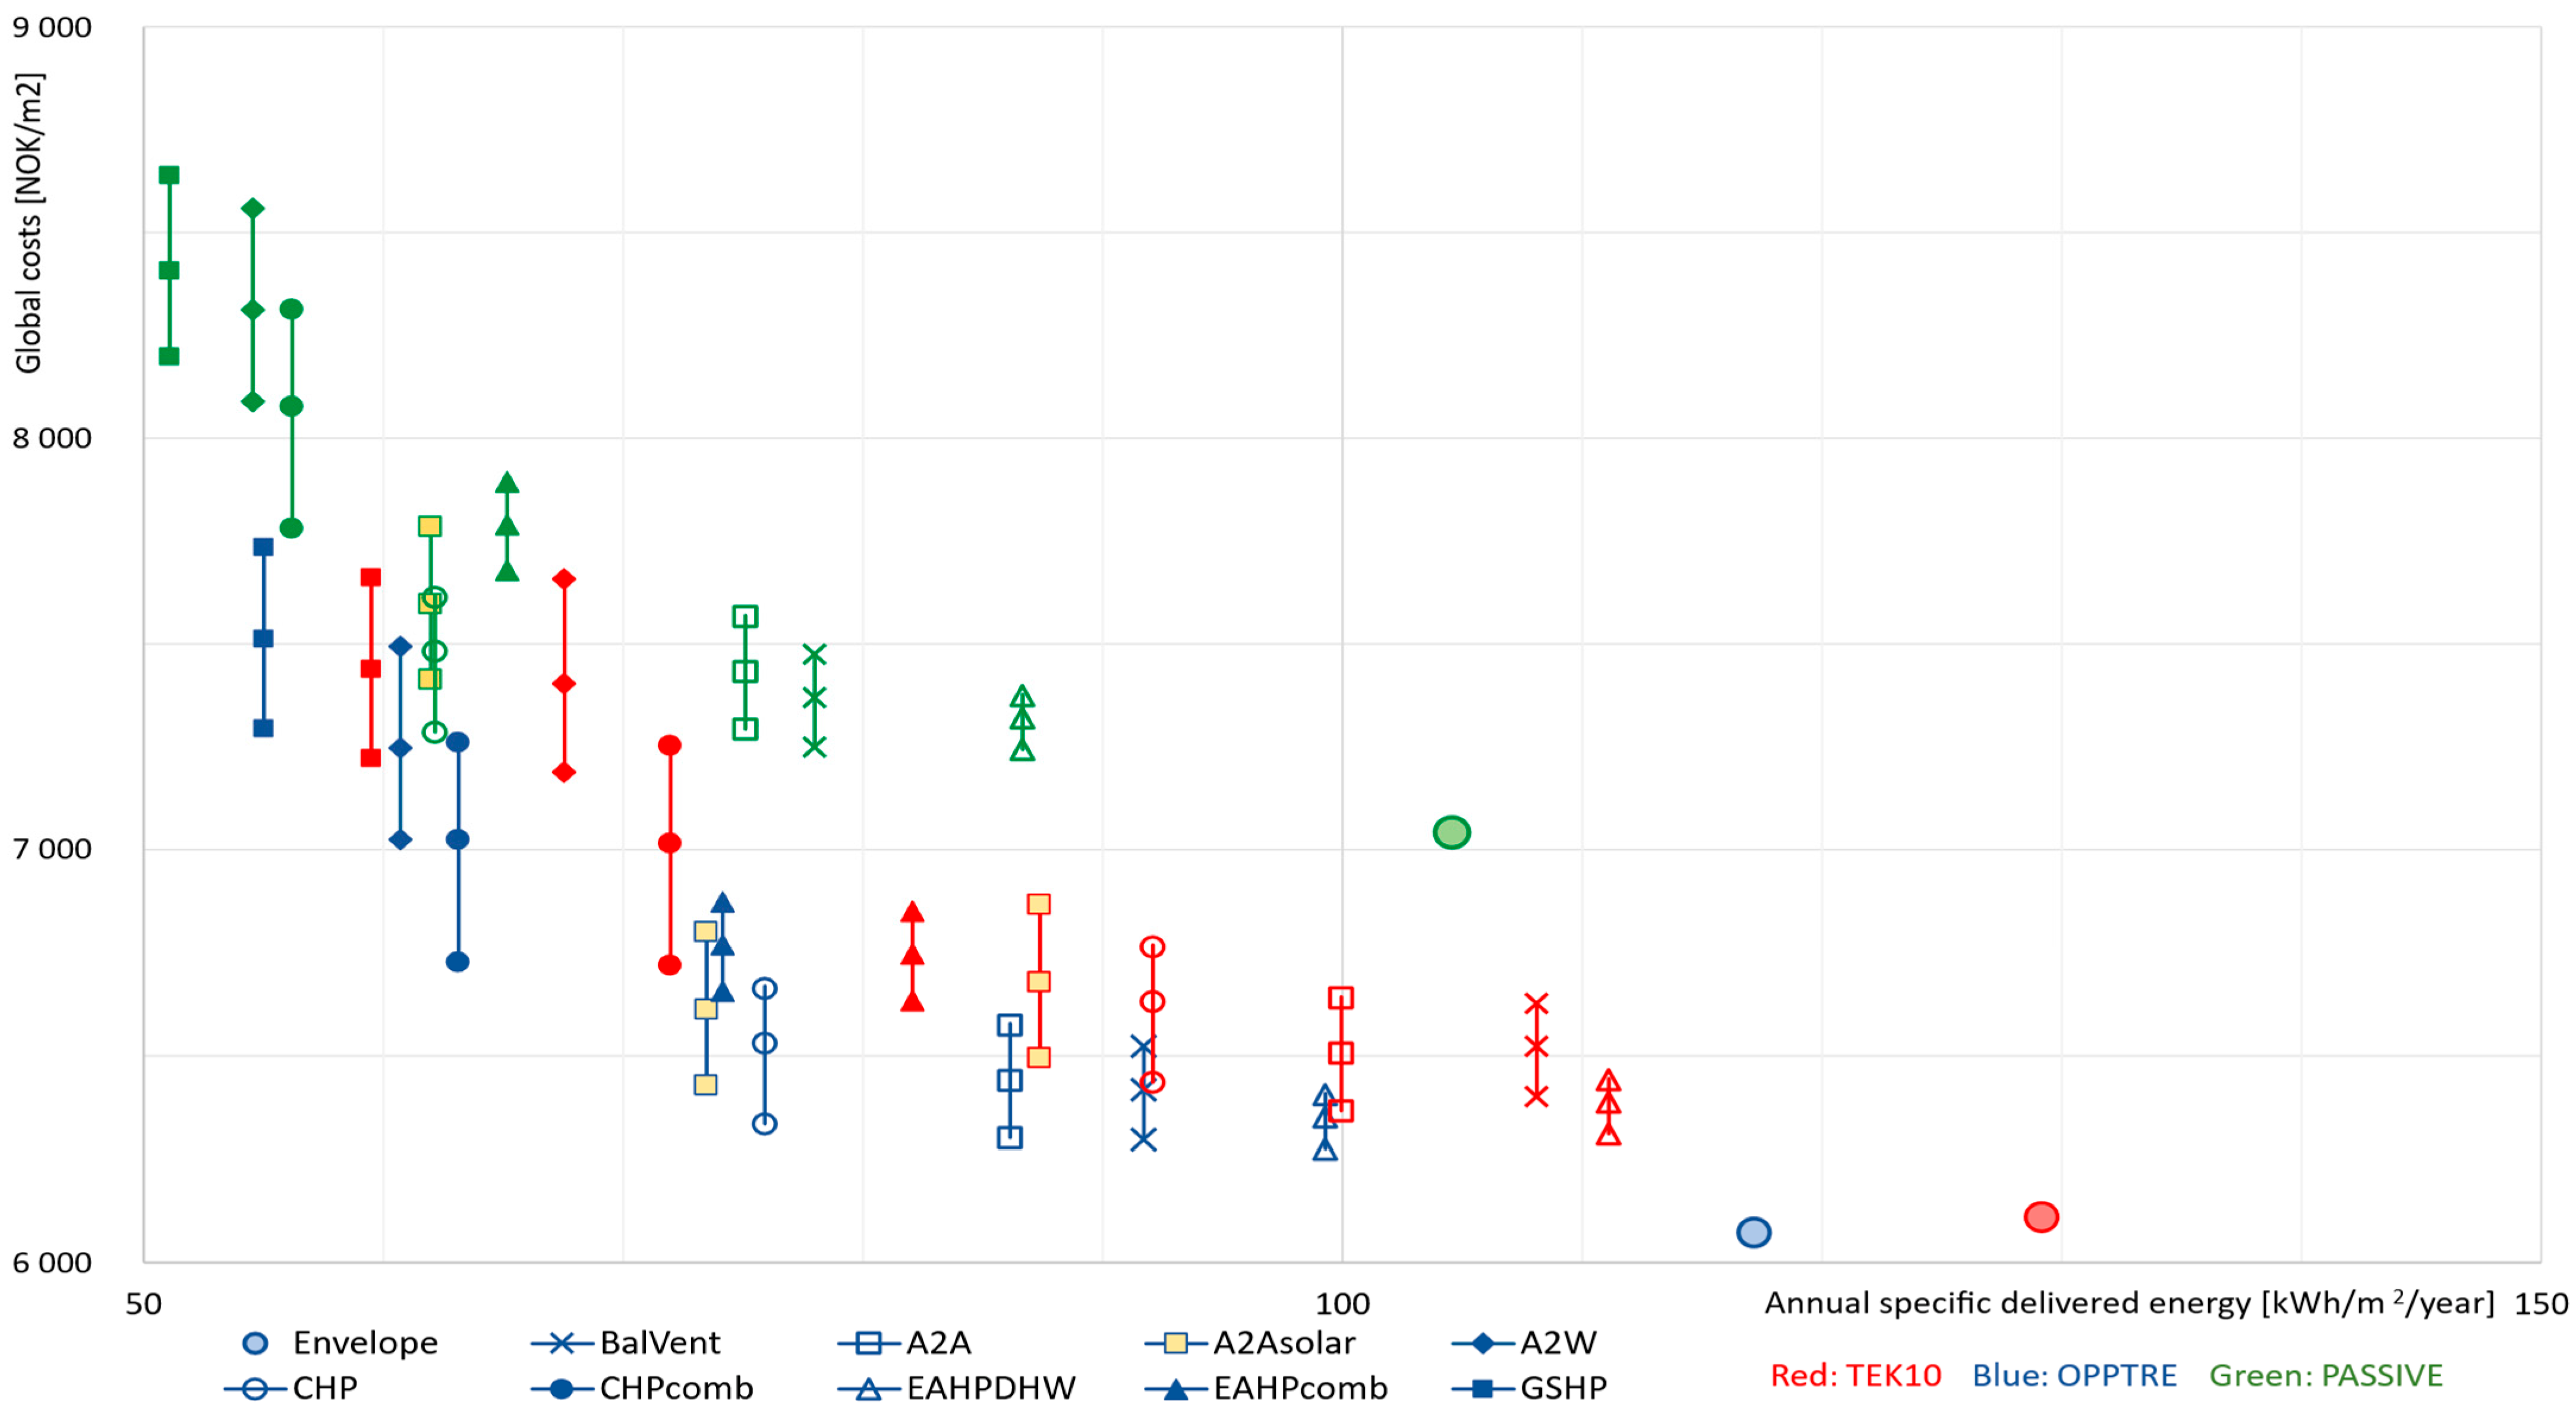
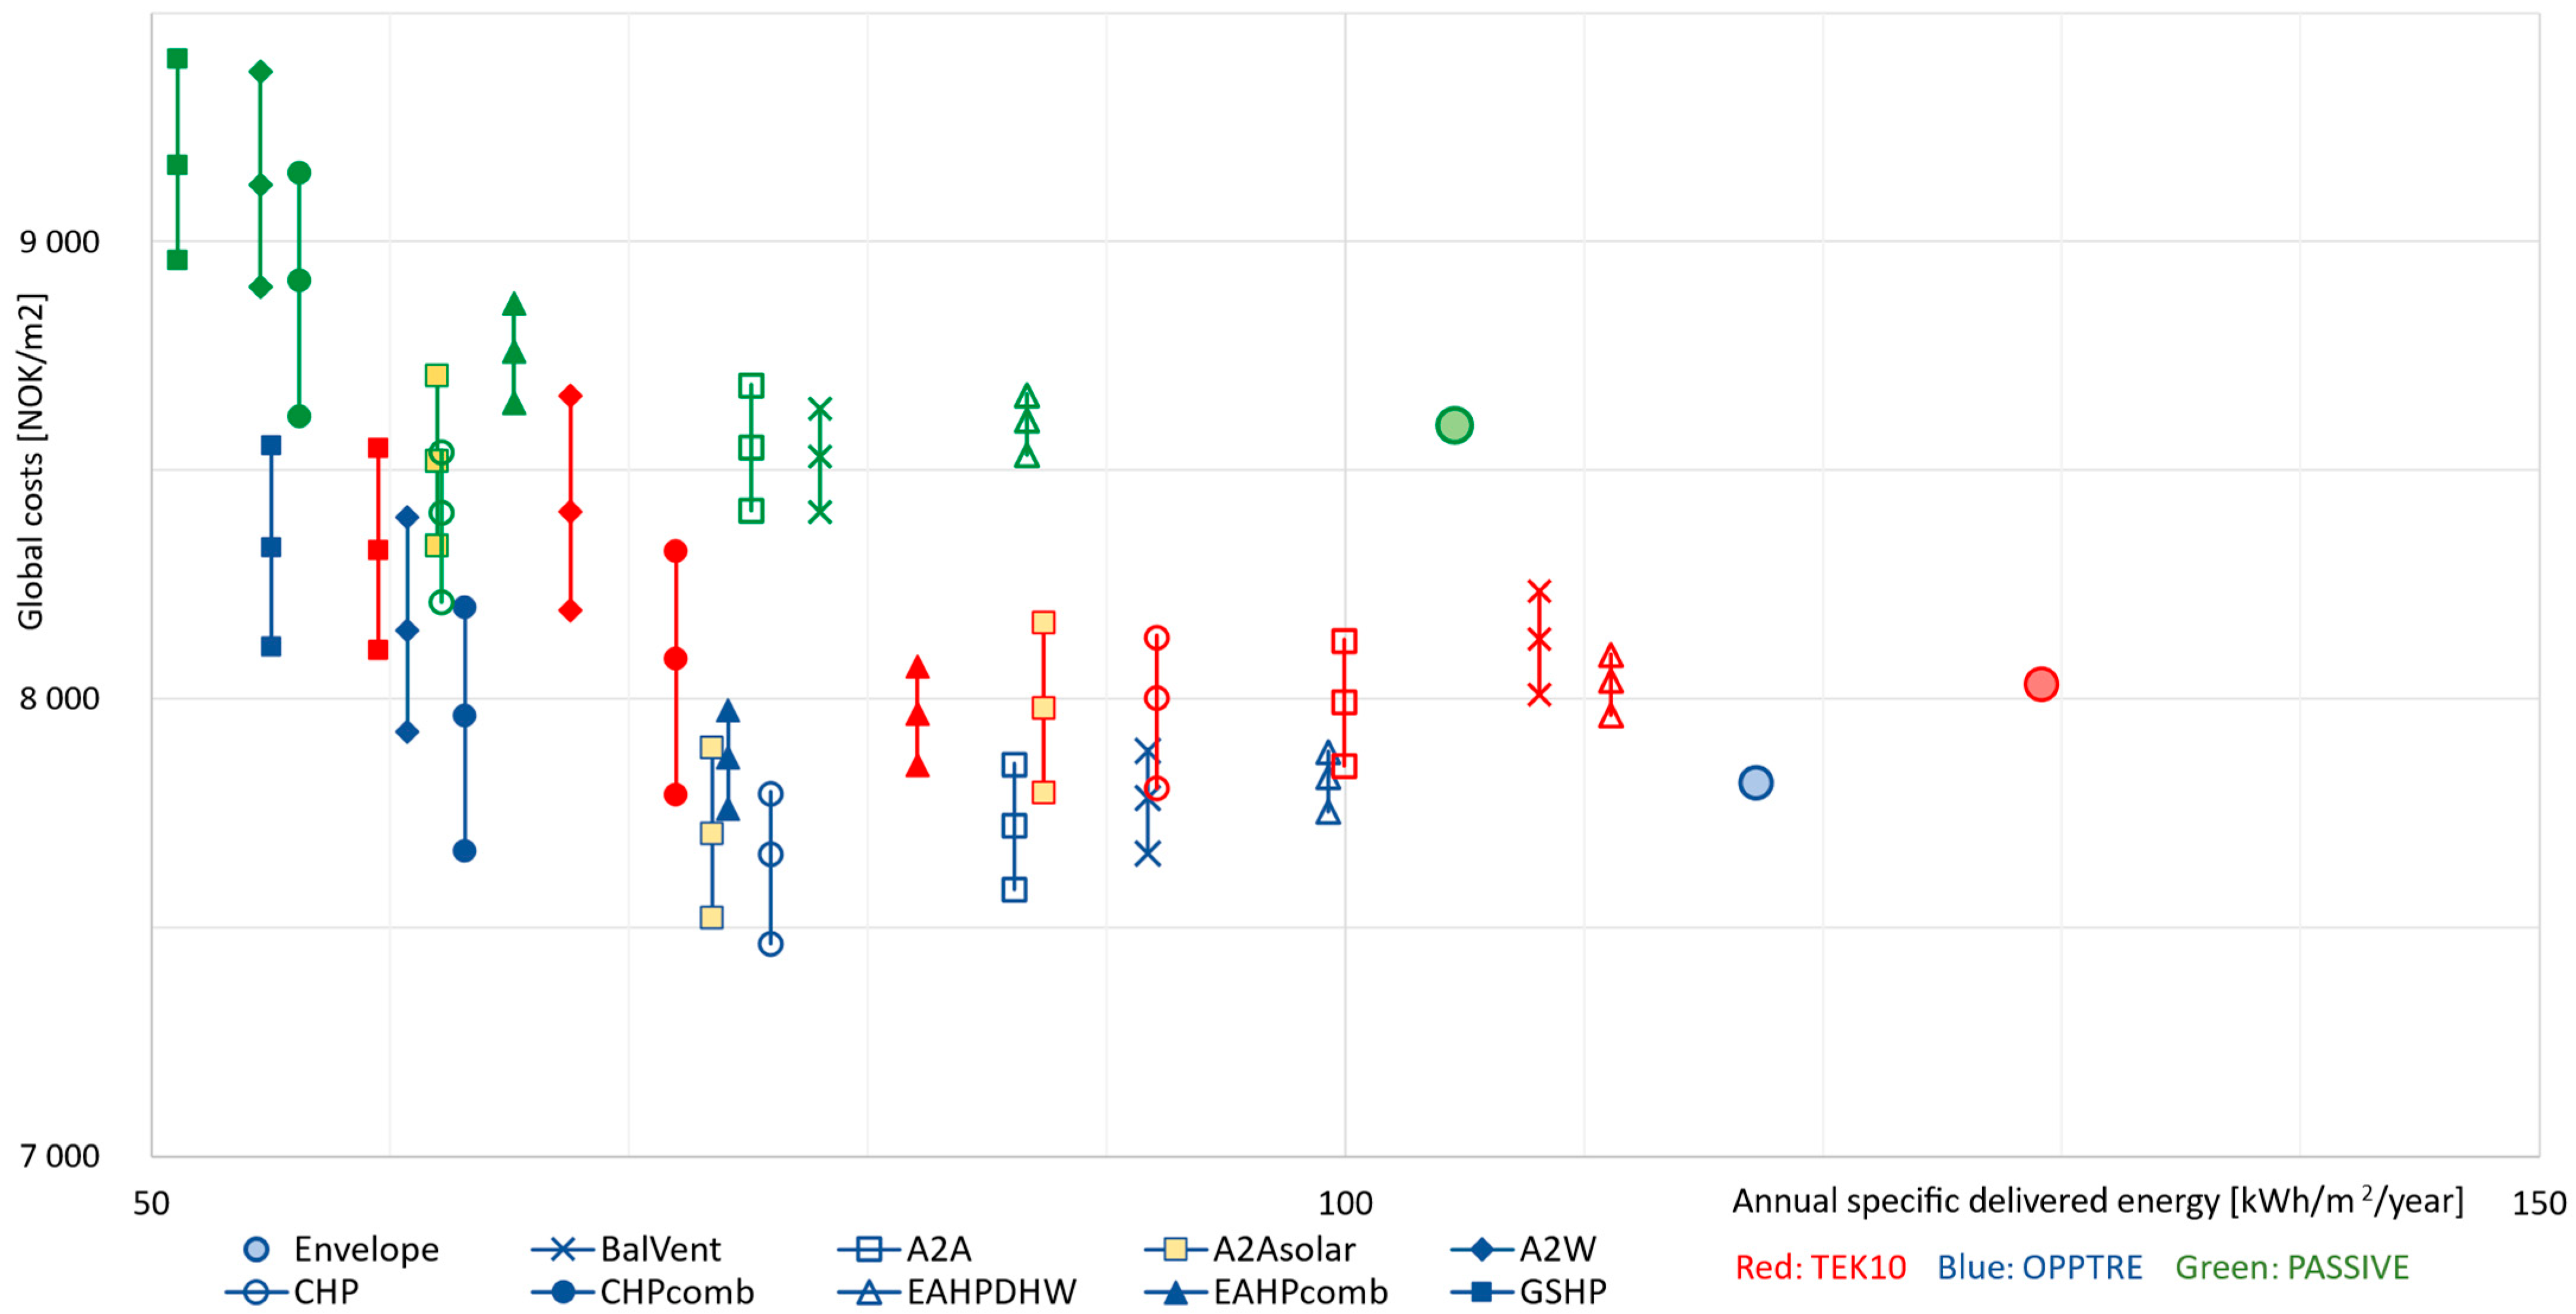
3.3. Global Costs

Global costs including the investments and energy costs during the calculation period are presented in Figure 7 and Figure 8. In addition to the different HVAC combinations, the cases considering only the envelope upgrade are also shown. Due to the range in investment costs, global costs are shown with minimum, maximum, and mean values. When moving from the “Envelope only” situation to the HVAC combinations, the angle of travel is interesting. Moving up means higher global costs: the steeper the line, the larger the increase in global costs per kWh reduction of the annual delivered energy. Likewise, moving down reduces global costs: the steeper, the more profitable.
The relative performance of the different HVAC combinations is only slightly influenced by insulation level. However, (as for payback time) combinations with lower investment (such as BAL, A2A or EAHP) perform relatively better with increasing envelope insulation. On the contrary, combinations with higher investments show relatively higher global costs with increasing envelope insulation.
As for payback time, the span in costs for HVAC investments result in significant spans in global costs. In many cases, the cost span inside a combination (resulting from the data range in collected investment costs) is larger than the difference between combinations. This shows that uncertainty regarding investment costs is important and affects the relative performance of the HVAC solutions.
For both houses, many combinations show approximately the same lower global cost, but with a wide range in delivered energy. The global cost and delivered energy diagrams show a Pareto front such that no HVAC combination is the absolute optimum—a solution is optimal for a given energy use. However, the Pareto front between 60 and 120 kWh/m2·year is flat, showing many HVAC combinations in the same range of global cost. These combinations generally have lower or medium investment costs. Global costs are generally higher for the lowest delivered energy. This also demonstrates that no solution is optimal for both the energy use and costs. Neither a scenario with low energy use but high global costs nor a scenario with low global costs but only small improvements in energy performance are desirable. Therefore, a compromise between achieving low global costs and low energy consumption is preferable, satisfying both the household budget and energy use (thus CO2 emissions).
The performance of the three investment cost groups reveals a pattern. The three HVAC combinations in the lower investment category have the highest energy consumption but have the lowest global costs. The medium investment group has medium energy consumption and also low global costs (EAHPcomb Kristiansand and CHP Malvik slightly higher). The higher investment cost group has the lowest delivered energy, but the highest global costs. However, the CHPcomb is an exception, as global costs remain low, although it has high investment costs. For the combinations with a higher investment, the additional global costs compared to the lowest global costs are still below 1000 NOK/m2 (over the 20-year period).
Comparing the BalVent and the A2A combinations, the balanced ventilation system contributes more to reduced energy use than the air-to-air heat pump, especially with the high-performing envelopes. This is more pronounced with the PASSIV scenario, as the low space-heating demand implies a small contribution from the heat pump, while the ventilation heat demand is the same regardless of insulation level.
With the baseline parameters used in this study, the reference situation without any upgrade measures (not envelope, not HVAC) shows the lowest global costs over the 20-year calculation period: The LCC without any upgrade measures is 5489 and 6518 NOK for the Kristiansand and Malvik houses, respectively (see also Figure A1).

3.4. Envelope Upgrade Level

Details of the energy and cost performance of measures on the building envelope is not the main focus of this paper. However, as the envelope is a part of the total renovation package, some comments are made regarding the performance. For both houses, upgrading to the PASSIV envelope shows higher global costs than the other two insulation levels, implicating the additional investment costs to make the building passive are not counterbalanced by the resultant savings in energy costs. The OPPTRE envelope shows slightly lower global costs than TEK10 for the Kristiansand house. As the OPPTRE envelope corresponds to the proposals in the OPPTRE architect competition, this could indicate that these proposals provide a good balance between energy use and LCC.
As for payback time, there is a slight trend of combinations with lower investment (such as BAL, A2A or EAHP) performing relatively better with increasing envelope performance. To the contrary, combinations with higher investments show relatively higher global costs with increasing envelope insulation.

3.5. Sensitivity Analysis

To understand how sensitive the results are to input data or future developments in electricity prices, a sensitivity analysis was done for some parameters:
  • Electricity price, including the effect of new power-grid tariffs.
  • Financial support from the government.
  • Whether a hydronic distribution system is already installed or not.
Apart from these individual investigated parameters, the other parameters as described in Section 2.1 are kept unchanged (as the baseline value).

3.5.1. Electricity Price

The LCC performance is sensitive to the electricity price. In addition to the baseline calculations considering an electricity price of 1.5 NOK/kWh, the cases of 1.0 NOK/kWh (representative of the electricity prices in the past), and 2.0 NOK/kWh are analyzed. With the lower price of 1.0 NOK/kWh, the global costs are lower but ambitious measures are clearly less cost-efficient. Therefore, the combinations with lower investment costs (i.e., EAHP, BalVent, A2A) are relatively more favorable (Figure 9). This low profitability of the HVAC combinations with medium and high investment costs when using the electricity price from the last decade explains the slow implementation of these technologies in Norway.
A higher price of 2.0 NOK/kWh causes a shift in favor of the combinations with medium and higher investment costs, shown in Figure 10. Combinations with medium investment have the lowest global costs. Even though CHPcomb has a high investment cost, it shows low global costs. This is an interesting combination, as it reduces the delivered energy to as low as 55 to 72 kWh/m2·year. It is clear that the global costs are strongly influenced by the electricity price. Changes in the electricity price also strongly influence the payback time: 2.0 NOK/kWh makes most payback times shorter than the technical lifetime of equipment (typically 20 years). In conclusion, the electricity prices have historically been low. However, the recent increase in the prices and increasing interconnection of Norway to the European grid show that higher electricity prices should be expected and may reach the balance point where heat pumps with a higher investment and better SPF become cost-efficient.

3.5.2. Effect of New Power-Grid Tariffs

For each of the three grid tariffs introduced in Section 2.9, the energy costs with the current tariff and the new proposed tariff are calculated. This analysis is done without any adaptation of the HVAC control or energy system design to better suit the new power-grid tariff.
An example of total specific energy costs over the 20-year calculation period with different electricity-grid tariffs is shown in Figure 11. This is for the Kristiansand house for the HVAC combinations A2A and GSHP. For these two combinations and the three envelope scenarios, the power tariffs induce lower total energy costs than the current tariffs. The difference in total energy costs between the current and proposed new tariffs is small. The difference between the various companies is larger than the difference with or without power tariff.
In Figure 12, the difference in total specific energy costs when changing from the current tariff to the new power tariff is shown for all the HVAC combinations. Combinations with efficient heat pumps and hydronic distribution have a lower peak power and there is a small but clear reduction in energy costs. On the contrary, lower investment combinations with lower SPF have higher peak power, especially for less-insulated building envelopes. The tariff proposed by Nettselskapet is the most radical: it punishes power peaks and rewards the absence of these to a greater extent than the others. The effect of a simple adaptation measure to suit the new power tariffs was also analyzed. The nighttime indoor temperature setback of 2 °C for the space heating that is used in the baseline case is removed. The result of this adaptation is that the power tariffs lead to a reduction in the energy costs for all the different HVAC combinations. For combinations with efficient heat pumps and hydronic distribution, removing the nighttime setback also resulted in lower delivered energy (not only reduced energy costs). The case without night temperature setback is shown in Figure A2 in Appendix A.
The results indicate that these new tariffs will not induce major shifts in relative performance between the analyzed HVAC combinations. The simple adaptation measure of removing the nighttime temperature setback showed a reduction in energy costs. Further adaptation of controls and energy systems may be useful. However, potential cost reductions seem so small that only limited investment costs for adaptation control are supported.

3.5.3. Financial Support from the Government

Government subsidies and grants for improving energy efficiency in buildings are not included in the baseline analysis in this study. When including the Norwegian grants from the Enova institution, the global costs of some of the measures with high investment cost and larger energy savings (like GSHP) are more favored economically, as shown in Figure 13 (versus Figure 8). The Pareto front then becomes slightly flatter, and implementing some of the HVAC combinations reduces global costs, if the minimum investment costs are used (CHP, A2A). However, this does not result in major shifts in the relative performance of the HVAC combinations. Grants for the envelope upgrade are higher for the more ambitious and thus expensive upgrade scenarios. The result is that the conclusion that the OPPTRE envelope upgrade leads to the lowest global cost (of the three scenarios analyzed) is amplified when government grants are included.
Although some of the HVAC combinations show acceptable cost-effectiveness when government support is included, the total upgrade including both envelope and HVAC still increases global costs. With an electricity price of 1.5 NOK/kWh, the reference situation before any upgrade measures shows the lowest global costs for the 20-year calculation period.

3.5.4. With Hydronic Distribution System Already Existing

For the HVAC combinations where a hydronic heat-distribution system needs to be installed, this represents a significant part of the total HVAC investment costs (from 20% to 40%; see Figure 14 compared to Figure 3). The cost of installing a hydronic distribution system is higher for the Malvik house, both in total and per m2. This is one factor explaining the slightly lower performance of some of the combinations using hydronic distribution for the Malvik house. If the hydronic heat distribution was already existing, the cost performance of the combinations using hydronic distribution would be significantly improved. Most of these combinations would then have a payback time shorter than 20 years and the global cost would be significantly lower, in absolute value, and comparable to combinations without hydronic heating (see Figure 15).
In conclusion, the additional cost to install a hydronic system strongly affects the cost-effectiveness of heat pumps with hydronic space-heating distribution. The lack of an existing hydronic distribution system in the case houses is one factor explaining the low profitability of efficient heat pumps found in this study. The lack of hydronic distribution system in most existing Norwegian detached houses seems to be a barrier to implementing air-to-water and ground-source heat pumps.

4. Discussion

4.1. General Considerations

  • The HVAC combinations in the lower and medium investment cost groups show the lowest global costs. It is, however, worth mentioning that some of the combinations with low investment costs may provide lower thermal comfort. With the EAHP, for example, supply ventilation air is not preheated. Due to possible cold drafts, some occupants may experience this as less comfortable.
  • Ideally the whole life cycle of buildings and the total carbon footprint should be considered when assessing upgrading measures to achieve a balance between the operational and embodied energy and GHG emissions. In this study, however, the emphasis on a detailed comparison of the performance of HVAC combinations was chosen, and to limit the complexity of the analysis, a total carbon footprint assessment was not included. Almeida et al. compared life-cycle cost analysis of renovation scenarios that considered only operational energy, and the same scenarios considering both the operational and the embodied energy. They concluded that including the embodied energy did not cause a major shift in the cost-effective and the cost-optimal solutions [62]. For the case houses used in this study, the GHG emissions were analyzed as part of the architecture competition in the OPPTRE project. This was done using the case with the medium envelope performance level (i.e., OPPTRE), and HVAC measures corresponding to CHPcomb. The Norwegian electricity mix factor of 25 gCO2eq./kWh was used. The assessment showed that the upgraded case houses have lower emissions than a typical new building of the same size [33]. The materials and embodied energy used for upgrading the building envelope represented a much larger fraction of emissions than that related to the HVAC measures [35].
  • In this study, different combinations of renovation measures are evaluated and compared. Although one combination may not be cost-efficient, this is not necessarily valid for all the different measures included in the combination. One single measure could be cost-effective, although the whole combination is not.

4.2. Flat Pareto Front

The global cost and delivered energy diagrams show a relatively flat Pareto front between 60 and 120 kWh/m2·year, revealing many HVAC combinations in the same range of global cost. These are mainly the combinations with low and medium investment costs. The solutions with a medium investment cost lead to a significant reduction in energy use for a minor increase in global costs. Improvement of the cost-effectiveness of these technologies (reduced investment costs, grants) would unlock a large energy-saving potential. This is in agreement with a case study by Moschetti et al. [29] where it was found that a modest increase in net present cost gave surprisingly large reductions in GWP and delivered energy. For houses already equipped with a hydronic heating system (and when government support is included), the flat Pareto front is partly extended to the high investment cost group, with a potential for even larger energy savings (see Figure 15). With an electricity price of 2.0 NOK/kWh or higher (and/or grants included), the trend is a slightly more curved Pareto front with a more defined minimum (cost optimal) area around the medium investment cost groups (see Figure 10 and Figure 13).

4.3. Envelope Performance Level

The relative performance of the different HVAC combinations seems to be only slightly influenced by the insulation level. However, only major energy retrofits of the building envelope are considered in the study. None of the three envelope upgrade scenarios levels have poor thermal insulation and a large heating demand. If a scenario with higher heating demand were included in the analysis, the relative performance of the different HVAC combinations might be altered. Ambitious measures on the envelope often reduce the impact and profitability of technical measures. However, ambitious measures on the envelope can make (simpler) HVAC solutions with lower investment costs possible, or profitable. An example of this may be the result that CHP with the medium OPPTRE envelope scenario shows the lowest global costs, when considering the minimum investment cost.
The results show that low delivered energy demand can be reached with a different balance between energy measures on the building envelope versus the HVAC systems. With the high-performance envelope scenarios used in this study, the most energy efficient HVAC combinations reduce the delivered energy by 50 to 70 kWh/m2. This indicates that efficient HVAC systems can secure very low delivered energy with significantly lower-performing envelope upgrades than investigated in this study. For example, the most efficient combinations show delivered energy as low as 60, 68 and 72 kWh/m2 even with the lowest performing envelope. This is much lower than the target in the OPPTRE architect competition of maximum delivered energy of 110 kWh/m2 and shows that this target could be reached also with a much lower-performing envelope.

4.4. Total Renovation Package

With the baseline parameters used in this study, the reference case before any upgrade measures on the building envelope or HVAC systems actually has the lowest global costs (see also Figure A1). When the government grants are included, the difference is reduced, but the order of magnitude does not change. The consequence is that the present government grants do not seem large enough to trigger the desired increase in deep-energy renovation of detached houses. With an electricity price of 2.0 NOK/m2 and government grants not included, an upgrade is slightly profitable for the Malvik house, but not for Kristiansand. One reason for this difference may be that the Malvik house has a lower performing envelope before renovation. With the same high electricity price, and government grants included, upgrade is clearly profitable for Malvik, and slightly profitable for Kristiansand. Changing from an electricity price of 1.5 NOK/kWh to 2.0 NOK/kWh has a larger effect on the cost-effectiveness of the upgrade than including the government support. The same increase in electricity price also seems to have a larger effect on the relative cost performance of the HVAC combinations than including the government grants.

4.5. Prebound Effect

The most common way to evaluate energy measures is to use energy calculations with standardized methods and input parameters before and after renovation. However, the real energy use can be different, typically due to the occupants’ behavior: lower temperatures and thermal zoning, or low ventilation airflow rates. This is called the performance gap or the prebound effect [63]. This deviation can lead to an overestimation of the real potential for energy savings. In the OPPTRE architecture competition, an average prebound effect of 40% was observed (measured delivered energy only 60% of standardized calculation). Sandberg et al. [64] analyzed a larger set of buildings and found a prebound effect of 25% for houses in this segment.
Including a prebound effect of 25% in this study has a large influence on the cost-efficiency of the renovation measures compared to the existing building (not renovated): the analyzed renovation measures are clearly unprofitable. This shows that it is important to include occupant behavior in the assessment of deep-energy renovation measures. When prebound effects are included in the assessment, a much larger increase in government support seems to be needed, in order to trigger more deep-energy renovation.

4.6. Limitations

  • With only two case houses used in this study, more cases are needed to be able to generalize the conclusions. However, in the OPPTRE architecture competition these houses were selected from over 100 cases as representative for their type and decade. It was observed that the difference between the two case houses resulted in some differences between the energy and cost performance of the different HVAC measures. Nonetheless, the differences observed between the two cases were minor, and the general trends were the same.
  • Oslo was the only location used in the assessment, and this makes the conclusions less general. However, a large part of the Norwegian building stock is located in the region of Oslo. This means the climate used is representative for a large number of Norwegian houses.
  • For some investments and technologies, a limited number of prices was obtained, thus increasing the uncertainty in the resulting cost spans. This was the case for CHP, for example.

5. Conclusions

LCC and energy performance of different HVAC combinations were evaluated as part of a deep-energy renovation of Norwegian detached houses. Nine all-electric HVAC combinations based on heat pump technologies were analyzed, with the use of detailed building performance simulation. The building envelope is upgraded significantly, and three different levels of envelope performance were investigated. This was all done in a Norwegian context, with the use of two case houses, without a hydronic heating system existing initially. The main findings can be summarized as follows:
  • Low delivered energy can be achieved with different balances between investments on energy measures for the building envelope versus HVAC systems. Heat pumps can contribute significantly to the reduction in energy use (especially with hydronic distribution).
  • For the deep-retrofit scenarios considered, the relative performance between HVAC solutions is not affected much by the insulation level.
  • The HVAC combinations can be divided in three main groups according to the level of investment: low (with combination BalVent, A2A, EAHPDHW), medium (with combinations A2Asolar, CHP, EAHPcomb), and high (with combination A2W, CHPcomb, GSHP).
  • Many solutions with medium and higher investments have a payback back time close to the technical lifetime of the equipment, meaning 20 years, which is critical.
  • The span in investment costs for HVAC investments result in significant spans in global costs. In many cases, the cost span inside a combination is larger than the difference between the neighboring combinations. This shows that uncertainty on investment costs is important and affects the relative performance between HVAC solutions. The cost performance is thus not only related to the choice of technology but also the choice of product (manufacturer and company installing).
  • Solutions with lower investment costs often lead to lower global costs but higher energy use. However, the global cost and delivered energy diagram show a relatively flat Pareto front over a long range of energy use (between 60 and 120 kWh/m2·year) so that some combinations can significantly decrease the energy use for a minor increase in global costs. In other words, solutions with a medium investment cost lead to a significant reduction in the energy use for a small increase in the global costs. Improvement of the cost-effectiveness of these technologies (reduced investment costs, grants) would unlock a large energy-saving potential.
  • A hydronic system enables a higher energy coverage factor, leading to a higher system SPF. However, a hydronic system is not installed in most existing Norwegian wooden houses. The additional cost to install a hydronic system can strongly affect the cost-effectiveness of heat pumps with hydronic space-heating distribution. This penalizes technologies like air-to-water heat pumps and GSHP.
  • The evolution of electricity prices in Norway will have a decisive influence on the relative performance of the HVAC combinations. The historically low energy prices have favored combinations with a lower investment, but lower energy efficiency, typically air-to-air heat pumps. It has been shown that solutions with high energy performance and medium and high investment costs would be made competitive by a moderate increase in the electricity price. Regarding changes in energy prices in the near future, new grid tariffs to limit peak power will be introduced in Norway. The study shows that these new tariffs will not have a large impact on the cost-effectiveness of HVAC solutions and their relative performance.
  • The government subsidies in Norway currently have a limited impact on the relative cost performance of HVAC solutions. For the investigated cases, the subsidies in Norway do not seem large enough to induce a major increase in deep-energy renovation of detached houses.

Author Contributions

Conceptualization, L.G. and V.H.; methodology, V.H. and L.G.; software, H.S.T.; validation, V.H., L.G. and H.S.T.; investigation, V.H.; data curation, V.H. and H.S.T.; writing—original draft preparation, V.H.; writing—review and editing, L.G. and A.G.L.; visualization, V.H.; supervision, L.G.; funding acquisition, A.G.L. and L.G. All authors have read and agreed to the published version of the manuscript.

Funding

This work is part of the OPPTRE project on energy upgrading of wooden dwellings to nearly zero energy level (http://opptre.no/, accessed on 1 August 2022). This research was funded by the Research Council of Norway, grant number 280956. The APC was funded by the Norwegian University of Science and Technology.

Institutional Review Board Statement

Not applicable.

Informed Consent Statement

Not applicable.

Data Availability Statement

The datasets generated and analyzed during the current study are not publicly available because significant preprocessing and structuring of data is required to make it open access. but will be available upon request.

Conflicts of Interest

The authors declare no conflict of interest. The funders had no role in the design of the study; in the collection, analyses, or interpretation of data; in the writing of the manuscript; or in the decision to publish the results.

Appendix A

The appendix shows some figures with information supplementary to the main text.
Figure A1. Specific cost of envelope upgrading. Pale colors show the cost with the discounted residual value subtracted.
Energies 15 07060 g0a1
Figure A2. Difference in total specific energy costs between power tariff and original tariff for the calculation period of 20 years and the alternative case with no nighttime heating setback.
Energies 15 07060 g0a2
Figure A3. Specific global costs and delivered energy of the Kristiansand house with government grants included and electricity price of 2.0 NOK/kWh.
Energies 15 07060 g0a3
Figure A4. Specific global costs and delivered energy of the Malvik house with government grants included and electricity price of 2.0 NOK/kWh.
Energies 15 07060 g0a4
Figure A5. Specific global costs and delivered energy of the Kristiansand house. Baseline scenario without government support, and electricity price of 1.5 NOK/kWh. Initial situation before upgrading to the very right. Dotted lines suggest scenario with a prebound effect of 25% included.
Energies 15 07060 g0a5

References

  1. The European Commission. Europe’s 2030 Climate and Energy TARGETS: Research & Innovation Actions; Publication Office Luxembourg: Luxembourg, 2021. [Google Scholar] [CrossRef]
  2. Economidou, M.; Atanasiu, B.; Despret, C.; Maio, J.; Nolte, I.; Rapf, O.; Laustsen, J.; Ruyssevelt, P.; Staniaszek, D.; Strong, D. Europe’s Buildings under the Microscope. A Country-by-Country Review of the Energy Performance of Buildings; Buildings Performance Institute Europe, Brussels: Brussels, Belgium, 2011. [Google Scholar]
  3. The European Commission. Directive (EU) 2018/844 of the European Parliament and of the Council of 30 May 2018 Amending Directive 2010/31/EU on the Energy Performance of Buildings and Directive 2012/27/EU on Energy Efficiency; Official Journal of the European Union, Publication Office: Luxembourg, 2018. [Google Scholar]
  4. The European Commission. Communication from the Commission to the European Parliament, the Council, The European Economic and Social Committee and the Committee of the Regions. In A Renovation Wave for Europe -Greening Our Buildings, Creating Jobs, Improving Lives; Publication Office: Luxembourg, 2020; Volume 662, p. 27. [Google Scholar]
  5. Statistics Norway. Energy Consumption in Households. Available online: https://www.ssb.no/en/statbank/table/10573/tableViewLayout1/ (accessed on 3 May 2022).
  6. Norwegian Government. Forskrift om Forbud Mot Bruk av Mineralolje Til Oppvarming av Bygninger; Lovdata: Oslo, Norway, 2018. [Google Scholar]
  7. Norwegian Heat Punp Association (NOVAP). NOVAP Heat Pump Statsistics. Available online: heatpumpingtechnologies.org/news/1/57391/ (accessed on 27 May 2022).
  8. Bøeng, A.C.; Halvorsen, B.; Larsen, B. Oppvarming i Boliger: Kartlegging av Oppvarmingsutstyr og Effektiviseringstiltak i Husholdningene; NVE, SSB: Oslo, Norway, 2014. [Google Scholar]
  9. Risholt, B.; Berker, T. Success for energy efficient renovation of dwellings—Learning from private homeowners. Energy Policy 2013, 61, 1022–1030. [Google Scholar] [CrossRef]
  10. Stortinget. Kraft til Endring. Energipolitikken mot 2030. 2016, Stortingsmelding 25. Available online: https://www.regjeringen.no/no/dokumenter/meld.-st.-25-20152016/id2482952/ (accessed on 10 August 2022).
  11. Antonov, Y.I. Residential Renovation Assessment of Nearly Zero Energy; Ålborg University: Aalborg, Denmark, 2021. [Google Scholar]
  12. Antonov, Y.I.; Heiselberg, P.K.; Pomianowski, M.Z. Novel methodology toward nearly zero energy building (NZEB) renovation: Cost-effective balance approach as a pre-step to cost-optimal life cycle cost assessment. Appl. Sci. 2021, 11, 4141. [Google Scholar] [CrossRef]
  13. Zangheri, P.; Armani, R.; Pietrobon, M.; Pagliano, L. Identification of cost-optimal and NZEB refurbishment levels for representative climates and building typologies across Europe. Energy Effic. 2018, 11, 337–369. [Google Scholar] [CrossRef]
  14. Kurnitski, J.; Kuusk, K.; Tark, T.; Uutar, A.; Kalamees, T.; Pikas, E. Energy and investment intensity of integrated renovation and 2030 cost optimal savings. Energy Build. 2014, 75, 51–59. [Google Scholar] [CrossRef]
  15. Morck, O.; Almeida, M.; Ferreira, M.; Brito, N.; Thomsen, K.E.; Østergaard, I. Shining examples analysed within the EBC Annex 56 project. Energy Procedia 2015, 78, 2334–2339. [Google Scholar] [CrossRef]
  16. Moran, P.; O’Connell, J.; Goggins, J. Sustainable energy efficiency retrofits as residenial buildings move towards nearly zero energy building (NZEB) standards. Energy Build. 2020, 211, 109816. [Google Scholar] [CrossRef]
  17. Dermentzis, G.; Ochs, F.; Siegele, D.; Feist, W. Renovation with an innovative compact heating and ventilation system integrated into the façade—An in-situ monitoring case study. Energy Build. 2018, 165, 451–463. [Google Scholar] [CrossRef]
  18. Ekström, T.; Bernardo, R.; Blomsterberg, Å. Cost-effective passive house renovation packages for Swedish single-family houses from the 1960s and 1970s. Energy Build. 2018, 161, 89–102. [Google Scholar] [CrossRef]
  19. Gustafsson, M.; Dermentzis, G.; Myhren, J.A.; Bales, C.; Ochs, F.; Holmberg, S.; Feist, W. Energy performance comparison of three innovative HVAC systems for renovation through dynamic simulation. Energy Build. 2014, 82, 512–519. [Google Scholar] [CrossRef] [Green Version]
  20. Antonov, Y.I.; Heiselberg, P.; Flourentzou, F.; Pomianowski, M.Z. Methodology for evaluation and development of refurbishment scenarios for multi-story apartment buildings, applied to two buildings in Denmark and Switzerland. Buildings 2020, 10, 102. [Google Scholar] [CrossRef]
  21. Hamid, A.A.; Farsäter, K.; Wahlström, Å.; Wallentén, P. Literature review on renovation of multifamily buildings in temperate climate conditions. Energy Build. 2018, 172, 414–431. [Google Scholar] [CrossRef]
  22. Skeie, K.S.; Kleiven, T.; Lien, A.G.; Risholt, B.D. Energiplan-Tre Trinn for Tre Epoker: Systematisk Energioppgradering av Småhus-SEOPP; SINTEF Fag: Trondheim, Norway, 2014; Volume 25. [Google Scholar]
  23. Lien, A.G.; Skeie, K.S.; Bjaanes, E.O.; Hagen, K.; Kvalø, Y. Oppgradering av et 60-Tallshus og et 70-Tallshus; SINTEF Fag: Trondheim, Norway, 2017; Volume 42, Available online: https://www.sintefbok.no/book/index/1116/oppgradering_av_et_60-tallshus_og_et_70-tallshus (accessed on 22 August 2022).
  24. Hrynyszyn, B.D.; Felius, L.C. Upgrading of a Typical Norwegian Existing Wooden House According to the EnerPHit Standard. In Proceedings of the Cold Climate HVAC Conference, Kiruna, Sweden, 12–15 March 2018; pp. 183–193. [Google Scholar]
  25. Passive House Institute. Criteria for the Passive House, EnerPHit and PHI Low Energy Building Standards; 2022; Version 10. Available online: https://passiv.de/downloads/03_building_criteria_en.pdf (accessed on 22 August 2022).
  26. Langdal, J. Energisparepotensiale og Lønnsomhet ved Energioppgradering av 50- og 80-Talls Enebolig; Norwegian Univerity of Science and Technology (NTNU): Trondheim, Norway, 2019. [Google Scholar]
  27. Mossing, A.; Røise, M.; Vigmostad, T.M. Lønnsomhet ved Omfattende Energioppgradering av et 60-Tallshus; NTNU: Trondheim, Norway, 2020. [Google Scholar]
  28. Felius, L.C.; Hamdy, M.; Dessen, F.; Hrynyszyn, B.D. Upgrading the Smartness of Retrofitting Packages towards Energy-Efficient Residential Buildings in Cold Climate Countries: Two Case Studies. Buildings 2020, 10, 200. [Google Scholar] [CrossRef]
  29. Moschetti, R.; Brattebø, H. Combining life cycle environmental and economic assessments in building energy renovation projects. Energies 2017, 10, 1851. [Google Scholar] [CrossRef]
  30. Gonzalez-Caceres, A.; Karlshøj, J.; Vik, T.A.; Hempel, E.; Nielsen, T.R. Evaluation of cost-effective measures for the renovation of existing dwellings in the framework of the energy certification system: A case study in Norway. Energy Build. 2022, 264, 112071. [Google Scholar] [CrossRef]
  31. 32012R0244–EN; Commission Delegated Regulation (EU) No 244/2012 of 16 January 2012 supplementing Directive 2010/31/EU of the European Parliament and of the Council on the Energy Performance of Buildings by Establishing a Comparative Methodology Framework for Calculating. European Parlament: Strasbourg, France, 2012.
  32. IEA. Methodology for Cost Effective Energy and Carbon Emission Optimization in Building Renovation (Annex 56); University of Minho: Braga, Portugal, 2017; Available online: https://hdl.handle.net/1822/43437 (accessed on 10 August 2022).
  33. Sørlie, K.H.; Lien, A.G.; Brekke, T.; Hauge, P.K.; Heide, V.; Jelstad, E.; Hagen, K. Architecture Competition “OPPTRE". Energy Upgrading of Wooden Dwellings to Nearly Zero Energy Level; NAK: Oslo, Norway, 2021. [Google Scholar]
  34. Heide, V.; Kjellberg, B.; Valstad Johansen, S.; Selstad Thingbø, H.; Gunnarshaug Lien, A.; Georges, L. Economic and Energy Performance of Heating and Ventilation Systems in Energy Retrofitted Norwegian Detached Houses. In Proceedings of the CLIMA 2022 Conference, Rotterdam, The Netherlands, 22–25 May 2022. [Google Scholar] [CrossRef]
  35. Moschetti, R.; Time, B.; Gullbrekken, L.; Heide, V.; Georges, L.; Lien, A.G. Analysing energy upgrading projects of single-family houses towards a Norwegian nZEB level. In Proceedings of the Journal of Physics: Conference Series; IOP Publishing: Bristol, UK, 2021; p. 012112. [Google Scholar]
  36. NS-EN 15459; Energy Performance of Buildings—Economic Evaluation Procedure for Energy Systems in Buildings—Part 1: Calculation Procedures, Module M1-14. CE de Normalisation–CEN: Brussel, Belgium, 2017.
  37. Statistisk Sentralbyrå. Elektrisitetspriser. Available online: https://www.ssb.no/elkraftpris (accessed on 1 October 2021).
  38. Atanasiu, B.; Kouloumpi, I.; Thomsen, K.E.; Aggerholm, S.; Enseling, A.; Loga, T.; Witczak, K. Implementing the Cost-Optimal Methodology in EU Countries: Lessons Learned from Three Case Studies; BPIE–Buildings Performance Institute Europe: Bruxelles, Belgium, 2013. [Google Scholar]
  39. NS 3700:2013; Criteria for Passive Houses and Low Energy Houses (Residential Buildings). Standard Norge: Oslo, Norway, 2013.
  40. Brattebø, H.; O’Born, R.J.; Sartori, I.; Klinski, M.; Nørstebø, B. Typologier for Norske Boligbygg-Eksempler på Tiltak for Energieffektivisering. 2016. Available online: https://sintef.brage.unit.no/sintef-xmlui/handle/11250/2456621 (accessed on 1 August 2022).
  41. Mikola, A.; Kõiv, T.-A. The Efficiency Analysis of the Exhaust Air Heat Pump System. Engineering 2014, 6, 1037–1045. [Google Scholar] [CrossRef]
  42. Lindahl, M.; Haglund Stignor, C.; Andersson, K.; Thyberg, S. Exhaust air heat pumps evaluated for Nordic circumstances. In Proceedings of the 11th IEA Heat Pump Conference 2014, Montréal, QC, Canada, 12–16 May 2014. [Google Scholar]
  43. Ericson, T. Varmepumper i Energisystemet. Status og Muligheter; NVE: Oslo, Norway, 2016. [Google Scholar]
  44. Weir, D.E. Kostnader i Energisektoren. Kraft, Varme og Effektivisering; NVE: Oslo, Norway, 2015. [Google Scholar]
  45. Zottl, A.; Nordman, R.; Miara, M.; Huber, H. System boundaries for SPF calculation. In Proceedings of the 10th IEA Heat Pump Conference, Tokyo, Japan, 16–19 May 2011. [Google Scholar]
  46. Lidbom. Fältmätning av Luft/Luft Värmepumpar i Svenska Småhus; Svensk Provning: Stockholm, Sweden, 2009. [Google Scholar]
  47. Nordman, R.; Andersson, K.; Axell, M.; Lindahl, M. Calculation methods for SPF for heat pump systems for comparison, system choice and dimensioning. SP Rapp. 2010, 2010, 49, ISSN 0284-5172. [Google Scholar]
  48. Nordman, R. Demonstration of Field Measurements of Heat Pump Systems in Buildings—Good Examples with Modern Technology. 2016. Available online: https://www.diva-portal.org/smash/record.jsf?pid=diva2:1061424 (accessed on 1 August 2022).
  49. Miara, M.; Günther, D.; Langner, R.; Helmling, S.; Wapler, J. 10 years of heat pumps monitoring in Germany. Outcomes of several monitoring campaigns. From low-energy houses to un-retrofitted single-family dwellings. In Proceedings of the 12th IEA Heat Pump Conference, Rotterdam, The Netherlands, 15–18 May 2017. [Google Scholar]
  50. Kuster, R.R.; Prinzing, M.; Matthias, B.; Eschmann, M.; Bertsch, S.S. Field Performance of Domestic Heat Pumps for Heating and Hot Water in Switzerland Part II: Results, Analysis And Optimization. 2021. Available online: https://docs.lib.purdue.edu/cgi/viewcontent.cgi?article=3083&context=iracc (accessed on 1 August 2022).
  51. O’Donovan, A.; O’Sullivan, P. In-Use Performance of Air-to-Water Heat Pumps: Are the Standards robust? In Proceedings of the E3S Web of Conferences; EDP Sciences: Les Ulis, France, 2021; p. 06002. [Google Scholar]
  52. Abdel-Salam, M.R.; Zaidi, A.; Cable, M. Field study of heating performance of three ground-source heat pumps in Canadian single-family houses. Energy Build. 2021, 247, 110959. [Google Scholar] [CrossRef]
  53. O’Sullivan, P.; Colclough, S.; Morehead, J.; O’Donovan, A. Evaluation of the theoretical and in-use performance of Exhaust Air Heat Pumps. In Proceedings of the E3S Web of Conferences; EDP Sciences: Les Ulis, France, 2021; p. 06003. [Google Scholar]
  54. Shirani, A.; Merzkirch, A.; Roesler, J.; Leyer, S.; Scholzen, F.; Maas, S. Experimental and analytical evaluation of exhaust air heat pumps in ventilation-based heating systems. J. Build. Eng. 2021, 44, 102638. [Google Scholar] [CrossRef]
  55. Sakellari, D.; Lundqvist, P. Modelling and simulation results for a domestic exhaust-air heat pump heating system. Int. J. Refrig. 2005, 28, 1048–1056. [Google Scholar] [CrossRef]
  56. Thalfeldt, M.; Kurnitski, J.; Latõšov, E. Exhaust air heat pump connection schemes and balanced heat recovery ventilation effect on district heat energy use and return temperature. Appl. Therm. Eng. 2018, 128, 402–414. [Google Scholar] [CrossRef]
  57. Pylsy, P.; Kurnitski, J. Measured performance of exhaust air heat pumps in Finnish apartment buildings. In Proceedings of the E3S Web of Conferences; EDP Sciences: Les Ulis, France, 2021; p. 06001. [Google Scholar]
  58. Saini, P.; Paolo, B.; Fiedler, F.; Widén, J.; Zhang, X. Techno-economic analysis of an exhaust air heat pump system assisted by unglazed transpired solar collectors in a Swedish residential cluster. Solar Energy 2021, 224, 966–983. [Google Scholar] [CrossRef]
  59. SN-NSPEK 3031; Energy Performance of Buildings—Calculation of Energy Needs and Energy Supply. Standard Norge: Oslo, Norway, 2021.
  60. Norwegian Building Authority. Regulations on Technical Requirements for Construction Works; Norwegian Building Authority: Oslo, Norway, 2017. [Google Scholar]
  61. Standard 90.1–200; Normative Appendix B: Building Envelope Climate Criteria. ANSI/ASHRAE/IESNA, USA. 2007. Available online: https://up.codes/viewer/district-of-columbia/ashrae-90.1-2013/chapter/normative_appendix_b_/normative-appendix-b-building-envelope-climate-criteria (accessed on 10 August 2022).
  62. Almeida, M.G.d.; Ferreira, M.A.P.S.; Rodrigues, A.; Höfler, K.; Maydl, J.; Venus, D.; Sedlák, J.; Struhala, K.; Mørck, O.C.; Østergaard, I. Co-Benefits of Energy Related Building Renovation: Demonstration of Their Impact on the Assessment of Energy Related Building Renovation (Annex 56); Universidade do Minho: Braga, Portugal, 2017. [Google Scholar]
  63. Sunikka-Blank, M.; Galvin, R. Introducing the prebound effect: The gap between performance and actual energy consumption. Build. Res. Inf. 2012, 40, 260–273. [Google Scholar] [CrossRef]
  64. Sandberg, N.H.; Sartori, I.; Inderberg Vestrum, M.; Brattebø, H. Using a segmented dynamic dwelling stock model for scenario analysis of future energy demand: The dwelling stock of Norway 2016–2050. Energy Build. 2017, 146, 220–232. [Google Scholar] [CrossRef]
Figure 1. The two case houses. Picture before refurbishment (top) and floor plan before and after refurbishment (below): Kristiansand house on the left (a), Malvik on the right (b).
Energies 15 07060 g001
Figure 2. Total specific investment costs for HVAC combinations.
Energies 15 07060 g002
Figure 3. Total specific investment costs for envelope and HVAC systems for the Kristiansand house using the OPPTRE scenario.
Energies 15 07060 g003
Figure 4. Energy coverage factor of the heat pump systems in both houses.
Energies 15 07060 g004
Figure 5. Seasonal performance factor for heat pump systems in both houses.
Energies 15 07060 g005
Figure 6. Payback time for the analyzed HVAC combinations and baseline scenario. The span of payback time is due to the range of investment costs.
Energies 15 07060 g006
Figure 7. Specific global costs and delivered energy of the Kristiansand house. Minimum, average, and mean costs shown.
Energies 15 07060 g007
Figure 8. Specific global costs and delivered energy of the Malvik house.
Energies 15 07060 g008
Figure 9. Specific global costs and delivered energy of the Kristiansand house with electricity price 1.0 NOK/kWh.
Energies 15 07060 g009
Figure 10. Specific global costs and delivered energy of the Kristiansand house with electricity price 2.0 NOK/kWh.
Energies 15 07060 g010
Figure 11. Total specific energy costs for Kristiansand house over 20 years for different electricity tariffs: GSHP in solid columns and A2A in shaded columns.
Energies 15 07060 g011
Figure 12. Difference in total specific energy costs between power tariff and original tariff for a calculation period of 20 years. Baseline case with nighttime heating setback.
Energies 15 07060 g012
Figure 13. Specific global costs and delivered energy of the Kristiansand house with government grants included.
Energies 15 07060 g013
Figure 14. Total specific investment costs for HVAC combinations, when assuming hydronic distribution system already installed.
Energies 15 07060 g014
Figure 15. Global costs in the Kristiansand house, assuming hydronic distribution already installed.
Energies 15 07060 g015
Table 1. Parameters for calculating economic performance.
ParameterValue
Calculation period (TC) [years]20
Inflation rate [%]2
Real discount rate [%]3
Electricity price for baseline case [NOK/kWh]1.5
Currency conversion: NOK per euro [NOK/€]10.0
Table 2. Thermal properties for the two case houses for the different building envelope performance and the simulated space-heating needs using standard input data.
ParameterUnitExisting
Kristiansand
Existing
Malvik
TEK10OPPTREPASSIV
U-value external wallW/(m2·K)0.450.440.220.18 0.11
U-value roofW/(m2·K)0.50.30.180.14 0.08
U-value basement wall to groundW/(m2·K)0.873.50.330.2 0.11
U-value external floorW/(m2·K)0.544.30.3 (4.3 *)0.18 (4.3 *) 0.11
U-value internal wallsW/(m2·K)0.470.60.470.47 0.47
U-value windows and doorsW/(m2·K)2.62.61.61.0 0.8
Normalized thermal bridge valueW/(m2·K)0.070.070.70.5 0.3
Infiltrationh−16.06.03.01.5 0.6
Annual space-heating need, Kristiansand housekWh/m2111-50.928.515.2
Annual space-heating need, Malvik housekWh/m2-15775.348.427.5
* For these upgraded levels, part of the basement floor in the Malvik house has poor U-value.
Table 3. Description of the different HVAC combinations: heat pump and ventilation system.
Combination
Name
Space HeatingHydronic DistributionDomestic Hot WaterVentilation
EnvelopeReference scenario: only the building envelope is upgraded.
Electric panel heaters, electric floor heating in bathroom.
-Electric boilerExtract
BalVentElectric panel heaters, electric floor heating in bathroom -Electric boilerBalanced
A2AAir-to-air heat pump in living room (A2A).
Electric panel heaters, electric floor heating in bathroom.
-Electric boilerBalanced
A2AsolarAir-to-air heat pump in living room.
Electric panel heaters, electric floor heating in bathroom.
-Solar collectorBalanced
A2WAir-to-water heat pump (A2W).YesA2W HPBalanced
GSHPGround-source heat pump (GSHP).
Borehole heat exchanger does not exist and should be created.
YesGSHPBalanced
CHPCompact heat pump with balanced ventilation integrated in unit *
Electric panel heaters, electric floor heating in bathroom.
-Compact HPBalanced
CHPcombCompact heat pump with balanced ventilation integrated in unit. **YesCompact HPBalanced
EAHPDHWExhaust-air heat pump (EAHP).
Electric panel heaters, electric floor heating in bathroom.
-EAHPExtract
EAHPcombExhaust-air heat pump (EAHP).YesEAHPExtract
* Ventilation air heating. ** The simulated version can also use outdoor air as heat source when heat from ventilation exhaust is not sufficient.
Table 4. Nominal heat pump capacity, COP, and investment costs of the different HVAC combinations for the Kristiansand house.
TEK10OPPTREPASSIV Enova Grants
CombinationSize
kW
Min
kNOK
Max
kNOK
Mean
kNOK
Size
kW
Min
kNOK
Max
kNOK
Mean
kNOK
Size
kW
Min
kNOK
Max
kNOK
Mean
kNOK
COPRating Temp kNOK
BalVent 74.496.485.4 74.496.485.4 74.496.485.4 10
A2A4.587.4116.4101.0 4.587.4116.4101.0 4.587.4116.4101.0 37/21 10
A2Asolar4.5157.4208.4181.0 4.5157.4208.4181.0 4.5157.4208.4181.0 37/21 17
A2W9290.6352.6318.8 7.3260.6322.6289.8 7.3260.6322.6289.8 3.57/45 25
CHP2141.4187.8168.5 2141.4187.8168.5 2141.4187.8168.5 20/35 10
CHPcomb6.4242.2325.0288.7 6.4242.2325.1288.8 6.4242.2325.1288.8 3.150/35 25
EAHPDHW4.267.980.474.4 4.267.980.474.4 4.267.980.474.4 3.60/35 0
EAHPcomb4.2189.5218.5204.7 4.2189.6218.6204.8 4.2189.6218.6204.8 3.60/35 15
GSHP8.2333.6393.6363.3 8.274.496.485.4 5.5301.6361.6329.8 4.50/35 50
Table 6. The analyzed grid rent tariffs.
Power Cost (NOK/month)Consumption Grid Cost (NOK/kWh)
ExistingPower Limit (kW)WinterSummerExisting
No limit251015DayNightDayNight
Glitre energi1601601602203200.4740.3540.4740.3550.474
Elvia1151301902803750.4170.2920.3740.3110.482
Nettselskapet36562.5187.53455400.4030.2830.4030.2830.335
Publisher’s Note: MDPI stays neutral with regard to jurisdictional claims in published maps and institutional affiliations.

