Article

Transthoracic Echocardiography-Based Prediction Model of Adverse Event Risk in Patients with COVID-19

by
Elena Zelikovna Golukhova
1,
Inessa Viktorovna Slivneva
2,*,
Maxim Leonidovich Mamalyga
3,
Damir Ildarovich Marapov
4,
Mikhail Nikolaevich Alekhin
5,
Mikhail Mikhailovich Rybka
6 and
Irina Vasilevna Volkovskaya
7
1
A.N. Bakulev National Medical Scientific Center for Cardiovascular Surgery, Ministry of Health of the Russian Federation, 121552 Moscow, Russia
2
Department of Emergency Ultrasound and Functional Diagnostics, A.N. Bakulev National Medical Scientific Center for Cardiovascular Surgery, Ministry of Health of the Russian Federation, 121552 Moscow, Russia
3
Department of Surgical Treatment of Coronary Heart Disease, A.N. Bakulev National Medical Research Center for Cardiovascular Surgery, Ministry of Health of the Russian Federation, 121552 Moscow, Russia
4
Department of Public Health, Economics and Health Care Management, Kazan State Medical Academy—Branch Campus of the Federal State Budgetary Educational Institution of Further Professional Education «Russian Medical Academy of Continuous Professional Education» of the Ministry of Healthcare of the Russian Federation, 420012 Kazan, Russia
5
Functional Diagnostics Department of the Central Clinical Hospital with Polyclinic of the Russian Presidential Administration, 121359 Moscow, Russia
6
Department of Anesthesiology and Intensive Care, A.N. Bakulev National Medical Scientific Center for Cardiovascular Surgery, Ministry of Health of the Russian Federation, 121552 Moscow, Russia
7
Polyclinic Department of the Institute of Coronary and Vascular Surgery, A.N. Bakulev National Medical Scientific Center for Cardiovascular Surgery, Ministry of Health of the Russian Federation, 121552 Moscow, Russia
*
Author to whom correspondence should be addressed.
Pathophysiology 2022, 29(2), 157-172; https://doi.org/10.3390/pathophysiology29020014
Submission received: 21 March 2022 / Revised: 19 April 2022 / Accepted: 20 April 2022 / Published: 26 April 2022
(This article belongs to the Topic Human Anatomy and Pathophysiology)

Abstract

:
Cardiopulmonary disorders cause a significant increase in the risk of adverse events in patients with COVID-19. Therefore, the development of new diagnostic and treatment methods for comorbid disorders in COVID-19 patients is one of the main public health challenges. The aim of the study was to analyze patient survival and to develop a predictive model of survival in adults with COVID-19 infection based on transthoracic echocardiography (TTE) parameters. We conducted a prospective, single-center, temporary hospital-based study of 110 patients with moderate to severe COVID-19. All patients underwent TTE evaluation. The predictors of mortality we identified in univariate and multivariable models and the predictive performance of the model were assessed using receiver operating characteristic (ROC) analysis and area under the curve (AUC). The predictive model included three factors: right ventricle (RV)/left ventricle (LV) area (odds ratio (OR) = 1.048 per 1/100 increase, p = 0.03), systolic pulmonary artery pressure (sPAP) (OR = 1.209 per 1 mm Hg increase, p < 0.001), and right ventricle free wall longitudinal strain (RV FW LS) (OR = 0.873 per 1% increase, p = 0.036). The AUC-ROC of the obtained model was 0.925 ± 0.031 (95% confidence interval (95% CI): 0.863–0.986). The sensitivity (Se) and specificity (Sp) measures of the models at the cut-off point of 0.129 were 93.8% and 81.9%, respectively. A binary logistic regression method resulted in the development of a prognostic model of mortality in patients with moderate and severe COVID-19 based on TTE data. It may also have additional implications for early risk stratification and clinical decision making in patients with COVID-19.

1. Introduction

Nowadays, the rapid spread of the COVID-19 virus often results in comorbid pulmonary and cardiac dysfunction due to the high level of coronavirus tropism to respiratory system tissues and to vascular endothelium. Cardiopulmonary disorders significantly increase the risk of adverse events in COVID-19 patients. Therefore, one of the urgent public health problems is the development of new diagnostic and treatment methods for comorbid disorders in patients with COVID-19.
Coronavirus cytopathic action, inflammatory cytokine storms, and the cytokine effect on the myocardium, respiratory dysfunction and hypoxia, coagulation disorders, and disorders of the renin-angiotensin-aldosterone system are among the mechanisms underlying the development of cardiopulmonary anomalies in COVID-19 patients [1,2,3]. Increased pulmonary vascular resistance and the development of pulmonary hypertension in acute lung injury eventually lead to RV dysfunction [4]. It most often occurs as a consequence of acute respiratory distress syndrome (ARDS) [5,6] or in the context of acute pulmonary embolism following coagulation disorders and venous thromboembolism [1]. Even in the absence of cardiac abnormalities, COVID-19 progression leads to impaired central hemodynamic adaptation and exacerbates the patient’s severe conditions [7,8]. Therefore, the development of new diagnostic strategies to detect pulmonary and cardiovascular dysfunction in patients with COVID-19 is an actual task.
The aim of the study was to investigate the survival rate and to develop a predictive model of survival in adults with COVID-19 infection based on TTE data.

2. Materials and Methods

2.1. Study Design and Population Profile

We conducted a prospective, single-center, temporary hospital-based study of patients with COVID-19 infection. From 148 patients in the initial data set with laboratory-confirmed COVID-19 infection, the final sample comprised 110 patients (74%). Patients with LV systolic dysfunction (i.e., an LV ejection fraction of less than 50%, signs of myocardial asynergy, or prior myocardial infarction), valve heart disease, prior heart surgery, percutaneous revascularization, a lung injury volume of less than 25%, evidence of RV or pulmonary artery outflow tract stenosis, non-adequate transthoracic acoustic window, or hemodynamic instability at time of study were excluded from the study. The local ethics committee approved the study project during the time of the temporary hospitalization (approval code number 3, dated 25 November 2021).
To reduce the risk of spreading infection, the study time was limited [9]. The treatment of patients differed depending on the period of the disease, clinical manifestation, leading pathogenetic syndrome, and concomitant diseases. In-hospital treatment tactics included non-pharmacological treatment (semi-bed rest, prone position of the body), oxygen therapy with possible respiratory support, and medication therapy, which included antiviral, anticoagulant, antiaggregant, anti-inflammatory, and antibacterial therapy.
We collected and analyzed transthoracic echocardiography (TTE) data. All patients also had chest computed tomography (CT), electrocardiography, and the required set of diagnostic and laboratory tests on admission. The median age of the patients was 63.0 years [interquartile range (IQR): 51.0; 74.0], and 57.3% were male.
The median time from the onset of the disease to hospitalization was 8 days, and the average duration of hospital stay was 13 days. Of the total patients, 11 (10.0%) were admitted to the intensive care unit (ICU) and 21 (19.1%) were transferred to the ICU due to the need for more active oxygen therapy. An analysis of the clinical profile of patients showed that most patients had a high risk of cardiovascular disease development: 81 patients (73.6%) had arterial hypertension, 20 patients (18.2%) had diabetes mellitus, and 18 patients (16.4%) had a history of cancer. Previous stroke or transient ischemic attack (present in 12.7% of the patients) and chronic obstructive pulmonary disease (COPD) (present in 10.9% of the patients) were also among the main comorbidities found. Laboratory tests showed increased levels of biomarkers of systemic inflammatory response and of thrombosis. The clinical characteristics of the patients and TTE findings are presented in Table 1.
The study sample was divided into two comparable groups depending on the outcome of the disease: survivors (n = 93) and non-survivors (n = 17).

2.2. Echocardiographic Analysis

Transthoracic echocardiographic examinations (TTE) were performed on a GE Vivid™ E9 ultrasound system (GE Vingmed Ultrasound AS, Horten, Norway) according to the approved protocol. Essential TTE positions (parasternal, apical, modified RV position, and subcostal) were used to visualize and evaluate the right heart. Dimensional and volumetric parameters of the left and right heart were measured in an apical four-chamber view with the calculation of the indexed parameters. LV volumes and ejection fractions were measured by biplane Simpson. Quantitative measurements were obtained according to the current recommendations of the American Society of Echocardiography and the European Association of Cardiovascular Imaging (ASE and EACVI, 2015) [10]. We recorded cine loops and images to reduce exposure time and enable subsequent remote analysis. Analysis of cine loops and images was conducted by two operators blinded to the clinical data.
All medical personnel were provided with protective equipment during the study in accordance with WHO standards [11] and the statement of protection [12]. To avoid possible virus transmission, ultrasonography was performed only on patients with confirmed COVID-19 infection. The ultrasound machine was cleaned as recommended after each patient [13,14].
LV diastolic function was assessed by measuring peak E velocity, calculation E/A, and additional parameters (E/e′, peak velocity of tricuspid regurgitation (TR), and maximum LA Vol (i)) [15]. Transmitral flow was assessed by pulse-wave (PW) Doppler with measuring the peak E velocity and calculation E/A ratio. Additional parameters were required in the case of an E/A ratio of ≤0.8, along with a peak E velocity of >50 cm/s, or if the E/A ratio was within the range of 0.8 to 2.0. PW tissue Doppler imaging (TDI) was used to estimate the averaged early diastolic velocity of the mitral annulus movement (e′), which was determined at the position of the septal and lateral parts of the mitral valve.
Several parameters were assessed to analyze the RV contractile function. We used an apical modified RV view for tracing the RV diastolic and systolic areas. The change of the RV fractional area (RV FAC) was calculated according to the formula:
RV FAC (%) = (RV EDA − RV ESA)/RV EDA × 100%,
where RV EDA is the end-diastolic area of RV and RV ESA is the end-systolic area of RV. The tricuspid annular plane systolic excursion (TAPSE) was determined in M-mode. The tricuspid annulus velocity (S′) was assessed by PW Doppler. To analyze the longitudinal deformation of the RV free wall—RV FW LS 2D STE (speckle-tracking echocardiography)—we used an apical modified RV view at a frame rate of >60 frames/s. The region of interest was selected with the subsequent correction of RV wall thickness. RV FW LS was expressed as an absolute value [10].
The flow of tricuspid regurgitation (TR) was assessed by color Doppler mapping, as well as by the jet density and contour characteristics in continuous-wave mode. The severity of the TR was ranged according to its significance: mild, moderate, or severe. The sPAP was determined by the peak velocity of the TR jet using Bernoulli’s equation and adding the right atrial (RA) pressure value [16]. The mean pulmonary artery pressure (meanPAP) was estimated by using the maximal pulmonary regurgitation diastolic peak velocity [17] with added RA pressure. The RA pressure was assessed by measuring the maximum diameter and degree of collapse of the inferior vena cava.

2.3. Reproducibility

An intraclass correlation coefficient (ICC) was used to estimate the variability within a single operator (intra-observer variability), between different operators (inter-observer variability), and at different time points (“test-retest” 2 weeks after the initial analysis). Two observers independently estimated the pre-selected images of 15 random patients.

2.4. Statistical Analysis

All statistical analyses were performed using SPSS Statistics v.26 software (IBM Corporation). Continuous variables were presented as median and IQR values. Categorical variables were summarized using frequencies and percentages. The Mann–Whitney U test and chi-squared test were used to compare the two groups.
Simple logistic regression was used to assess the effect of each predictor on mortality. Next, a set of predictors based on the simple logistic regression Wald statistics was selected for further analysis in multiple logistic regression. The prognostic value of the multiple model was evaluated using ROC analysis.
Differences were considered statistically significant for p-values of <0.05.

3. Results

Hospital mortality among patients included in the study was 15.5% (n = 17). Patients in the non-survivors group were older (72 years [IQR: 60; 82] vs. 62 years [IQR: 50; 73]), had higher NEWS scores (7 [IQR: 6; 8] vs. 6 [IQR: 5; 7]), and a lower SpO2 on admission (90% [IQR: 86; 92] vs. 93% [IQR: 92; 93]) (Table 2).
Stroke or transient ischemic attack were the most common anamnestic factors among non-survivors and were reported in 35.3% of patients vs. 8.6% in survivors (p = 0.008). Non-survivors had significantly higher rates of life-threatening conditions, such as developed ARDS (76.5% vs. 1.1%, p < 0.001), systemic inflammatory response (52.9% vs. 5.4%, p < 0.001), and acute heart failure (41.2% vs. 2.2%, p < 0.001).
A statistically significant difference in the level of the following laboratory tests was found in non-survivors: higher level of D-dimer, p = 0.048; lower platelets count, p = 0.004; high level of C-reactive protein, p < 0.001; higher level of lactate dehydrogenase, p < 0.001; and lower lymphocytes count, p = 0.004.
Chest CT scans confirmed a higher volume of lung injury in non-survivor patients (80% [IQR: 64; 92] vs. 36% [IQR: 28; 48]). Invasive mechanical ventilation was used in all patients in the non-survivors group. Transfer to extracorporeal membrane oxygenation (ECMO) for severe respiratory failure only occurred in the non-survivors group. Efferent methods of detoxification were used more frequently in the group of non-survivors (17.6% vs. 2.2%, p = 0.026).
The median time from onset to admission did not differ between the groups. Depending on baseline severity and respiratory support, non-survivors patients were more frequently admitted to the ICU (5.4% vs. 35%), were more frequently transferred to the ICU (10.8% vs. 64%), and had increased ICU lengths of stay (p < 0.001).

3.1. Echocardiographic Analysis

TTE parameters estimation in comparative analysis in the non-survivors group presented an increase in the dimensional and volumetric parameters of the right atrium (RA), RV dilatation at basal level (42 mm vs. 39 mm, p = 0.004), deterioration of RV contractile function (RV FAC: 49.0% vs. 53.4%, p = 0.007; TAPSE: 16 mm vs. 20 mm, p < 0.001; S wave: 12 cm/s vs. 13 cm/s, p = 0.016; RV FW LS: 15.2% vs. 22.3%, p = 0.006), increased pulmonary pressure (sPAP: 47 mm Hg vs. 35 mm Hg, p < 0.001; meanPAP: 23 mm Hg vs. 15 mm Hg, p < 0.001), and the prevalence of moderate or severe TR (Table 3). meanPAP was not determined in 39% of patients due to imaging limitations.

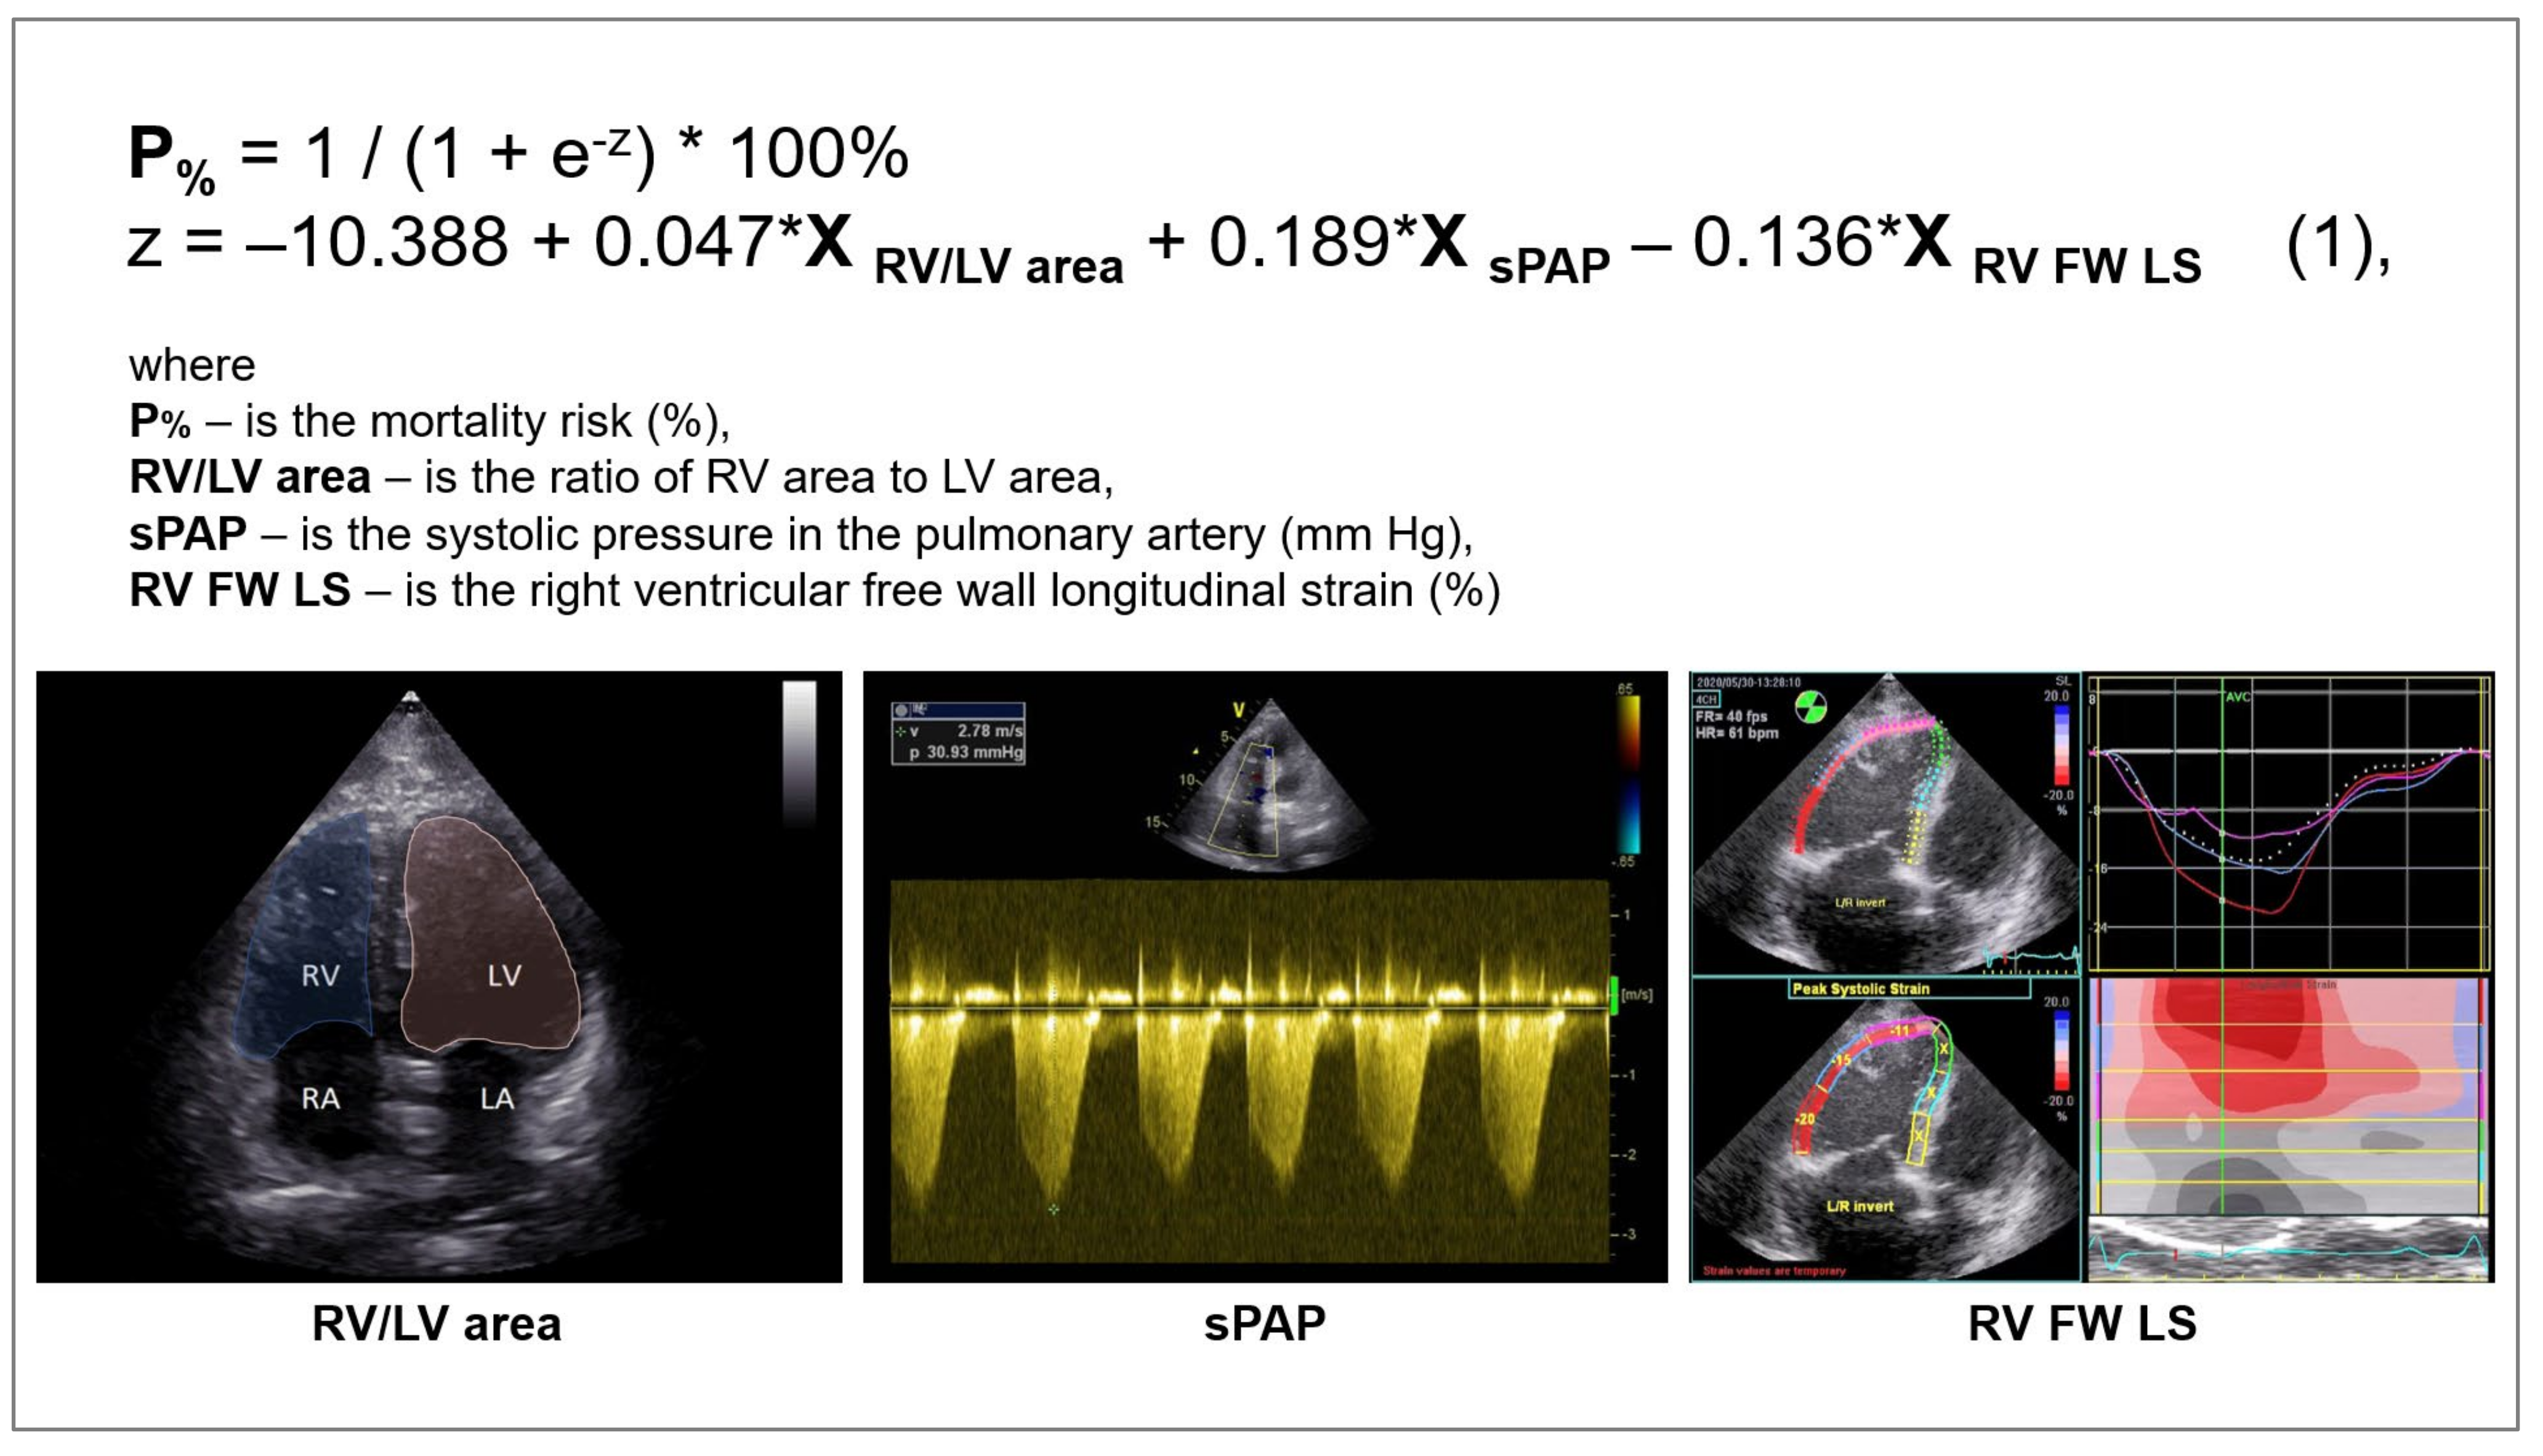
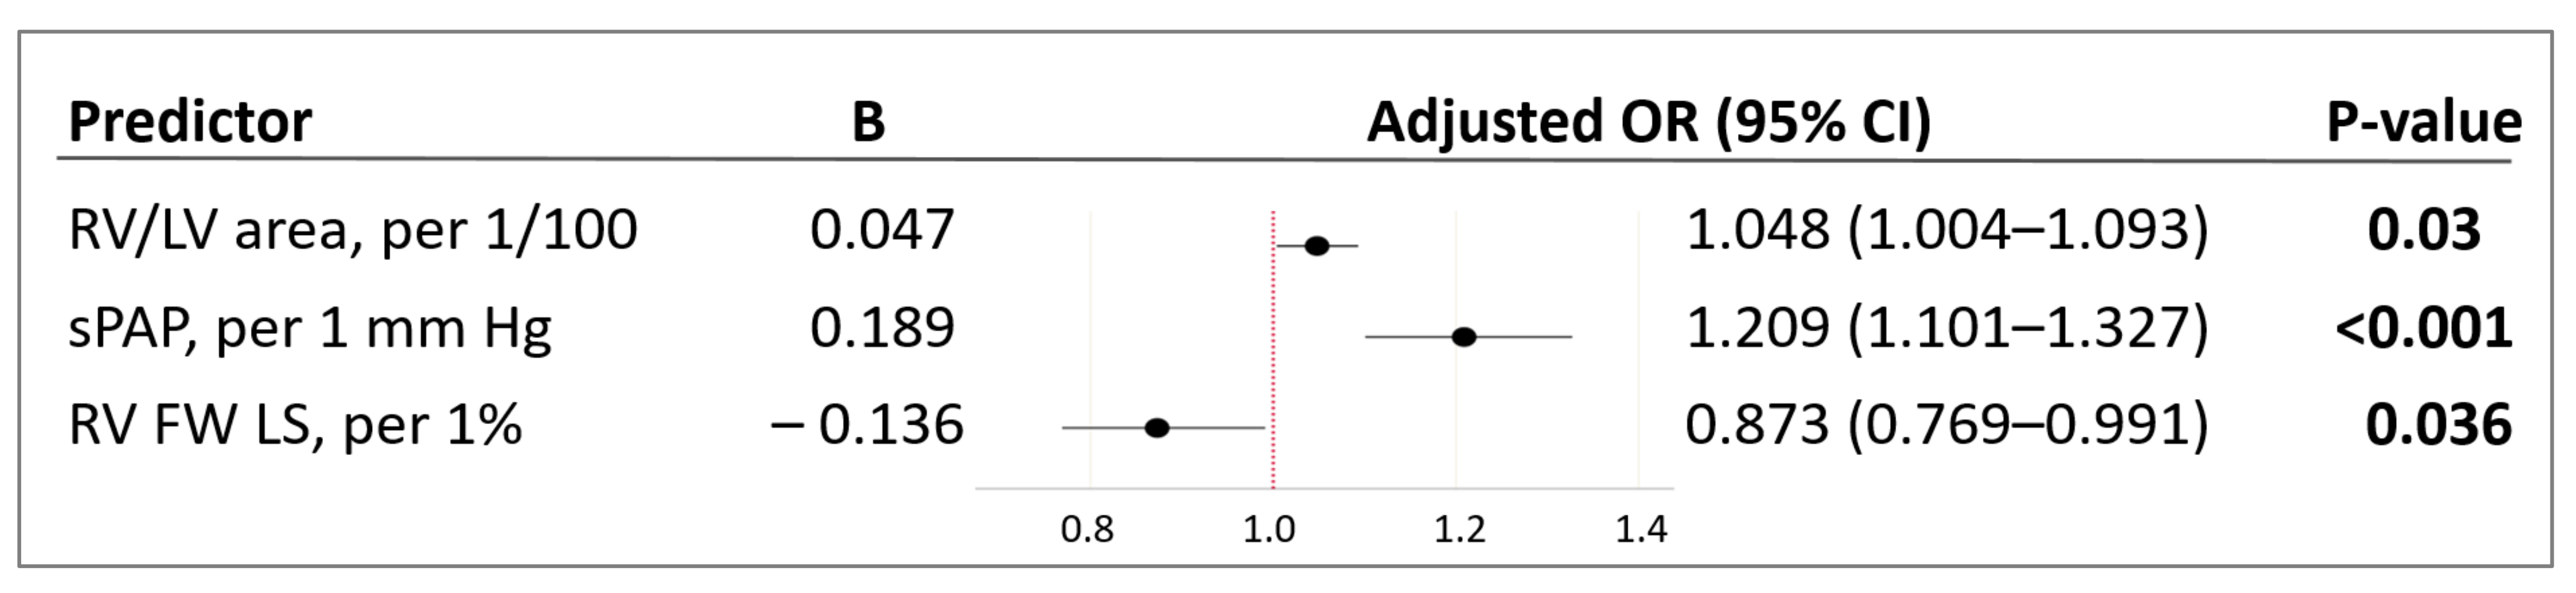
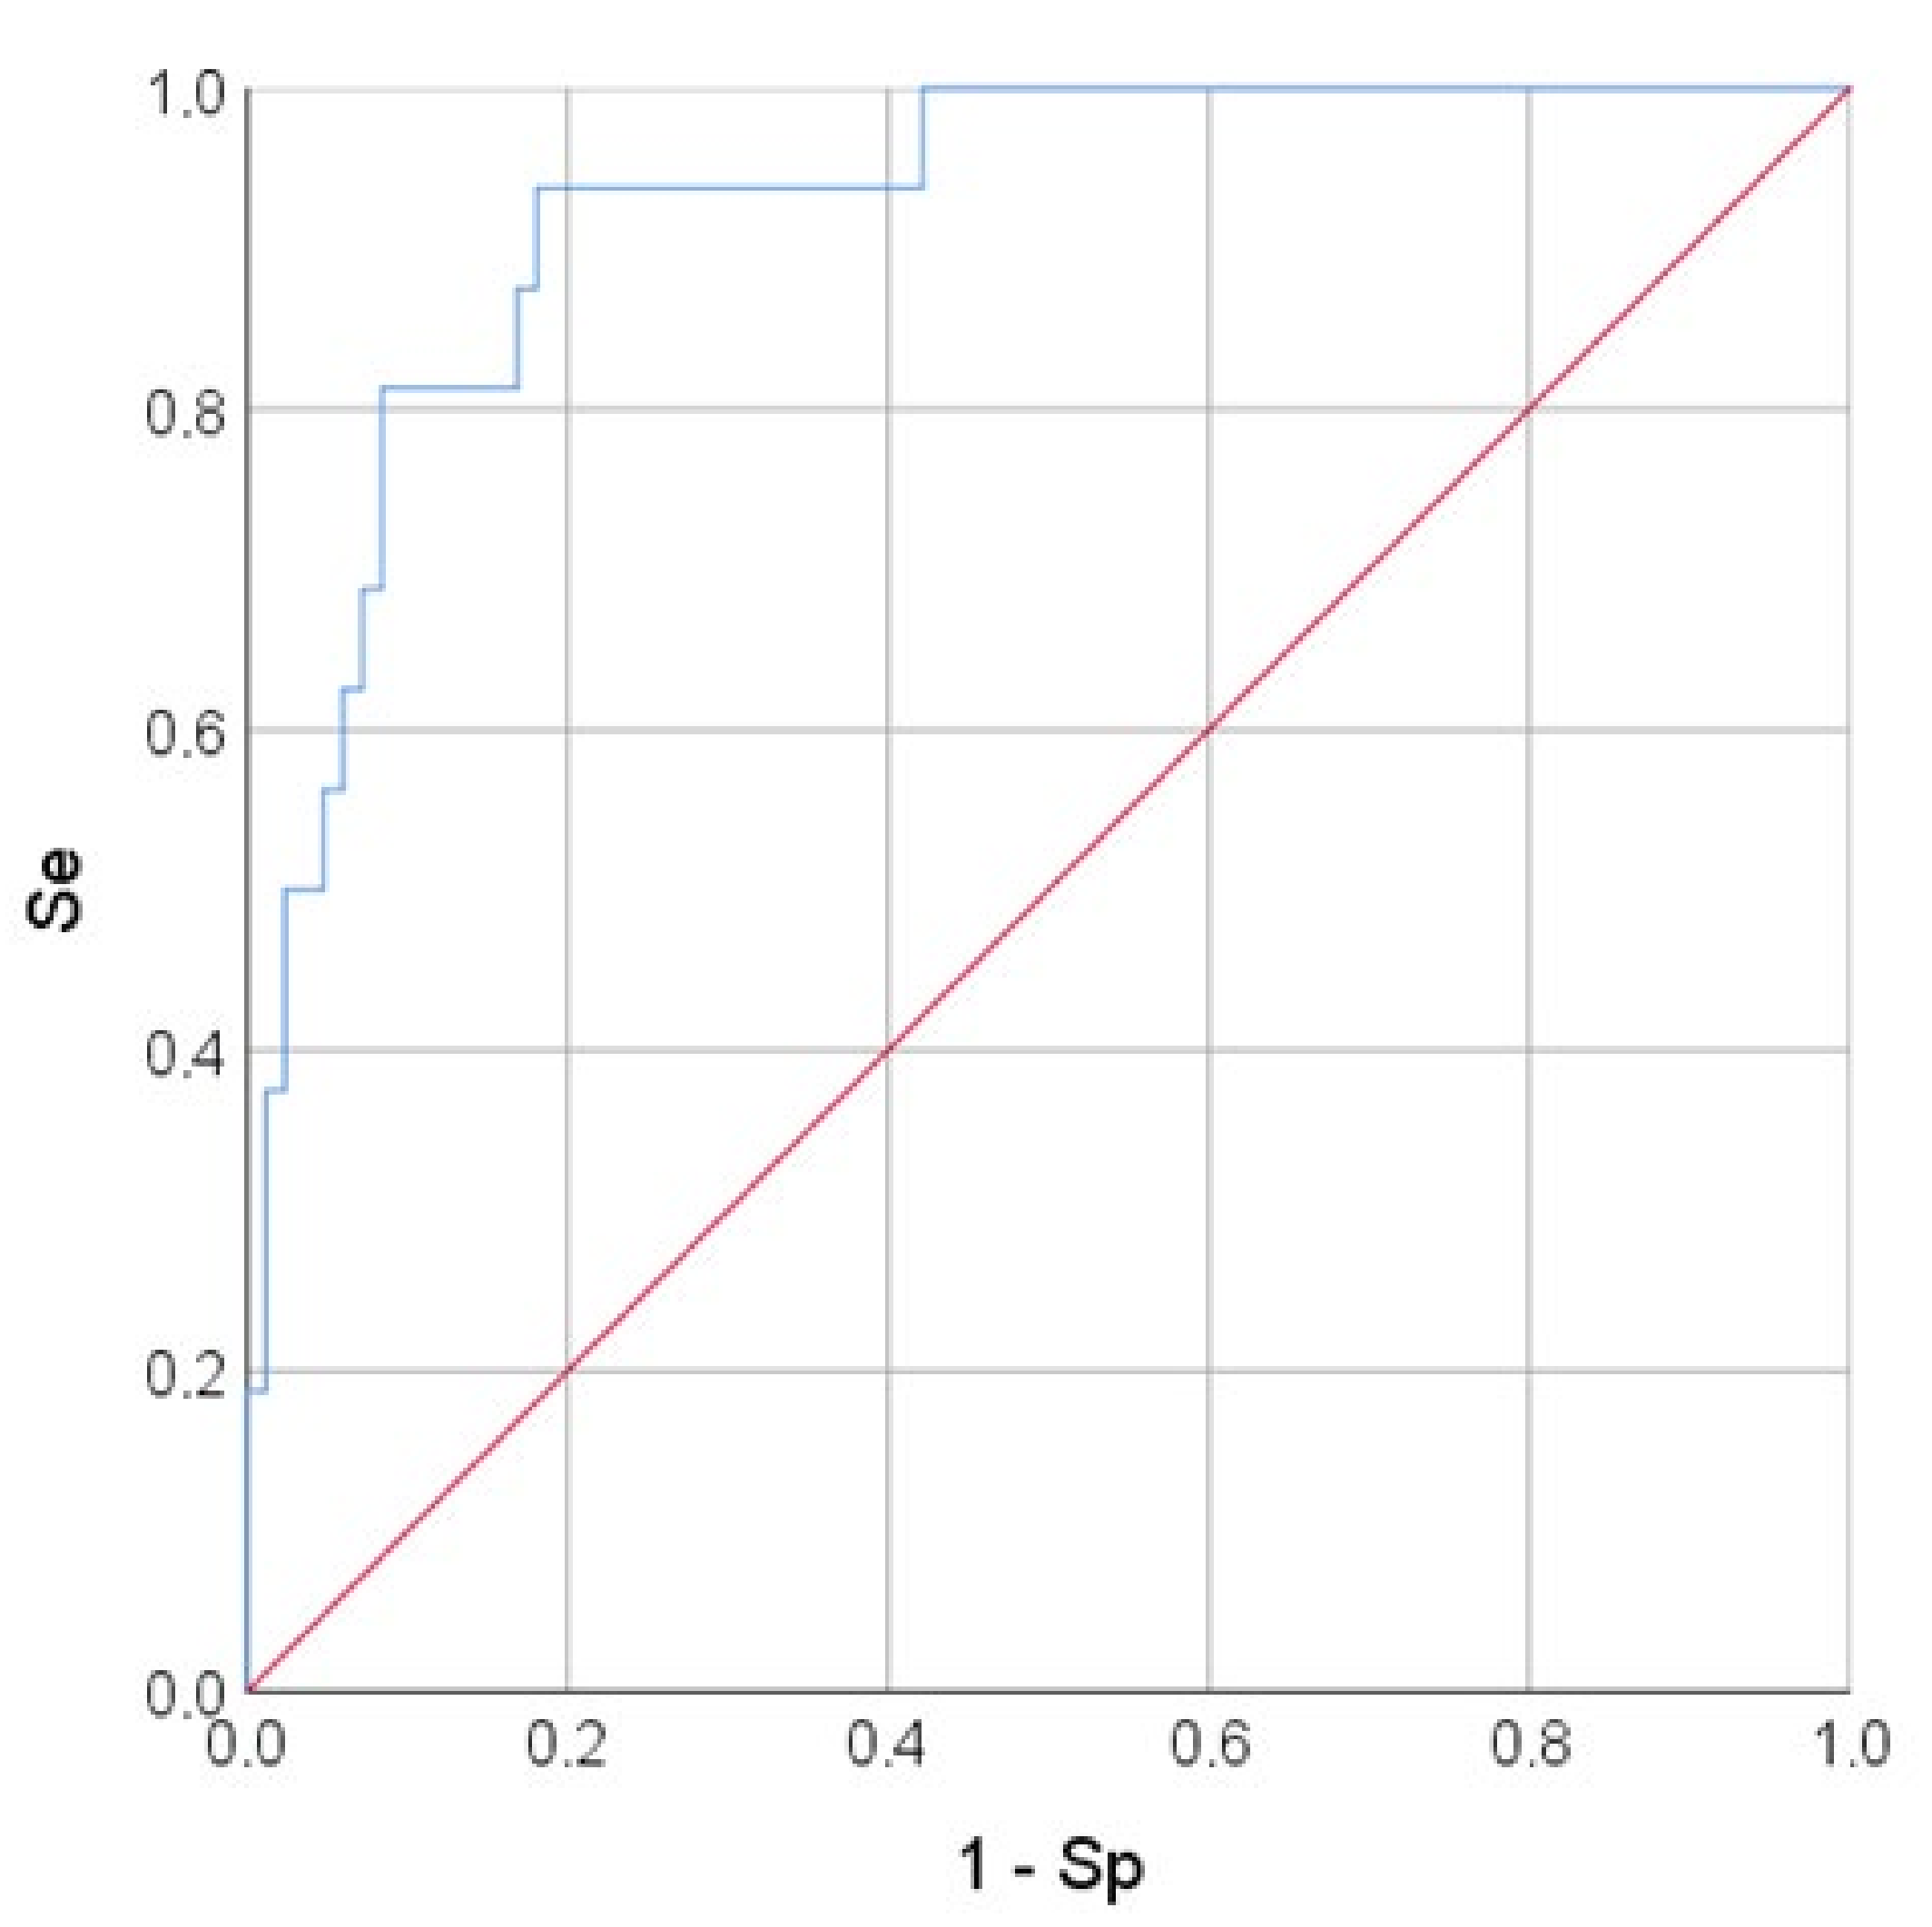
3.2. Logistic Regression Analysis and Prognostic Model Quality Assessment

The impact of various predictors of cardiac status according to TTE data on mortality risk in patients with COVID-19 was assessed by binary logistic regression. The results of the univariate analysis are presented in Table 4.
Further, the predictors were combined in a multivariable model to predict the mortality risk in a patient with COVID-19 based on TTE parameters of the right heart. Using binary logistic regression with factor selection by exclusion, significant factors were identified, and the following model was obtained, which showed statistical significance (p < 0.001) (Figure 1 and Figure 2).
The variables RV/LV area and sPAP had a positive correlation with the mortality risk with OR = 1.048 per 1/100 increase in RV/LV area and OR = 1.209 per 1 mm Hg increase in sPAP. The longitudinal strain of the RV free wall had a negative correlation with the mortality risk (protective effect) with OR = 0.873 per 1% increase in RV FW LS. The threshold value of the logistic function p% was determined using the method of ROC-curve analysis. The resulting curve is shown in Figure 3.

3.3. Assessment of Reproducibility

The variability of the test-retest, which includes intra-server and inter-server comparisons, is presented in Table 5.

4. Discussion

COVID-19 is not only a respiratory disease, but also a multisystem disease, and the combination of pulmonary and extrapulmonary symptoms is typically found in patients with severe COVID-19 [18]. A number of studies [19,20] have shown that COVID-19 significantly increases the risk of mortality because it causes a complex of interrelated disorders, worsening the course of cardiovascular diseases or provoking their occurrence.
The high level of comorbidity in the current study may reflect the age group of the patients. The median age of surviving patients was 62 years [IQR: 50; 73], and the age category of non-survivors was over 72 years [IQR: 60; 82] (p = 0.046). Older age has been reported previously as a risk factor for increased mortality in COVID-19 patients [21,22,23]. Patients in this age group had severe pneumonia, especially those with high blood pressure, coronary artery disease, and/or diabetes [24]. ARDS and other pulmonary complications, as well as multiple organ damage, are among the health problems reported in such patients [25].
In our study, hypertension was the most frequent anamnestic factor in both groups (71.0% in the survivors and 88.2% in the non-survivors). In addition to hypertension, diabetes mellitus, cancer, stroke or transient ischemic attack, and COPD dominated in the structure of comorbid pathology. However, statistical differences have been found only for a history of neurological disorders (stroke or transient ischemic attack). Prehospital neurological disorders were previously shown as predictors of high risk of adverse outcome [26]. The exacerbation of neurological symptoms in patients with COVID-19 may be due to the direct cytotoxic effect of the virus on the central nervous system, as well as mediated through thromboembolic and hypoxic damage, which causes cerebral edema [18].
Moreover, it has been shown in studies that cardiac rhythm disturbances occurring in COVID-19 may be due to presence of electrolyte and systemic hemodynamic disorders [27]. We found an increased incidence of atrial fibrillation in non-survivor patients with COVID-19 (p = 0.033). This is consistent with the results of the study conducted by Wang et al. [24], where 44% of patients with severe COVID-19 had arrhythmia.
According to Zaim et al. [19], an unfavorable COVID-19 prognosis mainly depends on the type of multiple organ failure. Analysis of the structure of multiple organ failure in our study showed that the main complications worsening the condition of patients with COVID-19 were acute respiratory distress syndrome, acute heart failure, and renal failure. These disorders exacerbated the severity of the systemic inflammatory response (increased C-reactive protein, p < 0.001) and hemostasis disorders (increased D-dimer, p = 0.048), which were also associated with an unfavorable prognosis.
Lung injury in COVID-19 patients can contribute to the imbalance of the ventilation–perfusion ratio, which, in turn, can cause a reduction in functional residual gas volume, leading to increased pulmonary vascular resistance and the development of right heart failure [28]. According to CT findings, the volume of lung injury was significantly greater in non-survivor patients (80% [IQR: 64; 92] vs. 36% [IQR: 28; 48], p < 0.001).
Transthoracic echocardiography is important for the clinical assessment of patients with COVID-19, particularly those with moderate or severe disease, and it is necessary for monitoring patients with multiple areas of lung tissue consolidation in ARDS [29]. Analysis of RV size, geometry, and function is an important component of cardiac assessment and contributes to clinical decision making in patients with cardiorespiratory failure [30].
Reservoir function of the right heart compensates increasing afterload by dilatation of both the RV and the RA. Regarding TTE findings, non-survivor patients had greater RV dilatation (basal RV diameter of 42 mm [IQR: 40; 48] vs. 39 mm [IQR: 37; 43] in survivor patients). Several authors have shown that RV dilatation in patients with COVID-19 was detected more frequently than systolic dysfunction, and adverse events were more common in these patients [31,32]. The increase of pulmonary vascular resistance is accompanied by RV dilatation and an increase of both the RV area and RV to LV area ratio. Although the RV/LV area values did not differ between groups (p = 0.228), this parameter demonstrated prognostic significance in the univariate analysis (p < 0.01) and in the multivariable model (p < 0.03).
Pagnesi et al. [32] assessed the prognostic value of pulmonary hypertension (PH) and RV dysfunction in hospitalized patients with COVID-19 infection (n = 200). According to the results of this study, PH was associated with severity of COVID-19 and with worse outcomes (all-cause mortality 33.3% vs. 6.3%, p < 0.001). PH may serve as a better predictor of cardiopulmonary changes in COVID-19 patients than RV dysfunction [32]. However, the subsequent increase in PH will be associated with decreased RV contractility due to the limited ability to adapt to the overload.
Our study revealed decreased systolic function in non-survivors, namely RV FAC (49.0% [IQR: 42.5; 53.1] in the non-survivors group vs. 53.4% [IQR: 46.4; 60.2] in the survivors group, p = 0.007), TAPSE (16 mm [IQR: 16; 19] vs. 20 mm [IQR: 19; 22], p < 0.001), tricuspid annular S wave (12 cm/s [IQR: 9; 13] vs.13 cm/s [IQR: 12; 15], p = 0.016), and RV FW LS (15.2% [IQR: 11.7; 18.3] vs. 22.3% [IQR: 17.7; 26.2], p = 0.006). Despite the significantly lower values of RV FAC in the non-survivors group, they were higher than the reference ones [10]. Bleakley et al. [33] showed that RV FAC can be used to identify patients with RV impairment and hypothesized that radial dysfunction and not longitudinal dysfunction is a dominant phenotype; however, this study was conducted in critically ill patients (VV ECMO proportion of 42.2%).
We found the association of TAPSE with mortality with OR = 0.572, 95% CI (0.429–0.764) (p < 0.001). In the meta-analysis by Martha et al. [34] the prognostic value of TAPSE in patients with COVID-19 has been shown, despite the fact that the decrease of this parameter in most studies exceeded the recommended value for the diagnosis of RV dysfunction [10]. This may be due to a number of limitations, such as dependence on scan angle, loading conditions, or overestimation of TAPSE in tricuspid regurgitation. In addition, this parameter reflects RV contractility mainly at the basal level. We noted a decrease of TAPSE usually in critical patients, but even among them, TAPSE values exceeded threshold values.
However, the use of conventional echocardiographic parameters has a limited value because of the complex shape of the RV [35,36]. It has been shown [36,37,38] that RV deformation analysis (STE) has a good predictive value as it has a higher sensitivity compared to the visual evaluation, and it can increase the predictive ability of conventional echocardiography even in presence of TR [39]. STE has been proposed for assessment of RV function due to an angle independency that leads to the increased precision in the RV dysfunction detection [10,35]. The independence of RV FW LS prognostic values from LV global systolic function in COVID-19 patients is one of the main advantages of this measure [36].
An important part of this study was the identification of adverse outcome predictors based on TTE data. The univariate analysis was performed by risk modelling (binary logistic regression) (Table 5). The identification of TTE risk factors for adverse outcome resulted in the construction of a multivariable prognostic model (1) (p < 0.001) for mortality risk prediction in patients with moderate to severe COVID-19. It included two risk factors for mortality: the sPAP and RV/LV area, and the preventive one (RV FW LS (2D STE)) (Figure 2).
Right ventricular abnormalities such as dilatation [40] and evidence of systolic dysfunction [36] have been reported as prognostic factors for adverse outcomes in patients with COVID-19. Dilation and systolic function alterations are most commonly associated with an increase in systolic pulmonary pressure [8]. We assume that the RV function changes may have a high predictive value in COVID-19, and a decrease in the ability of the RV to contract against increasing afterload leads to the development of disadaptation processes.

5. Limitations

The main limitation of this study is that it is a single-center study with a limited sample size. The significant heterogeneity of the data is due to large differences in populations, their ethnicity, and the lack of reference testing protocols. This work highlights the need for randomized controlled trials to confirm the results of the current study.
In addition, this study was limited to patients with moderate and severe COVID-19; patients with mild COVID-19 did not undergo TTE.
Finally, it is not possible to identify all the causes and pathogenetic mechanisms of cardiac pathology; therefore, the ability to predict the effect of COVID-19 on the occurrence, course, and prognosis of cardiovascular pathology is limited.

6. Conclusions

Patients with cardiovascular disease and COVID-19 have an increased risk of mortality and adverse outcomes. The ability to predict such outcomes may be a useful tool in disease management.
In our study, we showed that TTE protocol should be focused on the assessment of right heart size, RV contractile function, and pulmonary pressure as the most sensitive parameters of RV afterload and indirect markers of lung injury severity. The developed multivariable model incorporates parameters from standard and contemporary echocardiography and can be recommended for predicting the risk of adverse outcomes in patients with COVID-19.

Author Contributions

Conceptualization, E.Z.G. and I.V.S.; data curation, I.V.S., M.L.M., D.I.M., M.N.A. and I.V.V.; formal analysis, D.I.M.; investigation, I.V.S. and M.L.M.; methodology, E.Z.G., D.I.M., M.N.A. and M.M.R.; project administration, E.Z.G., M.M.R. and I.V.V.; visualization, I.V.S. and M.L.M.; writing—original draft, I.V.S.; writing—review and editing, E.Z.G., I.V.S., M.L.M., D.I.M., M.N.A., M.M.R. and I.V.V. All authors have read and agreed to the published version of the manuscript.

Funding

This research received no external funding.

Institutional Review Board Statement

The study was conducted in accordance with the Declaration of Helsinki and approved by the Ethics Committee of the A.N. Bakulev National Medical Research Center for Cardiovascular Surgery, Ministry of Health of the Russian Federation (protocol code 3 and date of approval: 25 November 2021).

Informed Consent Statement

Not applicable.

Conflicts of Interest

The authors declare no conflict of interest.

Abbreviations

TTE transthoracic echocardiography
AUC area under the curve
ROC receiver operating characteristic
RV right ventricle
LV left ventricle
OR odds ratio
sPAP systolic pulmonary artery pressure
RV FW LS right ventricle free wall longitudinal strain
95% CI 95% confidence interval
Se sensitivity
Sp specificity
ARDS acute respiratory distress syndrome
CT computed tomography
IQR interquartile range
ICU intensive care unit
COPD chronic obstructive pulmonary disease
ASE American Society of Echocardiography
EACVI European Association of Cardiovascular Imaging
WHO World Health Organization
TR tricuspid regurgitation
LA left atrium
Vol volume
TDI tissue Doppler imaging
FAC fractional area change
EDA end-diastolic area
ESA end-systolic area
TAPSE tricuspid annular plane systolic excursion
2D STE two-dimensional speckle-tracking echocardiography
PW pulse-wave
RA right atrium
MeanPAP mean pulmonary artery pressure
BSA body surface area
NEWS patient severity rating scale
SpO2 blood oxygen saturation
EDI end-diastolic volume index
ESI end-systolic volume index
SI stroke index
EF ejection fraction
CI cardiac index
ICC intra-class correlation coefficient
AIRVO humidifier with integrated air flow generator
VV ECMO veno-venous extracorporeal membrane oxygenation
PA pulmonary artery
PH pulmonary hypertension
95% CI 95% confidence interval

References

  1. Capotosto, L.; Nguyen, B.L.; Ciardi, M.R.; Mastroianni, C.; Vitarelli, A. Heart, COVID-19, and echocardiography. Echocardiography 2020, 37, 1454–1464. [Google Scholar] [CrossRef] [PubMed]
  2. Gómez-Mesa, J.E.; Galindo-Coral, S.; Montes, M.C.; Muñoz Martin, A.J. Thrombosis and Coagulopathy in COVID-19. Curr. Probl. Cardiol. 2021, 46, 100742. [Google Scholar] [CrossRef] [PubMed]
  3. Bourgonje, A.R.; Abdulle, A.E.; Timens, W.; Hillebrands, J.L.; Navis, G.J.; Gordijn, S.J.; Bolling, M.C.; Dijkstra, G.; Voors, A.A.; Osterhaus, A.D.; et al. Angiotensin-converting enzyme 2 (ACE2), SARS-CoV-2 and the pathophysiology of coronavirus disease 2019 (COVID-19). J. Pathol. 2020, 251, 228–248. [Google Scholar] [CrossRef] [PubMed]
  4. Clerkin, K.J.; Fried, J.A.; Raikhelkar, J.; Sayer, G.; Griffin, J.M.; Masoumi, A.; Jain, S.S.; Burkhoff, D.; Kumaraiah, D.; Rabbani, L.R.; et al. COVID-19 and Cardiovascular Disease. Circulation 2020, 141, 1648–1655. [Google Scholar] [CrossRef] [Green Version]
  5. Xu, Z.; Shi, L.; Wang, Y.; Zhang, J.; Huang, L.; Zhang, C.; Liu, S.; Zhao, P.; Liu, H.; Zhu, L.; et al. Pathological findings of COVID-19 associated with acute respiratory distress. Lancet Respir. Med. 2020, 8, 420–422. [Google Scholar] [CrossRef]
  6. Wu, C.; Chen, X.; Cai, Y.; Xia, J.; Zhou, X.; Xu, S.; Huang, H.; Zhang, L.; Zhou, X.; Du, C.; et al. Risk Factors Associated With Acute Respiratory Distress Syndrome and Death in Patients With Coronavirus Disease 2019 Pneumonia in Wuhan, China. JAMA Intern. Med. 2020, 180, 934–943. [Google Scholar] [CrossRef] [Green Version]
  7. Inciardi, R.M.; Adamo, M.; Lupi, L.; Cani, D.S.; Di Pasquale, M.; Tomasoni, D.; Italia, L.; Zaccone, G.; Tedino, C.; Fabbricatore, D.; et al. Characteristics and outcomes of patients hospitalized for COVID-19 and cardiac disease in Northern Italy. Eur. Heart J. 2020, 41, 1821–1829. [Google Scholar] [CrossRef]
  8. Lairez, O.; Blanchard, V.; Houard, V.; Vardon-Bounes, F.; Lemasle, M.; Cariou, E.; Lavie-Badie, Y.; Ruiz, S.; Cazalbou, S.; Delmas, C.; et al. Cardiac imaging phenotype in patients with coronavirus disease 2019 (COVID-19): Results of the cocarde study. Int. J. Cardiovasc. Imaging 2021, 37, 449–457. [Google Scholar] [CrossRef]
  9. Chu, D.K.; Akl, E.A.; Duda, S.; Solo, K.; Yaacoub, S.; Schünemann, H.J.; El-harakeh, A.; Bognanni, A.; Lotfi, T.; Loeb, M.; et al. Physical distancing, face masks, and eye protection to prevent person-to-person transmission of SARS-CoV-2 and COVID-19: A systematic review and meta-analysis. Lancet 2020, 395, 1973–1987. [Google Scholar] [CrossRef]
  10. Lang, R.M.; Badano, L.P.; Mor-Avi, V.; Afilalo, J.; Armstrong, A.; Ernande, L.; Flachskampf, F.A.; Foster, E.; Goldstein, S.A.; Kuznetsova, T.; et al. Recommendations for cardiac chamber quantification by echocardiography in adults: An update from the American Society of Echocardiography and the European Association of Cardiovascular Imaging. Eur. Heart J. Cardiovasc. Imaging 2015, 16, 233–270. [Google Scholar] [CrossRef]
  11. McFee, R. COVID-19 medical management including World Health Organization (WHO) suggested management strategies. Dis. Mon. 2020, 66, 101068. [Google Scholar] [CrossRef] [PubMed]
  12. Kirkpatrick, J.N.; Mitchell, C.; Taub, C.; Kort, S.; Hung, J.; Swaminathan, M. ASE Statement on Protection of Patients and Echocardiography Service Providers During the 2019 Novel Coronavirus Outbreak: Endorsed by the American College of Cardiology. J. Am. Soc. Echocardiogr. 2020, 33, 648–653. [Google Scholar] [CrossRef] [PubMed]
  13. World Federation for Ultrasound in Medicine and Biology Safety Committee; Abramowicz, J.S.; Basseal, J.M. World Federation for Ultrasound in Medicine and Biology Position Statement: How to Perform a Safe Ultrasound Examination and Clean Equipment in the Context of COVID-19. Ultrasound Med. Biol. 2020, 46, 1821–1826. [Google Scholar] [CrossRef] [PubMed]
  14. Mitchell, C.; Collins, K.; Hua, L.; McClanahan, C.; Shea, E.; Umland, M.; Wasserman, M. Specific Considerations for Sonographers When Performing Echocardiography during the 2019 Novel Coronavirus Outbreak: Supplement to the American Society of Echocardiography Statement. J. Am. Soc. Echocardiogr. 2020, 33, 654–657. [Google Scholar] [CrossRef] [PubMed]
  15. Nagueh, S.F.; Smiseth, O.A.; Appleton, C.P.; Byrd, B.F.; Dokainish, H.; Edvardsen, T.; Flachskampf, F.A.; Gillebert, T.C.; Klein, A.L.; Lancellotti, P.; et al. Recommendations for the Evaluation of Left Ventricular Diastolic Function by Echocardiography: An Update from the American Society of Echocardiography and the European Association of Cardiovascular Imaging. J. Am. Soc. Echocardiogr. 2016, 29, 277–314. [Google Scholar] [CrossRef] [Green Version]
  16. Rudski, L.G.; Lai, W.W.; Afilalo, J.; Hua, L.; Handschumacher, M.D.; Chandrasekaran, K.; Solomon, S.D.; Louie, E.K.; Schiller, N.B. Guidelines for the echocardiographic assessment of the right heart in adults: A report from the American Society of Echocardiography endorsed by the European Association of Echocardiography, a registered branch of the European Society of Cardiology, and the Canadian Society of Echocardiography. J. Am. Soc. Echocardiogr. 2010, 23, 685–788. [Google Scholar] [CrossRef]
  17. Abbas, A.E.; Fortuin, F.D.; Schiller, N.B.; Appleton, C.P.; Moreno, C.A.; Lester, S.J. Echocardiographic determination of mean pulmonary artery pressure. Am. J. Cardiol. 2003, 92, 1373–1376. [Google Scholar] [CrossRef]
  18. Elrobaa, I.H.; New, K.J. COVID-19: Pulmonary and Extra Pulmonary Manifestations. Front. Public Health 2021, 9, 711616. [Google Scholar] [CrossRef]
  19. Zaim, S.; Chong, J.H.; Sankaranarayanan, V.; Harky, A. COVID-19 and Multiorgan Response. Curr. Probl. Cardiol. 2020, 45, 100618. [Google Scholar] [CrossRef]
  20. Huang, D.; Yang, H.; Yu, H.; Wang, T.; Yao, R.; Liang, Z. A novel risk score to predict cardiovascular complications in patients with coronavirus disease 2019 (COVID-19): A retrospective, multicenter, observational study. Immun. Inflamm. Dis. 2020, 8, 638–649. [Google Scholar] [CrossRef]
  21. Huang, C.; Wang, Y.; Li, X.; Ren, L.; Zhao, J.; Hu, Y.; Zhang, L.; Fan, G.; Xu, J.; Gu, X.; et al. Clinical features of patients infected with 2019 novel coronavirus in Wuhan, China. Lancet 2020, 395, 497–506. [Google Scholar] [CrossRef] [Green Version]
  22. Zhao, M.; Wang, M.; Zhang, J.; Gu, J.; Zhang, P.; Xu, Y.; Ye, J.; Wang, Z.; Ye, D.; Pan, W.; et al. Comparison of clinical characteristics and outcomes of patients with coronavirus disease 2019 at different ages. Aging 2020, 12, 10070–10086. [Google Scholar] [CrossRef] [PubMed]
  23. Chen, Y.; Li, L. SARS-CoV-2: Virus dynamics and host response. Lancet Infect. Dis. 2020, 20, 515–516. [Google Scholar] [CrossRef] [Green Version]
  24. Wang, D.; Hu, B.; Hu, C.; Zhu, F.; Liu, X.; Zhang, J.; Wang, B.; Xiang, H.; Cheng, Z.; Xiong, Y.; et al. Clinical Characteristics of 138 Hospitalized Patients With 2019 Novel Coronavirus-Infected Pneumonia in Wuhan, China. JAMA 2020, 323, 1061–1069. [Google Scholar] [CrossRef] [PubMed]
  25. Zhou, F.; Yu, T.; Du, R.; Fan, G.; Liu, Y.; Liu, Z.; Xiang, J.; Wang, Y.; Song, B.; Gu, X.; et al. Clinical course and risk factors for mortality of adult inpatients with COVID-19 in Wuhan, China: A retrospective cohort study. Lancet 2020, 395, 1054–1062. [Google Scholar] [CrossRef]
  26. Koennecke, H.-C.; Belz, W.; Berfelde, D.; Endres, M.; Fitzek, S.; Hamilton, F.; Kreitsch, P.; Mackert, B.M.; Nabavi, D.G.; Nolte, C.; et al. Factors influencing in-hospital mortality and morbidity in patients treated on a stroke unit. Neurology 2011, 77, 965–972. [Google Scholar] [CrossRef] [PubMed]
  27. Bhatla, A.; Mayer, M.M.; Adusumalli, S.; Hyman, M.C.; Oh, E.; Tierney, A.; Moss, J.; Chahal, A.A.; Anesi, G.; Denduluri, S.; et al. COVID-19 and cardiac arrhythmias. Heart Rhythm. 2020, 17, 1439–1444. [Google Scholar] [CrossRef]
  28. Tajbakhsh, A.; Gheibi Hayat, S.M.; Taghizadeh, H.; Akbari, A.; Inabadi, M.; Savardashtaki, A.; Johnston, T.P.; Sahebkar, A. COVID-19 and cardiac injury: Clinical manifestations, biomarkers, mechanisms, diagnosis, treatment, and follow up. Expert. Rev. Anti Infect. Ther. 2021, 19, 345–357. [Google Scholar] [CrossRef]
  29. Cresti, A.; Barchitta, A.; Barbieri, A.; Monte, I.P.; Trocino, G.; Ciampi, Q.; Miceli, S.; Petrella, L.; Jaric, E.; Solari, M.; et al. Echocardiography and Multimodality Cardiac Imaging in COVID-19 Patients. J. Cardiovasc. Echogr. 2020, 30 (Suppl. 2), S18–S24. [Google Scholar] [CrossRef]
  30. Cameli, M.; Pastore, M.C.; Aboumarie, H.S.; Mandoli, G.E.; D’Ascenzi, F.; Cameli, P.; Bigio, E.; Franchi, F.; Mondillo, S.; Valente, S. Usefulness of echocardiography to detect cardiac involvement in COVID-19 patients. Echocardiography 2020, 37, 1278–1286. [Google Scholar] [CrossRef]
  31. Kim, J.; Volodarskiy, A.; Sultana, R.; Pollie, M.P.; Yum, B.; Nambiar, L.; Tafreshi, R.; Mitlak, H.W.; RoyChoudhury, A.; Horn, E.M.; et al. Prognostic Utility of Right Ventricular Remodeling Over Conventional Risk Stratification in Patients With COVID-19. J. Am. Coll. Cardiol. 2020, 76, 1965–1977. [Google Scholar] [CrossRef] [PubMed]
  32. Pagnesi, M.; Baldetti, L.; Beneduce, A.; Calvo, F.; Gramegna, M.; Pazzanese, V.; Ingallina, G.; Napolano, A.; Finazzi, R.; Ruggeri, A.; et al. Pulmonary hypertension and right ventricular involvement in hospitalised patients with COVID-19. Heart 2020, 106, 1324–1331. [Google Scholar] [CrossRef] [PubMed]
  33. Bleakley, C.; Singh, S.; Garfield, B.; Morosin, M.; Surkova, E.; Mandalia, M.S.; Dias, B.; Androulakis, E.; Price, L.C.; McCabe, C.; et al. Right ventricular dysfunction in critically ill COVID-19 ARDS. Int. J. Cardiol. 2021, 327, 251–258. [Google Scholar] [CrossRef] [PubMed]
  34. Martha, J.W.; Pranata, R.; Wibowo, A.; Lim, M.A. Tricuspid annular plane systolic excursion (TAPSE) measured by echocardiography and mortality in COVID-19: A systematic review and meta-analysis. Int. J. Infect. Dis. 2021, 105, 351–356. [Google Scholar] [CrossRef] [PubMed]
  35. Carluccio, E.; Biagioli, P.; Alunni, G.; Murrone, A.; Zuchi, C.; Coiro, S.; Riccini, C.; Mengoni, A.; D’Antonio, A.; Ambrosio, G. Prognostic Value of Right Ventricular Dysfunction in Heart Failure With Reduced Ejection Fraction: Superiority of Longitudinal Strain Over Tricuspid Annular Plane Systolic Excursion. Circ. Cardiovasc. Imaging 2018, 11, e006894. [Google Scholar] [CrossRef] [Green Version]
  36. Li, Y.; Li, H.; Zhu, S.; Xie, Y.; Wang, B.; He, L.; Zhang, D.; Zhang, Y.; Yuan, H.; Wu, C.; et al. Prognostic Value of Right Ventricular Longitudinal Strain in Patients With COVID-19. JACC Cardiovasc. Imaging 2020, 13, 2287–2299. [Google Scholar] [CrossRef]
  37. Longobardo, L.; Suma, V.; Jain, R.; Carerj, S.; Zito, C.; Zwicke, D.L.; Khandheria, B.K. Role of Two-Dimensional Speckle-Tracking Echocardiography Strain in the Assessment of Right Ventricular Systolic Function and Comparison with Conventional Parameters. J. Am. Soc. Echocardiogr. 2017, 30, 937–946.e6. [Google Scholar] [CrossRef]
  38. Wibowo, A.; Pranata, R.; Astuti, A.; Tiksnadi, B.B.; Martanto, E.; Martha, J.W.; Purnomowati, A.; Akbar, M.R. Left and right ventricular longitudinal strains are associated with poor outcome in COVID-19: A systematic review and meta-analysis. J. Intensive Care 2021, 9, 9. [Google Scholar] [CrossRef]
  39. Prihadi, E.A.; van der Bijl, P.; Dietz, M.; Abou, R.; Vollema, E.M.; Marsan, N.A.; Delgado, V.; Bax, J.J. Prognostic Implications of Right Ventricular Free Wall Longitudinal Strain in Patients With Significant Functional Tricuspid Regurgitation. Circ. Cardiovasc. Imaging 2019, 12, e008666. [Google Scholar] [CrossRef] [Green Version]
  40. Argulian, E.; Sud, K.; Vogel, B.; Bohra, C.; Garg, V.P.; Talebi, S.; Lerakis, S.; Narula, J. Right Ventricular Dilation in Hospitalized Patients With COVID-19 Infection. JACC Cardiovasc. Imaging 2020, 13, 2459–2461. [Google Scholar] [CrossRef]
Figure 1. Multivariable model for predicting the risk of adverse outcomes in patients with COVID-19 infection.
Pathophysiology 29 00014 g001
Figure 2. Characteristics of predictors included in the model (1). B—value of the coefficient in the equation; OR—odds ratio of mortality; 95% CI—95% confidence interval; RV/LV area—right ventricle to left ventricle area ratio; sPAP—systolic pulmonary artery pressure; RV FW LS (2D STE)—right ventricle free wall longitudinal strain (two-dimensional speckle-tracking echocardiography). Bold indicates significance (p-value of < 0.05).
Pathophysiology 29 00014 g002
Figure 3. ROC-curve. The mortality risk on the values of the logistic function P%. The AUC-ROC was 0.925 ± 0.031 (95% CI: 0.863–0.986). The Se and Sp measures of model (1) at the cut-off point of 0.129 were 93.8% and 81.9%, respectively. The red line is the zero predictive value line (at Se + Sp = 100%), blue line–ROC-curve representing to the sensitivity function of the proportion of misclassified negative outcomes.
Pathophysiology 29 00014 g003
Table 1. Clinical characteristics and TTE characteristics of the overall cohort of patients with COVID-19.
VariablesOverall (n = 110)
Age, years63 [51; 74]
Male63 (57.3%)
BSA, m/m22.01 [1.85; 2.13]
RhythmSinus89 (80.9%)
Atrial fibrillation18 (16.4%)
Pacemaker (without atrial fibrillation)3 (2.7%)
NEWS, scores6 [5; 7]
SpO2 on admission to the COVID-19 hospital, %92 [91; 93]
Comorbidities
Hypertension81 (73.6%)
Diabetes mellitus20 (18.2%)
Cancer18 (16.4%)
Encephalopathy at admission15 (13.6%)
Stroke or transient ischemic attack14 (12.7%)
COPD12 (10.9%)
Bronchial asthma9 (8.2%)
Chronic kidney disease8 (7.3%)
Rheumatoid arthritis3 (2.7%)
Current smoking4 (3.6%)
TTE data
Maximum LA Vol (i), mL/m2 22.3 [19.1; 28.8]
LV EDI, mL/m2 49.6 [43.2; 58.1]
LV ESI, mL/m2 17.1 [14.3; 22.3]
LV SI, mL/m2 2.41 [2.00; 3.25]
LV EF, % 65 [60; 68]
CI, L/min/m22.44 [2.01; 3.20]
E/A1.00 [0.80; 1.28]
E/e′7.72 [6.15; 9.80]
Maximum RA Vol (i), mL/m2 26.2 [19.9; 35.1]
Basal RV diameter, mm 40 [37; 43]
Mid cavitary RV diameter, mm 35 [30; 39]
RV longitudinal dimension, mm 60 [57; 66]
RV/LV area 0.64 [0.55; 0.74]
RV FAC, % 52.4 [45.1; 58.7]
TAPSE, mm 20 [18; 22]
Tricuspid annular S′ wave, cm/s (PW)13 [11; 15]
RV FW LS, % (2D STE)21.7 [16.2; 25.0]
sPAP, mm Hg35 [30; 43]
Abbreviations: BSA—body surface area; NEWS—National Early Warning Score; SpO2—blood oxygen saturation; COPD—chronic obstructive pulmonary disease; LA—left atrium; Vol—volume; LV—left ventricle; EDI—end-diastolic volume index; ESI—end-systolic volume index; SI—stroke index; EF—ejection fraction; CI—cardiac index; RA—right atrium; RV—right ventricle; FAC—fractional area change; TAPSE—tricuspid annular plane systolic excursion; PW—pulse-wave; RV FW LS—right ventricle free wall longitudinal strain; sPAP—systolic pulmonary artery pressure. Data are expressed as number (percentage) or median [interquartile range]) values.
Table 2. Comparison of different parameters depending on survival status.
VariablesSurvivors
(n = 93)
Non-Survivors
(n = 17)
p-Value
Age, years62 [50; 73]72 [60; 82]0.046
Male53 (57.0%)10 (58.8%)1.000
BSA, m/m2 1.99 [1.87; 2.10]2.03 [1.84; 2.18]0.738
Sinus79 (84.9%)10 (58.8%)0.019
Atrial fibrillation12 (12.9%)6 (35.3%)0.033
Pacemaker2 (2.2%)1 (5.9%)0.399
NEWS6 [5; 7]7 [6; 8]0.047
SpO2 on admission to a COVID-19 hospital, %93 [92; 93]90 [86; 92]0.002
Comorbidities
Hypertension66 (71.0%)15 (88.2%)0.230
Diabetes mellitus16 (17.2%)4 (23.5%)0.508
Cancer16 (17.2%)2 (11.8%)0.734
Encephalopathy at admission10 (10.8%)5 (29.4%)0.055
Stroke or transient ischemic attack8 (8.6%)6 (35.3%)0.008
COPD9 (9.7%)3 (17.6%)0.393
Bronchial asthma6 (6.5%)3 (17.6%)0.143
Chronic kidney disease6 (6.5%)2 (11.8%)0.607
Rheumatoid arthritis1 (1.1%)2 (11.8%)0.062
Current smoking4 (4.3%)01.000
Laboratory tests
Monocytes, ×109/L0.49 [0.34; 0.63]0.45 [0.35; 0.63]0.908
Neutrophils, ×109/L4.70 [3.16; 6.63]6.07 [3.42; 8.47]0.270
Lymphocytes, ×109/L1.15 [0.92; 1.54]0.89 [0.60; 1.13]0.011
D-dimer, ng/L572 [342; 859]1614 [385; 3187]0.048
Hemoglobin, g/L140.3 [131.0; 148.1]130.9 [116.1; 142.1]0.088
Erythrocytes, ×1012/L4.83 [4.48; 5.09]4.63 [4.36; 5.06]0.335
White blood cells, ×109/L6.6 [4.9; 9.2]9.5 [4.0; 11.8]0.169
C-reactive protein, mg/L5.5 [2.4; 9.3]76.8 [35.3; 116.2]<0.001
Platelets, ×109/L213.5 [164.2; 260.4]148.8 [119.1; 198.1]0.004
Lactate dehydrogenase, units/L288 [227; 387]422 [298; 665]<0.001
Lung injury and oxygen therapy
Lung tissue injury volume (CT data), %36 [28; 48]80 [64; 92]<0.001
Nasal cannula (O2 up to 15 L/min)81 (87.1%)0<0.001
High-flow nasal oxygen (AIRVO)5 (5.4%)0 1.000
Non-invasive ventilation5 (5.4%)0 1.000
Invasive mechanical ventilation2 (2.2%)17 (100%)<0.001
VV ECMO0 4 (23.5%)<0.001
Efferent therapy methods
Plasmapheresis2 (2.2%)3 (17.6%)0.026
Hemosorption2 (2.2%)3 (17.6%)0.026
Complications
Acute respiratory distress syndrome1 (1.1%)13 (76.5%)<0.001
Systemic inflammatory response syndrome5 (5.4%)9 (52.9%)<0.001
Acute heart failure2 (2.2%)11 (41.2%)<0.001
Venous thrombosis9 (9.7%)2 (11.8%)0.678
Multiple organ dysfunction1 (1.1%)9 (52.9%)<0.001
Acute kidney injury1 (1.1%)4 (23.5%)0.002
Disseminated intravascular coagulation0 4 (23.5%)<0.001
Cerebral edema0 3 (17.6%)0.003
Gastrointestinal bleeding0 1 (5.9%)0.155
Haemorrhagic stroke1 (1.1%)0 1.000
Characteristics of admission and hospital stay
Days from illness onset to hospital admission, days8 [6; 11]9 [6; 10]0.533
ICU admission5 (5.4%)6 (35.3%)0.002
In-hospital transfer to the ICU10 (10.8%)11 (64.7%)<0.001
In-hospital stay, days13 [12; 16]12 [8; 17]0.320
Duration of ICU stay (only ICU patients), days1 [0; 3]9 [7; 13]<0.001
Abbreviations: BSA—body surface area; NEWS—National Early Warning Score; SpO2—blood oxygen saturation; COPD—chronic obstructive pulmonary disease; ICU—intensive care unit; CT—computed tomography; AIRVO—humidifier with integrated air flow generator; VV—veno-venous; ECMO—extracorporeal membrane oxygenation. Data are expressed as number (percentage) or median [interquartile range] values. Bold indicates significance (p-value of <0.05).
Table 3. Echocardiography of patients with COVID-19 infection.
VariablesSurvivors
(n = 93)
Non-Survivors
(n = 17)
p-Value
Minimum LA diameter, mm39 [36; 42]40 [38; 44]0.388
Maximum LA diameter, mm52 [48; 56]60 [52; 61]0.014
Maximum LA Vol (i), ml/m221.6 [19.1; 28.7]25.6 [21.9; 31.0]0.088
LV EDI, mL/m249.3 [43.2; 56.6]51.4 [43.7; 68.3]0.370
LV ESI, mL/m216.7 [14.2; 22.1]18.0 [15.2; 28.7]0.239
LV SI, mL/m231.8 [27.2; 36.8]38.8 [30.2; 41.6]0.404
LV EF, %65.0 [60.0; 69.0]63.0 [58.0; 65.0]0.116
CI, l/min/m22.39 [2.00; 3.09]3.02 [2.19; 3.71]0.171
E/A0.94 [0.79; 1.20]1.40 [1.02; 1.87]0.009
E/e′7.56 [6.00; 9.14]9.87 [8.40; 12.29]0.001
LV septal wall thickness, mm13 [12; 16]15 [13; 17]0.215
Characteristics of the right heart chambers
Minimum RA diameter, mm42 [37; 45]44 [43; 49]0.007
Maximum RA diameter, mm51 [47; 55]56 [51; 61]0.004
Maximum RA Vol (i), mL/m224.7 [19.6; 34.8]32.2 [26.4; 42.5]0.002
Basal RV diameter, mm39 [37; 43]42 [40; 48]0.004
Mid cavitary RV diameter, mm 34 [30; 39]36 [33; 41]0.156
RV longitudinal dimension, mm 60 [57; 66]64 [61; 69]0.119
RV/LV area0.64 [0.55; 0.73]0.70 [0.54; 1.05]0.228
PA trunk diameter, mm25 [23; 27]25 [25; 30]0.396
RV FAC, %53.4 [46.4; 60.2]49.0 [42.5; 53.1]0.007
TAPSE, mm20 [19; 22]16 [16; 19]<0.001
Tricuspid annular S′ wave, cm/s (PW)13 [12; 15]12 [9; 13]0.016
RV FW LS, % (2D STE)22.3 [17.7; 26.2]15.2 [11.7; 18.3]0.006
RV wall thickness (subcostal), mm5 [4; 6]6 [5; 6]0.009
Pulmonary hemodynamic parameters
sPAP, mm Hg35 [28; 39]47 [42; 55]<0.001
meanPAP, mm Hg15 [11; 21]23 [20; 31]<0.001
Inferior vena cava diameter, mm22 [19; 24]23 [20; 24]0.319
TR moderate to severe14 (15.4%)7 (43.7%)0.015
Abbreviations: LA—left atrium; Vol—volume; LV—left ventricle; EDI—end-diastolic volume index; ESI—end-systolic volume index; SI—stroke index; EF—ejection fraction; CI—cardiac index; RA—right atrium; RV—right ventricle; PA—pulmonary artery; FAC—fractional area change; TAPSE—tricuspid annular plane systolic excursion; PW—pulse-wave; RV FW LS—right ventricle free wall longitudinal strain; sPAP—systolic pulmonary artery pressure; meanPAP—mean pulmonary artery pressure; TR—tricuspid regurgitation. Data are expressed as number (percentage) or median [interquartile range] values. Bold indicates significance (p-value of < 0.05).
Table 4. Results of the predictor impact assessment on mortality in patients with COVID-19 infection.
Prognostic FactorBOR (95% CI)p-Value
Minimum diameter LA, mm0.0721.074 (0.969–1.191)0.173
Maximum diameter LA, mm0.0931.097 (1.019–1.182)0.014
Maximum LA Vol (i), mL/m20.0681.070 (1.008–1.136)0.026
LV EDI, mL/m20.0221.022 (0.983–1.064)0.272
LV ESI, mL/m20.0591.06 (0.980–1.147)0.145
LV SI, mL/m20.0181.018 (0.955–1.085)0.585
LV EF, %−0.0600.942 (0.870–1.021)0.144
CI, L/min/m20.4161.516 (0.775–2.964)0.224
E/A1.0993.001 (1.273–7.076)0.012
E/e′0.2221.249 (1.079–1.445)0.003
LV septal wall thickness, mm0.0381.039 (0.872–1.237)0.670
Minimum RA diameter, mm0.0981.103 (1.016–1.198)0.019
Maximum RA diameter, mm0.1151.122 (1.039–1.211)0.003
Maximum RA Vol (i), mL/m20.0741.076 (1.029–1.125)0.001
Basal RV diameter, mm0.1291.138 (1.033–1.253)0.009
Mid cavitary RV diameter, mm0.0691.072 (0.993–1.157)0.075
RV longitudinal dimension, mm0.0461.048 (0.978–1.122)0.184
RV/LV area, 1/1000.0411.041 (1.010–1.074)0.010
PA trunk diameter, mm0.0901.095 (0.937–1.279)0.256
RV FAC, %−0.0690.933 (0.885–0.983)0.010
TAPSE, mm−0.5580.572 (0.429–0.764)<0.001
Tricuspid annular S′ wave, cm/s (PW)−0.2300.794 (0.656–0.962)0.019
RV FW LS, % (2D STE)−0.1220.885 (0.808–0.970)0.009
RV wall thickness (subcostal), mm0.7182.051 (1.123–3.745)0.019
sPAP, mm Hg0.1691.184 (1.093–1.282)<0.001
meanPAP, mm Hg0.1681.183 (1.082–1.293)<0.001
Inferior vena cava diameter, mm0.0991.104 (0.906–1.346)0.325
TR, moderate to severe/mild1.5754.831 (1.535–15.207)0.007
Abbreviations: B—regression coefficient; OR—odds ratio; 95% CI—95% confidence interval; LA—left atrium; Vol—volume; LV—left ventricle; EDI—end-diastolic volume index; ESI—end-systolic volume index; SI—stroke index; EF—ejection fraction; CI—cardiac index; RA—right atrium; RV—right ventricle; PA—pulmonary artery; FAC—fractional area change; TAPSE—tricuspid annular plane systolic excursion; PW—pulse-wave; RV FW LS—right ventricle free wall longitudinal strain; sPAP—systolic pulmonary artery pressure; meanPAP—mean pulmonary artery pressure; TR—tricuspid regurgitation. Bold indicates significance (p-value of < 0.05).
Table 5. Results of intra-observer, inter-observer, and test-retest reproducibility analyses.
VariableICC (95% Confidence Interval)
Intra-ObserverInter-ObserverTest-Retest
RV FW LS0.88 (0.68–0.96)0.84 (0.60–0.94)0.85 (0.63–0.95)
TR velocity0.96 (0.90–0.99)0.96 (0.89–0.98)0.95 (0.87–0.98)
RV area0.97 (0.92–0.99)0.93 (0.80–0.97)0.95 (0.86–0.98)
LV area0.98 (0.96–0.99)0.97 (0.92–0.99)0.98 (0.94–0.99)
Abbreviations: ICC—intraclass correlation coefficient; RV FW LS—right ventricular free wall longitudinal strain; TR—tricuspid regurgitation; RV—right ventricle; LV—left ventricle.
Publisher’s Note: MDPI stays neutral with regard to jurisdictional claims in published maps and institutional affiliations.

