Article

Analysis of the Vulnerability of Agriculture to Climate and Anthropogenic Impacts in the Beni Mellal-Khénifra Region, Morocco

by
Fatine Eddoughri
1,*,
Fatima Zohra Lkammarte
1,
Moussa El Jarroudi
2,
Rachid Lahlali
3,
Ahmed Karmaoui
4,5,6,
Mohammed Yacoubi Khebiza
1 and
Mohammed Messouli
1
1
Laboratory of Water, Biodiversity and Climate Change, Faculty of Sciences Semlalia, Cadi Ayyad University, Marrakech 40000, Morocco
2
Department of Environmental Sciences and Management, SPHERES Research Unit, University of Liège, 6700 Arlon, Belgium
3
Phytopathology Unit, Department of Plant Protection, Ecole Nationale d’Agriculture de Meknès, Meknès 50001, Morocco
4
Bioactives (Health and Environmental, Epigenetics Team), University Moulay Ismail, Meknès 50050, Morocco
5
Faculty of Sciences and Techniques, University Moulay Ismail, Errachidia 52000, Morocco
6
Moroccan Center for Culture and Sciences, Zagora 47900, Morocco
*
Author to whom correspondence should be addressed.
Sustainability 2022, 14(20), 13166; https://doi.org/10.3390/su142013166
Submission received: 21 July 2022 / Revised: 23 September 2022 / Accepted: 30 September 2022 / Published: 13 October 2022

Abstract

:
Climate change (CC) is a significant concern for many climate-sensitive socio-economic sectors, such as agriculture and food production. The current study aimed at analyzing the current vulnerability of the Moroccan agricultural sector to CC and anthropogenic impact and identifying the relevant vulnerability factors in the Beni Mellal-Khénifra region. In this regard, a multidisciplinary approach was used to assess the vulnerability. To do this, an index based on five components was designed, including climate, plant production, animal production, geography, and anthropogenic aspects. The numerical model has benefited from data retrieved from three recognized indices such as Normalized Difference Vegetation Index (NDVI), Standardized Precipitation Index (SPI), and Vegetation Condition Index (VCI), and from the reported data of the agricultural, environmental, and socio-economic governmental departments. The results showed that there was a significant vulnerability of all the five components to CC. Particularly, the province of Azilal was the most vulnerable, followed by Khénifra, Fquih Ben Salah, and Beni Mellal, while Khouribga was the least vulnerable. These components might help to determine the mechanisms and priority sectors, the most vulnerable to CC and anthropogenic effects, to take urgent measures. These may guide decision makers to carry out effective actions, namely, the amounts to be spent to mitigate this vulnerability. It will also make it possible to know where, when, and how the adaptation should take place.

1. Introduction

Climate changes can be defined as negative earth or regional global climate variations. These changes may be due to intrinsic processes on the earth, external influences, or more recently, human activities [1]. This phenomenon has become evident and is caused in large part by human activity, which mainly increases the concentration of atmospheric CO2 [2]. CC vulnerability is a function of exposure, sensitivity, and adaptive capacity [3]. Exposure is the rate and magnitude of CC. It is the only element that contributes to the vulnerability that is directly related to climate parameters, i.e., the character, magnitude, and rate of CC and variability. The typical exposure factors include temperature, precipitation, evapotranspiration, climatic water balance, and extreme events, such as intense rainfall and extreme droughts. Variations in these parameters can place significant additional stress on these systems [4]. The degree to which a system is affected, either negatively or positively, by climate variability is called sensitivity [3]. Adaptive capacity is a key factor in ensuring the resilience of communities and reducing their vulnerability [5]. Since the idea of vulnerability research was first proposed by Timmerman [6], it was applied to a wide range of research areas, including water resource conditions, ecological environment assessment, land-use change, etc.
Agriculture is among the most vulnerable sectors to CC. In fact, according to future climate projections, the reduction in agricultural productivity and the increase in food insecurity are hypothesized to be due to the increased duration and intensity of extreme heat waves and the changes in the distribution of rainfall, water availability, and drought [7]. The agricultural sector, as one of the largest users of freshwater resources, will therefore face great challenges [8,9]. Over 250 million people are undernourished in Africa (more than double the global average). This proportion is expected to increase to 25.7% by 2030, which puts Africa far from the “zero hunger” goal [10]. The main vocations of the Southern Mediterranean region are mostly climate dependent and facing CC, its economy will be vulnerable [11]. According to WorldBank [12] and Van Praag et al. [13], Morocco, Tunisia, and Algeria will become global hot spots by the end of the twenty-first century. Demographic, industrial, and agricultural expansions are putting pressure on Morocco’s water and environmental resources [14,15]. According to Bahir et al. [16], Morocco has suffered several periods of drought, resulting in more dry years than wet years [17]. Water resources are estimated at 20 billion m3, with an average annual consumption per capita of 700 m3 [18].
Various methods have been developed to assess vulnerability, including Turner’s model, the Risk-Hazard (RH) model, the Pressure and Release (PAR) model, the Driver-Pressure-State-Impact-Response (DPSIR) model, and Composite Index (CI) approaches [19]. This research article aims to create an index of the vulnerability of agriculture to climatic and anthropogenic hazards in one of the twelve regions of Morocco, which is the region of Beni Mellal-Khénifra. This index is based on several indicators grouped into five components, namely, climate, plant production, animal production, geography, and anthropogenic. The approach followed is based on the modeling of these indicators by applying statistical methods, GIS, and a survey of experts in the field. This work has been framed by the Sustainable Development Goals, in particular, Goal 2 titled “Zero Hunger”. The latter goal describes the food and agricultural sector as offering key development solutions, being central to eradicating hunger and poverty. Goal 13, which concerns itself with measures to combat climate change, has also been monitored as the fight against global warming, and has become an inseparable part of achieving sustainable development. This research work will be a further contribution to our study area. The results provided essential information enabling managers to plan and implement adaptation measures to face the climate challenge. If no immediate action is taken, the future consequences of these changes will be much more difficult and costly to control.

2. Materials and Methods
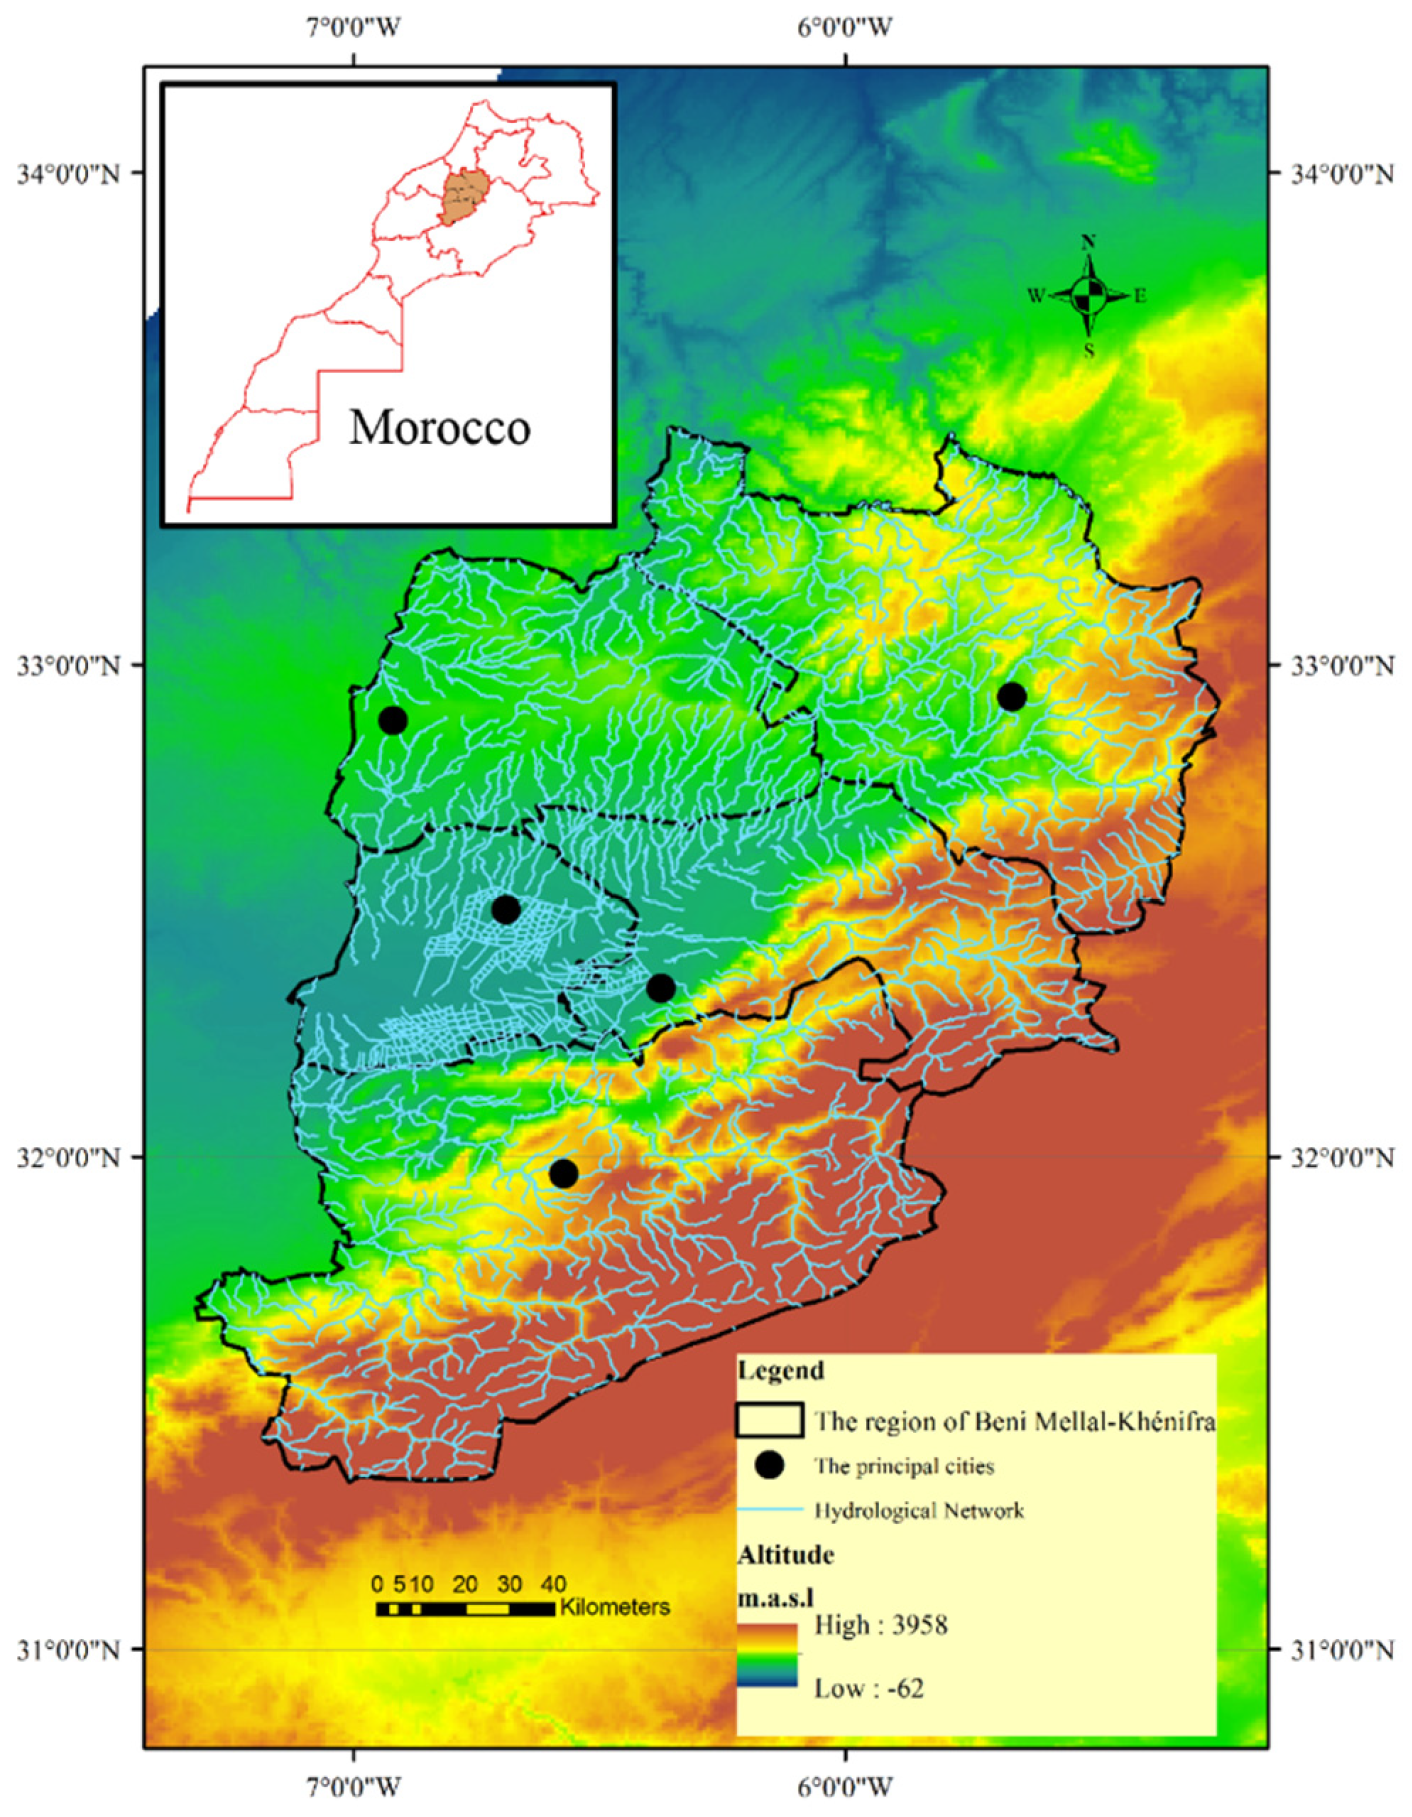
2.1. Study Area

The region of Beni Mellal-Khénifra, presented in Figure 1, is geographically located between the latitudes 31°33 and 33°46 North and the longitudes 5°28 and 7°00 West. It covers an estimated area of 28,088 km2, divided into five provinces: Beni Mellal (4528 Km2), Fquih Ben Salah (2547 Km2), Azilal (10050 Km2), Khénifra (6713 Km2), and Khouribga (4250 Km2) [20]. Concerning the topography of the region, the study area ranges from an elevation of 900 m to 3890 m in the mountains, which represents half of the region, while the other half is made up of plains and plateaus of about 600 m [21]. The highest peak in the basin is 3890 m above sea level.
The climatic conditions are variable, ranging from humid in the high mountains to semi-arid in the plains, with intensely cold winters and very hot summers. In addition, the average annual rainfall is characterized by large variations, with an average rainfall of 230 mm in the plains and 1000 mm in the high mountains. Average annual temperatures range from a maximum of 46 °C in August to a minimum of −2 °C in January [22].
Beni Mellal-Khénifra is one of the main agricultural regions of Morocco. It includes 960,000 Ha of arable agricultural area, or 34% of the total area of the region, including 205,000 Ha irrigated (or 21% of the useful agricultural area of the region and 15% of the irrigated area in Morocco). The main cultivation sectors are cereals (70%), olive trees (12%), and fodder crops (9%) [23]. Regarding animal production, the region’s total herd is around 4.6 million heads, with a predominance of sheep (65%), followed by goats (21%) and cattle (9%). The predominance of cattle in the province of Fquih Ben Salah makes this province the most predominant in milk production, with around 400 million liters (mL) of milk produced in the region, followed by, respectively, Beni Mellal (70 mL), Khouribga (25 mL), Azilal (20 mL), and Khénifra (15 mL) [23].
We chose the region of Beni Mellal-Khénifra because it is one of the main agricultural regions of Morocco. This region is known for its diversity of crop sectors. Regarding the contribution to national production, many fields of the region record significant rates, in particular, cereal seed multiplication (30%), sugar beets (28%), citrus fruits (20%), olive trees (15%), apple trees (12%), common cereals (11%), red meats (15%), and milk (14%). Furthermore, special sectors of the region are characterized by their contribution to national production, which ranges from almost half to almost all, including pomegranate (45%), Niora (85%), and Sesame (90%). The region has an important agro-industrial infrastructure, but it is not able to meet the expectations of a region with an essentially agricultural vocation. In order to meet the increased demand, it must, therefore, better valorize its agricultural production [23].

2.2. Methodology and Data Preparation

The Agriculture Vulnerability Index (AVI) is an index used to assess the vulnerability of agriculture to CC and anthropogenic impacts that can be applied at the regional level. To design this index, four main steps were followed: identification of indicators from a survey of experts in the field; collecting data from different sources, including ministerial and government documents, scientific articles, and technical reports; and standardization and presentation of results. The AVI was based on five components, namely, climate, crop production, animal production, geography, and anthropogenic. For the climate component, five relevant indicators, which have a direct impact on agriculture, were chosen: temperature (T), precipitation (P), Normalized Difference Vegetation Index (NDVI), Standardized Precipitation Index (SPI), and Vegetation Condition Index (VCI).
Daily data of temperature and precipitation were extracted and processed from the Power Data Access Viewer from the website https://power.larc.nasa.gov/data-access-viewer/, accessed on 20 July 2022, which provides solar and weather data sets from NASA research for renewable energy support, building energy efficiency, and agricultural needs, and all the parameters of which are available on a global grid of 0.5° × 0.5° latitude and longitude. These datasets were therefore selected to provide the longest possible time series, at least 30 years, as recommended by the World Meteorological Organization (WMO). Our reference period covers 33 agricultural seasons, from 1 September 1982, to 31 August 2015.
The SPI was developed by McKee et al. [24] to quantify the precipitation deficit over several timescales. The only input parameter is precipitation. The SPI can be calculated for different timescales, which in turn provides early drought warning and helps assess drought severity. It is less complex than the Palmer Drought Severity Index and many other indices [25]. In this article, the SPI was calculated using R Studio software. From the SPI values, we can determine the drought intensity according to a classification system presented in Table 1.
The NDVI is an indicator used to assess whether or not the observed area contains living green vegetation, based on an analysis of remote sensing measurements via a spatial platform. This indicator was developed from the work carried out by Tarpley et al. [29] and Kogan [30] with the National Oceanic and Atmospheric Administration (NOAA) in the US. In agriculture, NDVI data provide a measure of crop health. They are used to identify and monitor droughts that affect agriculture [31]. In this study, we worked with data from NOAA’s AVHRR satellite over the study period.
The VCI was developed by Kogan with NOAA in the United States. The VCI is used to identify drought situations and determine their onset, duration, and severity, especially in areas where drought episodes are localized and poorly defined, noting changes in vegetation and comparing them with historical values [31]. In this study, the CVI was calculated from the NDVI time series according to the following formula:
VCI i = NDVI   i NDVI   min NDVI   max NDVI   min 100
where:
  • NDVI(i) of the period studied;
  • NDVI min: minimum of the time series studied;
  • NDVI Max: maximum of the time series studied.
The following equation was applied to estimate the vulnerability scores of the components used:
AVI = ∑(c1 + c2 + c3 + c4 + c5)
  • c1: Component 1 = climate
  • c2: Component 2 = crop production
  • c3: Component 3 = animal production
  • c4: Component 4 = geographic
  • c5: Component 5 = anthropic
Regarding the components, they were calculated as follows:
  • c1 = T + P + NDVI + SPI + VCI
  • c2 = Total Area + irrigated useful agricultural area
  • c3 = Litter production + cattle + sheep + goats
  • c4 = Total Area + medium relief
  • c5 = Demographics + illiteracy + unemployment
After collecting all the data for the five components, we normalized all the indicators to transform their measured values on different scales and using different units of measure into unitless values on a common scale. A standard range of values from 0 to 1 was used according to the formula [32]:
IN = I/Imax
where:
  • IN = value of the standardized indicator;
  • I = value of the indicator;
  • Imax = maximum value of the indicator in the region.
After the normalization of all our indicators, weighting was applied. Weighting an index refers to giving different weights to the values that make up the index, according to the various criteria that reflect the relative importance of each element. We, therefore, made the weighting according to the results of our expert opinion survey.
The objective of our “expert opinion” survey is to select the most relevant indicators that have a relationship with the vulnerability of agriculture, scoring the indicators from 0 to 5 (0 = not important, 5 = very important). This survey was done through the Google Form platform. The data collected from this survey were processed anonymously. The respondents to this questionnaire are researchers, university professors, and doctoral students in the field of environment and climate change.
After weighting, we aggregated our components. This method is used to combine the information from the different indicators into a composite indicator that represents vulnerability as a single component. We used the “Weighted Arithmetic Aggregation” method. This is a common, simple, and transparent aggregation method. To calculate the Composite Indicator (CI) of a component of vulnerability, the individual indicators (In) are multiplied by their respective coefficients (wn), added together, and then divided by the sum of all their coefficients (w), as shown in the following formula:
CI = ( I 1     w 1 + I 2     w 2 +   I n     w n ) / 1 n w
The sum of the 5 components used provides the total agricultural vulnerability index. Each category was given a designation of the level of vulnerability (see Table 2).

3. Results

The results of rainfall variability during the agricultural year (September–August) reveal that the rainfall regime in the Beni Mellal-Khénifra region has been very unstable. The results show that the rainfall variability of the region has kept increasing during the period 1982–2015 (Figure 2a and Figure S1). The temporal distribution of average temperatures in the region is subject to several fluctuations with a slightly increasing trend. In this instance, results revealed high-temperature variability in this region over the period 1982–2015 (Figure 2a).
The results show a consistent trend from low variability, which has an increasing trend of NDVI data in the study area. The maximum value is 0.3811 for the year 2012–2013. The minimum value is 0.29810 recorded during the period 2006–2007 (Figure 2b).
The variation of the VCI index in the study area shows a clear fluctuation with an increasing trend during the period 1982–2015. The minimum value is 29.33 recorded in 2007–2008, and the maximum value is 46.74 for the agricultural year 2011–2012 (Figure 2c).
Figure 2d shows the evolution of the SPI in the study area during the period 1982–2015. It can be seen that there is an alternation of dry and wet periods. These periods were longer during the first years, from 1982 to 2002. Thereafter, we notice that these periods have become shorter. For the years 1984–1985, 1992–1993, and 1998–1999, the results show moderately dry years. The period 2008–2011 is characterized by a remarkable wet season.
Table 3 shows the scores of the standardized indicators selected according to the five components proposed for the five provinces of the Beni Mellal-Khénifra region.
In terms of climate vulnerability (Figure 3a), Khénifra province is the most vulnerable, followed by Beni Mellal, Fquih Ben Salah, Azilal, and Khouribga, respectively. Figure 3b shows that the province of Azilal is the most vulnerable in the crop production component, followed by Fquih Ben Salah, Beni Mellal, Khénifra, and Khouribga respectively.
For the animal production component (Figure 3c), the agricultural vulnerability score indicates that the most vulnerable province is Fquih Ben Salah with a score of 0.63, followed by Azilal, Khénifra, Khouribga, and Beni Mellal, which is the least vulnerable province with the lowest score.
Regarding geographical vulnerability, the province of Azilal has a very high vulnerability with a score of 1. It is followed, respectively, by Khénifra, Khouribga, and Beni Mellal, whereas the province of Fquih Ben Salah is the least vulnerable (Figure 3d). As regards anthropic vulnerability, the province of Khouribga is the most vulnerable. The provinces of Beni Mellal, Azilal, and Fquih Ben Salah follow it, respectively. The least vulnerable province is Khénifra with a score of 0.73, which is in the high vulnerability category (Figure 3e).
Regarding the vulnerability of agriculture to climate and anthropic change (Figure 4), the province of Azilal is the most vulnerable with a percentage of 25%, followed by Khénifra and Fquih Ben Salah with a percentage of 20% each, then Beni Mellal with a percentage of 18%, and finally Khouribga with a percentage of 17%, the least vulnerable.
Anthropogenic effects are those that are derived from human activities, as opposed to those that occur in natural environments without human influence. In our study, we chose three anthropogenic indicators: demography, illiteracy, and unemployment. In the region of Beni Mellal-Khénifra, the province of Azilal has the largest population of which 47.6% are illiterate, the highest percentage of illiteracy in the region, while the province of Khouribga records the highest rate of unemployment in the region, which is 24.3% (HCP, 2016).
The heatmap represents the values of a primary variable of interest across two-axis variables as a grid of colored squares. The axis variables are divided into ranges like a bar graph or histogram, and the color of each cell indicates the value of the primary variable in the corresponding cell range.
We may consider a heat map to be a data-driven “paint-by-numbers” grid overlaid on an image. Simply summarized, an image is divided into a grid, and in each square, the heat map shows the relative intensity of the values captured by the eye tracker by assigning each value a color representation. Each grid square indicates the correlation between the variables on each axis. The range of correlation is from −1 to +1. Closer to zero means that there is no linear trend between the two variables. More closely correlated to 1 means that they are positively correlated, i.e., as one increases, the other increases, and the more closely correlated to 1, the stronger the relationship. When the correlation is close to −1, it is analogous; however, instead of both variables increasing, one decreases when the other increases. On our heat map (Figure 5), the diagonals are almost all red. For the rest, the larger the number and the darker the color, the higher the correlation between the two variables. On the other hand, the closer the number is to −1, the more the color varies towards dark blue. The graph is not symmetrical concerning the diagonal, because the same two variables are not associated in these squares. All these variables interact in a complex way.
Figure 6 is a cartographic representation of the five components and the vulnerability of agriculture in the Beni Mellal-Khénifra region.

4. Discussion

CC is reflected in the region of Beni Mellal-Khénifra in different forms: the increase and irregularity of temperatures and precipitation, the increase in the frequency and duration of droughts, and the fluctuation and increase in the indices VCI and NDVI. These events have a significant impact on agriculture, resulting in a reduction in agricultural production and livestock and pastoral resources. This leads to important impacts on food security and income of rural communities. The results show that the province of Azilal is the most vulnerable, followed by the provinces of Fquih Ben Salah and Khénifra in equality, then the province of Beni Mellal, and finally Khouribga, which is, therefore, the least vulnerable province to climate change.
Agriculture is the sector that may be most seriously affected by CC, as crop and livestock systems depend critically on climatic variables such as precipitation and temperature. In particular, CC affects agricultural water requirement, water availability, and water quality [33,34].
Climate generally impacts agricultural water use in two different ways [35]. The first is that by altering key components of crop growth such as precipitation, evaporation, and solar radiation, a changing climate will have a direct impact on the supply and demand for agricultural water. Secondly, there is a significant impact of CC on crop yields, which indirectly affects their water productivity. During recent decades, there has been no significant change in the global amount of precipitation, but global warming has caused a significant increase in average evaporation [36].
The findings show that the two climate indicators precipitation and temperature are unstable and tend to increase. The region of Beni Mellal-Khouribga is characterized by a semi-arid climate. The region is located near the Middle Atlas and therefore benefits from the rains generated by the Atlantic disturbances through the reliefs. Precipitation behavior is difficult to analyze due to the geographical position and the relief that influence their random distributions [1]. CC and human impact are the main stressors affecting natural resources (especially water and soil) on a global scale. As a result, drought and desertification are the most common. These phenomena are closely linked, and mainly affect people who rely on the resources [37]. In recent decades, to assess various drought events, several drought indices have been developed and applied worldwide [38,39,40]. Drought events have drought transmission and progression relationships, and their onset and development processes often induce a series of different drought types, such as agricultural drought, hydrological drought, and meteorological drought [41]. The most widely used drought indices for meteorological and hydrological drought assessment are the Standard Precipitation Index (SPI) and the Standard Runoff Index (SRI), respectively, due to the following advantages: robust and flexible time scale, relatively simple to calculate, and limited data requirements [42].
In this study, we chose the SPI index because precipitation is the only parameter needed. It is less complex than other indices. It is possible to calculate the index for different time scales, which makes it possible to detect drought situations quickly and assess their severity. It was concluded that there are alternating dry and wet seasons. These seasons tend to change in frequency.
Vulnerability assessment is a key tool for the identification and planning of appropriate adaptation actions and policies needed to cope with climate-related challenges. According to Kamal et al. [1], there is a widening of the warm season and a narrowing of the cold season. In addition, an increasing trend of consecutive dry days is observed in Beni Mellal and Khouribga. They also pointed out that these trends are not statistically significant.
To detect and monitor droughts affecting agriculture, we used the NDVI index. It is an index with innovative use of satellite data of very high resolution and wide spatial coverage to monitor the state of vegetation with drought. In addition to this index, we calculated the VCI index, which is combined with the NDVI. It is used to assess vegetation in drought situations that affect agriculture. Future CC could affect crop growth in Morocco’s main food-producing provinces. The importance of agriculture in this region must be emphasized, as the local economy depends on this activity. The main crops in our region are cereals, oilseeds, and fodder crops. These two indicators are directly related to climate. Therefore, both are directly influenced by the fluctuations of the local climate, mostly the amount of water available from precipitation episodes in the arid and semi-arid areas [22]. A possible explanation for the contrasting differences between these indicators is the complex relationship between rainfall anomalies and vegetation cover. The varying vegetation cover behavior is also influenced by climatic conditions, availability of natural resources, and land-use practices, including the amount and distribution of rainfall, the amount of irrigation provided and how it is accessed, soil quality, and the crop management system [22].
In this study, the results of the assessment of agriculture according to our index show that the most vulnerable province to climate change is Azilal due to its geography, although it was not the most vulnerable in terms of climate component. It is followed, in terms of vulnerability by the province of Khénifra, which shows a very high vulnerability due to the climate, then the province of Fquih Ben Salah with a score of 0.81. This province marks a high vulnerability of animal production components. Beni Mellal in its turn marks a vulnerability score within the high vulnerability category. The province with the lowest score in the agricultural index is Khouribga because it was the least vulnerable in terms of climate and crop production, but the most vulnerable according to the anthropogenic component. According to these results, some indicators are more impactful than others, without neglecting the effect of the latter. It is therefore concluded that the environmental conditions, climatic and anthropic, impact agriculture by making it more vulnerable.
Some adaptive measures need to be applied. The following points are proposed: raising farmers’ awareness of climatic and demographic problems, poor resource management, choice of crops, overgrazing, supply and demand management, etc.; initiating stakeholders in the agricultural field to take into consideration the results of scientific research and news; improving the cultural level of stakeholders in the field through training, internships, seminars, forums, etc., so that they can easily access information and news in the agricultural field, introduce university programs specializing in climate change, and build technical capacity to integrate climate-smart farming techniques.
It should be noted that we framed our research work according to the sustainable development agenda. We associated Goal 2 (“Zero Hunger”) with Goal 13 (“Climate Action”). The integration of the social dimension with agriculture is very important given their impact on the environment. The most similar models to the proposed index are described in Table 4.
The RH model seeks to understand the impact of the hazard as a function of exposure to a hazardous event and the sensitivity of the exposed entity; in other words, to understand the exposure and sensitivity of the entity in question to the phenomenon under study. The shortcomings of this model are: it does not address attenuation or amplification; distinctions between subsystems and exposed components resulting in significant variations in hazard consequences; and the involvement of the political economy, particularly structures and social institutions, in determining differential exposure and consequences [44].
In the PAR model, the risk is defined in terms of the disruption of the stressor and the vulnerability of the unit exposed. It focuses on the conditions that lead to vulnerability by making the exposure conditions unsafe, and on the causes that create these conditions. The main value of this model is to address the social categories facing disasters and to emphasize the distinctions of vulnerability by different exposure units (e.g., class, ethnicity). Thus, this model highlights vulnerability. Among its weaknesses, the model does not address subsystem vulnerability through the coupled human–environment systems. It provides insufficient insight into the causal sequence structure of hazard, including interlocking scales of interaction, as well as tends to underestimate the system-wide feedback that integrative RH models involve [45].
Turner’s model has been anticipated or incorporated into both the RH model and the PAR model. This model, also known as the development of vulnerability analysis, is based on three major concepts: rights, adaptation through diversity, and resilience. Moreover, different systems maintain different sensitivities to disturbing factors. This characteristic of the population is strongly linked to legal and customary rights to have control over food and the necessities of life [43].
The DPSIR model is one of the initial tools for the adaptive management of social-ecological systems. It has been used to analyze and assess social and ecological problems in aquatic systems under anthropic influence. Its wide use is the result of these two characteristics: (i) it frames indicators according to policy goals related to the environmental problem being addressed, and (ii) it focuses on presumed causal relationships in a straightforward manner that challenges policy actors. This tool is aimed at assessing environmental problems arising from human activities to contribute to the achievement of sustainable development. Hence, it is likely to be biased in favor of nature conservation. However, it is noteworthy that it also favors the “win–win” approach as being in the best interest of society [46].
By comparing the proposed AVI with the other vulnerability models shown in Table 4, five components at different scales were established, namely, climate, crop production, livestock production, geography, and anthropic. The AVI gives an overview of the social-agricultural relationship while integrating the climate dimension, which is a major factor of vulnerability to climate change.
In the current study, we used different spatiotemporal information following the availability of official data. Our AVI can be applied at different scales. It should be noted that our index has very important characteristics. It is simple, valid and relevant, reliable, and credible. It has a precise meaning; the direction of its evolution is clear. It is practical and affordable and can be used for different studies. However, it can be refined and adjusted according to the data, type, and area of research we want to conduct. This proposed index is a simple but important method to inform vulnerability to climate and anthropogenic change. It provides only a qualitative analysis based on five heterogeneous components. As a result, understanding and interpreting the results is more complex, which can influence how decisions are made. It was difficult to select the most relevant indicators because they are relative to the period and data available in our study area. Access to the database is the most difficult to manage due to the lack of updated data. Furthermore, variations in the number of indicators in each component can affect the scores. Among the main limitations of this method is the lack of study of the impact of extreme weather events on agriculture [47,48]. Adding the impact of these phenomena to our method should be considered in a future study.

5. Conclusions

The findings show that the province of Azilal is the most vulnerable, followed by Fquih Ben Salah, Khénifra, and Beni Mellal successively. The province of Khouribga remains the least vulnerable. It is difficult to make a precise assessment of vulnerability to climate change, due to the lack of official data required. Nevertheless, more data were collected via an expert opinion survey, official documents, and websites to complete this assessment. The vulnerability assessment index will guide actions to improve resilience to CC in the study area. In this regard, it will serve as a planning tool for decision makers, considering the vulnerabilities of smallholder farmers to CC by integrating all climate-related risk indicators in the area. Similarly, the vulnerability map and its associated indicators can be used as a metric for adaptation to climate change. They would thus serve as a tool for monitoring and evaluating the efforts undertaken. The assessment and diagnosis of vulnerability is an important step to initiating adaptation. Decision makers should choose this tool because of its simplicity and transparency, the data used are reliable and therefore easy to apply. Accordingly, we should encourage some key points to renovate the agricultural sector in this region, including improving the capacity of farmers, strengthening the resilience of agricultural infrastructure, improving and strengthening research on climate and agriculture, developing sustainable agriculture, disaster risk management, and, last but not least, encouraging the implementation of scientific research results in the agricultural sector.

Supplementary Materials

The following supporting information can be downloaded at: https://www.mdpi.com/article/10.3390/su142013166/s1, Figure S1: Cumulative rainfall and average temperature of Beni Mellal-Khenifra region.

Author Contributions

Conceptualization, F.E. and A.K.; methodology, M.M. and A.K.; software, F.E. and F.Z.L.; validation, M.M. and M.Y.K.; formal analysis, F.E.; investigation, F.E.; resources, F.E.; data curation, F.E.; writing—original draft preparation, F.E. and A.K.; writing—review and editing, R.L. and M.E.J.; supervision, M.M. and M.Y.K.; project administration, M.Y.K. and M.M. All authors have read and agreed to the published version of the manuscript.

Funding

This research did not receive any external funding.

Data Availability Statement

All datasets used are within this manuscript.

Acknowledgments

This research was supported by the Laboratory of Water Biodiversity and Climate Change, Faculty of Sciences Semlalia, Cadi Ayyad University.

Conflicts of Interest

The authors declare no conflict of interest.

References

  1. Kamal, A.O.; Ismail, K.; Abdelkrim, A.; Atika, K.; Driss, E.; Ezzahra, E.F.; Zakaria, A.; Fatima, N.; Nadia, N. Climate Change Trend Observations in Morocco: Case Study of Beni Mellal-Khenifra and Daraa-Tafilalt Regions. J. Geosci. Environ. Prot. 2018, 6, 34–50. [Google Scholar] [CrossRef] [Green Version]
  2. IPCC. Climate Change 2014 Synthesis Report: Summary Chapter for Policymakers; Cambridge University Press: Cambridge, UK, 2014. [Google Scholar]
  3. Reay, D.; Sabine, C.; Smith, P.; Hymus, G. Intergovernmental Panel on Climate Change; Fourth Assessment Report; Intergovernmental Panel on Climate Change: Geneva, Switzerland; Cambridge University Press: Cambridge, UK, 2007. [Google Scholar]
  4. GIZ. Guide de Référence Sur la Vulnérabilité Concept et Lignes Directrices Pour la Conduite D’analyses de Vulnérabilité Standardisées; Deutsche Gesellschaft für Internationale Zusammenarbeit (GIZ) GmbH: Bonn/Eschborn, Germany, 2017; Available online: https://www.ipcc.ch/site/assets/uploads/2018/03/ar4_wg2_full_report.pdf (accessed on 20 April 2021).
  5. Nursey-Bray, M.; Gillanders, B.; Maher, J.A. Developing indicators for adaptive capacity for multiple use coastal regions: Insights from the Spencer Gulf, South Australia. Ocean Coast. Manag. 2021, 211, 105727. [Google Scholar] [CrossRef]
  6. Timmerman, P. Vulnerability, Resilience and the Collapse of Society. In A Review of Models and Possible Climatic Applications; Institute for Environmental Studies, University of Toronto: Toronto, ON, Canada, 1981. [Google Scholar] [CrossRef]
  7. Zilli, M.; Scarabello, M.; Soterroni, A.C.; Valin, H.; Mosnier, A.; Leclère, D.; Havlík, P.; Kraxner, F.; Lopes, M.A.; Ramos, F.M. The impact of climate change on Brazil’s agriculture. Sci. Total Environ. 2020, 740, 139384. [Google Scholar] [CrossRef]
  8. Egerer, S.; Cotera, R.V.; Celliers, L.; Costa, M.M. A leverage points analysis of a qualitative system dynamics model for climate change adaptation in agriculture. Agric. Syst. 2021, 189, 103052. [Google Scholar] [CrossRef]
  9. Tang, Y.H.; Luan, X.B.; Sun, J.X.; Zhao, J.F.; Yin, Y.L.; Wang, Y.B.; Sun, S.K. Impact assessment of climate change and human activities on GHG emissions and agricultural water use. Agric. For. Meteorol. 2021, 296, 108218. [Google Scholar] [CrossRef]
  10. Branca, G.; Arslan, A.; Paolantonio, A.; Grewer, U.; Cattaneo, A.; Cavatassi, R.; Lipper, L.; Hillier, J.; Vetter, S. Assessing the economic and mitigation benefits of climate-smart agriculture and its implications for political economy: A case study in Southern Africa. J. Clean. Prod. 2020, 285, 125161. [Google Scholar] [CrossRef]
  11. Meddi, M.; Eslamian, S. Uncertainties in Rainfall and Water Resources in Maghreb Countries under Climate Change. In African Handbook of Climate Change Adaptation; Springer: Cham, Switzerland, 2021. [Google Scholar]
  12. The World Bank. Beyond Scarcity: Water Security in the Middle East and North Africa; MENA Development Report; The World Bank: Washington, DC, USA, 2018. [Google Scholar]
  13. Van Praag, L.; Ou-Salah, L.; Hut, E.; Zickgraf, C. Perceptions and Explanations of Environmental Change in Morocco. In Migration and Environmental Change in Morocco: In Search for Linkages between Migration Aspirations and (Perceived) Environmental Changes; Springer: Cham, Switzerland, 2021. [Google Scholar]
  14. Beroho, M.; Briak, H.; El Halimi, R.; Ouallali, A.; Boulahfa, I.; Mrabet, R.; Kebede, F.; Aboumaria, K. Analysis and prediction of climate forecasts in Northern Morocco: Application of multilevel linear mixed effects models using R software. Heliyon 2020, 6, e05094. [Google Scholar] [CrossRef] [PubMed]
  15. Amiri, N.; Lahlali, R.; Amiri, S.; EL Jarroudi, M.; Khebiza, M.Y.; Messouli, M. Development of an integrated model to assess the impact of agricultural practices and land use on agricultural production in morocco under climate stress over the next twenty years. Sustainability 2021, 13, 11943. [Google Scholar] [CrossRef]
  16. Bahir, M.; Ouhamdouch, S.; Ouazar, D.; el Moçayd, N. Climate change effect on groundwater characteristics within semi-arid zones from western Morocco. Groundw. Sustain. Dev. 2020, 11, 100380. [Google Scholar] [CrossRef]
  17. Ait-El-Mokhtar, M.; Boutasknit, A.; Ben-Laouane, R.; Anli, M.; El Amerany, F.; Toubali, S.; Lahbouki, S.; Wahbi, S.; Meddich, A. Vulnerability of oasis agriculture to climate change in Morocco. In Impacts of Climate Change on Agriculture and Aquaculture; IGI Global: Hershey, PA, USA, 2020; pp. 76–106. [Google Scholar]
  18. Bahir, M.; Ouhamdouch, S.; Ouazar, D. An assessment of the changes in the behavior of the groundwater resources in arid environment with global warming in Morocco. Groundw. Sustain. Dev. 2021, 12, 100541. [Google Scholar] [CrossRef]
  19. Khorrami, M.; Malekmohammadi, B. Effects of excessive water extraction on groundwater ecosystem services: Vulnerability assessments using biophysical approaches. Sci. Total Environ. 2021, 799, 149304. [Google Scholar] [CrossRef] [PubMed]
  20. HCP. Annuaire Statistique de la Région Beni Mellal-Khenifra; Direction Régionale du Plan Béni Mellal–Khénifra: Beni Mellal, Morocco, 2016. [Google Scholar]
  21. Ouatiki, H.; Boudhar, A.; Ouhinou, A.; Arioua, A.; Hssaisoune, M.; Bouamri, H.; Benabdelouahab, T. Trend analysis of rainfall and drought over the Oum Er-Rbia River Basin in Morocco during 1970–2010. Arab. J. Geosci. 2019, 12, 128. [Google Scholar] [CrossRef]
  22. Lebrini, Y.; Boudhar, A.; Hadria, R.; Lionboui, H.; Elmansouri, L.; Arrach, R.; Ceccato, P.; Benabdelouahab, T. Identifying Agricultural Systems Using SVM Classification Approach Based on Phenological Metrics in a Semi-arid Region of Morocco. Earth Syst. Environ. 2019, 3, 277–288. [Google Scholar] [CrossRef]
  23. Direction Régionale de l’Agriculture Beni Mellal-Khenifra. Monographie Agricole de la Région Beni Mellal Khenifra; Conseil Régional de Béni Mellal–Khénifra: Beni Mellal, Morocco, 2019. [Google Scholar]
  24. McKee, T.B.; Doesken, N.J.; John, K. The Relationship of Drought Frequency and Duration to Time Scales. In Proceedings of the 8th Conference on Applied Climatology, Anaheim, CA, USA, 17–22 January 1993. [Google Scholar] [CrossRef]
  25. WMO. Standardized Precipitation Index User Guide; WMO: Geneva, Switzerland, 2012; p. 1090. [Google Scholar]
  26. Yerdelen, C.; Abdelkader, M.; Eris, E. Assessment of drought in SPI series using continuous wavelet analysis for Gediz Basin, Turkey. Atmos. Res. 2021, 260, 105687. [Google Scholar] [CrossRef]
  27. Bouaziz, M.; Medhioub, E.; Csaplovisc, E. A machine learning model for drought tracking and forecasting using remote precipitation data and a standardized precipitation index from arid regions. J. Arid Environ. 2021, 189, 104478. [Google Scholar] [CrossRef]
  28. Liu, Z.N.; Li, Q.F.; Nguyen, L.B.; Xu, G.H. Comparing machine-learning models for drought forecasting in vietnam’s cai river basin. Polish J. Environ. Stud. 2018, 27, 2633–2646. [Google Scholar] [CrossRef] [Green Version]
  29. Tarpley, J.D.; Schneider, S.R.; Money, R.L. Global Vegetation Indices from NOAA-7 Meteorological Satellite. J. Clim. Appl. Meteorol. 1984, 23, 491–494. [Google Scholar] [CrossRef]
  30. Kogan, F.N. Droughts of the late 1980s in the United States as derived from NOAA polar-orbiting satellite data. Bull.-Am. Meteorol. Soc. 1995, 76, 655–668. [Google Scholar] [CrossRef]
  31. WMO. Handbook of Drought Indicators and Indices; WMO: Geneva, Switzerland, 2016. [Google Scholar]
  32. Karmaoui, A.; Zerouali, S.; Ougougdal, H.A.; Shah, A.A. A new mountain flood vulnerability index (MFVI) for the assessment of flood vulnerability. Sustain. Water Resour. Manag. 2021, 7, 92. [Google Scholar] [CrossRef]
  33. Kundzewicz, Z.W.; Mata, L.J.; Arnell, N.W.; Doll, P.; Kabat, P.; Jimenez, B.; Miller, K.; Oki, T.; Zekai, S.; Shiklomanov, I. Freshwater resources and their management. In Climate Change 2007: Impacts, Adaptation and Vulnerability. Contribution of Working Group II to the Fourth Assessment Report of the Intergovernmental Panel on Climate Change; Cambridge University Press: Cambridge, UK, 2007; pp. 173–210. [Google Scholar]
  34. Nelson, G.C.; Rosegrant, M.W.; Koo, J.; Robertson, R.; Sulser, T.; Zhu, T.; Ringler, C.; Msangi, S.; Palazzo, A.; Batka, M.; et al. Climate change: Impact on agriculture and costs of adaptation. In Food Policy Report: Climate Change—Impact on Agriculture and and Costs of Adaptation; International Food Policy Research Institute: Washington, DC, USA, 2009. [Google Scholar]
  35. Cai, X.; Zhang, X.; Noël, P.H.; Shafiee-Jood, M. Impacts of climate change on agricultural water management: A review. WIREs Water 2015, 2, 439–455. [Google Scholar] [CrossRef]
  36. He, G.; Geng, C.; Zhao, Y.; Wang, J.; Jiang, S.; Zhu, Y.; Wang, Q.; Wang, L.; Mu, X. Food habit and climate change impacts on agricultural water security during the peak population period in China. Agric. Water Manag. 2021, 258, 107211. [Google Scholar] [CrossRef]
  37. Karmaoui, A. Drought and desertification in Moroccan Pre-Sahara, Draa valleys: Exploring from the perspective of young people. Geoenviron. Disasters 2019, 6, 2. [Google Scholar] [CrossRef]
  38. Wells, N.; Goddard, S.; Hayes, M.J. A self-calibrating Palmer Drought Severity Index. J. Clim. 2004, 17, 2335–2351. [Google Scholar] [CrossRef]
  39. López-Moreno, J.I.; Vicente-Serrano, S.; Zabalza, J.; Beguería, S.; Lorenzo-Lacruz, J.; Azorin-Molina, C.; Morán-Tejeda, E. Hydrological response to climate variability at different time scales: A study in the Ebro basin. J. Hydrol. 2013, 477, 175–188. [Google Scholar] [CrossRef] [Green Version]
  40. Farahmand, A.; AghaKouchak, A. A generalized framework for deriving nonparametric standardized drought indicators. Adv. Water Resour. 2015, 76, 140–145. [Google Scholar] [CrossRef]
  41. Cao, S.; He, Y.; Zhang, L.; Chen, Y.; Yang, W. Spatiotemporal characteristics of drought and its impact on vegetation in the vegetation region of Northwest China. Ecol. Indic. 2021, 133, 108420. [Google Scholar] [CrossRef]
  42. Wang, M.; Jiang, S.; Ren, L.; Xu, C.-Y.; Menzel, L.; Yuan, F.; Xu, Q.; Liu, Y.; Yang, X. Separating the effects of climate change and human activities on drought propagation via a natural and human-impacted catchment comparison method. J. Hydrol. 2021, 603, 126913. [Google Scholar] [CrossRef]
  43. Turner, B.L.; Kasperson, R.E.; Matson, P.A.; McCarthy, J.J.; Corell, R.W.; Christensen, L.; Eckley, N.; Kasperson, J.X.; Luers, A.; Martello, M.L.; et al. A framework for vulnerability analysis in sustainability science. Proc. Natl. Acad. Sci. USA. 2003, 100, 8074–8079. [Google Scholar] [CrossRef] [PubMed]
  44. Liverman, D.M. Vulnerability to Global environmental change. In Understanding Global Environmental Change: The Contributions of Risk Analysis and Management; Kasperson, R.E., Dow, K., Golding, D., Eds.; Earth Transformed Program, Clark University: Worcester, MA, USA, 1990; pp. 27–44. [Google Scholar]
  45. Blaikie, P.; Wisner, B.; Cannon, T.; Davis, I. At Risk: Natural Hazards, Peoples Vulnerability and Disasters; Psychology Press: London, UK, 1994. [Google Scholar]
  46. Gari, S.R.; Newton, A.; Icely, J.D. A review of the application and evolution of the DPSIR framework with an emphasis on coastal social-ecological systems. Ocean Coast. Manag. 2015, 103, 63–77. [Google Scholar] [CrossRef] [Green Version]
  47. Van Tilburg, A.J.; Hudson, P.F. Extreme weather events and farmer adaptation in Zeeland, the Netherlands: A European climate change case study from the Rhine delta. Sci. Total Environ. 2022, 844, 157212. [Google Scholar] [CrossRef]
  48. Schmitt, J.; Offermann, F.; Söder, M.; Frühauf, C.; Finger, R. Extreme weather events cause significant crop yield losses at the farm level in German agriculture. Food Policy 2022, 112, 102359. [Google Scholar] [CrossRef]
Figure 1. Geographical location of the region of Beni Mellal-Khénifra.
Sustainability 14 13166 g001
Figure 2. Evolution of climate indicators of Beni Mellal-Khénifra region over the period 1982–2015. (a) Evolution of the cumulative rainfall and the average temperature; (b) Evolution of NDVI; (c) Evolution of VCI; (d) Evolution of SPI.
Sustainability 14 13166 g002
Figure 3. Agricultural vulnerability of the provinces in the region of our study is classified according to the five components: (a) Climate; (b) Crop production; (c) Animal production; (d) Geographic; (e) Anthropic.
Sustainability 14 13166 g003
Figure 4. Agricultural vulnerability of the provinces of Beni Mellal-Khénifra region.
Sustainability 14 13166 g004
Figure 5. Heat map of the different correlations between the components and the provinces of our study area.
Sustainability 14 13166 g005
Figure 6. Maps of the 5 components and vulnerability of agriculture in the Beni Mellal-Khénifra region.
Sustainability 14 13166 g006
Table 1. Drought classification based on SPI values [26,27,28].
SPI ValueDrought Category
(2.0, +∞)Extreme wet
(1.5, 2.0)Severe wet
(1.0, 1.5)Moderate wet
(−1.0, 1.0)Normal
(−1.5, −1.0)Moderate drought
(−2.0, −1.5)Severe drought
(−∞, −2.0)Extreme drought
Table 2. Agricultural vulnerability index designations.
Index ValueDesignations
˂0.2Very low vulnerability
0.2–0.4Low vulnerability
0.4–0.6Moderate vulnerability
0.6–0.8High vulnerability
0.8–1Very high vulnerability
Table 3. Standardized indicator scores of the agricultural sector according to the five proposed components for the * five provinces of the Beni Mellal-Khénifra region (Morocco).
Provinces
ComponentIndicator Names/VariableUnitBeni MellalAzilalFquih Ben SalahKhénifraKhouribga
Climate1Temperature°C0.8360.8271.00.8111.0
2Precipitationmm0.9020.6640.7581.00.758
3Normalized Difference Vegetation Index (NDVI)*1.00.5630.7080.6040.563
4Standardized Precipitation Index (SPI)*0.1440.1770.0191.00.019
5Vegetation Condition Index (VCI)*1.00.9740.8740.8480.735
Crop production6Total areaHa0.3771.00.2260.6300.398
7Irrigated Useful Agricultural AreaHa0.5340.2581.00.1660.029
8Milk productionMillion Liter0.2590.0741.00.0560.093
Animal production9CattleHead0.2510.2361.00.5030.379
10SheepHead0.4571.00.4580.8100.701
11GoatsHead0.0311.00.0780.3720.110
12Total areaKm20.4511.00.2530.6680.423
Geographic13Medium relief (altitude)m0.3441.00.3270.6180.587
14DemographicsInhabitants0.9931.00.9080.6700.974
Anthropic15Illiteracy (Nb)%0.7371.00.8280.9180.658
16Unemployment%0.6710.3620.4860.6791.0
Table 4. Description of the AVI index developed in this study and some other existing indicators.
IndexTurner’s ModelRisk-Hazard ModelPressure and Release ModelDriver-Pressure-State-Impact-Response ModelAgricultural Vulnerability Index
Abbreviation-RHPARDPSIRAVI
AimVulnerability results from exposure to hazards and the resilience of the system experiencing those hazards.
Coupled human-environmental systems and the linkages within and outside the systems affect their vulnerability.
The impact of a hazard is a function of the exposure to the hazardous event and the dose–response, which is the sensitivity of the exposed entity.Risk is defined as a function of the disturbance, the stressor or stress, and the vulnerability of the exposed unit.It is a causal framework describing society–environment interactions: the impact of humans on the environment and the other way around because of the components’ interdependence.To assess vulnerability to CC, we integrated the social dimension to agriculture by grouping the indices into 5 main components: Climate, Crop Production, Animal Production, Geography, and Anthropic.
authorTurner et al. 2003Livermann 1990Blaikie et al. 1994Organization of Eco-
nomic Cooperation and Development (OECD, 1993) and the Euro-
pean Environment Agency (EEA, 1995)
This study
reference[43][44][45][46]This study
Publisher’s Note: MDPI stays neutral with regard to jurisdictional claims in published maps and institutional affiliations.

