Article

Spatial–Temporal Evolution Characteristics and Economic Effects of China’s Cultural and Tourism Industries’ Collaborative Agglomeration

1
School of Management Administration, Xi’an University of Architecture and Technology, 13 Yanta Rd., Xi’an 710055, China
2
School of Public Administration, Xi’an University of Architecture and Technology, 13 Yanta Rd., Xi’an 710055, China
*
Author to whom correspondence should be addressed.
Sustainability 2022, 14(22), 15119; https://doi.org/10.3390/su142215119
Submission received: 4 October 2022 / Revised: 11 November 2022 / Accepted: 11 November 2022 / Published: 15 November 2022
(This article belongs to the Section Tourism, Culture, and Heritage)

Abstract

:
In this era of industrial integration, the synergistic energy given collaborative agglomerations of the culture and tourism industries is crucial for fulfilling the potential of the underlying resources. The cultural grasp of artistic depths when fully supported can transform the cultural experiences for tourists and participants alike. In this study, the theory of spatial economics is used to analyze the spatial coupling degree of the Chinese culture and tourism industries from 2010 to 2019, based on the coupling coordination degree model. A spatial correlation test model was used to analyze the spatial–temporal evolution characteristics of industrial collaborative agglomeration, and a spatial vector autoregression model and impulse response function was used to analyze the economic effects of industrial collaborative agglomeration. The results show: (1) A coupling and coordination relationship exists between Chinese culture and the tourism industries. This collaborative bond is in the initial stage. (2) The overall spatial correlation between these industries can potentially provide significant and positive relationships among several components of the community, tourist, and cultural spectrum. The local spatial correlation of culture and tourism industries in Eastern China is ranked the highest; the central region is in the middle. The western region ranks the lowest. (3) The collaborative synergy of the cultural and tourism industries has a nonlinear economic effect on economic development, while the impacts of different industrial collaborative groups have the potential to strengthen the Chinese economy from a more technological perspective. This study provides theoretical support and recommendations for promoting the coordinated development of Chinese culture and tourism industries, which can also serve as an example for other regions seeking a stronger relationship between their culture, economic growth of the region as a whole, and the tourism industries.

1. Introduction

Industrial collaborative agglomeration (also known as clustering) refers to highly concentrated industrial and spatial linking of different types of industries within a specific geographical scope. The core advantage of industrial collaboration is that different types of industries achieve both economic and geographical spatial-level benefits through business and technology-oriented promotion, thereby forming a stronger industrial structure. Culture and tourism are strategic emerging industries in China’s national economy. Enhancing regional cooperative efforts by promoting culture and tourism can feature the talents and creativity of both entities. This type of cooperation has become an important force driving social and economic growth under the new economic conditions (PRC NDRC 2020). From the perspective of spatial economics, the spatial externality of the collaborative development of consortiums made up of businesses that combine public relations, advertising, technology, and economic acumen to promote the culture and tourism industries not only strengthens and expands industrial spatial patterns, but it also stimulates the overall economy. Since 2018, when China first proposed the strategy of coordinated development of culture and tourism industries its related issues have gained a wide range of public interest, including some concerns. Despite the advances made during pre-pandemic growth, the current level of collaborative agglomeration in the Chinese culture and tourism industries is still low, the spatial correlation between the two cultural and tourism industries in various regions is unbalanced, and the economic effects of the cultural and tourism industry collaboration is not yet prominent. During this critical period of Chinese culture and tourism transformation, it is important to explore the spatial–temporal evolution characteristics of the collaborative networking of these two industries. Their economic prosperity depends on promoting the high-quality development of the regions’ cultural heritage, as well as its innovative growth with support from community businesses who are willing to support artisans and tourism with financial incentives as well as advertising, and cooperation in establishing venues that can benefit everyone.
Currently, the results of many studies have shown that the united efforts of industrial consortiums must be based on industrial relevance. In other words, stakeholders representing industry must ensure the development of extensive and highly identifiable regional production based on technological advancements and applied economics. Malmberg [1] confirmed that different types of industries can form the industrial economic phenomenon known as collaborative agglomeration, but these industries need to be industrially similar, and their industrial boundaries need to be expandable. The message in [1] promotes the idea that industrial collaborative agglomeration is achieved through communication and interaction between industries. Separately, the culture and tourism industries have a natural connection in the development process. The tourism industries can promote the development and dissemination of the cultural industries, and the cultural industries can promote the sustainable and healthy development of the tourism industries. At present, Western scholars’ research on the collaborative agglomeration of the positive interactions of the two industries has focused on the effects of cultural activities [2], cultural products [3], and festivals [4]. Such events benefit both the cultural and tourism industries, allowing both industries to integrate their assets and form a stronger combined culture and tourism service, which also promotes the coordinated development of their shared economic goals [5,6,7]. However, Hughes [8] approached combining the cultural attraction of the performing arts and the potential of the tourism industries to prove the strength of this combination for future growth. The findings showed that in the process of communication and interaction between the cultural and tourism industries, the industrial boundaries gradually blur, thereby achieving industrial integration and promoting economic development. Notably, in 2014, the integration level of culture and tourism industries was low. Nurse [9] used the Port of Spain’s Trinidad Carnival to describe the effects of this festival on the tourism and cultural industries and economically evaluated the 2004 festival. The 2021 Trinidad Festival was cancelled due to COVID-19 risks, but the 2022 festival is scheduled to continue with a ban on street parties. COVID-19, with all its variants, has affected the economic stability of the cultural and tourism industries worldwide. Shepherd [10] also analyzed the problem of the collaborative agglomeration of the culture and tourism industries, finding that the layout of local cultural tourism industries had a substantial impact on the coordinated development of the regional economy, fair distribution of social resources, and sustainable development of resources and environment. Joun et al. [11] analyzed the impact of industrial productivity on regional development by taking South Korea’s cultural tourism industry as an example. The findings showed that the transformation and upgrading of the cultural and tourism industries was conducive to promoting regional development, and the impact on cities with low levels of urbanization was stronger. Therefore, a strong coupling coordination relationship exists between the cultural and tourism industries, and the rationalization and balance of the spatial structure of these industries is conducive to the balanced and stable development of the region.
Chinese research on the collaborative agglomeration of the culture and tourism industries mainly started from the perspective of industrial integration, which involved analyzing the interactive relationship [12], agglomeration power [13], and agglomeration paths between the objectives of the cultural authenticity and economic incentives of the tourism industries [14], as well as the feasibility of the agglomeration mechanism as it relates to industrial collaborative agglomeration [15,16,17]. Peng et al. [16] qualitatively found that the culture and tourism industries had a coupling relationship, and their coordinated and concentrated development could effectively reduce the negative impact of fluctuations in economic, resource, social consumption, and other factors. Hao et al. [17] focused on the power of the cultural and tourism industries’ collaborative agglomeration. They stated that the culture and tourism industries can form a new cluster through industrial exchange and restructuring under the promotion of scientific innovation and industrial policies. As such, a new form of cultural tourism industries could be formed. Some scholars have also analyzed the coupling relationship between the culture and tourism industries with the help of quantitative analysis methods. The findings have shown that the culture and tourism industries have a strong coupling relationship, and the knowledge, economic, and resource spillover effects of the industry are important factors promoting industrial coordination and agglomeration. The purpose of industrial collaborative agglomeration is to promote the horizontal and vertical extension of cultural and tourism objectives, so as to create a new industrial form [18,19,20,21]. Some scholars also analyzed the impact of the collaborative agglomeration of cultural and tourism industries on regional economy from the perspective of economics, finding that it effectively promoted the development of cultural and tourism industries and positively impacted economic growth, production efficiency, and industrial professionalism. However, excessive industrial can agglomeration negatively impact industrial structure and economic development [22,23,24]. Niu [25] analyzed culture and tourism industries clusters, which were built on the relationship between developed and underdeveloped cities, and confirmed that the collaborative agglomeration of cultural and tourism industries could promote regional economic growth; however, the spatial imbalance in industrial structure changes led to regional economic growth differences. Therefore, the collaborative agglomeration of the culture and tourism industries is a new trend in China’s industrial development, but excessive industrial agglomeration will lead to diseconomies of agglomeration. The rational spatial layout of the Chinese cultural and tourism industries is an important in achieving agglomeration economy.
The preceding literature review shows that the collaborative agglomeration of the culture and tourism industries is a dynamic process. Furthermore, according to the theory of spatial economics, the collaborative agglomeration of the culture and tourism industries is not a simple superposition of industrial resources dominating the interactions, but a dynamic evolutionary process based on the relationship of industrial and cultural space interaction. However, most current studies on the collaborative agglomeration of culture and tourism industries have only considered factors at the industrial level. Despite the importance of industrial and cultural agglomeration research, the spatial–temporal evolutionary characteristics of the collaborative agglomeration of culture and tourism industries are still very weak. In addition, as an important spatial economic phenomenon in the modern urban economy, the economic effect of the collaborative agglomeration of culture and tourism industries must be discussed, analyzed, and summarized by several researchers and leaders in current industry and cultural collaboration before a complete analytical framework can be formed.
This study focused on the theory of spatial economics and the industry–space relationship of culture and tourism industries. The authors analyzed the spatial–temporal evolution characteristics of the collaborative partnerships of the cultural and tourism industries as well as the economic effects on a regional level of industrial collaborative agglomeration. First, we analyzed the correlation degree between the culture and tourism industries, using the coupling coordination degree model. Then, a spatial correlation test model was used to analyze the spatial–temporal evolutionary characteristics of the collaborative results of the two industries. Finally, we used the spatial vector autoregressive model and impulse response function to analyze the economic effect of the culture and tourism industries. The research object of this study covered 31 provinces in China (excluding Hong Kong, Macao, and Taiwan). Our objective was to provide countermeasures and suggestions for the development, transformation, and upgrading of the cultural and tourism industries. During the course of our research, we expanded the research perspective of industrial collaborative agglomeration, enriched the research ideas of spatial economics on industrial collaborative agglomeration, and clarified the spatial–temporal evolution characteristics and economic effects of Chinese cultural and tourism industries’ collaborative agglomeration. Thus, this paper can provide a new theoretical basis for the optimization of the spatial structure of Chinese cultural and tourism industries and the development of industrial collaborative agglomeration, and it can also be used as a reference for the development of cultural and tourism industries’ agglomeration in other countries in the world.
The contributions of previous studies compared with this paper are as follows: First, based on the industry–space relationship of the Chinese culture and tourism industries, this study considers the spatial factor when analyzing the collaborative agglomeration or spacing based on regional connections of cultural industries and tourism industries, and clarifies the spatial–temporal evolution characteristics of the collaborative networking of the Chinese culture and tourism industries. Secondly, this study takes the industrial collaborative agglomeration as the starting point, forming a theoretical analysis framework of industrial collaborative agreement based on, industrial spatial–temporal evolution characteristics, and the subsequent economic analyses, which can clarify the impact of the cultural and tourism industries’ collaborative acceptance and promotion of the regional economy. Finally, the research methods of this paper combine mathematical models and spatial econometric analysis methods. Compared with a single research method, the methods of this research are more suitable for China’s heterogeneous spatial characteristics and can effectively avoid the bias of empirical analysis results.

2. Indicators and Methods

2.1. Indicators

To accurately measure the spatial–temporal evolution characteristics and economic effects of China’s culture and tourism industries, we constructed two evaluation index systems of the two industries to provide data support for our follow-up quantification. In terms of indicator selection, the existing research results show that industrial resources, market demand, talent demand, and other factors affect the development trend of the collaborative agglomeration of the cultural and tourism industries [26,27,28]. In terms of industrial resources, first, the financial expenditure and industrial income of the cultural and tourism industries are the bases for promoting industrial development and industrial synergy and agglomeration. In addition, cultural and tourism resources are strongly correlated. Cultural centers, museums, and other cultural units are not only material cultural units that provide spiritual products but also indispensable resources in the tourism industries. In terms of talent demand, employees in the cultural and tourism industries are the key to the operation of the industrial chain. In terms of market demand, the cultural and tourism industries, which are tertiary industries in China’s national economic system, are mainly created to meet people’s spiritual and cultural needs. Therefore, the degree of market demand for culture and tourism products is an important factor in industrial collaboration. Based on this, we selected the economic indicators related to the culture and tourism industries from the aspects of industrial resources, talent demand, and market demand. From the perspective of industrial composition, we divided the indicators into four categories: basic industrial situation, industrial institutions, employees, and industrial effects, as shown in Table 1.

2.2. Methods

2.2.1. Coupling Coordination Model

The coupling degree is used to measure the degree of interaction between different variables, and the coordination degree reflects the degree of coordinated development between the variables. The coupling coordination degree not only represents the degree of interaction between variables but also measures the development level of the variables. Since many factors affect the development trend of the cultural and tourism industries, to more accurately and comprehensively evaluate the degrees of coupling and coordination between the two industries in various regions of China, we considered the cultural and tourism industries as two interacting systems. First, we used the entropy method to calculate the comprehensive evaluation values of both the cultural and tourism industries in various regions in China under the influence of multiple industrial factors. Second, we used the coupling coordination model to analyze the degrees of coupling and coordination between the culture and tourism industries. We used the following mathematical expressions to accomplish these tasks:
We used the entropy method to calculate the comprehensive evaluation value of the industry. Assume that there are m regional samples and n evaluation indicators at time t :
p i j = x i j i = 1 m x i j ,   ( i = 1 , 2 , , m ; j = 1 , 2 , n )
e i j = 1 ln ( m ) × i = 1 m p i j ln ( p i j )
w i j = 1 e i j i = 1 n ( 1 e i j )
s i = j = 1 n w i j × p i j ,   ( i = 1 , 2 , , m )
where x i j is the value of index j in region i at time t ; p i j is the proportion of region i in indicator j , 0 p i j 1 ; e i j is the entropy value of indicator j ; w i j is the weight value of indicator j ; and s i is the comprehensive evaluation value of the industry in region i at time t.
We used the coupling coordination model to calculate the coupling coordination degree of the culture and tourism industries.
X = α x i + β y i
Y = ( x i × y i ) ( α x i + β y i ) 2
D = X × Y
where x i and y i represent the evaluation value of the cultural and tourism industries in province i , respectively; these two indicators are calculated with Formulas (1)–(4). X represents the coordination index of the culture and tourism industries; α and β are the system importance coefficients of the cultural and tourism industries, respectively, where α + β = 1; C represents the coupling degree between the cultural and tourism industries, C ( 0 , 1 ) ; and D represents the coupling and coordination between the culture and tourism industries, D ( 0 , 1 ) . As the culture and tourism industries have the same degree of importance, α = β = 0.5 . Based on the coordination degree standard division principle of the coupling coordination degree model proposed by Peng [16] and Yu [29], the coordination degree classification standard of the culture and tourism industries that we constructed in this study is shown in Table 2.

2.2.2. Spatial Correlation Test

The spatial correlation test is a statistical analysis method used to explain whether certain variables are spatially related. It is often used to quantitatively describe the spatial dependence between variables, and it includes spatial autocorrelation (global Moran’s I (GMI)) and the cluster and outlier analysis (local Moran’s I (LMI)).
(1)
GMI: In this study, we explored the overall correlation between the culture and tourism industries through GMI. Its mathematical expression can be given as:
I i = ( N S 0 ) × ( i = 1 n j = 1 n W i j ( X i X ¯ ) ( X j X ¯ ) ) i = 1 n j = 1 n W i j ( X i X ¯ ) 2
where I i is the global spatial autocorrelation index of the culture and tourism industries in a region i ; N = 31 represents the research sample of 31 provinces and cities in China (excluding Hong Kong, Macao, and Taiwan); S 0 represents the standardization elements, and its value is the weight matrix element; X i and X j represent the observed values for regions i and j , respectively; X ¯ is the average of the observations of variable X ; and W i j is the spatial weight matrix, which is used to represent the relationship between spatial data. When Moran’s I > 0, the spatial correlation is positive; that is, agglomeration exists in the spatial distribution of the culture and tourism industries. When Moran’s I < 0, the spatial correlation is negative; that is, a dispersion exists in the spatial distribution of the culture and tourism industries. When Moran’s I = 0, the variables are spatially independent; that is, no correlation exists in the spatial distribution of the cultural and tourism industries.
(2)
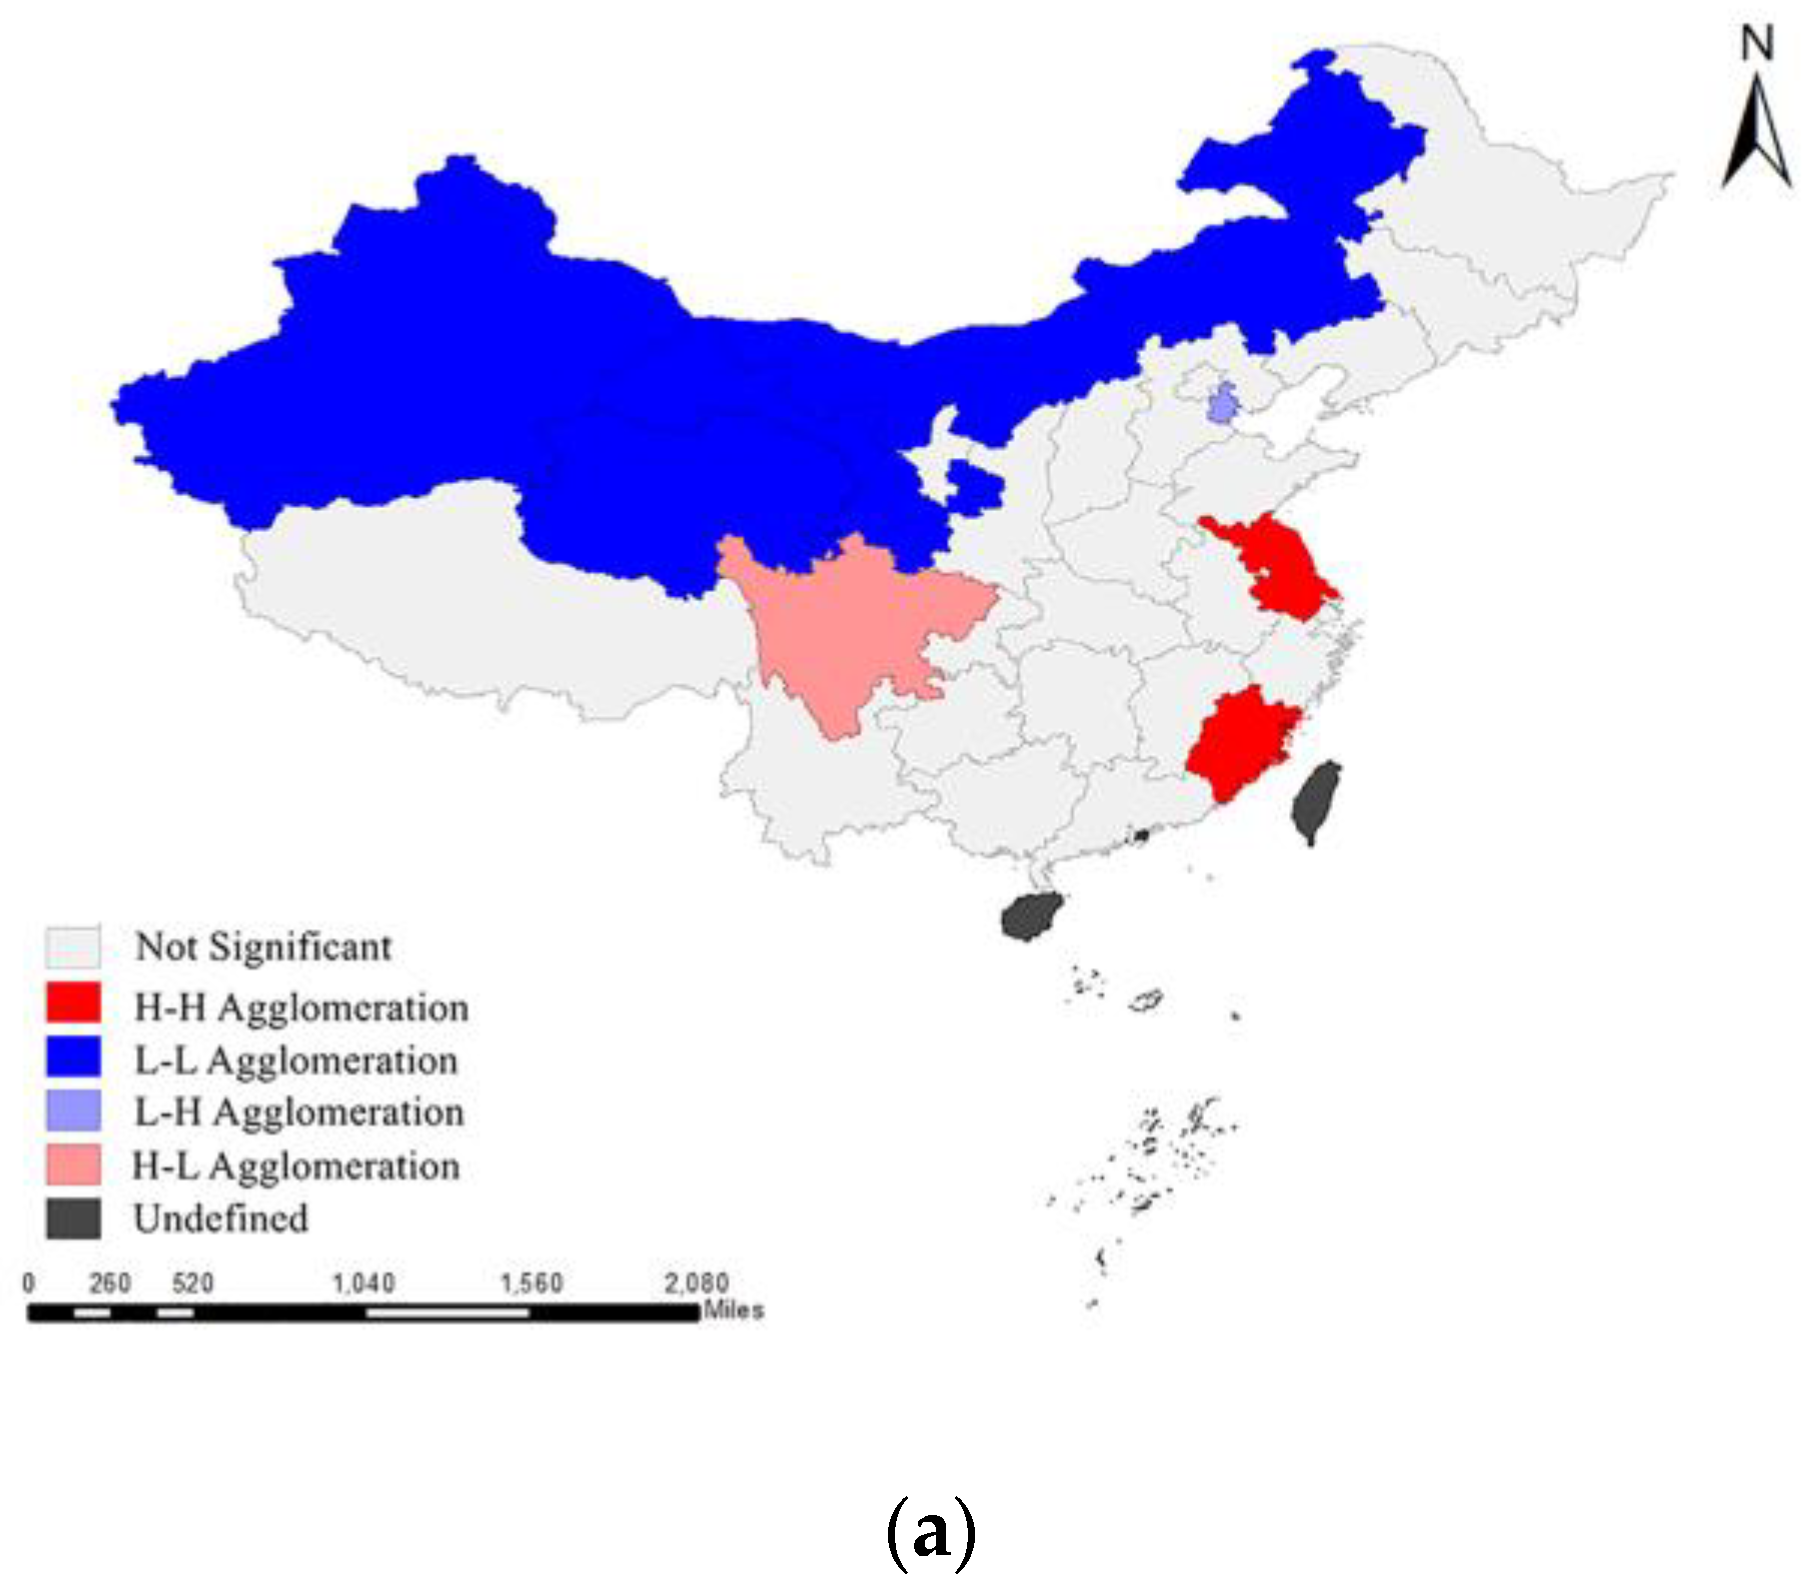
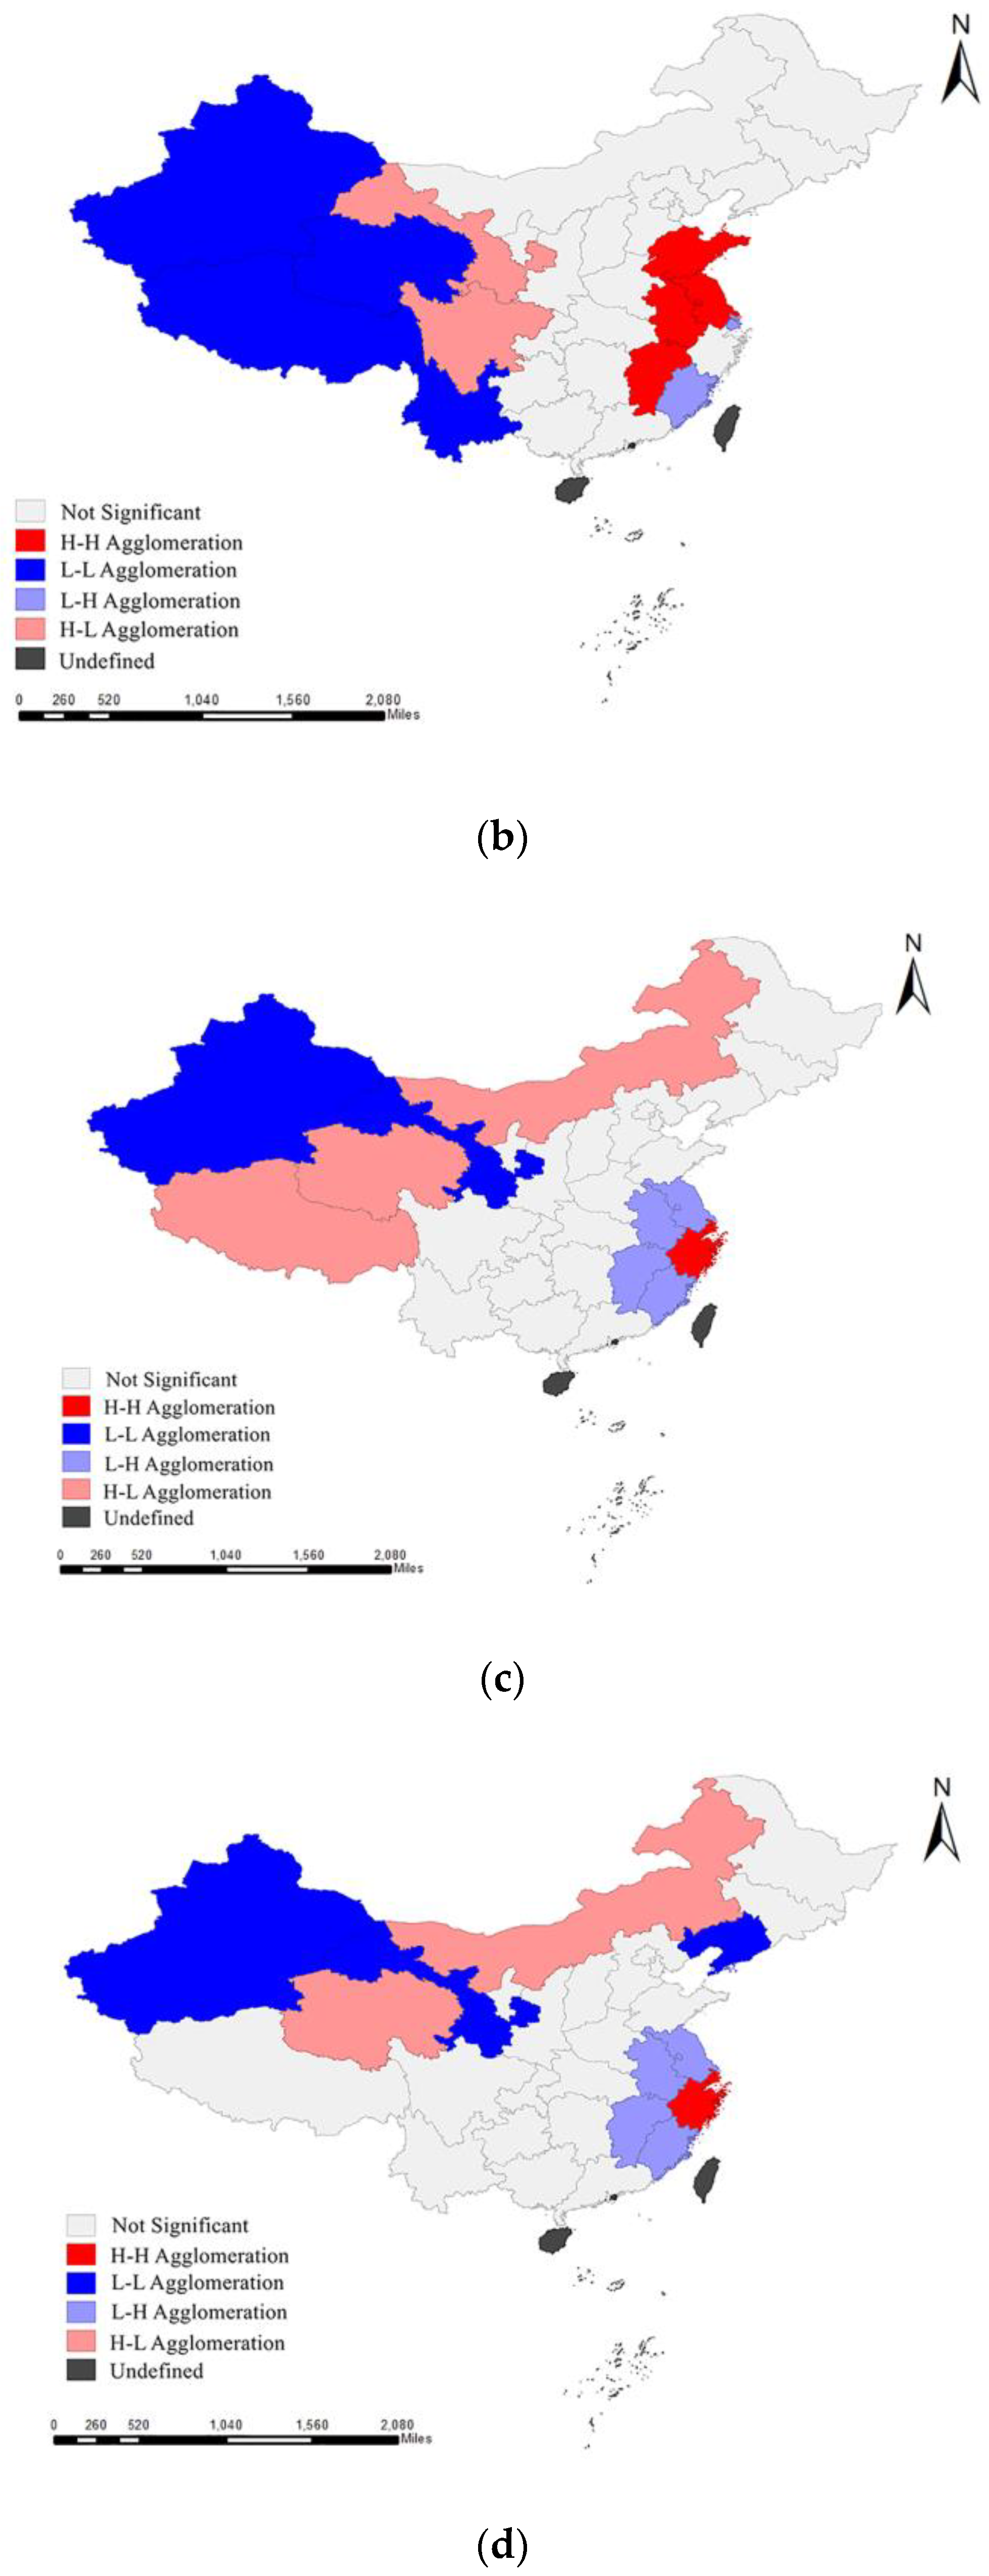
Local Moran’s I (LMI): We analyzed the local correlation between the culture and tourism industries through LMI. Its mathematical expression is:
Z i = X i X ¯ S i 2 j = 1 n W i j ( X j X ¯ )
where Z i is the local spatial autocorrelation index of the culture and tourism industries in region i ; X i and X j represent the observed values in regions i and j , respectively; S i 2 represents the variance of the observed value for region i ; W i j is the spatial weight matrix; and X ¯ is the average of the observations of variable X . The results of LMI are generally presented using the Moran scatter chart, which can be divided into four quadrants. These quadrants represent the four spatial association modes representing themselves and its adjacent spatial units. Among them, the first quadrant represents high–high agglomeration (H–H); that is, the observed values of itself and adjacent spatial units are high. The second quadrant is a low–high concentration (L–H), meaning that the low observation value area is surrounded by the high-observation-value areas. The third quadrant is low–low agglomeration (L–L), which means that the observed values of itself and its adjacent spatial units are low. The fourth quadrant is high–low agglomeration (H–L), which refers to a high-observation-value area surrounded by low-observation-value areas.

2.2.3. Spatial Vector Autoregressive Model

At present, the commonly used spatial spillover effect analysis models of industrial collaborative agglomeration include the spatial lag model, which is used to study industrial spatial dependence, and the spatial error model, which is used to study industrial spatial heterogeneity. However, Duygu’s findings confirmed that industrial collaborative agglomeration is affected by the above two transmission mechanisms [27]. Therefore, we used the spatial vector autoregressive model, including the mechanisms of industrial spatial lag and heterogeneity, to analyze the economic effect of the culture and tourism industries. The spatial vector autoregressive model is based on the statistical properties of the data. The model considers each endogenous variable in the system as a function of the lag value of all endogenous variables in the system, which extends the univariate autoregressive model to the vector autoregressive model. The autoregressive model is composed of multivariate time series variables, which can be expressed as:
Y t = A 1 Y t 1 + A 2 Y t 2 + + A p Y t p + ε t
where Y t is the K-dimensional endogenous variable vector, including the degree of collaborative agglomeration of the culture and tourism industries and the degree of regional economic growth; A p is the corresponding coefficient matrix; and P is the optimal lag order of the endogenous variable. Finally, we analyzed the stability of the model by calculating the eigenvalues of the spatial vector autoregressive model. We analyzed the dynamic relationship between the degree of collaborative agglomeration of the culture and tourism industries and the degree of regional economic growth with the impulse response function and variance.

2.2.4. Impulse Response Function

As the spatial vector autoregressive model is a non-theoretical model, it could only analyze whether a relationship exists between the collaborative agglomeration of cultural and tourism industries and the degree of economic development and could not analyze the change in the trend in the dependent variables when different independent variables changed at different times. The impulse response function is often used to describe the impact of different independent variables on the change in the trend in the dependent variables of a system at different times. Therefore, based on the results of spatial vector autoregression model, we analyzed the development trend of China’s economy under the influence of economic indicators related to culture and tourism industries with the help of the impulse response function. The mathematical expression is:
δ y ( t ) = 0 t x ( τ ) g ( t τ ) d τ
where t is the impact period of the impulse response function; x ( τ ) is the independent variable of the impulse response function for impact period t = τ ; g ( t τ ) is the pulse attenuation index of the input variable for impact period t = τ ; and δ y ( t ) is the output value of the impulse response function of the dependent variable y under the impact of the independent variable x ( t ) during impact period t.

3. Empirical Analysis

3.1. Coupling and Coordination Degree of Culture and Tourism Industries

After constructing the index system of evaluating the culture and tourism industries’ collaborative agglomeration (Table 1), we used the coupling coordination degree model to analyze the coupling coordination degree between the culture and tourism industries in 31 provinces and cities in China from 2010 to 2019. From the time perspective, we first use SPSS software to calculate the comprehensive evaluation value of the cultural and tourism industries in various regions in China according to Equations (1)–(4). Second, according to Equations (5)–(7), we calculated the coupling coordination degree of the culture and tourism industries. Finally, we calculated the average value of the coupling coordination degree between the culture and tourism industries in the 31 regions in China (excluding Hong Kong, Macao, and Taiwan regions) year by year, which we used as the time coupling coordination degree between the Chinese cultural and tourism industries. The time coupling coordination degrees of the culture and tourism industries in selected study regions are shown in Figure 1.
As shown in Figure 1, the Chinese culture and tourism industries overall showed a coupling and coordinated development trend from 2010 to 2019, and its coupling and coordination degree has experienced three stages of rising, falling, and then rising again. This is basically consistent with the research results of Zhou et al. [30] on the coupling and coordination of China’s cultural industry and tourism industries.
The degree of coupling and coordination between the Chinese culture and tourism industries substantially increased by 20% from 2010 to 2012. This occurred owing to the rapid development of tourism, which was driven by the Chinese economy, especially since China’s implementation of free and open policies in 2009. After the policy on cultural venues opened them to the public, the number of visitors of cultural museums considerably increased. Visits to the Palace Museum, which is the former imperial palaces of the Forbidden City in Central Beijing, have helped drive the development of cultural institutions. Although the degree of coupling and coordination between the cultural and tourism industries increased from 2012 to 2014, the increase has remarkably slowed, only 2.5%. This occurred owing to reduced government and official services in China during this period, which led to a reduction in the efficiency of Chinese starred hotels and cultural and entertainment venues. This affected the development trend of the Chinese cultural industries and the overall development of the Chinese cultural and tourism industries to a certain extent. From 2014 to 2017, the coupling degree of the culture and tourism industries showed explosive growth again due to the rapid economic development at the time. This resurgence of tourism resulted in a transformation of the structure of the culture and tourism industries. In 2017 and 2018, the degree of coupling between the cultural component of tourism and the tourist industry itself decreased. This occurred owing to vigorous Chinese government support for nonpublic art performance groups and venues during this period. In 2018 and 2019, the degrees of coupling and coordination between the Chinese culture and tourism industries rose again owing to the Third Plenary Meeting of the 19th Central Committee of the Communist Party of China establishing the Ministry of Culture and Tourism. The new ministry promoted the coupled development of culture and the tourism industries. After the COVID-19 outbreak in 2020, industries and economies worldwide have struggled. Chinese cultural and tourism industries have also been seriously affected. The Chinese government should once again explore new industrial development mechanisms to ensure the stable development of the two industries in the post-pandemic era.
At the spatial level, we also used SPSS software to calculate the comprehensive evaluation value of the cultural and tourism industries in various regions of China with Equations (1)–(4). We then calculated the temporal coupling coordination degree of the culture and tourism industries in 31 regions of China (excluding Hong Kong, Macao, and Taiwan) according to Equations (5)–(7). We visualized the results with ArcGIS. Based on the trend in the temporal coupling and coordination of the culture and tourism industries (Figure 1). From 2010 to 2019, the years 2017 and 2018 in China’s culture and tourism industries were the time nodes of the transition between three stages increasing, decreasing, and then increasing. Therefore, we calculated the degree of spatial coupling and coordination of the Chinese culture and tourism industries, and selected the distribution map of spatial coupling and coordination in 2010, 2017, 2018, and 2019 for display, as shown in Figure 2.
As shown in Figure 2, the spatial coupling degree of the Chinese culture and tourism industries has widely varied. In terms of geographical location, the coupling degree of the culture and tourism industries has been strongly correlated with space, and the coupling degree gradually decreased from the coast to the interior. In terms of economic level, cities with high levels of economic development have had a higher degree coupling between the culture and tourism industries. For example, the coastal areas such as Zhejiang, Jiangsu, and Shanghai have experienced rapid economic development, possess rich cultural and tourism resources, and offer convenient transportation; thus, these areas have more collaborative agglomeration development strategies for the local culture and tourism industries. They also have an enhanced degree of coupling between them. In other less developed areas, lower expectations are set. For example, Tibet, Qinghai, Ningxia, and other inland areas have a relatively backward economic development level. Their remoteness and inconvenient transportation results in a low degree of cultural and tourism industry coupling and a poor industrial development level.

3.2. Spatial Correlation between Culture and Tourism Industries

We found that the coordination degree and spatial distribution of the Chinese culture and tourism industries was strong. To further explore the spatial–temporal evolution characteristics of Chinese culture and tourism industries, we used the spatial correlation test model to analyze the spatial–temporal evolution process between the two industries based on the research ideas of Wang et al. [31]. First, we calculated the GMI. According to Equation (8), the global spatial autocorrelation indexes of the 31 provinces and cities in China from 2010 to 2019 are shown in Table 3.
According to the structure of the global autocorrelation test, Moran’s I was less than zero at the confidence level of p < 0.5 from 2010 to 2019, which indicates an overall spatial positive correlation of the collaborative agglomeration of Chinese culture and tourism industries, making them relatively significant. From 2010 to 2019, the overall autocorrelation degree of the Chinese culture and tourism industries was positive as a whole. The nodes in the correlation degree were 2015 and 2019 for the three stages of the rise–decline–rise pattern. The GMI of the culture and tourism industries increased each year from 2010 to 2014, indicating that the degree of collaborative agglomeration in the Chinese culture and tourism industries increased each year during this period. From 2014 to 2018, the GMI slightly declined, but the relationship between the culture and tourism industries was still positive, indicating that although a cooperative agglomeration relationship existed between the Chinese culture and tourism industries at this stage, the degree of spatial agglomeration had weakened. The GMI slightly rebounded in 2019, indicating that the establishment of the Ministry of Culture and Tourism in China had played a role in promoting the development of the culture and tourism industries, which further promoted the collaborative agglomeration development of the two industries.
To further explore the spatial correlation between provincial and urban culture in the tourism industry, we used the LMI t, according to Formula (9). According to the GMI results, we divided the collaborative agglomeration of the Chinese culture and tourism industries from 2010 to 2019 into three stages with 2015 and 2018 as the time nodes. The clustering diagram of the LMI results in 2010, 2015, 2018, and 2019 is shown in Figure 3.
Figure 3 shows that the coordination of the Chinese culture and tourism industries is still low. The local spatial correlation in the coastal areas was generally higher than that in inland areas. The results showed that from 2010 to 2019, the local spatial correlation between the Chinese culture and the tourism industries decreased each year in the L–L agglomeration regions but first expanded and then decreased in the H–H regions. Meanwhile, slight expansions occurred in the H–L and L–H agglomerations, but the effect of industrial spatial linkage was weak.
The local spatial correlation has been high for coastal areas such as those found in Zhejiang, Jiangsu, and Fujian. Moreover, the local spatial correlation was relatively high, especially in the Zhejiang Province, which has experienced more collaborative agglomeration development in the culture and tourism industries. This shows the Zhejiang Province leaders as having led a better development effort resulting in a coordinated cluster development of culture and tourism industries in adjacent regions, with exceptional industrial spatial linkage effects in adjacent regions. Some central areas such as Jiangxi and Anhui were in an L–H agglomeration stage, which indicated that the spatial correlation between culture and the tourism industries in the central areas was low; thus, the positive effect of the adjacent regions on the industrial collaboration and agglomeration in these areas was not obvious. These areas formed regional development differences under the influence of the spatial polarization effect. The local spatial correlation of culture and tourism industries in Western China had two stages: H–L agglomeration and L–L agglomeration. Qinghai, Tibet, Inner Mongolia and other regions had a high degree of spatial agglomeration, which should have been an asset to the culture and tourism industries, but they were surrounded by low agglomeration areas, indicating that these areas had no obvious driving effect on the surrounding provinces, and regional cooperation was difficult. The governments should strengthen assistance to the surrounding provinces and promote cross-regional cooperation. Due to the relatively lagging level of economic development and transportation infrastructure conditions, some provinces, such as Xinjiang and Gansu, were always in the lower L–L agglomeration stage during the study period. These provinces still need to vigorously support integrated business development and strengthen cooperation with surrounding provinces.

3.3. Economic Effect Test of Collaborative Agglomeration of Culture and Tourism Industries

To further explore the impact of the collaborative culture and tourism industries on economic development, we used the spatial vector autoregressive model to analyze the economic effect. First, we used GDP growth to represent the economic effect of the collaborative networking of the regional culture and tourism industries. Secondly, we used the index system representing the collaborative agglomeration of culture and tourism industries, as shown in Table 1. The index system is an independent variable and Chin’s GDP data are the dependent variables. Finally, we used the bivariate correlation analysis in SPSS software to screen out the strongly correlated variables. The independent variables after screening were per capita cultural expenses ( C 1 ), proportion of cultural establishments in financial expenditures ( C 2 ), proportion of added value of culture and related industries in GDP ( C 3 ), domestic tourism revenue ( T 3 ), proportion of tourism revenue in GDP ( T 4 ), and per capita daily tourism foreign exchange revenue ( T 5 ). Then, we calculated the likelihood function (LR), final prediction error (FPE), Akaike information criterion (AIC), Schwartz information criterion (SC), and Hannan Quin (HQ) indices, which showed that the model’s lag time was two. Finally, with China’ GDP data from 2010 to 2019 as the dependent variable and the national average of the six selected economic indicators as the independent variables, we constructed a spatial vector autoregression model based on formula (10), with the help of EViews 10 to analyze the relationship between the agglomeration and economic development of China’s cultural and tourism industries. The result was:
Y t = [ 0.824 0.452 0.743 0.620 0.649 0.227 0.043 0.091 0.118 0.042 0.322 0.246 0.226 0.299 2.105 0.997 0.255 2.313 0.055 3.679 0.597 0.186 1.005 0.199 0.841 0.488 0.909 0.629 0.830 1.881 0.936 0.722 0.621 0.310 0.497 4.066 3.164 4.263 6.790 3.234 4.545 2.646 0.026 0.296 0.172 0.238 0.131 0.173 0.351 ] t 1 × [ y g d p x C 1 x C 2 x C 3 x T 3 x T 4 x T 5 ] + [ 0.218 0.149 0.472 0.667 0.397 0.913 0.110 0.360 0.033 0.020 0.042 0.080 0.050 0.733 2.105 0.371 1.145 1.155 1.603 2.493 0.825 0.148 0.503 0.147 0.558 0.715 0.385 0.145 0.324 0.375 0.791 0.741 1.053 0.242 1.067 3.269 0.177 2.708 0.329 5.328 0.281 5.627 2.511 1.748 0.029 1.157 0.642 0.264 1.702 ] t 2 × [ y g d p x C 1 x C 2 x C 3 x T 3 x T 4 x T 5 ] + [ 1.029 0.016 1.170 0.306 0.976 2.480 0.290 ]
Through the calculation of the spatial vector autoregressive model, we found that the fitting effect of the model was good (goodness of fit R = 0.85 ). We found that the collaborative agglomeration of the Chinese culture and tourism industries were strongly correlated with China’s economic development. To further analyze the impact of different cultural and tourism industry economic indicators on China’s economic development trend at different times, we used the impulse response function to analyze the impact on China’s GDP of six economic indicators: per capita cultural expenses ( C 1 ), proportion of cultural establishments in financial expenditure ( C 2 ), proportion of the added value of culture and related industries in GDP ( C 3 ), domestic tourism revenue ( T 3 ), proportion of tourism revenue in GDP ( T 4 ), and per capita daily tourism foreign exchange revenue ( T 5 ). Since the data used in this study are related to the Chinese culture and tourism industries from 2010 to 2019, we set the impact period of the impulse response as 10. Using EViews 10, we obtained the impulse response function diagram according to Equation (11), as shown in Figure 4.
Figure 4 shows the effects of four indicators of (per capita cultural expenses ( C 1 ), domestic tourism revenue ( T 3 ), proportion of tourism revenue in GDP ( T 4 ), and per capita daily tourism foreign exchange revenue ( T 5 ))—all of which are positive. The impact of the two indexes—namely, the proportion of cultural establishments in financial expenditure ( C 2 ) and proportion of the added value of culture and related industries in GDP ( C 3 )—on the GDP fluctuated greatly in the early stage but had little impact on the GDP in the later stage.
Among the indicators that had a positive impact on GDP, it can be seen from Figure 4a that the per capita cultural expenses ( C 1 ) always had a positive impact on the GDP. This indicates that residents’ cultural consumption will increase the output value of cultural industry, thereby promoting the GDP growth, which also confirms the conclusion of Li [18]. However, the impact of this GDP indicator shows a fluctuating trend. During the first to third impact periods, the impact of per capita cultural expenses ( C 1 ) on the GDP showed an upward trend, but the impact of this index fluctuated and gradually decreased during the third to fifth impact periods. This occurred owing to the Chinese cultural industry being in the initial stage of development. At this time, the Chinese government GDP and official consumption were considerably lower, resulting in a year-after-year decline in the annual output value of the cultural industry and its impact on China’s GDP. However, the degree of impact increased during the fifth to sixth impact periods because of the steady transformation of the structural function in the Chinese cultural industry at this time and the gradual recovery of the development trend. During the sixth to eighth impact periods, the impact of per capita cultural expenses ( C 1 ) on GDP decreased again owing to the Chinese people’s vigorous support of nonpublic art performance groups and venues at this time, which affected the overall revenue of the cultural industry, resulting in a slight decrease in the positive impact on the Chinese GDP. After the eighth impact period, the impact of the per capita cultural expenses( C 1 ) on GDP rose again. This occurred due to the establishment of the Ministry of Culture and Tourism in China, which helped the culture and tourism industries gradually recover from the crisis; thus, the development of the culture and tourism industries was coordinated, and the steady growth of the Chinese economy was promoted.
As shown in Figure 4d, the domestic tourism revenue ( T 3 ) has always had a strong positive impact on the GDP, which indicates that domestic tourism revenue ( T 3 ), is an important part of the output value of the tourism industries, and it could effectively promote the development of the tourism industries, thereby promoting social and economic growth. However, the positive impact effect of this indicator on GDP gradually decreased in the second impact period. This is because, with the rapid development of China’s economy, the tourism industry’s status as a tertiary industry in the national economic system was weaker than that of the primary and secondary industries, which lessened the effect of their abilities to promote China’s economic growth. However, the impact of the domestic tourism revenue ( T 3 ) on GDP stabilized after the rapid development of the tourism industries in the seventh impact periods.
Figure 4e shows that the proportion of tourism revenue in the GDP ( T 4 ) always had a positive impact on GDP during the study period. The positive effect during the first and second impact periods was substantial. The impact effect in the second to fourth impact periods slightly decreased before stabilizing, because at this time, China allowed free access to museums and other cultural places, resulting in a slight decline in tourism revenue and a decrease in the contribution of this index to the GDP. During the fourth to fifth impact periods, the impact of this index on GDP was still positive, but the impact weakened because the Chinese government’s official consumption notably reduced at this time, resulting in the reduction in the revenue of the Chinese culture and tourism industries and the contribution to the GDP. After the fifth impact period, the impact of this index on the GDP strengthened. After the sixth impact period, it gradually tended to stabilize because the transformation and upgrading of the culture and tourism industries enhanced the collaborative agglomeration development of the industries to the point that the growth and development trend was gradually restored.
As shown in Figure 4f, the impact of the per capita daily tourism foreign exchange revenue ( T 5 ) on the GDP was positive overall. Even though the impact degree was usually unstable, in this case, it gradually tended to be stable, because the Chinese tourism industries were still in the early stage of development. The per capita daily tourism foreign exchange revenue was unstable every year. However, with industrial transformation, upgrading, and the coordinated development of the cultural industries, the overall development of the tourism industries has gradually stabilized, and its contribution to the GDP has also gradually and stably increased.
The impact of the two indexes: (1) the proportion of cultural establishments in financial expenditure ( C 2 ) and (2) the proportion of the added value of culture and related industries in the GDP ( C 3 ) causes the GDP to fluctuate greatly in the early stage but has little impact on the GDP in the later stage. Figure 4b shows that the proportion of cultural establishments in the financial expenditure ( C 2 ) strongly impacts the GDP in the early stage. In the first to second impact periods, this index was positive, but negative in the third impact period. This occurred due to the substantial reductions in government and official expenditures in China at this time, which resulted in a substantial decline in the revenue of the culture and tourism industries. However, the cultural industry expenditures did not fluctuate much, resulting in the negative total revenue of the cultural industries that year and a negative contribution to the GDP. During the fourth to sixth impact periods, the impact of this index on the GDP still fluctuated, but the fluctuation degree was relatively small owing to the rapid development of the Chinese economy. At this time, the Chinese cultural and tourism industries have gradually undergone a transformation in their structural kinetic energy, helping the culture and tourism industries to gradually emerge from crisis. After the seventh impact period, the impact of this index on GDP was relatively low, which indicated that China’s culture and tourism industries, as tertiary industries in the national economy, still had less impact on the level of economic development than the primary and secondary industries, although they had gradually achieved the transformation and upgrading of their industrial structure and became one of the trends in industrial normalization.
Figure 4c shows that the proportion of added value to cultural ventures and related industries that comprise the GDP ( C 3 ) negatively impacted the first two GDP impact periods. After China made its culture-based museums and other cultural venues free of charge in 2009, the revenue of museums considerably decreased, but their maintenance and labor fees increased. This led to a negative value owing to the revenue lost, so culture and related industries negatively contributed to the GDP. After the third impact period, the index first had a positive impact on the GDP but then gradually stabilized. This is because at this time, with the continuous transformation and upgrading of the industrial structure, the cultural and tourism industries achieved a preliminary coordinated development, which had a positive impact on the social economy. However, considering the long-term development trend, the role of the cultural and tourism industries in promoting the social economy still needs to be further strengthened.

4. Conclusions and Recommendations

Based on the theory of spatial economics and the industry–space relationship of culture and tourism industries in this study, we first analyzed the correlation degree between the culture and tourism industries using the coupling coordination degree model. Then, the spatial correlation test model was used to analyze the spatial–temporal evolution characteristics of the collaborative agglomeration of the two industries. Finally, we used the spatial vector autoregressive model and impulse response function to analyze the economic effect of the culture and tourism industries. We drew the following primary conclusions:
(1)
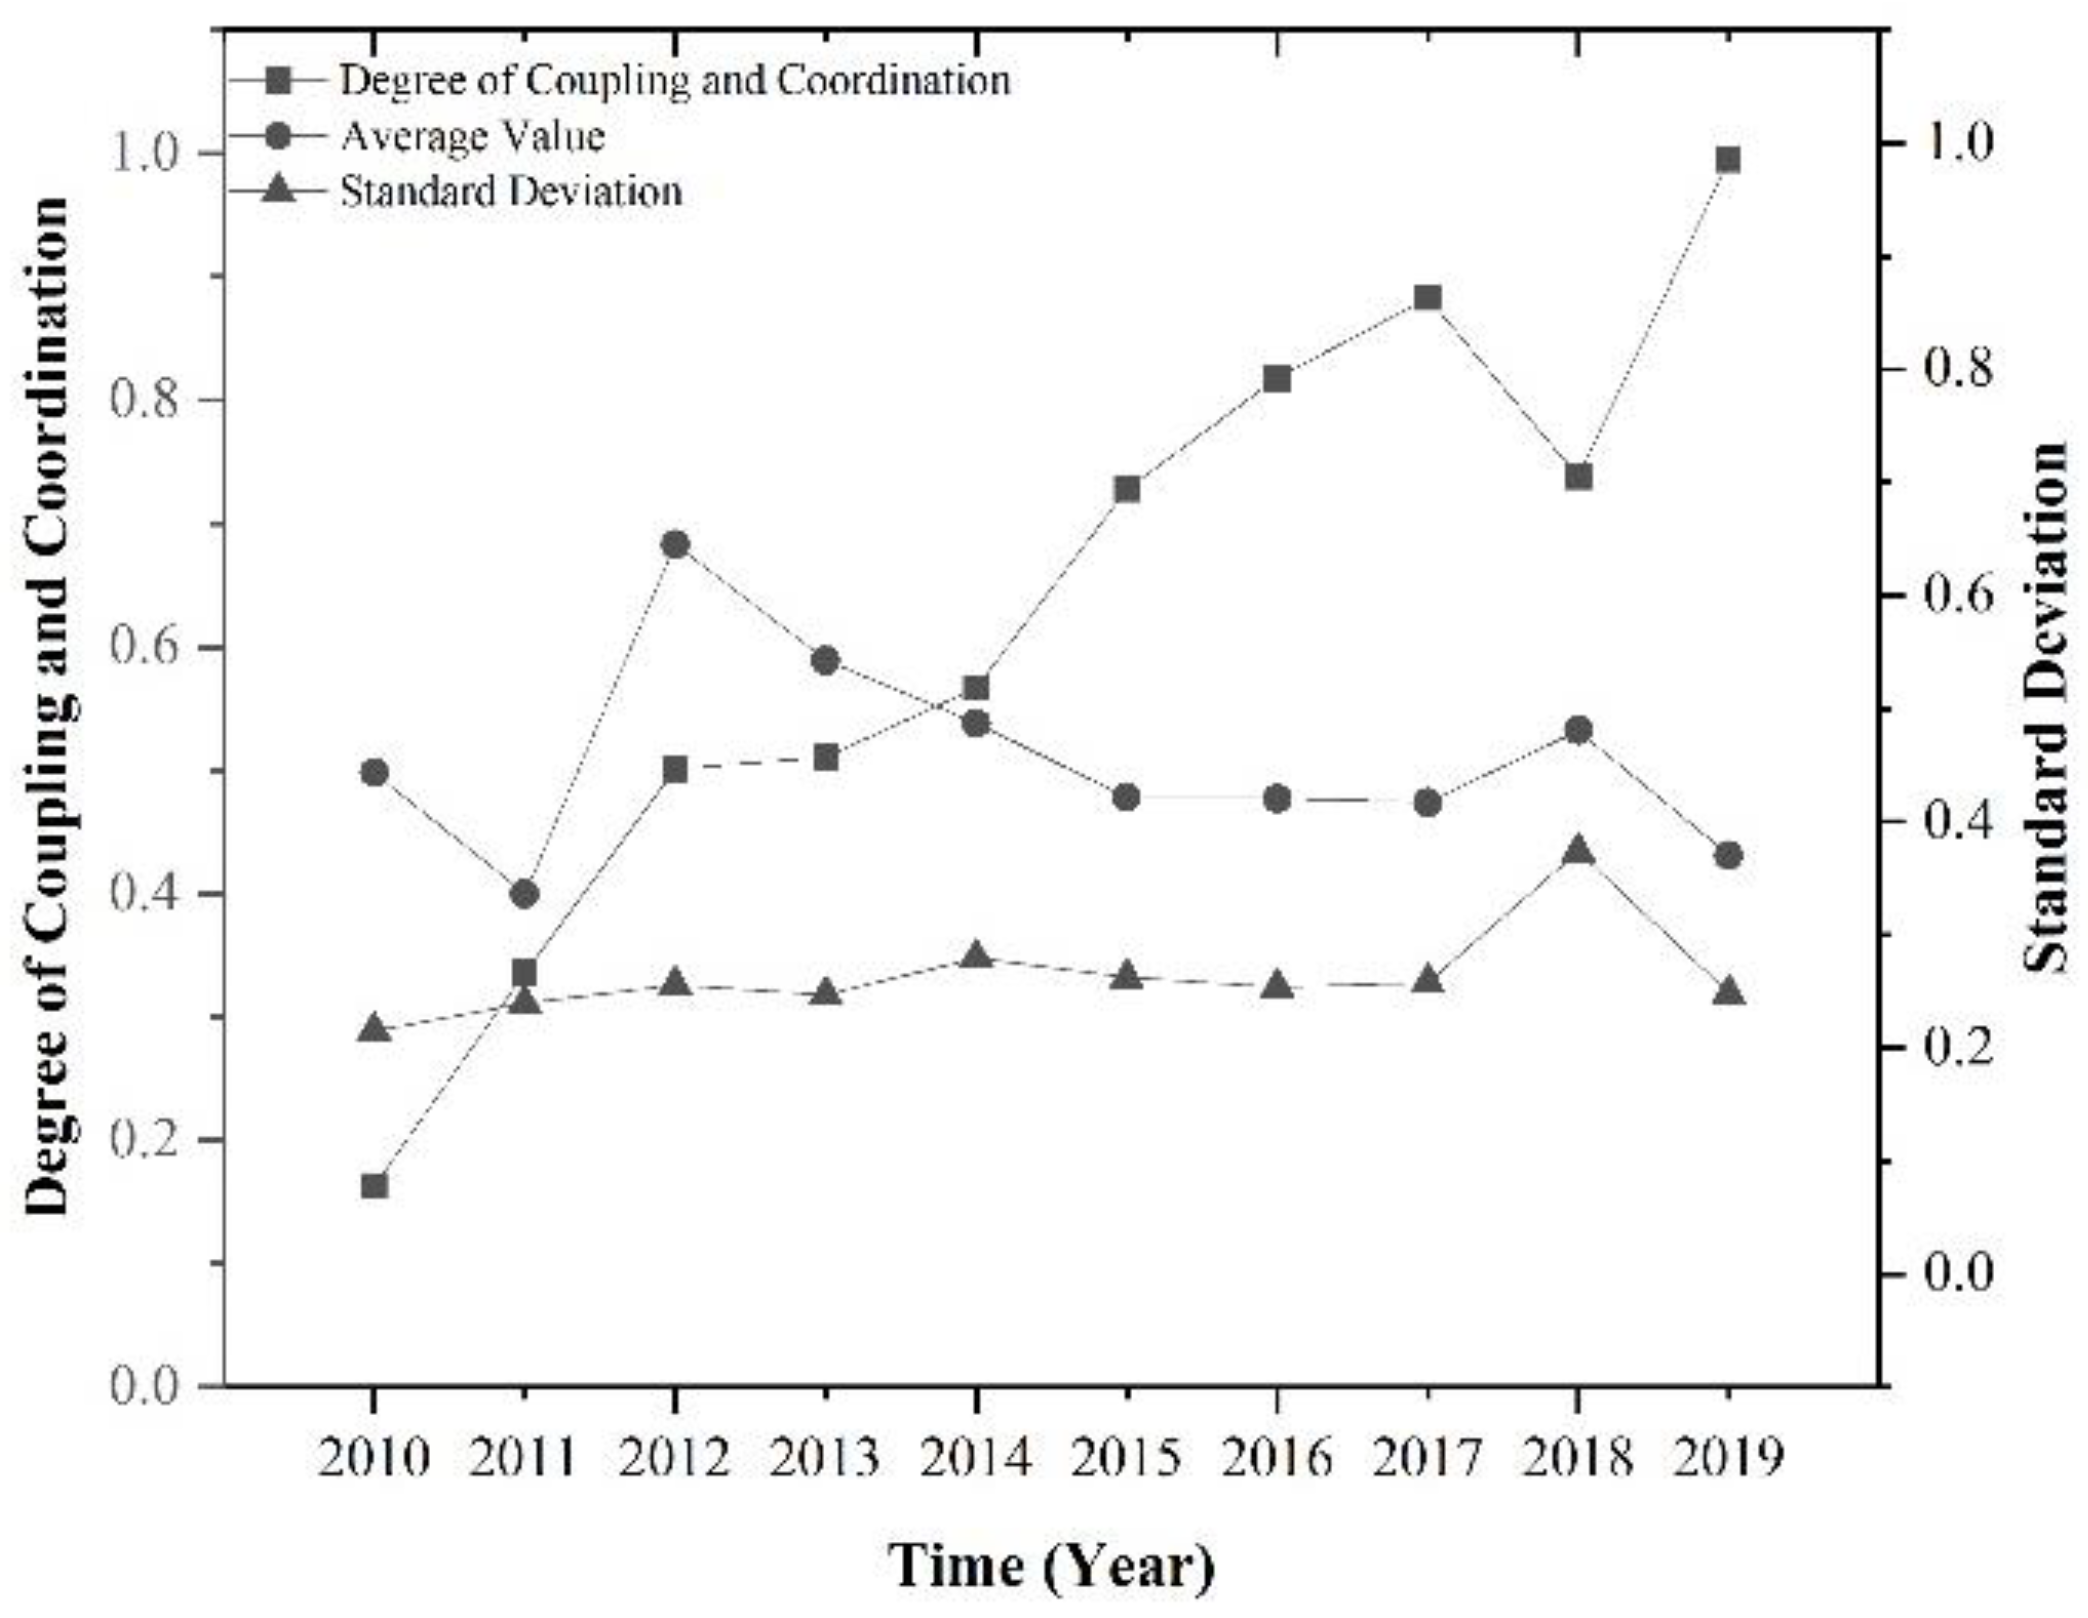
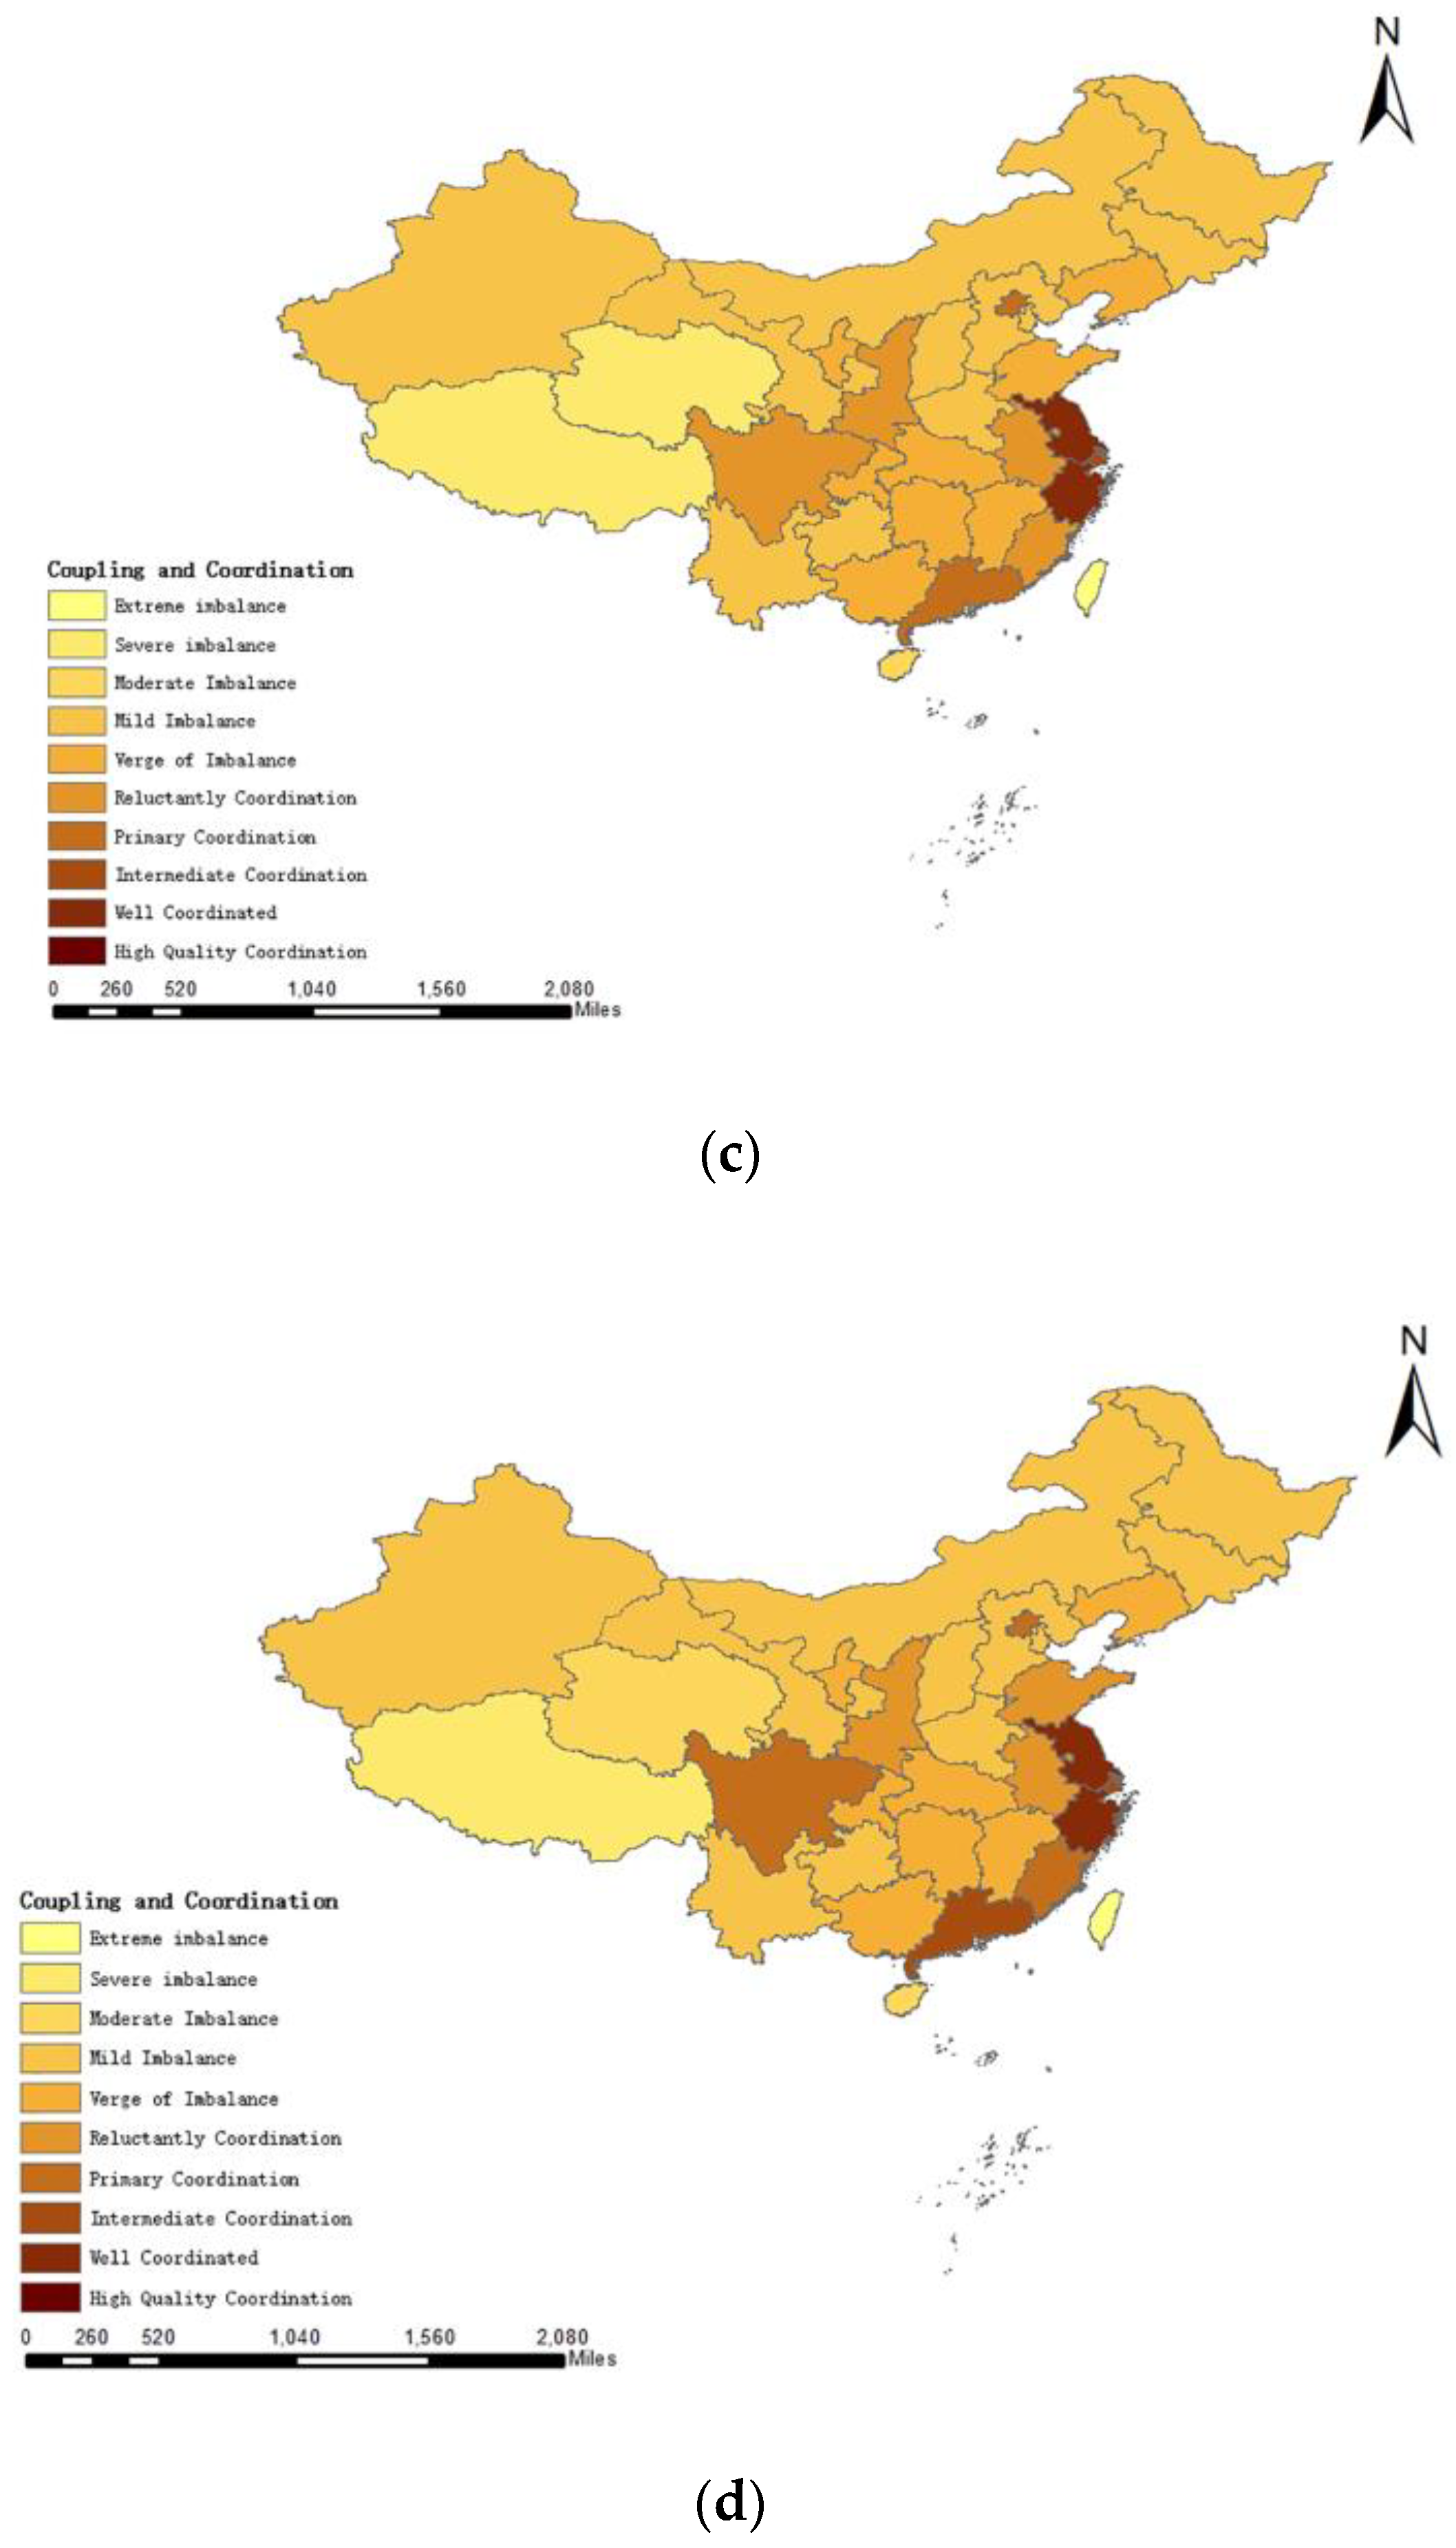
From 2010 to 2019, there was a coupling and coordination relationship between the China’s culture and tourism industries in 31 provinces, and the collaborative agglomeration between the two was in the primary stage. Temporally, the degree of coupling and coordination between Chinese culture and tourism industries showed a tendency to increase in fluctuation—namely, from 2010 to 2017 when the degree of coupling and coordination between the two industries was on the rise. From 2017 to 2018, this degree of coupling and coordination decreased slightly, and from 2018 to 2019, it rose again. Spatially, the collaborative agglomeration development of the culture and tourism industries was stronger in the coastal areas than in the inland areas, and the level of coupling and coordination gradually decreased from the coastal to inland areas.
(2)
From 2010 to 2019, the overall spatial positive correlation between the Chinese cultural and tourism industries in 31 provinces was significant, while the local spatial correlation was different. In terms of the overall spatial correlation, the overall spatial positive correlation of Chinese cultural and tourism industries increased significantly from 2010 to 2014. From 2014 to 2018, the overall spatial positive correlation of the two industries showed a downward trend. However, the overall spatial positive correlation of the cultural and tourism industries increased again from 2018 to 2019. In terms of local spatial correlation, the provincial culture and tourism industries in Eastern China had a high degree of local spatial correlation, and the interregional industrial linkage effect was significant. The local spatial correlation between provincial culture and tourism industries in the central region was relatively low, and the interregional industrial linkage effect was general. The local spatial correlation between provincial culture and tourism industries in Western China was relatively high, and the effect of interregional industrial linkage was not significant.
(3)
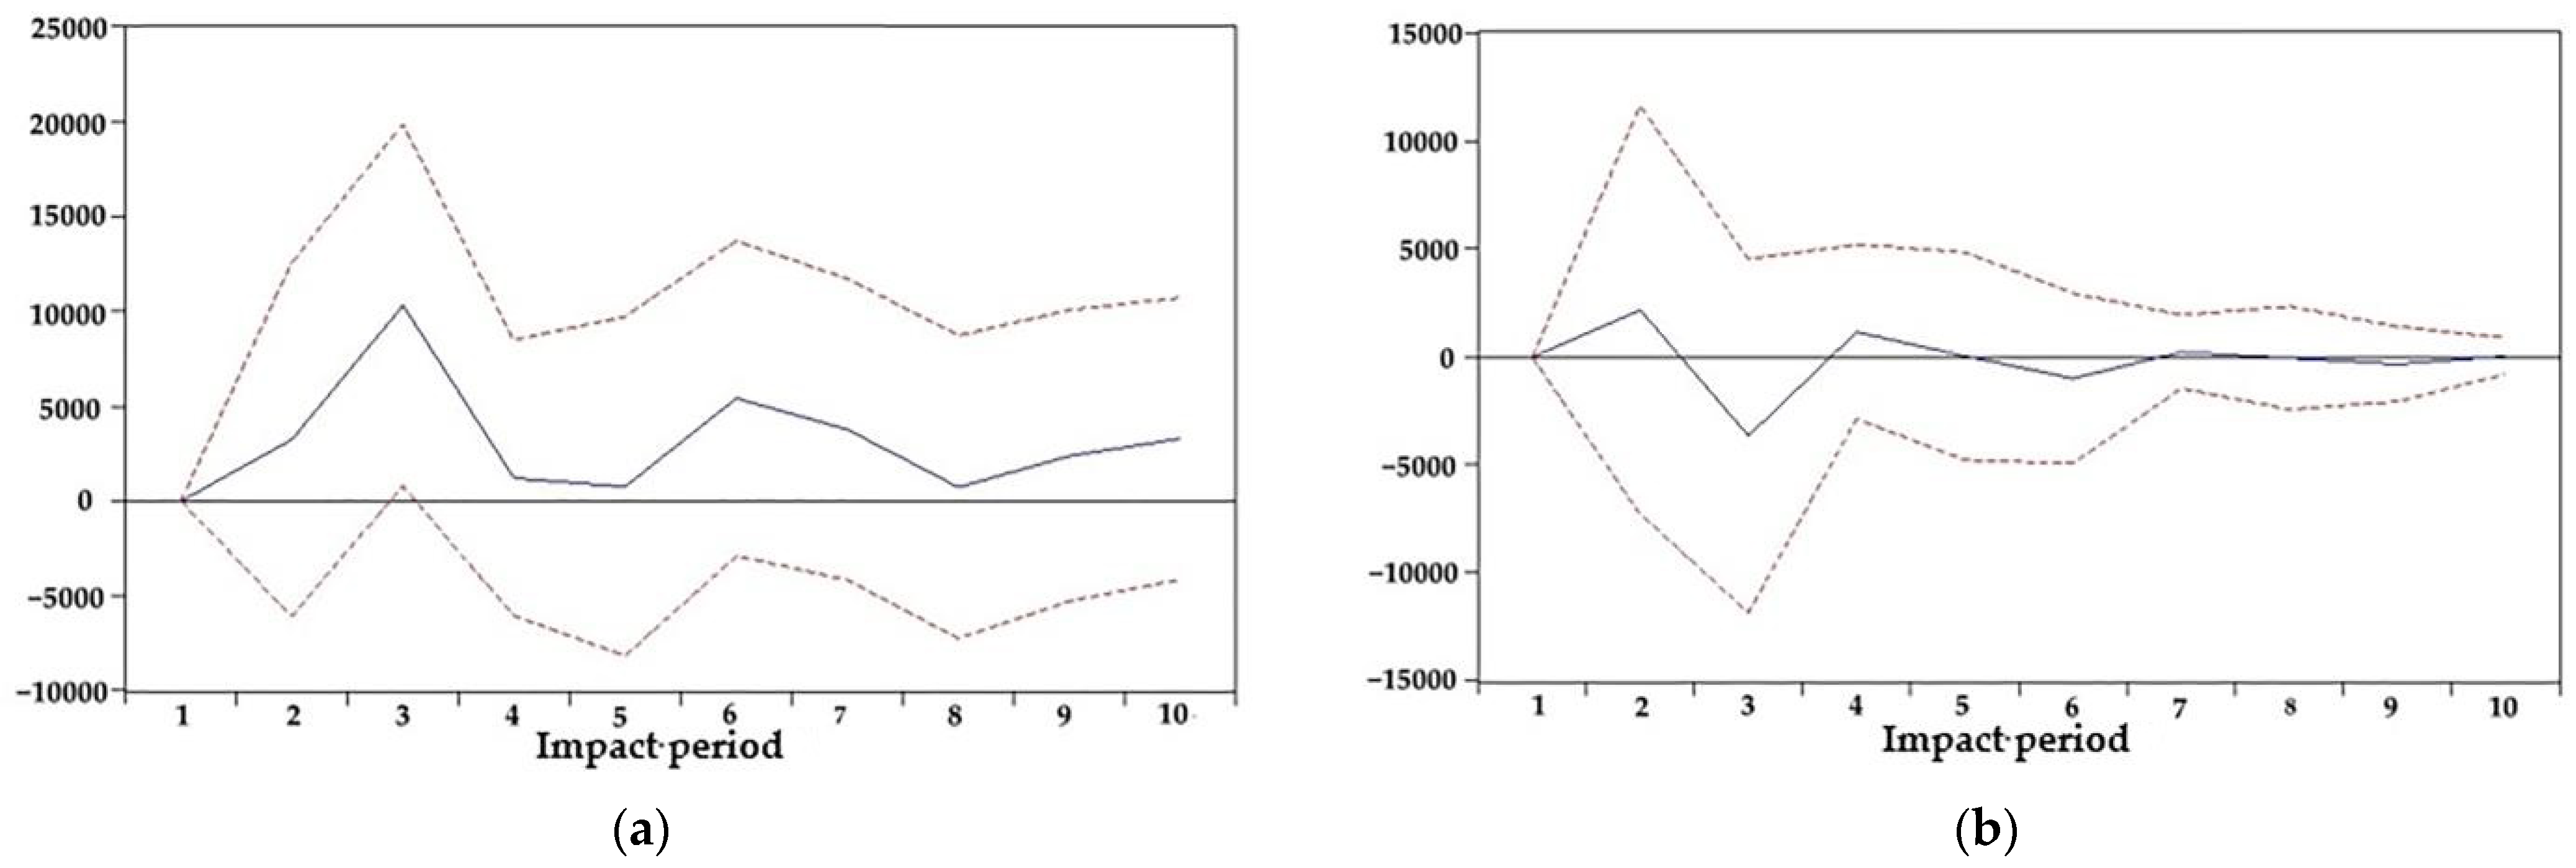
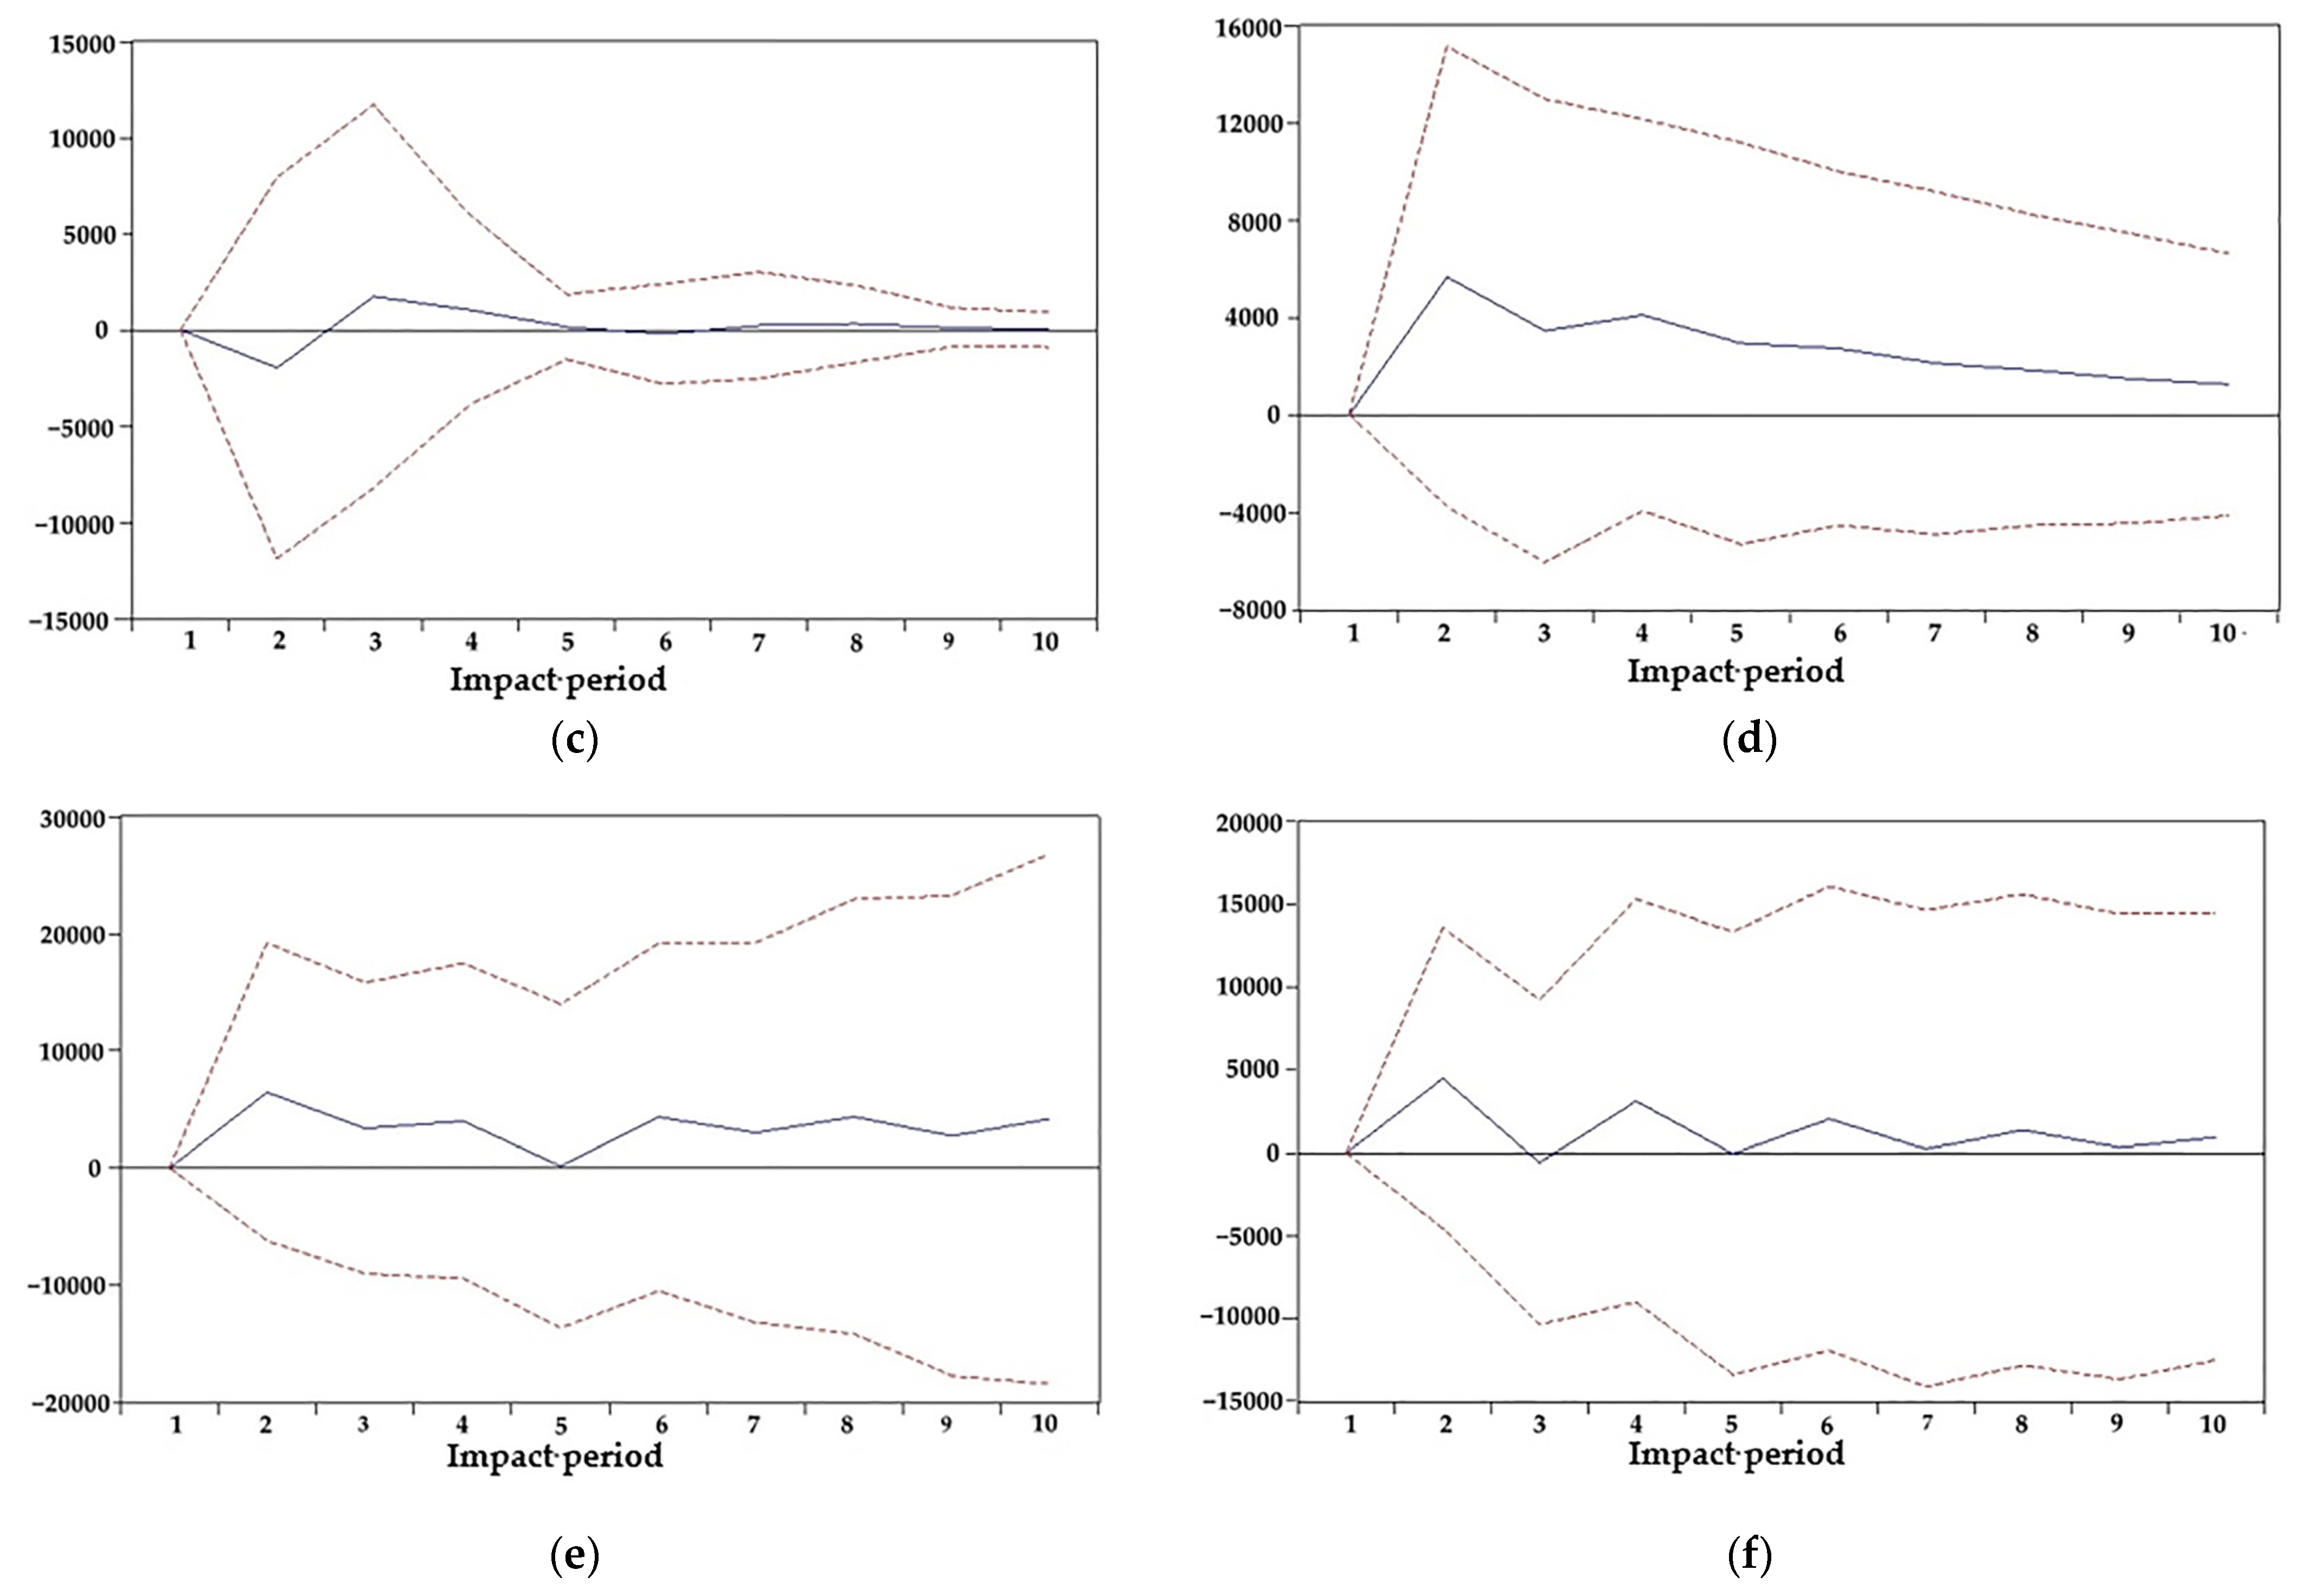
The impact of the collaborative agglomeration of Chinese culture and tourism industries on the economy was nonlinear, and the impact of different industrial collaborative agglomeration factors on the Chinese economy was different. Six factors had a strong correlation with economic effects: (1) per capita cultural expenses, (2) domestic tourism revenue, (3) proportion of tourism revenue in the GDP, (4) per capita daily tourism foreign exchange revenue, (5) proportion of cultural establishments in financial expenditure, and (6) proportion of the added value of culture and related industries in the GDP. Among the factors, the four factors of per capita cultural expenses, domestic tourism revenue, proportion of tourism revenue in the GDP, and per capita daily tourism foreign exchange revenue had a positive impact on the economic effect, with the first two factors’ effects being more significant. The impact of the proportion of cultural establishments in financial expenditure on the economic effects fluctuated greatly in the early stage, but not significantly in the later stage. The impact of the proportion of the added value of culture and related industries in GDP on the economic effect showed a positive and negative fluctuation trend in the early stage, and the impact on the economic effect in the later stage was not significant.
We provide the following recommendations from the above conclusions: (1) Chinese coastal areas should continue to maintain the development advantages of their cultural and tourism industries and constantly develop new forms of collaboration with these industries to further strengthen the degree of industrial collaboration and agglomeration. Chinese inland areas should fully tap their own cultural and tourism resources, strengthen industrial cooperation, and enhance the level of synergy and agglomeration of cultural and tourism industries. (2) To ensure its own development advantages, Eastern China should break provincial boundaries and enhance the level of coordinated development among regions by building an economic belt of culture and tourism industries. To ensure integration of the cultural and tourism industries’ resources, the central region should make full use of its regional characteristics and advantages to increase the degree of industrial spatial correlation and form an industrial regional linkage effect. To ensure the development of the western region of China, leaders need to deeply excavate the characteristics of their cultural and tourism resources and actively strive for cross regional cooperation opportunities so as to take advantage of the industrial linkage effect between urban agglomerations. This type of collaboration can alleviate their production pressure. At the same time, the Chinese government should further increase industrial support to the northwest region. That will hopefully enable a breakthrough that will see an unprecedented rise in their cultural and tourism industry development. (3) The governments should pay full attention to the impact of cultural and tourism industries’ collaborative agglomeration on economic effects and to the influencing factors of industrial collaborative agglomeration. The governments should also promote the collaborative agglomeration of culture and tourism industries through policy guidance, giving full play to the role of the collaborative agglomeration in the culture and tourism industries as drivers of the economy.

5. Limitations and Future Research

The collaborative agglomeration of the culture and tourism industries is essential to the transformation and upgrade of China’s cultural and tourism industries. The spatial–temporal characteristics and economic effects of the collaborative agglomeration of China’s cultural and tourism industries are related to established industrial patterns and economic development in various regions. Our findings demonstrate the spatial–temporal characteristics and economic effects of the collaborative agglomeration of China’s cultural and tourism industries from both theoretical and empirical perspectives. We outlined countermeasures and suggestions that are conducive to promoting the development of the collaborative agglomeration of the culture and tourism industries in China. China, as the second-largest economy in the world, has a forward-looking and comparable development model, which supports the collaborative agglomeration of culture and tourism industries. The recommendations proposed in this paper to further promote the collaborative agglomeration of Chinese culture and tourism industries can also serve as a model for the development of culture and tourism industries in similar regions throughout the world.
However, our study had some limitations. First, due to data limitations, we selected only the relevant data of the culture and tourism industries in 31 provinces and municipalities (excluding Hong Kong, Macao, and Taiwan) in China from 2010 to 2019. We excluded the relevant data of China’s culture and tourism industries after the global COVID-19 outbreak in 2020 from the study’s scope of work. Second, due to the availability of research materials, when analyzing the economic effects of the collaborative agglomeration of the cultural and tourism industries, the data of all economic indicators are the average data of the featured work area, so a detailed analysis for different regions is lacking. However, these aspects strongly impact the Chinese culture and tourism industries and should be discussed more deeply in future studies.
Future studies can be conducted from the following two aspects: First, since the outbreak of the global COVID-19 pandemic in 2020, China’s culture and tourism industries have been seriously impacted, and their development mode and trend have gradually changed. Based on the results of the global COVID-19 pandemic, follow-up research will be conducted on their effect on study areas featured in this paper. Second, based on the different characteristics of the development of the cultural and tourism industries in the different regions of China, we plan on conducting an in-depth study of the impact of different economic indicators on the economic effects of these industries in different regions to provide more targeted policy recommendations.

Author Contributions

Conceptualization, Y.C. and Y.F.; methodology, Y.C. and Y.F.; formal analysis, Y.C., Y.F. and J.L.; writing—original-draft preparation, Y.C.; writing—review and editing, Y.C.; visualization, Y.C. and J.L.; and supervision, Y.F. and J.L. All authors have read and agreed to the published version of the manuscript.

Funding

This research was funded by the National Natural Science Foundation of China (Award No. 71974155).

Institutional Review Board Statement

Not applicable.

Informed Consent Statement

Not applicable.

Data Availability Statement

The data presented in this study are available on request from the corresponding author. The data are not publicly available due to data that also forms part of an ongoing study.

Acknowledgments

The authors thank Yongheng Fang for his guidance in the research presented in this paper. We also thank Jiaming Liu for the data collection. We are also grateful for the financial support received from the National Natural Science Foundation of China (Award No. 71974155).

Conflicts of Interest

The authors declare no conflict of interest. The funders had no role in the design of the study; in the collection, analyses, or interpretation of the data; in the writing of the manuscript; or in the decision to publish the results.

Appendix A

Explanation of the index system used for evaluating the collaborative agglomeration of the culture and tourism industries (Table 1).
(1)
Per Capita Cultural Expenses: Per capita expenditure of funds for cultural industry in various regions in China.
(2)
Proportion of Cultural Establishments in Financial Expenditure: Proportion of funds used for cultural industry in all regions in China in total regional financial funds.
(3)
Proportion of Added Value of Culture and Related Industries in GDP: The proportion of the output value created by the cultural industry and the related industrial production activities of all permanent residents in a region in a certain period of time of the regional GDP.
(4)
Number of Cultural Property Collections: Representative cultural relics with important historical, artistic, and scientific value.
(5)
Public Library Collections Per Capita: The number of books published in that year that can be owned by each person in the region within one year.
(6)
Number of Public Libraries: The total number of public cultural facilities open to the public free of charge in the region for collecting, sorting, and preserving literature information and providing inquiry, borrowing, and related services.
(7)
Number of Cultural Centers: The total number of institutions that provide free places for cultural activities to the public in the region.
(8)
Number of Museums: The total number of nonprofit institutions in the region that provide the public with access to historical and artistic relics.
(9)
Number of Art Performance Teams: The total number of all kinds of professional art performance groups that are sponsored by the regional cultural department or managed by the industry and specialized in performing arts and other activities.
(10)
Number of Employees in Public Libraries: The total number of people who work in public libraries and receive remuneration.
(11)
Number of Employees in the Cultural Centers: The total number of people who work in cultural centers and receive remuneration.
(12)
Number of Employees in Museums: The total number of people who work in museums and receive remuneration.
(13)
Number of Employees of Art Performance Groups: The total number of people who work in art performance groups and receive remuneration.
(14)
Number of Visitors to the Public Libraries: The total number of people who borrow and search for information in a public library in a unit of time.
(15)
Number of Visitors to the Cultural Centers: The total number of people who conduct cultural activities in a cultural center in a unit of time.
(16)
Number of Visitors to the Museums: The total number of visitors to the museum per unit time.
(17)
Number of Audience of Art Performance Groups: The total number of people who watch art performances per unit time.
(18)
Number of Domestic Tourists: The number of Chinese mainland residents and foreigners, and overseas Chinese and compatriots from Hong Kong, Macao, and Taiwan who have resided in China for more than one year and stayed in tourist facilities in other places of China for at least one night and at most six months.
(19)
Number of Inbound Tourists: The number of foreigners, and overseas Chinese, Hong Kong, Macao, and Taiwan compatriots who come to China to visit, travel, visit relatives, friends, recuperate, investigate, attend meetings, and engage in economic, scientific, technological, cultural, educational, religious and other activities. It does not include the staff of foreign permanent offices in China, such as embassies and consulates, news agencies, enterprise offices, or foreign experts, foreign students, and people who stay on shore for no more than one night.
(20)
Domestic Tourism Revenue: All the expenses that tourists spend on transportation, sightseeing, accommodation, catering, shopping, entertainment, etc., during their travel and sightseeing in China.
(21)
Proportion of Tourism Revenue in GDP: The proportion of tourists’ total expenses in the process of travel and sightseeing in various regions in China in the GDP.
(22)
Per Capita Daily Tourism Foreign Exchange Revenue: The average daily tourism income from each tourist in a tourist destination area.
(23)
Number of Scenic Spots: The total number of places with clear geographical boundaries and available for people to visit, stay, and rest.
(24)
Number of Starred Hotels: The total number of places providing accommodation, catering, and other services for tourists that meet the evaluation criteria of the China Tourism Administration.
(25)
Number of Travel Agencies: The total number of profit-making units that provide tourists with travel, residence, and related tourism services.
(26)
Number of Tourism Colleges and Universities: The total number of schools offering tourism-related majors such as tourism management and hotel management.
(27)
Number of Employees in Scenic Spots: The total number of people who work in scenic spots and receive remuneration.
(28)
Number of Employees in Starred Hotels: The total number of people who work in starred hotels and receive remuneration.
(29)
Number of Employees in Travel Agencies: The total number of people who work in travel agencies and receive remuneration.
(30)
Number of Students in Tourism Colleges: The total number of students studying tourism management, hotel management, and other tourism-related majors.
(31)
Operating Revenue of Scenic Spots: The total income of scenic spots from providing services or selling goods to consumers in the course of business activities.
(32)
Operating Revenue of Starred Hotels: The total income obtained by starred hotels through providing labor services, renting rooms, and catering.
(33)
Operating Revenue of Travel Agencies: The total income of travel agencies when providing various tourism services to tourists.
(34)
Total Number of People Received in Scenic Spots: The total number of people who visit and stay in scenic spots.

References

  1. Malmberg, A. Industrial geography: Agglomeration and local milieu. Prog. Hum. Geogr. 1996, 20, 392–403. [Google Scholar] [CrossRef]
  2. Zeng, S.; Hu, M.; Su, B. Research on Investment Efficiency and Policy Recommendations for the Culture Industry of China Based on a Three-Stage DEA. Sustainability 2016, 8, 324. [Google Scholar] [CrossRef] [Green Version]
  3. Filipova, M.K. Relationship between corporate culture and competitive power of the companies in the tourism industry. Tour. Manag. Stud. 2015, 11, 98–103. [Google Scholar]
  4. Chang, F.H.; Tsai, C.Y. Effects of Cultural and Tourist Connotations on the Overall Satisfaction of Tourists and Their Intentions to Revisit: A Case Study on Festival Tourism. J. Hum. 2016, 3, 1–22. [Google Scholar]
  5. Qin, Z. Research on the Integration and Development of Culture Industry and Tourism Industry of Fisherman Village in Rizhao. J. Soc. Sci. 2018, 6, 167–175. [Google Scholar] [CrossRef] [Green Version]
  6. Coles, T.; Timothy, D.J. (Eds.) Tourism, Diasporas and Space; Routledge: London, UK, 2015; Volume 4, pp. 1–27. [Google Scholar]
  7. Richards, G. Cultural tourism: A review of recent research and trends. J. Hosp. Tour. Manag. 2018, 36, 12–21. [Google Scholar] [CrossRef]
  8. Hughes, H.L. Culture and tourism: A framework for further analysis. Manag. Leis. 2002, 7, 164–175. [Google Scholar] [CrossRef]
  9. Nurse, K. Trinidad Carnival: Festival Tourism and Cultural Industry. Event Manag. 2004, 8, 223–230. [Google Scholar] [CrossRef]
  10. Shepherd, R. Commodification, culture and tourism. Tour. Stud. 2016, 2, 183–201. [Google Scholar] [CrossRef] [Green Version]
  11. Joun, H.J.; Kim, H. Productivity Evaluation of Tourism and Culture for Sustainable Economic Development: Analyzing South Korea’s Metropolitan Regions. Sustainability 2020, 12, 2912. [Google Scholar] [CrossRef] [Green Version]
  12. Yan, G. A Study on the Integration of Culture Industry and Tourism Industry—A Case Study of Yancheng City in Jiangsu Province. Academics 2015, 4, 286–292. [Google Scholar]
  13. Li, F. Integrated Development of Marine Culture and Tourism Industry. J. Coast. Res. 2020, 112, 140–143. [Google Scholar] [CrossRef]
  14. Li, S.; Zhu, H. Agglomeration Externalities and Skill Upgrading in Local Labor Markets: Evidence from Prefecture-Level Cities of China. Sustainability 2020, 12, 6509. [Google Scholar] [CrossRef]
  15. Hu, S.; Song, W.; Li, C. The Evolution of Industrial Agglomerations and Specialization in the Yangtze River Delta from 1990–2018: An Analysis Based on Firm-Level Big Data. Sustainability 2019, 11, 5811. [Google Scholar] [CrossRef] [Green Version]
  16. Peng, H.; Wang, Y.; Hu, Y. Agglomeration Production, Industry Association and Carbon Emission Performance: Based on Spatial Analysis. Sustainability 2020, 12, 7234. [Google Scholar] [CrossRef]
  17. Hao, Y.; Song, J.; Shen, Z. Does industrial agglomeration affect the regional environment? Evidence from Chinese cities. Environ. Sci. Pollut. Res. Int. 2022, 29, 7811–7826. [Google Scholar] [CrossRef]
  18. Li, S.S. Culture Industry Development and Regional Economy-Case Study of Tianjin. Phys. Procedia 2012, 25, 1352–1356. [Google Scholar]
  19. Meng, H.N.; Feng, J. Construction Model of Cultural System in Planning of Tourism Industry Zones-Based on the Planning and Practice of Beautiful Countryside construction under the Culture Resource of Yue Opera in Shengzhou. Agro Food Ind. Hi-Tech. 2017, 28, 2491–2494. [Google Scholar]
  20. Zhou, C.; Sotiriadis, M. Exploring and Evaluating the Impact of ICTs on Culture and Tourism Industries’ Convergence: Evidence from China. Sustainability 2021, 13, 11769. [Google Scholar] [CrossRef]
  21. Liang, F.; Pan, Y.; Gu, M. Cultural Tourism Resource Perceptions: Analyses Based on Tourists’ Online Travel Notes. Sustainability 2021, 13, 519. [Google Scholar] [CrossRef]
  22. Lu, Y.; Cao, K. Spatial Analysis of Big Data Industrial Agglomeration and Development in China. Sustainability 2019, 11, 1783. [Google Scholar] [CrossRef] [Green Version]
  23. Wang, C.; Meng, Q. Research on the Sustainable Synergetic Development of Chinese Urban Economies in the Context of a Study of Industrial Agglomeration. Sustainability 2020, 12, 1122. [Google Scholar] [CrossRef] [Green Version]
  24. Li, J.; Zhang, P.; He, J. The Spatial Agglomeration and Industrial Network of Strategic Emerging Industries and Their Impact on Urban Growth in Mainland China. Complexity 2021, 2021, 719–732. [Google Scholar] [CrossRef]
  25. Niu, F.; Yang, X.; Wang, F. Urban Agglomeration Formation and Its Spatiotemporal Expansion Process in China: From the Perspective of Industrial Evolution. Chin. Geogr. Sci. 2020, 30, 532–543. [Google Scholar] [CrossRef] [Green Version]
  26. Qi, W.; Fang, C.; Song, J. Measurement and spatial distribution of urban agglomeration industrial compactness in China. Chin. Geogr. Sci. 2008, 18, 291–299. [Google Scholar] [CrossRef]
  27. Duygu, S. Rethinking of Cities, Culture and Tourism within a Creative Perspective. Pasos Rev. Tur. Patrim. Cult. 2010, 8, 3. [Google Scholar] [CrossRef]
  28. Wang, S.L.; Chen, F.W.; Liao, B. Foreign Trade, FDI and the Upgrading of Regional Industrial Structure in China: Based on Spatial Econometric Model. Sustainability 2020, 12, 815–831. [Google Scholar]
  29. Yu, Y.; Han, Q.; Tang, W. Exploration of the Industrial Spatial Linkages in Urban Agglomerations: A Case of Urban Agglomeration in the Middle Reaches of the Yangtze River, China. Sustainability 2018, 10, 1469. [Google Scholar] [CrossRef] [Green Version]
  30. Zhou, Z.; Yang, Q.; Kim, D.J. An Empirical Study on Coupling Coordination between the Cultural Industry and Tourism Industry in Ethnic Minority Areas. J. Open Innov. Technol. Mark. Complex. 2020, 6, 65. [Google Scholar] [CrossRef]
  31. Wang, M.; Yu, D.; Chen, H.; Li, Y. Comprehensive Measurement, Spatiotemporal Evolution, and Spatial Correlation Analysis of High-Quality Development in the Manufacturing Industry. Sustainability 2022, 14, 5807. [Google Scholar] [CrossRef]
Figure 1. Coupling degree trends between China’s culture and tourism industries from 2010 to 2019.
Sustainability 14 15119 g001
Figure 2. Distribution map of coupling and coordination degree of Chinese culture and tourism industries. (a) 2010, (b) 2017, (c) 2018, and (d) 2019.
Sustainability 14 15119 g002aSustainability 14 15119 g002b
Figure 3. Clustering diagrams of LMI of Chinese culture and tourism industries from 2010 to 2019. (a) 2010, (b) 2015, (c) 2018, and (d) 2019.
Sustainability 14 15119 g003aSustainability 14 15119 g003b
Figure 4. Impact responses of GDP for various indices. (a) GDP response to per capita cultural expenses. (b) GDP response to proportion of cultural establishments in financial expenditures. (d) GDP response to proportion of added value of culture GDP response to domestic tourism revenue (c) and related industries in GDP. (e) GDP response to tourism revenue proportions of GDP (f) GDP response to the per capita daily tourism foreign exchange revenue. Note: Solid line: One unit pulse function time path; dotted lines: plus or minus twice the standard deviation of the time path were the upper and lower sides are positive and negative, respectively.
Sustainability 14 15119 g004aSustainability 14 15119 g004b
Table 1. Index system for evaluating collaborative agglomeration of culture and tourism industries.
Industry TypePrimary IndexSecondary IndexIndustry TypePrimary IndexSecondary Index
Culture Industry ( C )Basic InformationPer Capita Cultural Expenses ( C 1 )Tourism Industry ( T )Basic InformationNumber of Domestic Tourists ( T 1 )
Proportion of Cultural Establishments in Financial Expenditure ( C 2 )Number of Inbound Tourists ( T 2 )
Proportion of Added Value of Culture and Related Industries in GDP ( C 3 )Domestic Tourism Revenue ( T 3 )
Number of Cultural Property Collections ( C 4 )Proportion of Tourism Revenue in GDP ( T 4 )
Public Library Collections Per Capita ( C 5 )Per Capita Daily Tourism Foreign Exchange Revenue ( T 5 )
Cultural Organizations (Libraries, Cultural Centers, Museums, etc.)Number of Public Libraries ( C 6 )Event Venues (Hotels, Travel Agencies, and Tourism Institutions)Number of Scenic Spots ( T 6 )
Number of Cultural Centers ( C 7 )Number of Starred Hotels ( T 7 )
Number of Museums ( C 8 )Number of Travel Agencies ( T 8 )
Number of Art Performance Teams ( C 9 )Number of Tourism Colleges and Universities ( T 9 )
EmployeesNumber of Employees in Public Libraries ( C 10 )EmployeesNumber of Employees in Scenic Spots ( T 10 )
Number of Employees in the Cultural Centers ( C 11 )Number of Employees in Starred Hotels ( T 11 )
Number of Employees in Museums ( C 12 )Number of Employees in Travel Agencies ( T 12 )
Number of Employees of Art Performance Groups ( C 13 )Number of Students in Tourism Colleges ( T 13 )
Profit & Loss EffectsNumber of Visitors to the Public Libraries ( C 14 )Profit & Loss EffectsOperating Revenue of Scenic Spots ( T 14 )
Number of Visitors to the Cultural Centers ( C 15 )Operating Revenue of Starred Hotels ( T 15 )
Number of Visitors to the Museums ( C 16 )Operating Revenue of Travel Agencies ( T 16 )
Number of Audience of Art Performance Groups ( C 17 )Total Number of People Received in Scenic Spots ( T 17 )
Note: We obtained data from Chinese Culture and Tourism Statistical Yearbook, China Tourism Statistical Yearbook, and Chinese Culture and Related Industries Statistical Yearbook from 2010 to 2019, covering 31 provinces and municipalities in China (excluding the Hong Kong, Macao, and Taiwan regions). C , cultural industry; C n   ( n = 1 17 ) secondary evaluation index of cultural industry; T , tourism industry; T n   ( n = 1 17 ) , secondary evaluation index of tourism industry. The meanings of all the secondary evaluation indices in Table 1 are shown in the Appendix A.
Table 2. Coordination degree classification standard of culture and tourism industries.
LevelCoupling Coordination Degree Coupling   and   Coordination   ( D )
1Extreme imbalance(0.0,0.1)
2Severe imbalance[0.1,0.2)
3Moderate imbalance[0.2,0.3)
4Mild imbalance[0.3,0.4)
5Verge of imbalance[0.4,0.5)
6Reluctant coordination[0.5,0.6)
7Primary coordination[0.6,0.7)
8Intermediate coordination[0.7,0.8)
9Well-coordinated[0.8,0.9)
10High-quality coordination[0.9,1.0)
Table 3. GMI from 2010 to 2019.
Year2010201120122013201420152016201720182019
Moran’s I0.1440.1900.1870.2070.2140.1840.1770.1730.1270.141
Z2.3562.4802.2842.5202.5862.4502.5152.5302.4552.353
P0.0190.0140.0230.0120.0100.0140.0120.0120.0140.019
Publisher’s Note: MDPI stays neutral with regard to jurisdictional claims in published maps and institutional affiliations.

