Article

Modelling of a Large Solar PV Facility: England’s Mallard Solar Farm Case Study

1
School of Computing, Engineering and the Built Environment, Edinburgh Napier University, Edinburgh EH10 5DT, UK
2
School of Energy, Geoscience, Infrastructure and Society, Heriot Watt University, Edinburgh EH14 4AS, UK
*
Author to whom correspondence should be addressed.
Energies 2022, 15(22), 8609; https://doi.org/10.3390/en15228609
Submission received: 21 October 2022 / Revised: 11 November 2022 / Accepted: 13 November 2022 / Published: 17 November 2022

Abstract

:
With reference to energy generation, the global society has to urgently address three factors that are now critical: sustainability in terms of climate change, security in terms of the war that is currently raging in Europe with consequences that are being felt around the globe and the steep incline of fossil-fuel based energy costs. Around the world, large-scale solar farms are being constructed with tracking systems to improve the efficiency of photovoltaic (PV) modules. This article presents a comparison of energy generation of fixed-slope versus tracking PV modules. The analysis was based on a twenty-year dataset for two locations, namely, Lincoln (England) and Bhavnagar (India), which differ in terms of latitude, sky clarity and ambient temperature. It was demonstrated that a fixed-slope system facing the equator provides a healthy energy receipt that is a high fraction of the energy receipt of a tracking system. Furthermore, analysis was also carried out for a PV facility that will host the largest solar farm in England to conclude that regardless of the solar farm installation location, the use of bifacial PV is beneficial.

1. Introduction

In June 2019, the UK Government raised its ambition on tackling climate change by legislating for a net zero greenhouse gas emissions target for the whole economy by 2050. In March 2020 the official infrastructure advisor to the Government subsequently produced a report on Net Zero: Opportunities for the Power Sector. The report sets out the infrastructure requirements for the year 2050. That report recommends significant solar, onshore wind and offshore wind energy sources, with the intention to install 129–237 GW of renewable capacity by 2050 [1]. The latter mix is recommended to include 56–121 GW of solar, 18–27 GW of onshore wind and 54–86 GW of offshore wind. This would require a significant increase in installed renewable generation capacity, including up to nine times more solar than is currently installed in the UK.
Carbon Budgets set the trajectory for the decarbonisation actions required to meet this commitment. They recognise that atmospheric carbon has a cumulative global heating effect, and therefore, urgent action is necessary. The Sixth Carbon Budget (enshrined in law in June 2021) runs from 2033 to 2037 and requires a 78% reduction in UK territorial emissions between 1990 and 2035.
UK electricity demand is expected to double by 2050. Decarbonisation requires the electrification of energy, which is currently generated by burning fossil fuels, and the UK’s pathway to achieving net zero by 2050 must involve wider transitions outside of the power sector, including decarbonising transport, industry, agriculture and homes [2]. Extensive electrification requires support from a major expansion of renewable and other low-carbon power generation to ensure that the UK is capable of securely meeting future electricity demand with a significantly lower carbon intensity. The decarbonisation of UK electricity generation is therefore vitally important to meet the UK’s legal obligations on carbon emissions and ensure sustainable energy resilience.
Actuated by the increasing concern of the public regarding increasing evidence of climate change, the rapidly falling price of installed PV systems and the ongoing Ukrainian war, European governments are rapidly adopting policies that promote wind and solar energy.
Solar energy is crucial in achieving the energy transition and could provide significant support to current energy technologies, allowing for reductions in the consumption of fossil fuels. An effective application of this technology will not only enable the creation of new jobs but will also support the growth of the local economy and industry [3]. Several solar technologies, including crystalline, wafer, thin film and organic, have been researched to achieve reliability, high efficiency and cost-effectiveness in terms of the use of less material and increasing energy conversion efficiency [4]. For example, compared with a standard crystalline silicon solar cell, quantum dot silver, copper, lithium or caesium cores emit up to three electrons per photon due to multiple exciton generation, increasing the absorption and electron–hole generation rate in core/multiple shell absorber layers [4,5]. On the other hand, the most recent bifacial PV technology (crystalline) is promising due to its ability to generate higher energy yields, as they collect radiation on the front as well as on the rear side by capturing light reflected from the surface beneath the panel and from the surroundings [6]. The energy generation from a bifacial PV could be 10-25% more than an equivalent conventional monofacial PV and is expected to be the market standard in 5–10 years [7].
Around the world, large-scale ground-mounted solar photovoltaic (PV) panel installations called solar farms or solar fields/plants are being constructed to generate clean electricity [8]. The Western Electricity Coordinating Council (WECC), using actual measurements from the Western Texas and Southern California transmission networks, showed that the WECC generic models could successfully simulate real dynamic phenomena in large-scale solar PV power plants and proposed guidelines for the correct usage of these models [9]. Bifacial PV farms in the UK may be considered a higher-risk investment and may incur a higher weighted average cost of capital (WACC). This would mean that despite bifacial solar farms producing higher electrical output, monofacial PV arrays may have a lower levelised cost of electricity (LCOE) in certain circumstances depending on how the project is funded [10]. However, as the number of bifacial PV farms in the UK is growing, more data is being collected on their efficiency, and thus, this uncertainty over their risk is likely to be the case for a short period until there is more confidence in their profitability. Moreover, the International Technology Roadmap for Photovoltaic (ITRPV) predicts that due to improvements in the technology of bifacial PV, it will constitute 40% of the PV market by 2028, leading to a reduction in the price difference between bifacial and monofacial PV modules [11].
On 10 August 2022, the major renewables company Iberdrola switched on Europe’s largest solar power plant to date, with the 590 MW Francisco Pizarro PV array now powering the grid in Spain’s south-west [10]. The USD 307 million solar power project will save 150,000 tons of CO2 annually. The PV plant is located between the municipalities of Torrecillas de la Tiesta and Aldeacentenera in the Extremadura region. In addition, Iberdrola has 19.3 GW of operating renewables and has earmarked a further EUR 14.3 billion for additional wind and solar farms, to be completed by the year 2025 [12].
It should be stressed that PV power is highly variable, as it can vary from zero to a hundred percent depending on the meteorological conditions and geographical characteristics [13]. The investment and installment cost of the necessary tools and devices makes the energy produced in PV plants relatively expensive. Since the power generation capability of such systems is dependent on the solar radiation received by the panels, a tracking system that momentarily positions these panels towards the direction of the Sun’s rays is very helpful in maximising their performance. The angle of the sun differs between different hours of the day and the various seasons of the year, and for this reason, using solar tracking systems to maintain a high level of efficiency is beneficial. Such systems increase the production rate of the plants compared with those lacking this technology. Almost 27% of photovoltaic power plants worldwide possess solar tracking systems [14]. Studies [15,16,17] were conducted on understanding the effect of solar tracking systems (single axis and double axis) on the performance of solar plants. The reference [18] investigated two grid-connected solar PV plants, one of which used single-axis tracking systems and was situated in the Saluzzo region, whereas the other one used double-axis systems and was situated in Naples, Italy. It was found that due to much higher levels of solar radiation and the usage of a double-axis tracking system, the system located in Naples produced a higher output power, but the costs of installation and maintenance made it less economically viable.
In 2022, a project to build a 1.4 GW high-voltage cable linking Germany with the UK has moved forward. The European Investment Bank agreed to provide EUR 400 million in funds for the EUR 2.8 billion project. The project completion is scheduled for the year 2028. The submarine cable will have a length of 725 km, a capacity of 1.4 GW and a DC voltage of 525 kV. It will connect a converter station near Fedderwarden, Germany, to the UK network operated by the National Grid via a converter station on the Isle of Grain [19]. The potential of large-distance electricity transmission via high-voltage cables and green hydrogen transport via large marine vessels has made it feasible to use solar energy capture near the tropics. Indeed, it may be economically advantageous to deploy such strategies for providing sustainable energy-hungry northern European markets.
Colasante et al. [20] attempted to explain the rapid transition that is taking place within Southern Europe in terms of solar energy. The development of photovoltaics is due to good irradiation levels and the introduction of favourable policies. Europe’s ambitious plans for a green transition require new power to be installed but also new consumption habits that tend to be more responsible. Online surveys carried out for a large consumer base indicated a positive response that suggests a transformation from fossil fuel to green electricity in cities goes via the emergence of prosumers and the percentage of self-consumption. Specifically speaking, those surveys were carried out within Italy and Spain and the outcomes showed that the subjects believed one ought to pay a green premium of 0.10 EUR/kWh and 0.08 EUR/kWh, respectively. Finally, in the year 2022, the war in Ukraine has jolted a large number of European nations into a rapid transition to solar and wind energy, with the UK now being one of the champions of the cause. The COP27 held in November 2022 in Egypt is an additional vehicle that will draw more support for green electricity.
To date, the largest solar PV “Mallard” farm is in the development stage in Lincoln, England [1]. The farm will have a 350 MW capacity and will use a combination of tracking and fixed-slope monofacial and bifacial modules. After providing a review of the annual irradiation of five tracking modes, this article presents an analysis of the two tracking modes that are most profitable and a fixed-slope system. Results are presented for the above Lincoln farm and a farm near the tropics with clearer skies and higher irradiation. This work took into account the loss of the sky view factor due to the shading of modules from neighbouring constructs and the potential for enhanced energy gain offered by high-reflectivity materials that may be laid on the ground. It was inferred that a fixed slope system provides an optimal solution once the problems associated with the tracking systems are taken into account. Furthermore, PVsyst software was used to model a 1 MW farm facility in each of the two locations mentioned above and annual energy generation estimates were provided. The latter estimates may be used to predict the performance of solar farms of any capacity by scaling up or down. The article is organised as follows. Section 2 provides an overview of the PV system parameters investigated in this study. Section 3 presents the solar farm case study used in the calculations. Section 4 provides the modelling details and Section 5 presents simulation results. The concluding Section 6 sums up the key outcomes of this study.

2. System Parameters under Investigation

2.1. Mode of Operation: Fixed versus East–West Tracking and Location Dependence

It was argued that to harness the maximum amount of solar radiation, the PV modules may use tracking. A tracking system may be oriented either in the east–west (E-W) or north–south (N-S) direction. In the E-W orientation, the focal axis is horizontal, while in the north–south orientation, the focal axis may be horizontal or inclined. Five different modes of tracking are discussed in the literature [21]; all mathematical equations that are relevant to this section are provided in this reference.
Mode I
In this mode, the collector is rotated about a horizontal E-W axis with a daily adjustment required to ensure that noon beam irradiation is normal to the collector aperture. In this mode, the aperture plane is an imaginary surface with either the aspect being true south or true north.
The slope of the module for the maximisation of energy collection is obtained from
β = (Φ − δ) for a south-facing array (γ = 0°) and (δ − Φ) for a north-facing array (γ = 180°).
The angle of incidence of the beam radiation on the module throughout the day is obtained from
Cos θ = sin2 δ + cos2 δ cos ω
where β is the slope or tilt angle of the PV module, γ the surface azimuth angle from true south, δ the solar declination angle, θ the solar incidence angle, ω the solar hour angle and Φ the geographical latitude of the location.
Mode II
This is similar to mode I but with a continuous adjustment of the collector such that the beam irradiation is incident on the collector aperture with a minimum angle throughout the day.
The slope of the module is obtained from
tan (Φ − β) = [tan δ/cos ω] for γ = 0
tan (Φ + β) = [tan δ/cos ω] for γ =180
The angle of incidence of the beam radiation on the module is then
cos θ = (1 − cos2 δ sin2 ω)0.5
Mode III
In this mode, the focal axis is N-S and horizontal. The collector is rotated about a horizontal N-S axis and adjusted continuously so that the solar beam makes the minimum angle of incidence with the aperture plane at all times.
The slope of the module and the incidence angle of the solar beam are respectively obtained from
β = tan 1 [ cos δ sin ω sin ϕ sin δ + cos ϕ   cos   δ cos ω ]
Cos θ = [(sin Φ sin δ + cos Φ cos δ cos ω)2 + cos2 δ sin2 ω]0.5
Mode IV
In this mode of operation, the focal axis is N-S and inclined at a fixed angle equal to the latitude. Thus, it is parallel to the Earth’s axis. The collector is rotated about an axis parallel to the Earth’s axis at an angular velocity that is equal and opposite to the Earth’s rotational rate; it is adjusted such that at solar noon, the aperture plane is an inclined surface facing due south. The module slope and beam incidence angle then reduce to
β = Φ and θ = δ
Mode V
Mode V is similar to mode IV but with the collector now subjected to two-dimensional motion, i.e., the collector is rotated about the focal axis as well as about a horizontal axis perpendicular to this axis. The beam irradiation is thus always normal to the collector aperture. The module slope at noon is then given by
β = | ϕ δ |
Note that Equations (1) to (7) are from reference [21].

2.2. Near-Horizon Energy Gain with High or Low Reflectance

The ground albedo or ground reflectance is defined as the ratio between the ground-reflected radiation and the global radiation incident on the ground [22], measured on a scale from 0 to 1. An albedo of 0 indicates a black surface where all the incident radiation is absorbed, and an albedo of 1 indicates a highly reflective material. Kotak et al. [20] investigated the impact of reflectivity on a PV system to conclude that a good estimate of the albedo of the terrain surrounding a PV installation is a prerequisite for determining the radiation balance of a PV system. Kotak et al. [23] used a case study to demonstrate that emerging building materials technology, such as paints of high reflectance, when used to cover 25% of the near horizon would increase the energy gain by up to 48%. When comparing conventional materials to non-conventional materials, Gul et al. [24] concluded that the albedo value of white pebbles and paint was between 0.5 and 0.7, which is 25% higher than the albedo value of conventional surfaces, such as grass or cement/concrete. The usage of white pebbles has a similar advantage to tiles and paints and is less prone to weathering.

2.3. Monofacial versus Bifacial Modules

Three forms of solar radiation are received by an inclined PV panel: direct, diffuse and reflected radiation. The reflected radiation component for conventional monofacial modules makes up no more than 10% of the total incoming radiation [25]. The most recent bifacial PV technology is promising for generating higher energy yields, as they collect radiation on the front as well as on the rear side by capturing light reflected from the surface beneath the panel and the surroundings [6]. Bifaciality (i.e., the difference between the energy produced from a bifacial module and the reference monofacial module) can improve PV system energy generation by 10–25% compared with monofacial PV and is expected to be the market standard in 5–10 years with a market share of over 35% [7]. Monofacial PV farms are commonplace in the UK and data on their performance and profitability is readily available; this is not the case for bifacial PV farms, thereby incurring a higher risk to the investor. This work shall attempt to address the latter shortcoming.

3. Case Study—The Mallard Pass Solar Farm Project

Mallard Pass Solar Farm, based in the county of Lincolnshire, England, is a project under consultation [1]. This farm aims to deliver 350 MW of solar energy. The total proposed area of the site is approximately 906 ha. The developed area is to contain PV arrays and infrastructure on an area of 463 ha. The proposed development lies within two administrative boundaries of Rutland Country Council and South Kesteven District Council. This project was explored in detail as a case study that offers good potential for the UK to achieve its carbon-reduction-related commitment. Given below are the specifications proposed for the farm that were used in this study.
Fixed south-facing arrays: The indicative dimensions of modules will measure 2400 mm × 1350 mm × 35 mm. Individual panels consist of a series of bifacial, monocrystalline cells, which make up an individual PV module. The mounting structures will be orientated E-W and shall be installed between 18 and 25 degrees to the horizontal facing south to optimise daylight absorption.
Single-axis tracker arrays: The indicative dimensions of single-axis tracking modules will measure 2400 mm × 1350 mm × 35 mm. Individual panels consist of a series of bifacial, monocrystalline cells, which make up an individual panel. The mounting structures will be orientated north/south and will operate between 60 degrees from the horizontal (facing east in the morning), moving towards 0 degrees (horizontal) at midday and up to 60 degrees from the horizontal (facing west in the evening). The PV modules will track from east to west throughout the day and will return to their resting position of 60 degrees (facing east) overnight.

4. Modelling

4.1. Modelling of PV Module Tracking Modes

Sukhatme [21] provided a comparison of the incident solar energy for Delhi for the five modes of operation described in Section 2.1 for any given PV module. The India Meteorological Department provided twenty years of measured beam irradiation data for Delhi (latitude = 28.58° N), the capital city of India [26]. Delhi represents a semi-arid location with predominantly clear skies, and hence, has the potential for a good capture of solar energy. A tracking system would be advantageous in such a climate. Delhi is also the largest population centre with a large demand for electricity.
The aim of this section was to review the five modes to shortlist the key ones for this study for comparing the PV module irradiation. Sukhtame’s comparison [21] is shown here in terms of the ratio of the incident energy for any given mode to the energy received under mode I. The ratios for modes II to mode V are, respectively, 1.03, 1.36, 1.26 and 1.37. We observed that mode III, despite having single-axis tracking, provided a near identical performance to mode V. Note that mode V has to have a two-dimensional tracking system, and hence, it is near impractical in design and operation. Hence, in this study, only tracking modes III and V were compared against a fixed slope system that was inclined at an angle of 25° from the horizontal and had a southern aspect. The 25° to 30° approach has been adopted in UK-wide projects, as it offers a near shade-free operation of the modules that would otherwise be under the shadow of adjacent rows of modules.
In the remainder of this section, a comparison is made of the irradiations of PV modules that were operated under the conditions of modes III and V and a fixed slope of modules facing south. Table 1 shows those results, and a discussion is presented in the next few sections.

Modelling the Effect of Location—Tropics versus Higher Latitudes

The aim of this section was to assess the energy delivery of fixed slope and tracking systems for near-tropic locations (such as Indian locations) and those locations that are much higher in latitude (such as UK locations). Monthly averaged data over twenty years for six months (January, March, May, July, September, November) from two locations, namely, Lincoln in England and Bhavnagar in India, were used for the analysis. With the potential of large-distance electricity transmission via high-voltage cables and green hydrogen transport via large marine vessels, it is now feasible to use solar energy capture near the tropics. Indeed, it may be economically advantageous to deploy such strategies for providing sustainable energy-hungry north European markets. In this section, the modelling results for fixed slope and tracking systems are presented, using the Mallard Pass Solar Farm case study (Section 3); for Bhavnagar (a near-tropic, Indian location with a latitude of 21.75 degrees north; and Lincoln, England, with a latitude of 53.5 degrees north. Hawas and Muneer [27] showed that for the tropics, the ratio of annual global to extra-terrestrial irradiation varies between 0.53 and 0.61. However, the ratio of annual diffuse to extra-terrestrial irradiation varies within a very narrow range of 0.22–0.25, with an average of 0.233 [27].
A third parameter that characterises the cloudiness index of any given location is diffuse-to-global irradiation. This index for our two locations of interest, namely, Bhavnagar in India and Lincoln in England, has respective values of 0.36 and 0.61. In approximate terms, we deduced that Lincoln is roughly twice more likely to be cloudy than Bhavnagar.
Table 1 presents an interesting set of data that enabled us to compare the performance of two types of tracking systems, namely, modes III and V, against fixed-slope systems. The bottom row for each location shows the energy averages in Wh/m2 for the six chosen months. We note that there was only a marginal improvement in energy gain if we moved up the ladder from mode III to mode V. The mechanism complexity of mode V thus made it impractical, as the energy gain it offered was only 9% to 13% more than that of mode III. Note that mode V requires a two-dimensional tracking mechanism, as opposed to mode III’s movement in a single plane.
The last column of Table 1 shows that for a cloudy location, such as Lincoln, the energy gain between a fixed-slope module to mode III is only 2%. This was primarily due to a tracking module viewing only a much smaller portion of the sky with the consequence of a loss of diffuse irradiance. Even for the clear-sky location of Bhavnagar, the gain was only 7%.
The above narrow difference between a fixed-slope and a mode III tracking system will further reduce if we consider shading issues for the tracking system, which is discussed in the section that immediately follows.

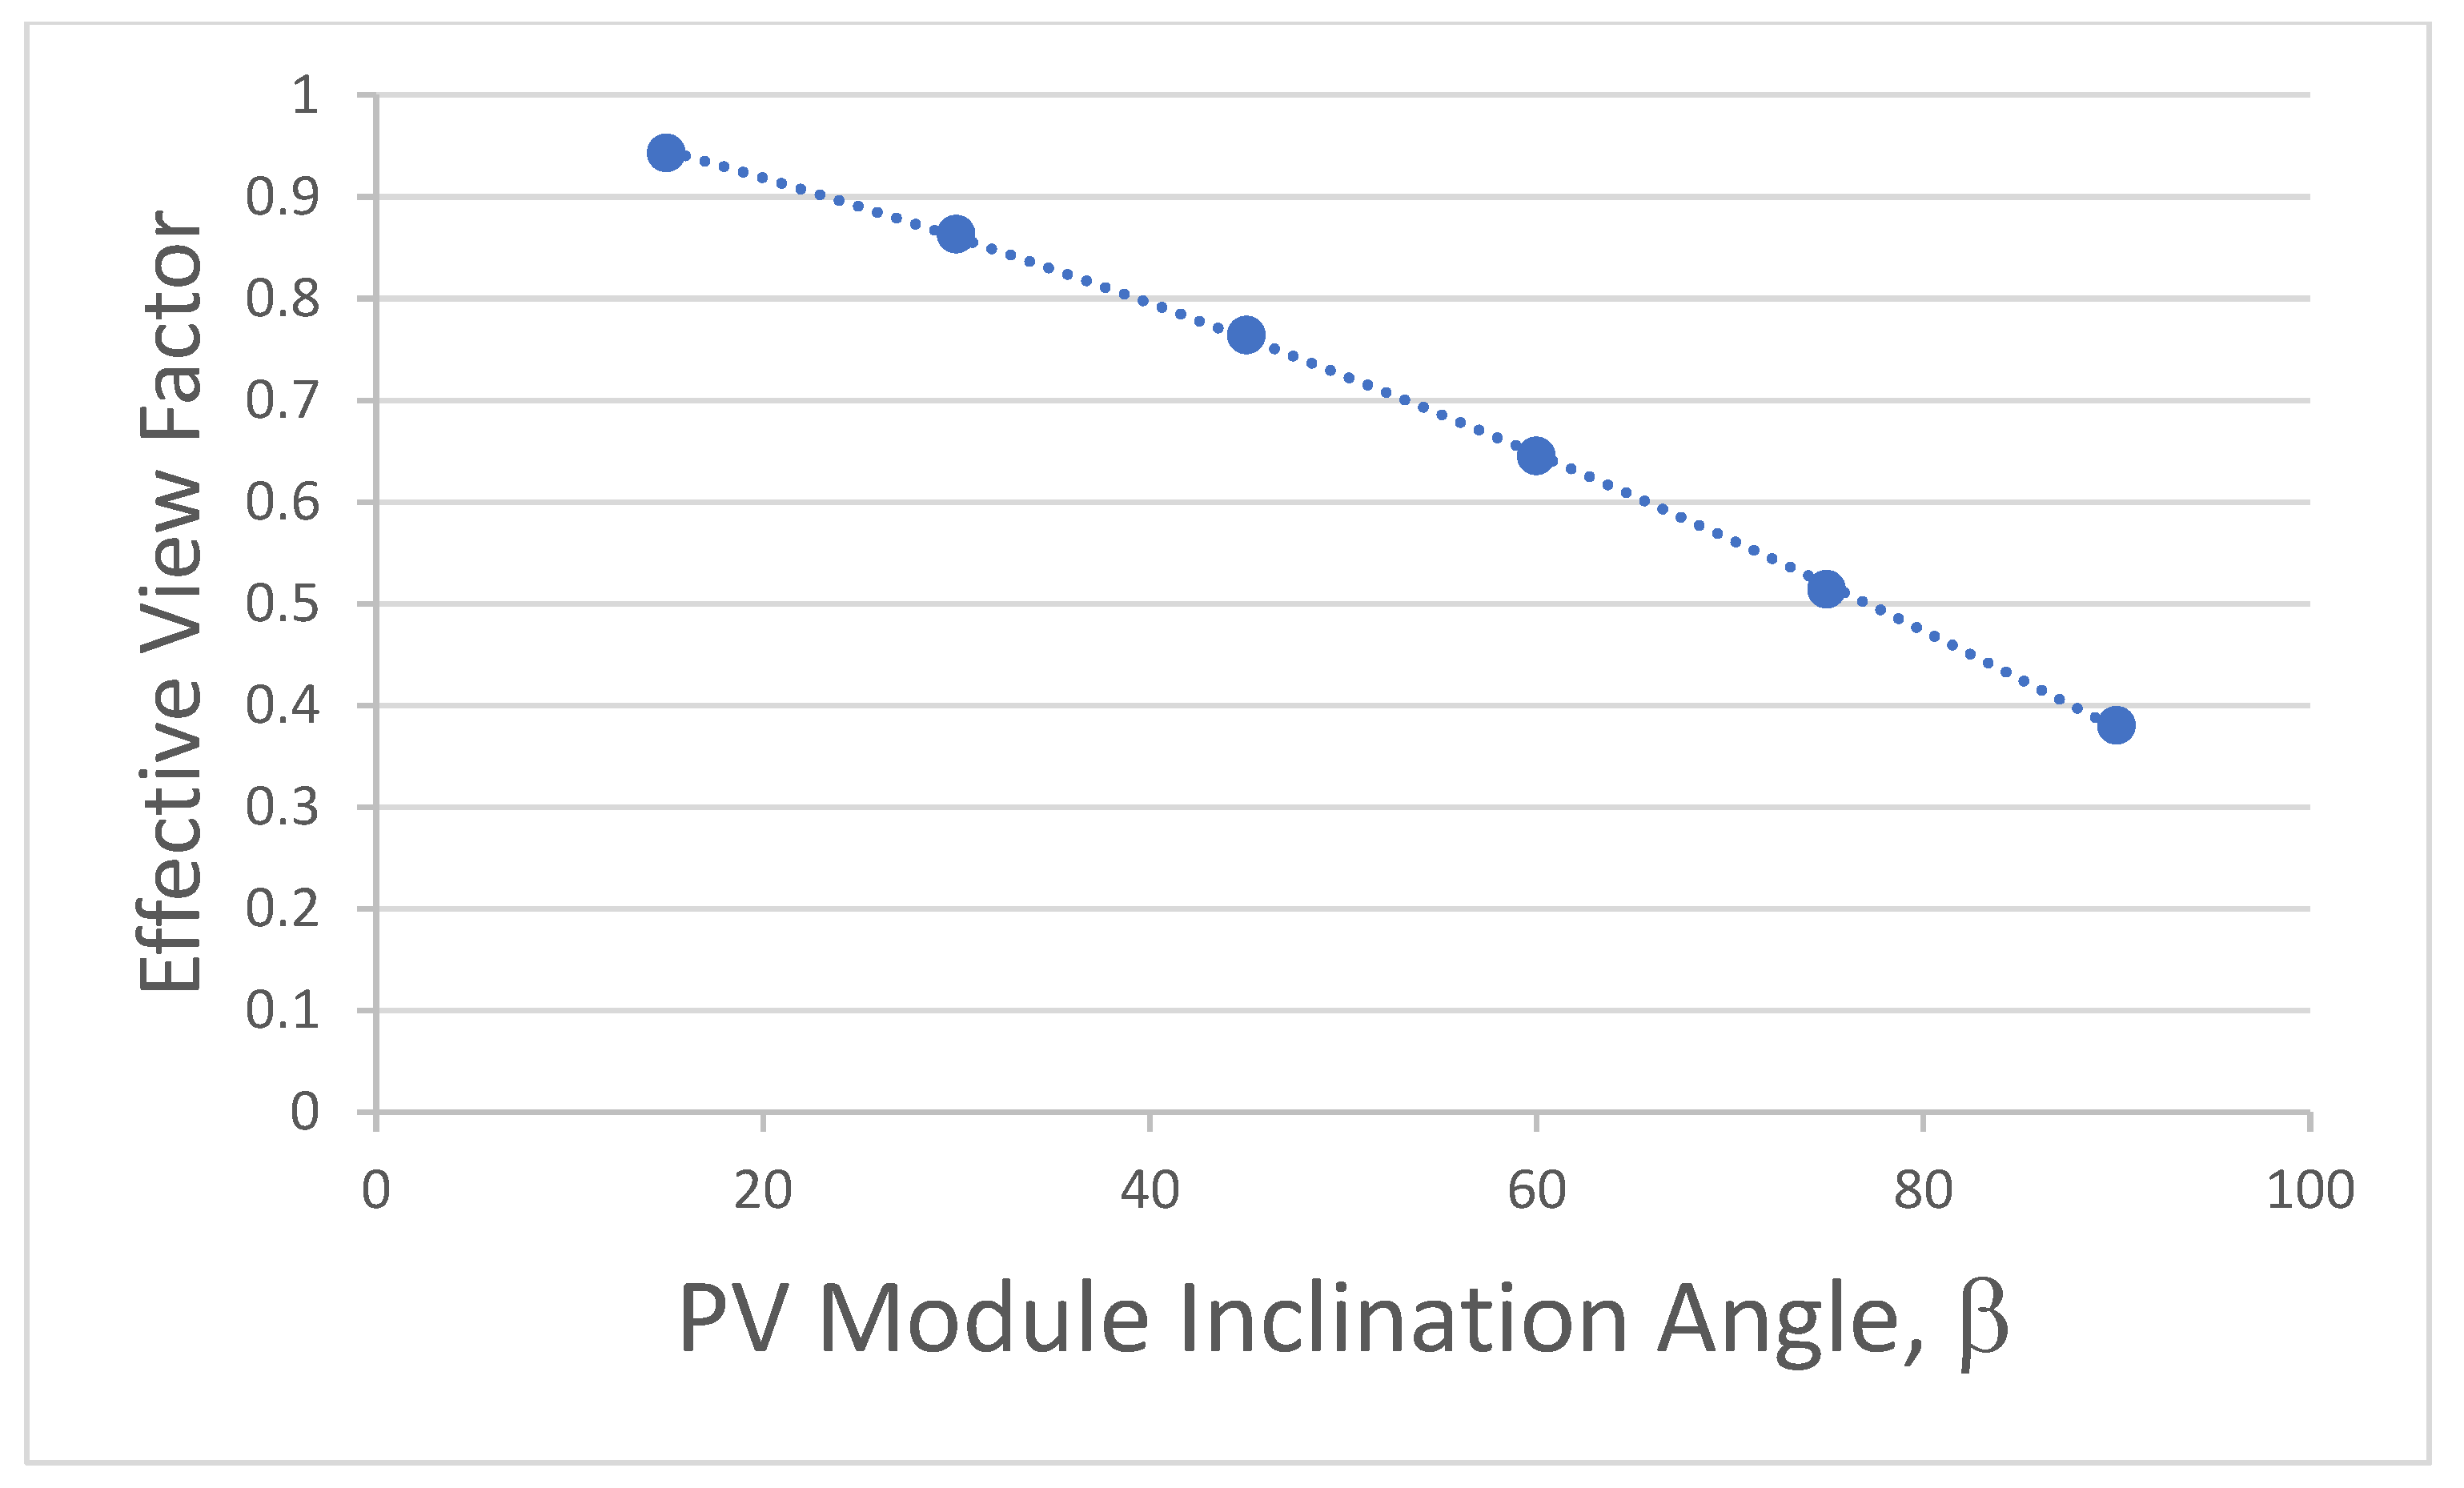
4.2. Modelling the Near-Horizon Energy Gain with High or Low Reflectance

4.2.1. Energy Exchange from the Ground to PV Modules of Fixed Inclination

The aim of this section was to use the findings of Kotak et al. [23] and Gul et al. [24] provided in Section 2.2 to quantify the irradiance gain that is made possible by those surfaces of high reflectance. For this study, the view factor calculation to obtain the radiance reflected from the ground that is incident upon a PV module is detailed as follows.
Feingold [28] provided a web-based calculator for the view factor computations that are required for radiant energy exchange between the ground and flat PV modules that may be inclined at any given angle from the horizontal. The general link is http://www.thermalradiation.net/tablecon.html (accessed on 15 September 2022).
For the case of two rectangles with one common edge and an included angle of Φ, the link is http://www.thermalradiation.net/calc/sectionc/C-16.html (accessed on 20 September 2022).
Referring to Figure 1, the objective is to obtain the view factor that enables us to obtain the energy reflected from surface 1 (ground) that is incident upon surface 22, which represents a given PV module. For a given included angle of Φ between surfaces 1 and 2 of 120 degrees, with a = 2 m, b = 0.5 m and c = 2 m, the following results were obtained using the latter mentioned web link.
Hence, the ground-reflected radiance GRR1-22 that leaves surface 1 and is incident upon the PV module (surface 22) is
GRR1-22 = ρG IG A1 F1-22
where ρG and IG are, respectively, the ground reflectance and global irradiation. If we assume an average global irradiation of 600 W/m2 and use reflectance values of 0.7 for white pebbles and 0.24 for grass, we obtain GRR1-22 values of 7.6 and 2.6 W, respectively, which is a difference of only 5 W.
If the length of the ground surface facing the PV module was increased to b = 4 instead of 0.5 m, the values for the two cases of using white pebbles and grass change to 36.5 and 12.5 W, with the difference between the two cases being 24 W. The latter case may thus justify the use of pebbles instead of grass. However, the spacing of 4 m between any two rows of PV modules may not be justifiable on economic grounds.
Note that Appendix A presents a detailed calculation procedure that is needed for obtaining a view factor between the ground and PV modules that are represented by surfaces 4′ and 4″.

4.2.2. Energy Exchange from the Sky to East–West Tracking PV Modules

In this section, the effective view factor calculation that represents the actual fraction of the sky viewed by a tracking module is presented. An explanation of this procedure is appropriate at this stage. An unobstructed, horizontal PV module can view the entire hemispherical sky dome. However, due to the presence of other modules nearby, the sky view factor will sharply drop. The effective view factor is herein defined as the difference between an unobstructed sky view factor and the view factor between two adjacent modules.
Let us consider the case of a row of E-W tracking modules. The spacing between the modules is very limited, and hence, for a large inclination from the ground, a significant portion of any given module is hidden from the sky. This will lead to a significant reduction in sky-diffuse irradiance. An assessment of the latter quantity can be made by obtaining the view factor between any two adjacent modules. Table 2 presents such computations for a view factor between two parallel surfaces, each of which is inclined from the horizontal at an angle of β.
Φ = 180 − β
VF1 is the view factor between any two parallel modules that are inclined at an angle β from the horizontal. Φ is the supplementary angle, as shown in the above equation.
The effective VF is the net sky view factor that takes into account the blockage effect of parallel PV modules that are separated by a distance that is close to the width of the module.
For the case of isotropic sky-diffuse radiance, the view factor between an unobstructed sky and a horizontal PV module is 1. For a vertical module, the view factor drops to a value of 0.5. Thus, for tracking modules, there will be a significant drop in the view factor once the module inclination from the horizontal exceeds 45 degrees. For example, in the case of β = 90 degrees, the sky view factor will drop from 0.5 to 0.5–0.12 = 0.38, resulting in a significant loss of energy, particularly for the case of higher latitude locations that get most of their solar energy in the form of diffuse irradiation. Figure 2 shows the relationship between the effective view factor and the inclination angle of the module from the ground. The effective view factor is defined as the net view factor, that is, the difference in the sky view factor and the shading caused by the adjacent PV module.

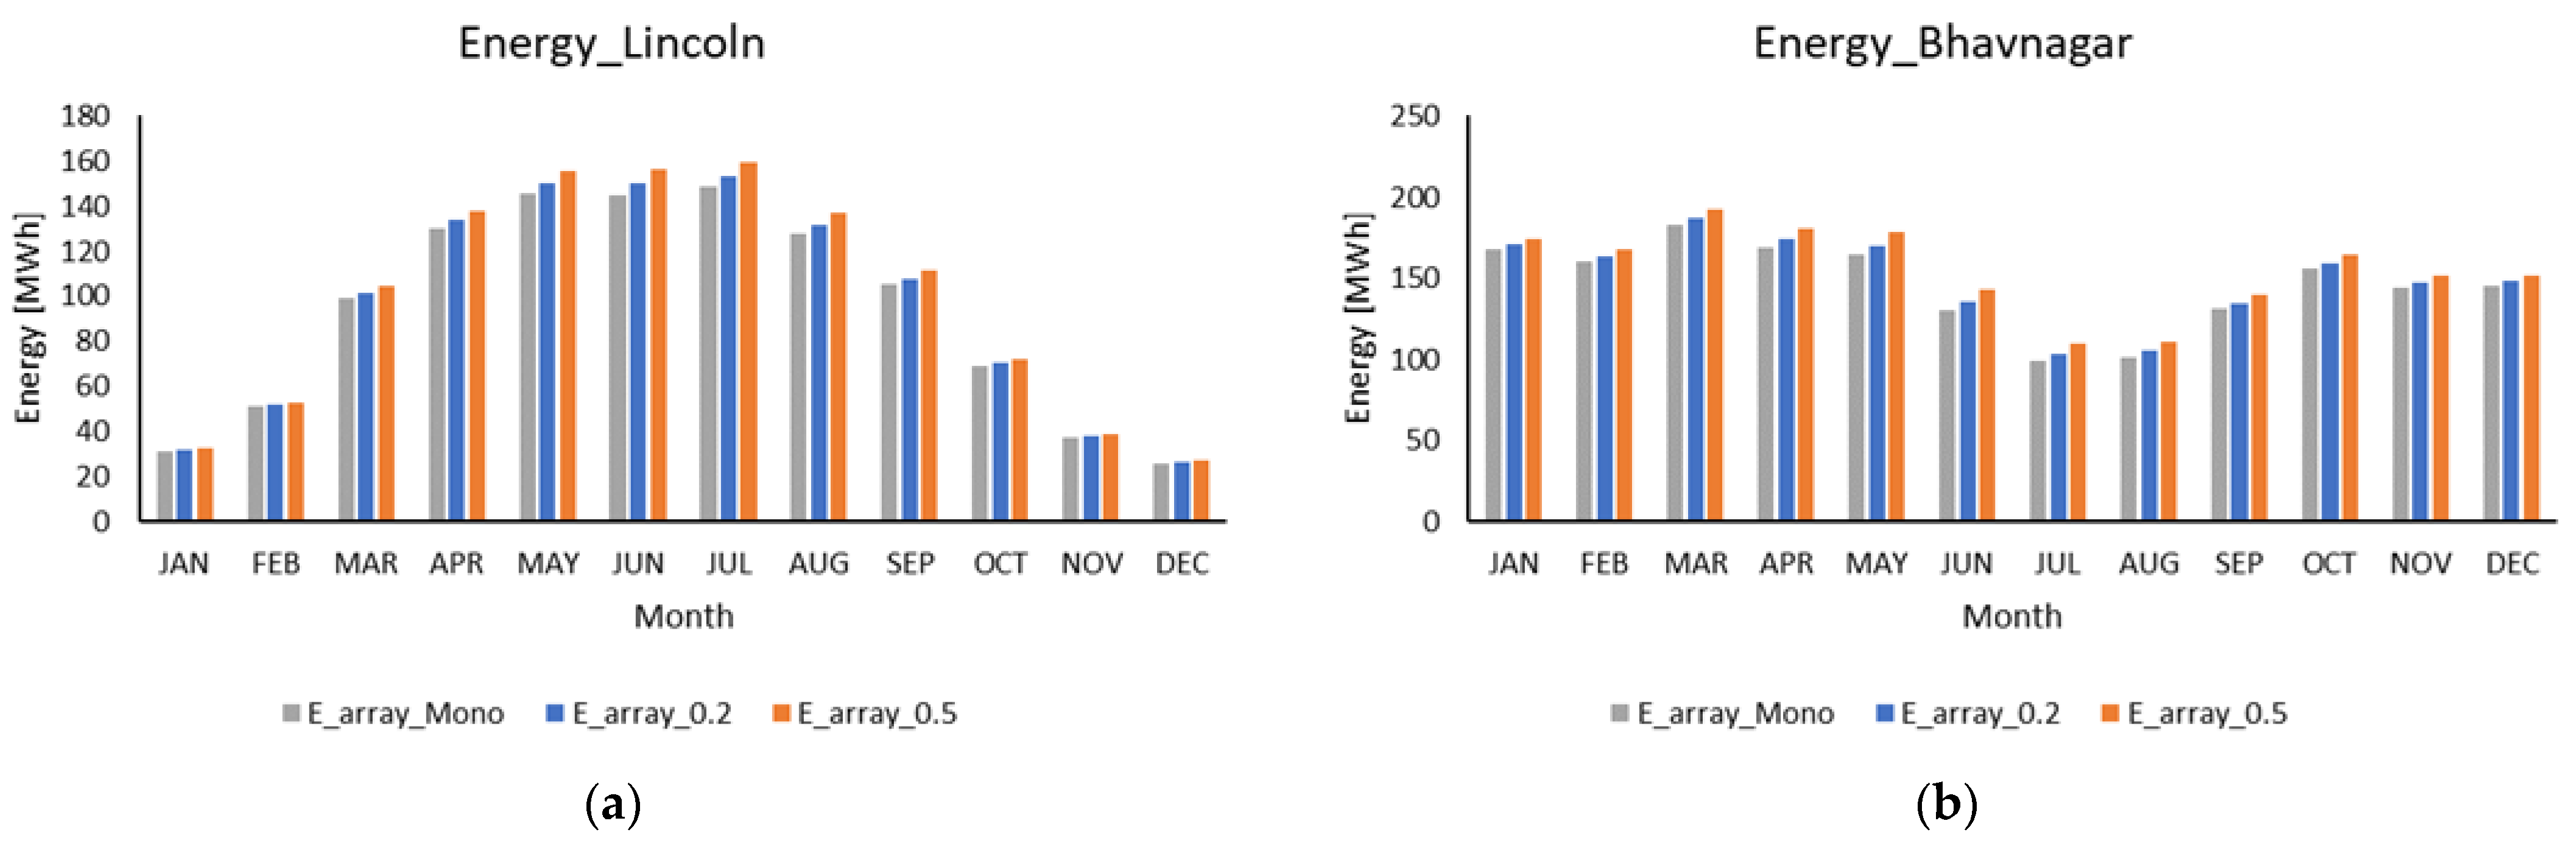
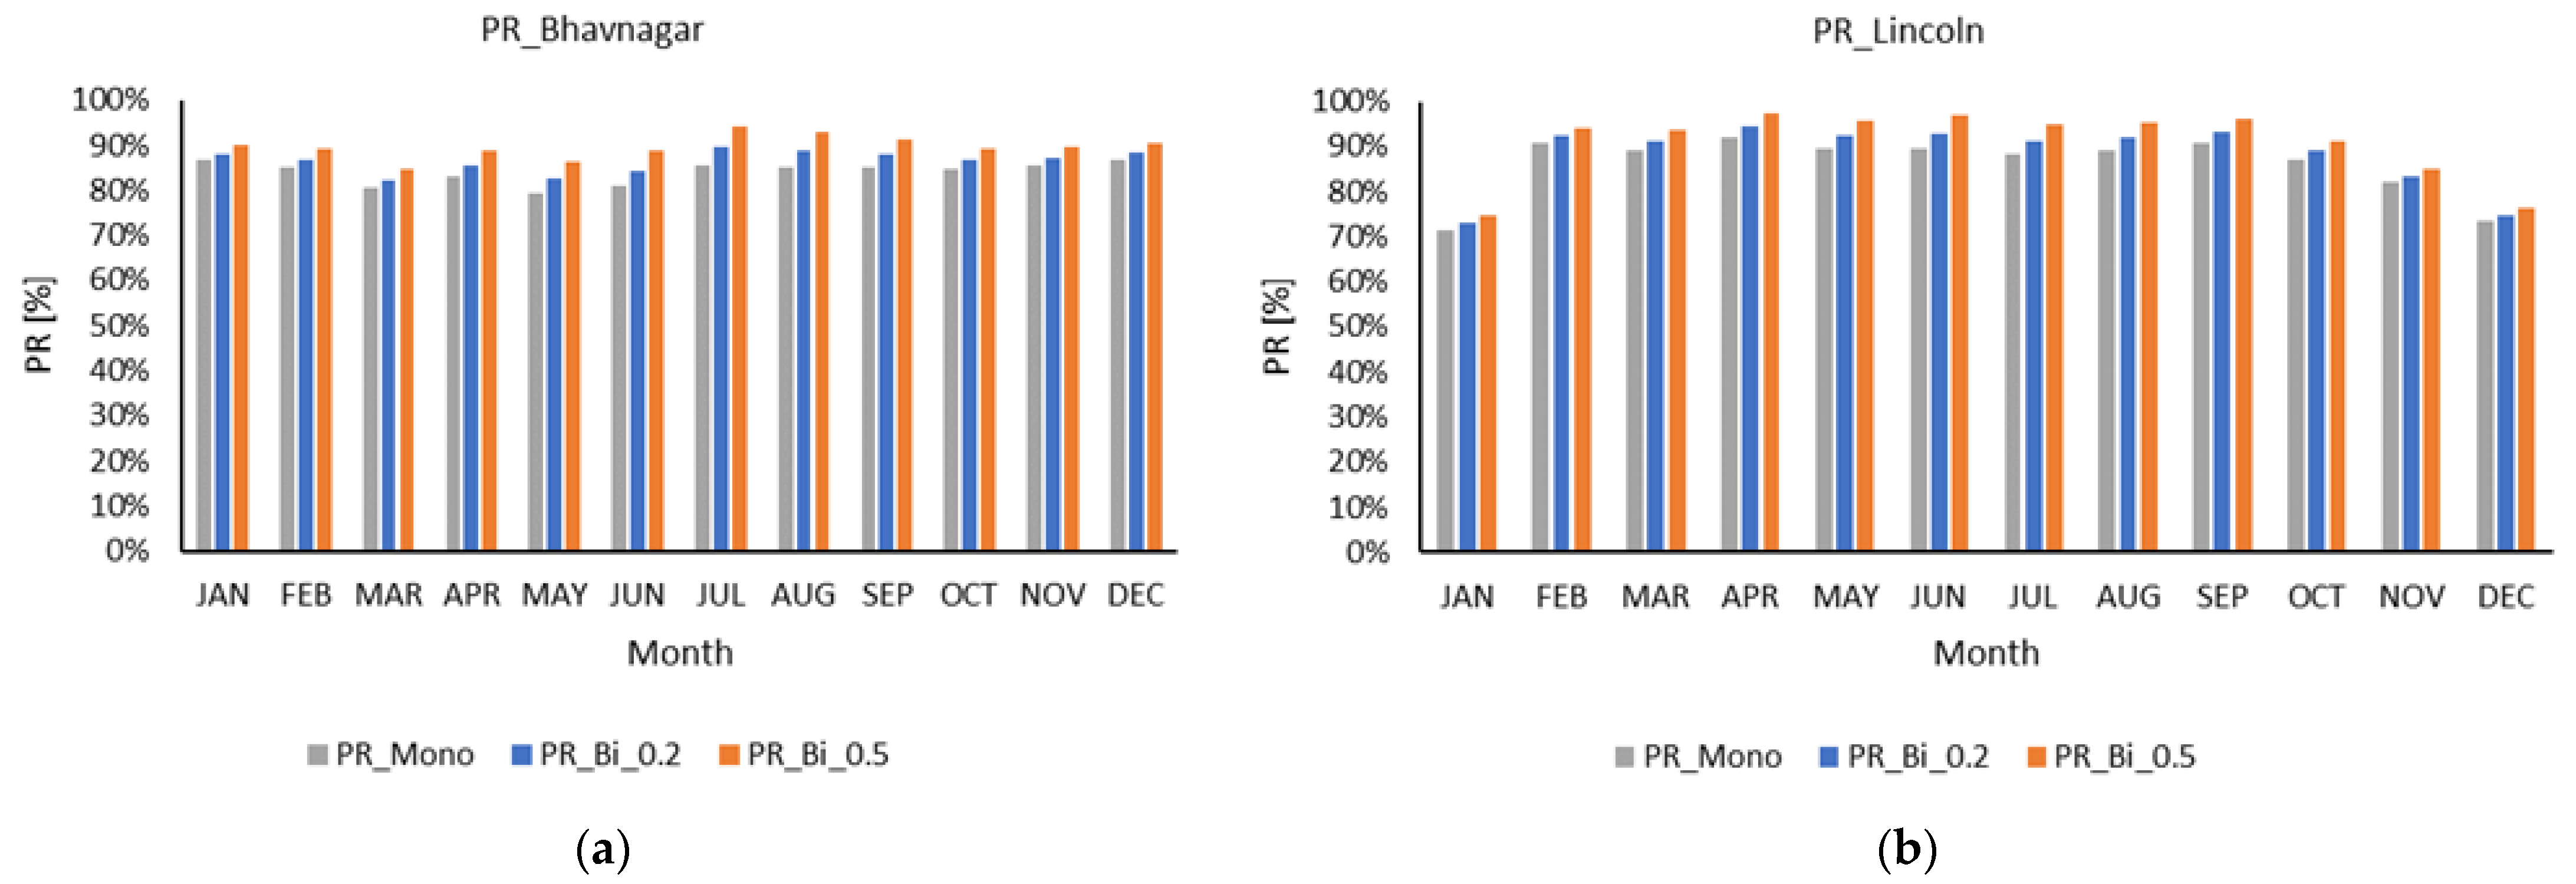
4.3. Modelling and Comparison of Monofacial and Bifacial Modules

This section of the article provides the results of the modelling related to the parameters highlighted in Section 2.2 and Section 2.3.
An energy yield assessment summary for a 1 MW solar project for two designated locations is presented. The two locations are the Mallard Solar Farm in Lincoln, UK (53.26 degrees north, 0.52 degrees east), and a potential PV site in Bhavnagar, India (21.75 degrees north, 72.16 degrees east), as shown in Figure 3. The energy yield study was conducted using the solar PV simulation software PVSyst for a fixed-tilt system using both bifacial and monofacial modules.

4.3.1. Simulation Platform

PVSyst is proprietary software that is widely used in the industry and research sectors. One of the authors of the present article was engaged by the PV installation industry to use this software for the design of large solar farms.
PVSyst uses a 2D view factor model for a bifacial PV system, which assumes an infinite length of array [29]. The model considers the direct and diffuse irradiance component on the front and back sides and the reflected irradiance component reaching the rear side of the PV. Bifacial PV can be potentially advantageous if a highly reflective ground surface is used. This reflectivity of the ground surface is also termed albedo, which is the ratio of reflected upward irradiance from the surface to the incident downward irradiance on the surface [30]. It can be defined as
A l b e d o ,   ρ = H o r i z o n t a l   r e f l e c t e d   i r r a d i a n c e   ( H R I ) G l o b a l   h o r i z o n t a l   I r r a d i a n c e   ( G H I )
The simulation is run based on the reflecting surface of white pebbles, which has a ground reflectivity of 0.5–0.6 [24]. The results were compared with the energy production using a grass surface as the horizon, with a reflectivity of 0.20. Four key performance indicators of solar PV systems are discussed here: (a) annual energy generation, (b) specific yield, (c) bifacial energy gain and (d) performance ratio (PR), which are defined in the following paragraphs.

4.3.2. Assessment of Solar Resource

The energy production for any given location depends on the available solar resource in the designated area. The solar resource includes the global horizontal irradiance (GHI), diffuse horizontal irradiance, and global tilted irradiance on the front (GTIF) and rear sides (GTIR). The GHI is the total amount of solar energy received on a horizontal surface. This can be calculated using
GHI = DHI + DNI . cos ( θ z )
Here, DNI is the direct solar irradiance from the sun and DHI is the diffuse horizontal irradiance. The global tilted front side is the solar radiation that falls on the module’s plane of array (POA). PVSyst uses the Perez transposition model to determine irradiance on a tilted plane (GTI) [31]. Meteonorm version 8.0 weather data provided by PVSyst were used for the simulation. Meteonorm is a global climate database that has a temporal resolution of 10–20 years and a spatial resolution of approximately 3 km.

4.3.3. Simulation Parameters

Three essential parameters in defining a PV field are the pitch, inter-row distance and ground coverage ratio. The pitch is the front-to-front or back-to-back distance between rows in a PV field. The inter-row distance is the front-to-back distance between rows. The row width and pitch ratio define the ground coverage ratio (GCR). As the ground coverage ratio increases, the energy generation per module will decrease due to the shading from adjacent rows of modules. The simulations were run for a module incline of 25°, 0.6 m ground clearance height and pitch of 8.35m. The inner row distance was considered to be 4 m. One essential parameter is the bifaciality factor of the module. The bifaciality factor can be defined as the rear-side-to-front-side module efficiency ratio [32]. This work used the PV manufacturer (JA Solar)-specified bifaciality factor of 0.7.

5. Simulation Output

The simulation results are presented in Table 3. We can see that the total available GHI in Lincoln was 1.8 times less than the GHI in India. The annual GTI was 1207 kWh/m2 for Lincoln and 1991 kWh/m2 for Bhavnagar, corresponding to gains of 17.6% and 7.9%, respectively, above the GHI in the two locations. The average temperature in Bhavnagar was much higher than in Lincoln by as much as 17.2 °C.
The outcomes of these simulations were as follows.
The bifacial energy gain (BG) increased with the ground albedo. At a module tilt of 25°, the gain for a ground albedo of 0.5 (albedo of white pebbles) was 6.5%. For a ground albedo of 0.2 (grass), the bifacial energy gain was 2.8%.
As seen in Table 3, the annual specific yield of the Bhavnagar PV plant was found to be much higher than Lincoln by 646 kWh/kWp/year. The specific yield is the amount of energy (kWh) produced for every kWp of the module over a particular time. The P50 showed that the probability was 50% that the annual energy production exceeded 1134 and 1782 MWh for Lincoln and Bhavnagar, respectively. This value certainly decreased for the P90 to 1085 and 1712 MWh. The overall performance ratio of the Lincoln Solar Farm was higher (94%) than Bhavnagar (89%). This can be understood from the definition of PR, which is the ratio of cumulative specific energy yield and the available plane of array irradiance over 1000 W/m2 (standard test condition). However, the monthly performance ratio remained almost the same for both locations. Figure 4a,b present the output.
Regardless of the ground surface, the total energy produced in Bhavnagar was 1.5 times more than the energy produced at Lincoln. The energy production decreased during summer at Bhavnagar due to higher turbidity and a higher ambient temperature, which causes reduced PV cell efficiency. The typical temperature at this location was higher during summer, and the overall ambient temperature was around 30 °C. An energy reduction during summer can be observed in Figure 4b, whereas for Lincoln, the energy yield was optimised for the summer (Figure 4a). This can be explained by the total available irradiance at the location. For example, in the UK, the in-plane irradiance was significantly lower during fall and spring (17–50 kWh/m2). However, during summer, the temperature at Lincoln was much lower (11–17 °C) than at Bhavnagar. The irradiance rose, which caused the power output to increase.
Figure 5 shows the performance ratio for the two farms. The analysis presented for a 1 MW farm facility to estimate annual energy generation may be used to predict the performance of solar farms of any capacity by scaling up or down.

6. Economic Assessment

In an attempt to compare the economics of monofacial versus bifacial modules, a PV industry analyst, namely, R Balyon, presented a report called LCOE of Monofacial vs Bifacial Modules: Are Bifacials Worth the Extra Cost? [33].
The above article mentioned that bifacials have a higher energy yield of 6% to 10% compared with traditional monofacial modules. Table 4 presents the analysis of Balyon. We note that the capital cost of bifacial modules is only 3.3% higher and the levelised cost of energy 0.9% lower for the bifacial-module-based power plant.
The present authors also undertook a brief economic assessment of the above two systems based on a 1 MW plant that was simulated in PVsyst software and using the current industry price quotes. The following analysis was prepared that compared a monofacial plant with a grass horizon against a bifacial plant that alternatively used grass (reflectance = 0.2) and white pebbles (reflectance = 0.5) for the horizon. The aim was to enhance the reflected irradiance on both the front and back sides of the PV module. It was found that for the 1 MW plant, the annual energy generation for the above three cases were, respectively, 1092, 1133 and 1174 MWh/year. Using the cost data from Balyon’s work mentioned above, the above LCOE for a bifacial module with grass as the horizon was found to be 2% lower than a monofacial module with the same horizon. However, with white pebbles being used for the horizon for bifacial modules, the cost dropped by 6% when compared with monofacial modules with grass as the horizon.

7. Conclusions

Within the past decade, the effects of the rapidly changing climate and its devastating effect on humans, animals, plants, buildings, structures and shorelines have been strongly felt. Governments are therefore finally reacting to this challenge and policy measures are being introduced across the globe. Furthermore, in the year 2022, the war in Ukraine has resulted in an unprecedented rise in the cost of gas that is the backbone of heating systems in Europe. That cause has also led to an urgent review of energy policy, with proposals for a shift to solar and wind energy. The present study assessed the energy generation of fixed-slope bifacial and monofacial PV module technology in terms of energetic performance and a brief economic analysis. This work also included a comparison of the irradiation of fixed versus tracking modes.
A review of five modes of PV module tracking of the beam solar energy receipt was undertaken. In this article, very early on, it was shown that one-dimensional tracking in the east–west plane provided a performance that was close to a two-dimensional tracking system. Furthermore, using a twenty-year dataset from two locations, namely, Lincoln in England and Bhavnagar in India, it was demonstrated that a fixed-slope system facing the equator provided a healthy energy receipt that was a high fraction of the energy receipt of a tracking system. The fixed-slope system has the advantage that it is not subject to shading issues that are to be experienced in a tracking system, with the shade being caused by modules being nearby.
The energy gain influence of using higher reflectance near the horizon was also carried out using a detailed view factor analysis. It was shown that for a near-horizon of 4 m, which is a commonly used parameter in the design of solar PV farms, the replacement of grass that had an albedo of 0.24 with white pebbles that had an albedo of 0.7 resulted in an energy gain of 24 W under average irradiance conditions.
Bifacial modules were modelled using commercial PV design software (PVsyst). It was found that for a higher latitude, such as Lincoln in England, the annual fraction of solar energy that may be converted to electricity was 0.253. The corresponding fraction for a low-latitude location, such as Bhavnagar in India, was 0.241; the lower figure was due to the much higher ambient temperature, which reduced the cell efficiency. Note, however, that the amount of annual electrical generation was much higher for Bhavnagar, i.e., 1782 MWh instead of 1134 MWh for Lincoln. The latter was due to the much higher solar energy income for Bhavnagar.
Based on the results, it can be concluded that regardless of the PV system installation location, the benefit of bifacial PV was quite apparent. The energy gain achieved compared with monofacial PV might appear to be a small value (2.8–6.5%); however, in the long run, the investor can take advantage of a lower payback period and higher return on investment from the large-scale deployment of bifacial PV. A case study conducted by the present research group showed that the UK’s levelised cost of electricity (LCOE) of the bifacial PV system can be 7% lower than monofacial PV, even for a grass-based horizon. Currently, the bifacial PV offers a 30-year lifetime, which is also an added benefit. As shown in Table 1, both the Lincoln and Bhavnagar PV sites attained the benefits of reflective irradiance at the rear side of the module, and the Bhavnagar site received two times more reflected irradiance (200 kWh/m2) than Lincoln (109 kWh/m2). This fact justifies the use of a higher reflective ground surface underneath the module to utilise the full potential of bifacial PV. For countries such as the UK, which receive more diffuse than direct solar irradiance, bifacial PV can provide a valuable opportunity.
The current literature is suggesting that bifacial modules offer a higher energy yield of 6% to 10% compared with traditional monofacial modules. Using data provided in the literature, the LCOE for a bifacial module with grass as a horizon was found to be 2% lower than a monofacial module with the same horizon. However, with white pebbles being used for the horizon for bifacial modules, the cost dropped by 6% when compared with monofacial modules with grass as the horizon.
In conclusion, it can be said that the deployment of large-scale solar farms can bring a positive change towards sustainable development in society and contribute to the circular economy. Most importantly, the growth of solar farms will drive a remarkable drop in solar energy prices, and thus, eradicate energy poverty around the globe. This can lead to attaining Sustainable Development Goal 7 (SDG 7), which aims to achieve low-cost clean energy for everyone by 2030 [34]. Another benefit of solar farm deployment worth mentioning is its economic value. Apart from creating employment opportunities, micro-enterprise growth in developing countries can bring potential community benefits. Some examples are cost-effective electricity in health facilities, education centres and lighting people’s houses. These facilities will eventually provide access towards a healthy life for underprivileged people, thus achieving the SDG’s first goal (SDG 1), i.e., reducing poverty.

Author Contributions

Conceptualization, T.M.; Methodology, T.M.; Software, M.A.; Validation, M.A.; Formal analysis, M.A.; Investigation, T.M., M.S.G. and M.A.; Data curation, M.S.G.; Writing–review & editing, M.S.G.; Supervision, M.S.G. All authors have read and agreed to the published version of the manuscript.

Funding

This research received no external funding.

Conflicts of Interest

The authors declare no conflict of interest.

Appendix A

View factor analysis for radiance exchange between the ground and PV modules 4′ and 4 (see Figure A1):
F 12 4 = 1 2 A 12 [ A 12 · F 12 34 A 2 · F 2 3 + A 1 · F 1 4 ]
F 12 44 = 1 2 A 12 [ A 12 · F 12 33 44 A 2 · F 2 33 + A 1 · F 1 44 ]
F 12 44 4 = 1 2 A 12 [ A 12 · F 12 33 3 44 4 A 2 · F 2 33 3 + A 1 · F 1 44 4 ]
F 12 34 = 0.0098475 ,   F 2 3 = 0.0096123 ,   F 1 4 = 0.0035225
F 12 3 3 44 = 0.015225     F 2 33 = 0.0146906 ,   F 1 44 = 0.0043127
F 12 33 3 44 4 = 0.017541 ,     F 2 33 3 = 0.016835 ,   F 1 44 4 = 0.00459
A 12 = 20 ,   A 2 = 18 ,   A 1 = 2
which leads to
F 12 4 = F 12 44 F 12 4   =
F 12 4 = F 12 44 4 F 12 44 =
The view factor between the ground and 4′ and between the ground and 4″ will be double the above respective values.
Figure A1. Configuration of two PV modules (half module shown as 4′ and 4″) and the supporting stand (shown as 4). The foreground is represented by areas 1 and 2. Dimensions: a1 = 1.42, a2 = 2, a3 = 2, b = 4, c1 = 0.5 and c2 = 4.5. All dimensions are in metres. The chosen PV module had Pmax, STC = 410 W and dimensions of 2 × 1 m.
Energies 15 08609 g0a1

References

  1. Mallard Pass Solar Farm. Preliminary Environmental Information Report Chapter 1–7; 2022. Available online: https://infrastructure.planninginspectorate.gov.uk/wp-content/ipc/uploads/projects/EN010127/EN010127-000012-Mallard%20Pass%20EIA%20Scoping%20Report%20Appendices.pdf (accessed on 1 September 2022).
  2. Gov.UK. Policy paper: British Energy Security Strategy. 2022. Available online: https://www.gov.uk/government/publications/british-energy-security-strategy/british-energy-security-strategy (accessed on 2 September 2022).
  3. Vagiona, D.G. Comparative Multicriteria Analysis Methods for Ranking Sites for Solar Farm Deployment: A Case Study in Greece. Energies 2021, 14, 8371. [Google Scholar] [CrossRef]
  4. Thabet, A.; Abdelhady, S.; Mobarak, Y. Design modern structure for heterojunction quantum dot solar cells. Int. J. Electr. Comput. Eng. (IJECE) 2020, 10, 2918–2925. [Google Scholar] [CrossRef]
  5. Thabet, M.A.; Abdelhady, S. Strategy trends of core/multiple shell for quantum dot-based heterojunction thin film solar cells. Aust. J. Electr. Electron. Eng. 2022, 19, 203–218. [Google Scholar] [CrossRef]
  6. Guerrero-Lemus, R.; Vega, R.; Kim, T.; Kimm, A.; Shephard, L.E. Bifacial solar photovoltaics—A technology review. Renew. Sustain. Energy Rev. 2016, 60, 1533–1549. [Google Scholar] [CrossRef]
  7. Alam, M.; Gul, M.S.; Muneer, T. Ground view factor computation model for bifacial photovoltaic collector field: Uniform and non-uniform surfaces. Energy Rep. 2021, 7, 9133–9149. [Google Scholar] [CrossRef]
  8. Roddis, P.; Roelich, K.; Tran, K.; Carver, S.; Dallimer, M.; Ziv, G. What shapes community acceptance of large-scale solar farms? A case study of the UK’s first ‘nationally significant’ solar farm. Solar Energy 2020, 209, 235–244. [Google Scholar] [CrossRef]
  9. Machlev, R.; Batushansky, Z.; Soni, S.; Chadliev, V.; Belikov, J.; Levron, Y. Verification of Utility-Scale Solar Photovoltaic Plant Models for Dynamic Studies of Transmission Networks. Energies 2020, 13, 3191. [Google Scholar] [CrossRef]
  10. Gul, M.S.; Puxty, D. Are Bifacial Photovoltaics a Sustainable Alternative to Monofacial Photovoltaics? CESC Res. Bull. 2021, 4. Available online: https://issuu.com/heriot-watt_university_dubai/docs/cesc_bulletin_4_september_2021 (accessed on 25 October 2022).
  11. VDMA. International Technology Roadmap for Photovoltaic, 11th ed.; ITRPV: Frankfurt am Main, Germany, 2020; p. 76. [Google Scholar]
  12. Recharge. Spanish renewables giant Iberdrola switches on Europe’s largest solar plant. 2022. Available online: https://www.rechargenews.com/energy-transition/spanish-renewables-giant-iberdrola-switches-on-europes-largest-solar-plant/2-1-1275686/ (accessed on 1 October 2022).
  13. Krechowicz, M.; Krechowicz, A.; Lichołai, L.; Pawelec, A.; Piotrowski, J.Z.; Stepien, A. Reduction of the Risk of Inaccurate Prediction of ElectricityGeneration from PV Farms Using Machine Learning. Energies 2022, 15, 4006. [Google Scholar] [CrossRef]
  14. Bazyari, S.; Keypour, R.; Farhangi, S.; Ghaedi, A.; Bazyari, K. A Study on the Effects of Solar Tracking Systems on the Performance of Photovoltaic Power Plants. J. Power Energy Eng. 2014, 2, 718–728. [Google Scholar] [CrossRef]
  15. Al Ami, A.; Batista, R. Performance Analysis of a Large Scale Photovoltaic Solar Grid Connected System. In Proceedings of the 34th IEEE Photovoltaic Specialists Conference (PVSC), Philadelphia, PA, USA, 7–12 June 2009. [Google Scholar]
  16. Guo, Y.Z.; Cha, J.Z.; Liu, W.; Tian, Y.B. A System Modeling Method for Optimisation of a Single Axis Solar Tracker. ICCASM 2010, 11, 11–30. [Google Scholar]
  17. Belt Rán, J.A.; González Rubio, J.L.; García-Beltrán, S.y.C.D. Design, Manufacturing and Performance Test of a Solar Tracker Made by a Embedded Control. In Proceedings of the Electronics, Robotics and Automotive Mechanics Conference (CERMA 2007), Cuernavaca, Mexico, 25–28 September 2007. [Google Scholar]
  18. Boicea, A.V.; Di Leo, P.; Graditi, G.; Spertino, F. Comparison of Operating Parameters in Grid Connected Photovoltaic Systems with Single/Double Sun-Trackers at Different Latitudes. In Proceedings of the SPEEDAM 2010, Pisa, Italy, 14–16 June 2010; pp. 130–133. [Google Scholar] [CrossRef]
  19. PV Magazine. Project to build 1.4 GW high-voltage cable linking Germany with the UK moves forward. 2022. Available online: https://www.pv-magazine.com/2022/07/22/project-to-build-1-4-gw-high-voltage-cable-linking-germany-with-the-uk-moves-forward/ (accessed on 1 July 2022).
  20. Colasante, A.; D’Adamo, I.; Morone, P. What drives the solar energy transition? The effect of policies, incentives and behavior in a cross-country comparison. Energy Res. Soc. Sci. 2022, 85, 102405. [Google Scholar] [CrossRef]
  21. Sukhatme, S.P. Solar Energy: Principles of Thermal Collection and Storage, 2nd ed.; Tata McGraw-Hill: Delhi, India, 1996. [Google Scholar]
  22. Liu, B.Y.; Jordan, R.C. The long-term average performance of flat-plate solar-energy collectors: With design data for the U.S., its outlying possessions and Canada. Sol. Energy 1963, 7, 53–74. [Google Scholar] [CrossRef]
  23. Kotak, Y.; Gul, M.S.; Muneer, T.; Ivanova, S.M. Investigating the Impact of Ground Albedo on the Performance of PV Systems. In Proceedings of the CIBSE Technical Symposium, London, UK, 16–17 April 2015. [Google Scholar]
  24. Gul, M.; Kotak, Y.; Muneer, T.; Ivanova, S. Enhancement of albedo for solar energy gain with particular emphasis on overcast skies. Energies 2018, 11, 2881. [Google Scholar] [CrossRef] [Green Version]
  25. Hay, J.E.; McKay, D.C. Estimating Solar Irradiance on Inclined Surfaces, A Review and Assessment of Methodologies. Int. J. Sol. Energy 1985, 3, 203–240. [Google Scholar] [CrossRef]
  26. Mani, A. Handbook of Solar Radiation Data for India; Allied Publishers Private Limited: Delhi, India, 1981. [Google Scholar]
  27. Hawas, M.; Muneer, T. Study of diffuse and global radiation characteristics for India. Energy Convers. Manag. 1984, 24, 143. [Google Scholar] [CrossRef]
  28. Feingold, A. Radiant interchange configuration factors between various selected plane surfaces. Proc. R. Soc. Lond. Ser. A Math. Phys. 1966, 292, 51–60. [Google Scholar]
  29. Mermoud, A.; Wittmer, B. Yield simulation for horizontal axis trackers with bifacial PV module in PVSyst. In Proceedings of the 35th European Photovoltaic Solar Energy Conference, Brussels, Belgium, 24–28 September 2018. [Google Scholar]
  30. Iqbal, M. An Introduction to Solar Radiation, 1st ed.; Elsevier: Amsterdam, The Netherlands, 1983. [Google Scholar]
  31. Perez, R.; Ineichen, P.; Seals, R.; Michalsky, J.; Stewart, R. Modeling daylight availability and irradiance components from direct and global irradiance. Sol. Energy 1990, 44, 271–289. [Google Scholar] [CrossRef]
  32. International Energy Agency. Bifacial Photovoltaic Modules and Systems: Experience and Results from International Research and Pilot Applications; Report IEA-PVPS T13-14:2021; International Energy Agency: Paris, France, 2021.
  33. CEA. 2022. Available online: https://www.cea3.com/cea-blog/lcoe-of-monofacial-vs-bifacial-modules-are-bifacials-worth-the-extra-cost (accessed on 1 November 2022).
  34. SEforALL. Sustainable Development Goal 7 (SDG7). 2021. Available online: https://www.seforall.org/sustainable-development-goal-7-sdg7#:~:text=SustainableDevelopmentGoal7(SDG7)callsfor“affordable%2C,reliableandmodernenergyservices (accessed on 1 November 2022).
Figure 1. Schematic for the computation of view factor A1-22 to be incorporated for radiance from surface 1 to surface 22. Note: surface 1 represents the ground and surface 22 the PV module. A1 = 1, F1-2 = 0.169, F1-21 = 0.151, F1-22 = F1-2 − F1-21 = 0.018.
Energies 15 08609 g001
Figure 2. Relationship between the effective view factor and angle of inclination β of the PV module. This relationship is valid only for the given geometry.
Energies 15 08609 g002
Figure 3. Image for Lincoln (top) and Bhavnagar solar farms (bottom).
Energies 15 08609 g003
Figure 4. Monthly energy generation of the (a) Lincoln Solar Farm and (b) Bhavnagar Solar Farm.
Energies 15 08609 g004
Figure 5. Monthly performance ratio of the (a) Lincoln Solar Farm and (b) Bhavnagar Solar Farm.
Energies 15 08609 g005
Table 1. Solar radiation received when using mode III, mode V and a south-facing fixed slope for Lincoln and Bhavnagar.
LINCOLNM III, BeamM III, TotalM V, BeamM V, TotalFixed SlopeM III/Fixed Slope
January4498111071134910690.76
March198232192717379232950.98
May407061204427638554931.11
July350857183765589252111.10
September224836922882417337310.99
November5329621177151312450.77
213234202673385133411.02
BHAVNAGARM III, BeamM III, TotM V, BeamM V, TotFixed Slope
January430057095426669456331.01
March608877403446805168241.13
May206744452083445739641.12
July279150252880507645681.10
September383053644689608752651.02
November584768287146804765361.04
415458524278640254651.07
Table 2. a. View factor between two parallel PV modules. The length and width of the module are 2 and 1 m, respectively, and the distance between the modules is 2 m. b. Effective view factor between the sky and the module.
a
β, DegreesView Factor
150.040
300.070
450.090
600.105
750.115
900.120
b
βVF1Effective VF
150.0400.943
300.0700.863
450.0900.764
600.1050.645
750.1150.514
900.1200.380
Notes: β is the inclination from the horizontal in degrees.
Table 3. Simulation parameters and output for the ground albedo of 0.5.
Site LocationLincolnBhavnagar
Available solar resources
Global horizontal irradiance (kWh/m2)10261846
Diffuse horizontal irradiance (kWh/m2) 549878
Global tilted irradiance (kWh/m2)12071991
Ground reflection on the rear side (kWh/m2)109200
Average ambient temperature (°C)10.1327.33
PV system components
Module manufacturerJA SolarJA Solar
Module power (kWp)540540
No. of modules18561856
Inverter manufacturerSMASMA
Inverter capacity (kWp)100100
No. of inverters99
Simulation output
Total installed capacity (kWp)10021002
Declared net capacity (kWac)900900
Specific yield (kWh/kWp/year)11321778
Generation (MWh/year)11341782
Performance ratio (PR)93.80%89.28%
P10 * (MWh)1184.11852.7
P50 (MWh)11341,782
P90 (MWh)1084.71,712
* Refers to 10 as a percentile.
Table 4. Economic comparison of Bifacial against monofacial PV power plants.
MonofacialBifacial
Module cost, USD/W0.3050.315
Energy index, kWh/kW/year16291650
Generated energy over 25 years, GWh191193.4
LCOE, USD/kWh0.02240.0222
Publisher’s Note: MDPI stays neutral with regard to jurisdictional claims in published maps and institutional affiliations.

