Article

Geology and Geochemistry of the Hydrocarbon Compositional Changes in the Triassic Montney Formation, Western Canada

by
Gareth R. L. Chalmers
1,*,
Pablo Lacerda Silva
2,
Amanda A. Bustin
2,
Andrea Sanlorenzo
2 and
R. Marc Bustin
2
1
School of Science, Technology and Engineering, University of the Sunshine Coast, Sippy Downs, QLD 4556, Australia
2
Department of Earth, Ocean and Atmospheric Sciences, University of British Columbia, Vancouver, BC V6T 1Z4, Canada
*
Author to whom correspondence should be addressed.
Energies 2022, 15(22), 8677; https://doi.org/10.3390/en15228677
Submission received: 14 October 2022 / Revised: 6 November 2022 / Accepted: 9 November 2022 / Published: 18 November 2022
(This article belongs to the Special Issue Characterization of Unconventional Petroleum Reservoirs)

Abstract

:
The geochemistry of produced fluids has been investigated in the Triassic Montney Formation in the Western Canadian Sedimentary Basin (WCSB). Understanding the geochemistry of produced fluids is a valuable tool in the exploration and development of a complex petroleum system such as the Montney Formation. The petroleum system changes from in situ unconventional reservoirs in the west to more conventional reservoirs that contain migrated hydrocarbons to the east. The workflow of basin modeling and mapping of isomer ratio calculations for butane and pentane as well as the mapping of excess methane percentage was used to highlight areas of gas compositional changes in the Montney Formation play area. This workflow shows the migration of hydrocarbons from deeper, more mature areas to less mature areas in the east through discrete pathways. Methane has migrated along structural elements such as the Fort St. John Graben as well as areas that have seen changes in higher permeability lithologies (i.e., well 14-23-74-8W6M). Excess methane percentage calculations highlight changes due to fluid mixing from hydrocarbon migration. The regional maturation polynomial regression line was used to determine the gas dryness percentage for each well on the basis of its maturation level determined by the butane isomer ratio. The deviation from the calculated gas dryness according to the regression was determined as an excess methane percentage. The British Columbia (BC) Montney play appears to have hydrocarbon compositions that reflect an in situ generation, while the Montney play in Alberta (AB) has a higher proportion of its hydrocarbon volumes from migrated hydrocarbons. The workflow provides a better understanding of the hydrocarbon system to optimize operations and increase production efficiency. Understanding the distribution of gas compositions within a play area will provide key information on the liquid and gas phases present and an understanding of how gas composition may change over the well life, as well as helping to maximize liquid recovery during well operations.

1. Introduction

The Montney Formation in the Western Canadian Sedimentary Basin (WCSB) is an unconventional to hybrid petroleum system that provides significant contributions to the Canadian energy portfolio. For example, the Montney Formation produced 34% of natural gas to the total Canadian gas production in 2017 [1]. One major issue facing upstream and midstream operators as well as regulators when developing the Triassic Montney Formation in western Canada is the seemingly inexplicable areal zonation and yield of producible hydrocarbon liquids. To add to this complexity, there can be a distinct stratigraphic zonation of hydrocarbon liquids that is not predictable from buoyancy and fluid gravity (i.e., [2]). The Montney Formation petroleum system is complex, with initial formation of petroleum being generated in deeper western areas with secondary cracking of the hydrocarbons to drier gases migrating updip and mixing with in situ wetter petroleum in less mature areas to the east [2,3,4]. The mixing of the more mature longer chained hydrocarbons (LHCs) changes the petroleum composition and can reduce the confidence in the prediction of hydrocarbon composition on the basis of its relationship to the basin-scale maturation trend. This is further complicated by regional structures, such as the Peace River Arch, Fort St. John Graben, Hay River Fault Zone, and the Laurier Embayment areas that modify depositional and subsidence rates as well as the depth of burial that affects the regional maturation trends and the generation of hydrocarbons (i.e., [5,6,7]). Understanding and predicting the presence and amount of producible hydrocarbon in a liquid phase is a critical aspect to the economic development of unconventional plays (i.e., [8]). In western Canada, the presence of hydrocarbon liquids is a major consideration in valuing resources, reserves, and production, as well as in the design of mid-stream facilities (i.e., [9]). The lack of prior knowledge of the presence and abundance of hydrocarbons in a liquid phase can also result in operational inefficiencies and higher operating and capital expenditures.
The Montney reservoir varies between unconventional reservoirs with a nanometre-scaled pore system with low permeability [10] and high capillary pressures to conventional reservoirs (i.e., bioclastic packstone/grainstone coquina; [11]) in some areas, with higher permeabilities and lower capillary pressure [12]. In general, the unconventional hydrocarbon system with the higher capillary pressures creates a higher SHC (shorter-chained hydrocarbons) content in deeper parts of the basin in the west and a higher LHC (longer-chained hydrocarbons) content in the east [13,14], and this relationship has been described as an inverted reservoir [15]. In the Montney Formation, although the geographical variation in hydrocarbon liquids is in general predictable from regional maturation trends (first-order variation; i.e., [4,5,16]), in detail, the variation in producible hydrocarbons in a liquid phase in many areas is exceedingly complex due to second- and third-order factors. Second- and third-order factors in the variation in hydrocarbon composition include regional to local fault and fracture networks, lithological changes, stratal thickness changes, changes in kerogen types, differing diagenetic processes, heat flow variations, and petrophysical differences (i.e., capillary pressure). In the Montney Formation, there are pools where hydrocarbons in a liquid or gas phase are complexly vertically stratified due to changes in capillary pressure that do not conform to hydrocarbon gravity, and this creates unique challenges in optimizing completions and production. Understanding the distribution of gas compositions within a play area will provide key information on liquid and gas phases present, providing information on how gas composition may change over the well life and helping to maximize liquids recovery during well operations.
The geochemical composition of hydrocarbons has been used by researchers to map the distribution across the Montney Formation—for example, [13] used dry gas index (DGI) to map the distribution of hydrocarbon composition for the Montney Formation. [17] used the isomers of butane gas (i.e., iC4/nC4) as a tool for maturation patterns in the Barnett and Fayetteville formations. [2] then applied this isomer ratio of butane workflow and introduced the excess methane percentage calculation to highlight the migration of methane from deeper sections of the Montney Formation (proximal to deformation front) to the wetter (i.e., longer chained gases like butane, ethane, pentane) areas to the east. The authors suspected the methane has migrated along localised lithological changes in the Montney Formation; however, the authors did not petrophysically examine these areas. [18] utilised a hydrocarbon geochemical methodology to understand the unconventional to conventional Montney plays across the WCSB, resulting in a somewhat complicated workflow derived from the [19] Barnett shale model. Mapping the variation in the geochemical fingerprint of hydrocarbons has been shown to be a powerful tool that can help unravel the complexities due to the degree of mixing of in situ and ex situ hydrocarbons.
This paper presents a simple workflow, derived from the work of [17] and [2], that can aid the understanding of complex interactions between basin evolution, regional structural activity, sedimentation patterns, total organic carbon content and type, maturation trends, and in situ versus migrated hydrocarbon compositional trends within a hybrid petroleum system. This study also illustrates the effective use of hydrocarbon geochemistry, particularly isomer ratios, in calculating an excess methane content (as a percentage), and when mapped, highlighting areas that have seen the migration of deeper, more mature hydrocarbons (i.e., methane) into less mature areas. The paper geographically expands on the initial work by [2] and will aid the prediction of the expected hydrocarbon composition as well as tools needed to understand why hydrocarbon composition departs from the regional maturation correlation.

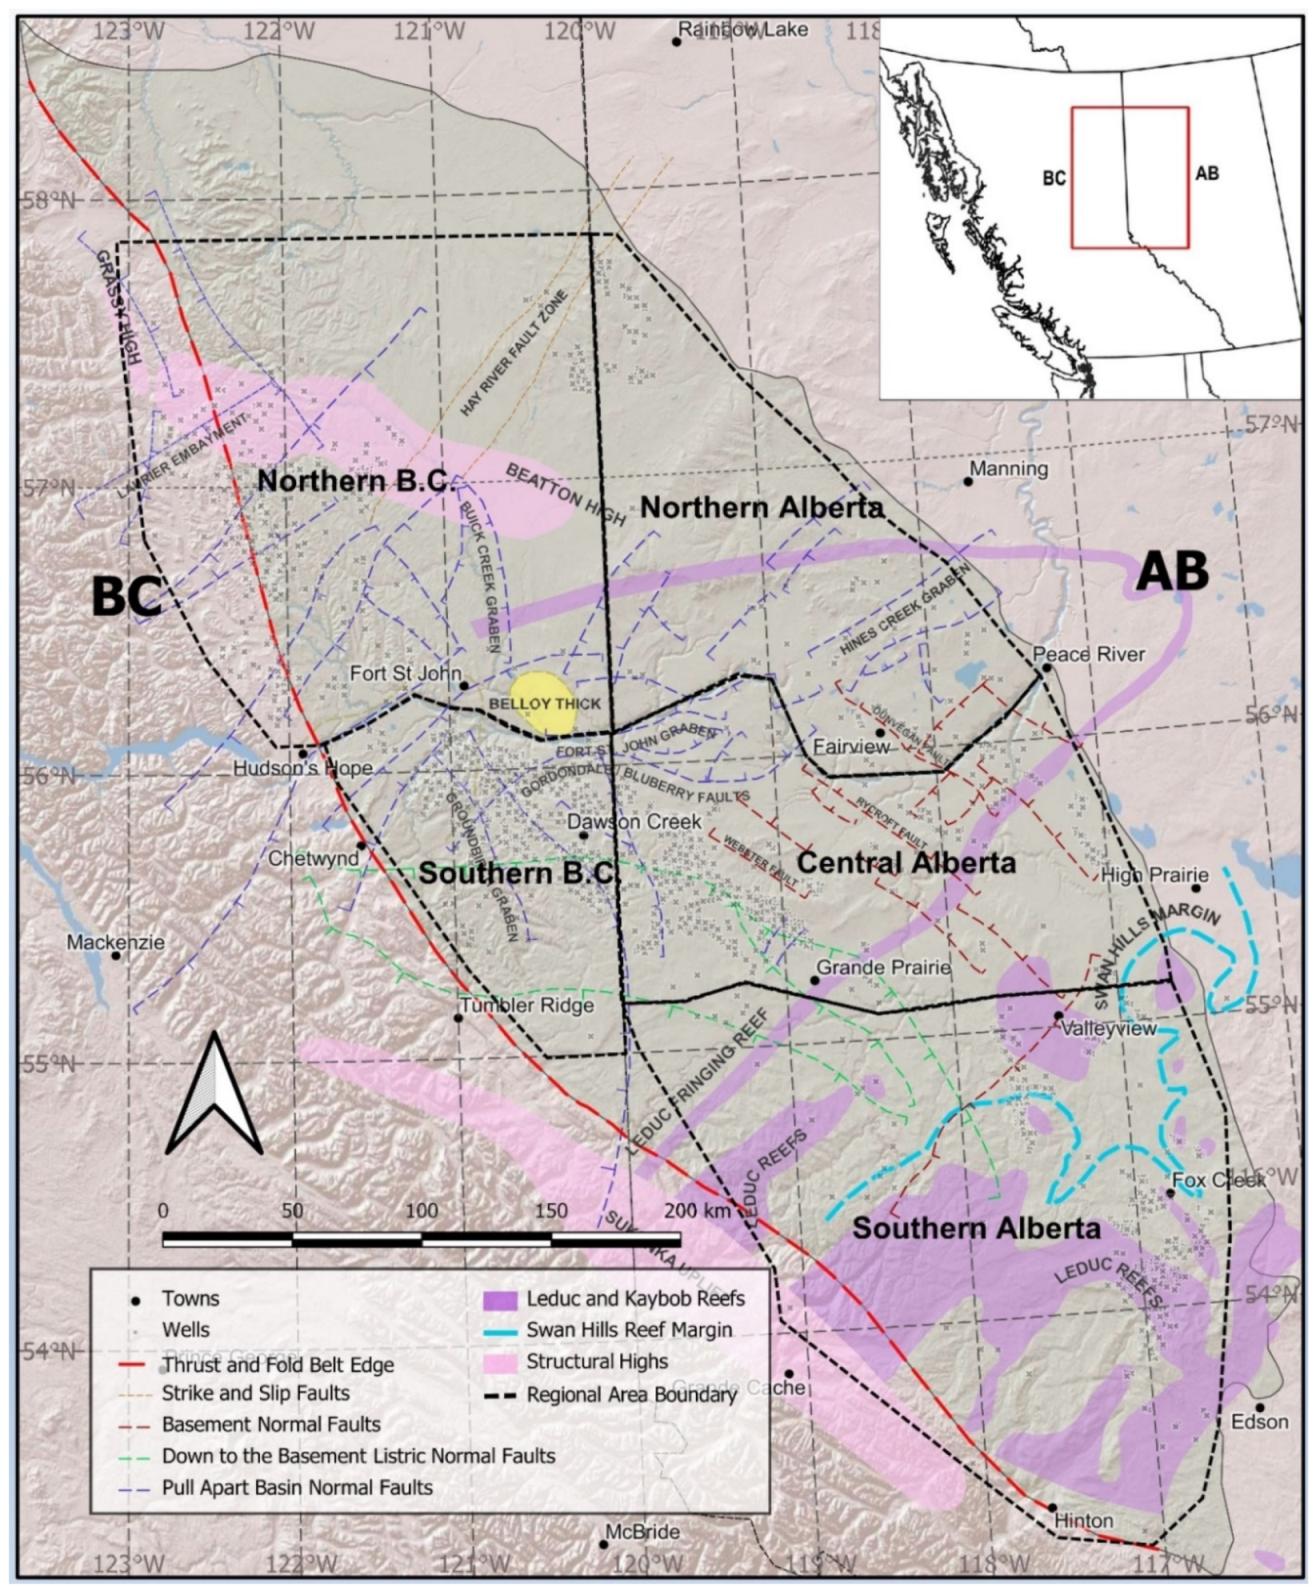
2. Geological Background

The Triassic Montney Formation was deposited along a passive continental margin and consists of a westward thickening siliciclastic prograding wedge [20,21,22,23,24]. More recently, a tectonically influenced model for the deposition [25] and fore-arc basin configuration [26,27] have been proposed.
The Montney Formation represents part of the three transgressive–regressive (T-R) cycles that deposited the Triassic strata in northeastern British Columbia [22,28]. The depositional setting for the Montney Formation is described as an open shelf marine environment [22]. Paleogeographic reconstruction for Triassic sedimentation suggests a paleoshoreline that prograded during sea level regressions to just east of the Fort St. John and the Alberta/BC border [29]. During this time, shallow shelf muds covered the study area and deeper marine muds deposited to the west of the study area.
The Montney Formation unconformably overlies Carboniferous or Permian strata and consists of variable amounts of interbedded shale, siltstone, and sandstone. Within British Columbia, [30] subdivided the Montney Formation into the lower siltstone–sandstone and the Upper shale members on the basis of lithostratigraphy. Members are separated by a basin-wide unconformity that developed due to tectonic uplift of the basin margin [21]. The shale member is absent within Alberta and progressively becomes thicker (up to 159 m) towards the foothills of British Columbia to the west [30]. More recently, the Montney Formation was subdivided on the basis of sequence stratigraphic analyses and consists of Upper, Middle, and Lower units [31]. These subdivisions more or less correlate with the siltstone–sandstone and shale members of [30]. This study was the subdivisions of [31] to identify any stratigraphic differences in hydrocarbon composition distributions.
Diagenetic processes are important influences on reservoir quality of the Montney Formation. Dolomite, ankerite, calcite, quartz, and anhydrite are common cements within the Montney Formation in west-central Alberta [20]. Structural features located within the study area consist of asymmetrical pull-apart grabens with failed arms, shallow fault systems that developed during the Laramide thrusting, and deeper basement faults that follow the basement terranes ([32]; Figure 1, this study). Graben faults within the Peace River Embayment were active during the Triassic, which affected the deposition of the Montney Formation. It has been argued that structural lineaments exert some control on the location of sweet spots in the conventional and unconventional Montney plays through the formation of localized thickened sections and migration pathways [33].

3. Methodology

Well data for this study, the hydrocarbon composition of produced or test fluids were compiled from a total of 4488 wells (2804 wells in British Columbia and 1684 wells in Alberta). A sub-set of wells were used from this database to provide information on the stratal thickness, total vertical depths, maturity indicator (Tmax) values, kerogen types and the total organic content (TOC) content. Gas composition (i.e., methane, butane, ethane) of the produced or tested hydrocarbons from the Montney Formation are routine gas analyses and are made publicly available via the Alberta Energy Regulator and the British Columbia Oil and Gas Commission. These data sets were collected through a third party commercial software (geoSCOUT version 8.8; geoLOGIC systems ltd) and all well data that were accessible (as of 19 September, 2022) are included in this study. Data sets were checked for validity and accuracy and erroneous data were excluded from the data sets.
Gas composition of the produced or tested hydrocarbons are performed at commercial laboratories and use gas chromatographic methods (i.e., [34]). Gas dryness is calculated from the ratio of methane to the sum of methane (C1), ethane (C2), propane (C3), butane (C4) and pentane (C5). Only C2 to C5 wet gases are used in the measurements as longer chained hydrocarbons (LHCs) are not routinely measured in each well. This study has also utilised cross-plots of iC4/nC4 isomer ratio of butane versus the gas dryness for BC and Alberta. Gas dryness is the ratio between the methane fraction and the sum of all hydrocarbons for each sampled well. The regional maturation polynomial regression line from [4] was used to determine the gas dryness percentage for each well based on its maturation level determined by the butane isomer ratio. The deviation from the calculated gas dryness based on the regression was determined as an excess methane percentage and subdivided into nine categories of excess methane (< 1%; 1–2%; 2–3%; 4–5%; 6–7%; 8–10%; 11–12%; and 12%+).
The thermal maturity indicator, Tmax [35], was mapped for the Montney Formation. Tmax values were obtained from the public domain and reviewed for consistency within each well and for regional agreement. Data outside of the reasonable range expected for Tmax between 400 to 550 °C was discarded. South of Dawson Creek, in the overmature area, Tmax measurements are unreliable, and converted vitrinite reflectance data from [2] were used instead. In the south corner of the subcrop area, around Hinton, data are sparse and the map vitrinite reflectance data published by the Alberta Energy Regulator [36] was used as a guide. A vitrinite reflectance to Tmax correlation based on [37] was used.
A reconstruction of the burial and thermal history of the Montney Formation was conducted through basin modeling using the Schlumberger PetroMod software. Publicly available regional heat flow data [38,39] were used to map present-day heat flow. The post-Laramide heat flow distribution (60 Ma) was calculated as 90% of the present-day heat flow, based on estimates by [40]. A constant heat flow of 55 mW/m2 was assumed for the Cambrian, based on an average for the North American continent [41].
Organic geochemistry of the kerogen is based on 10,000 Rock-Eval analyses from the public domain [10,36,42,43,44,45,46,47,48,49,50,51].

4. Results and Discussion

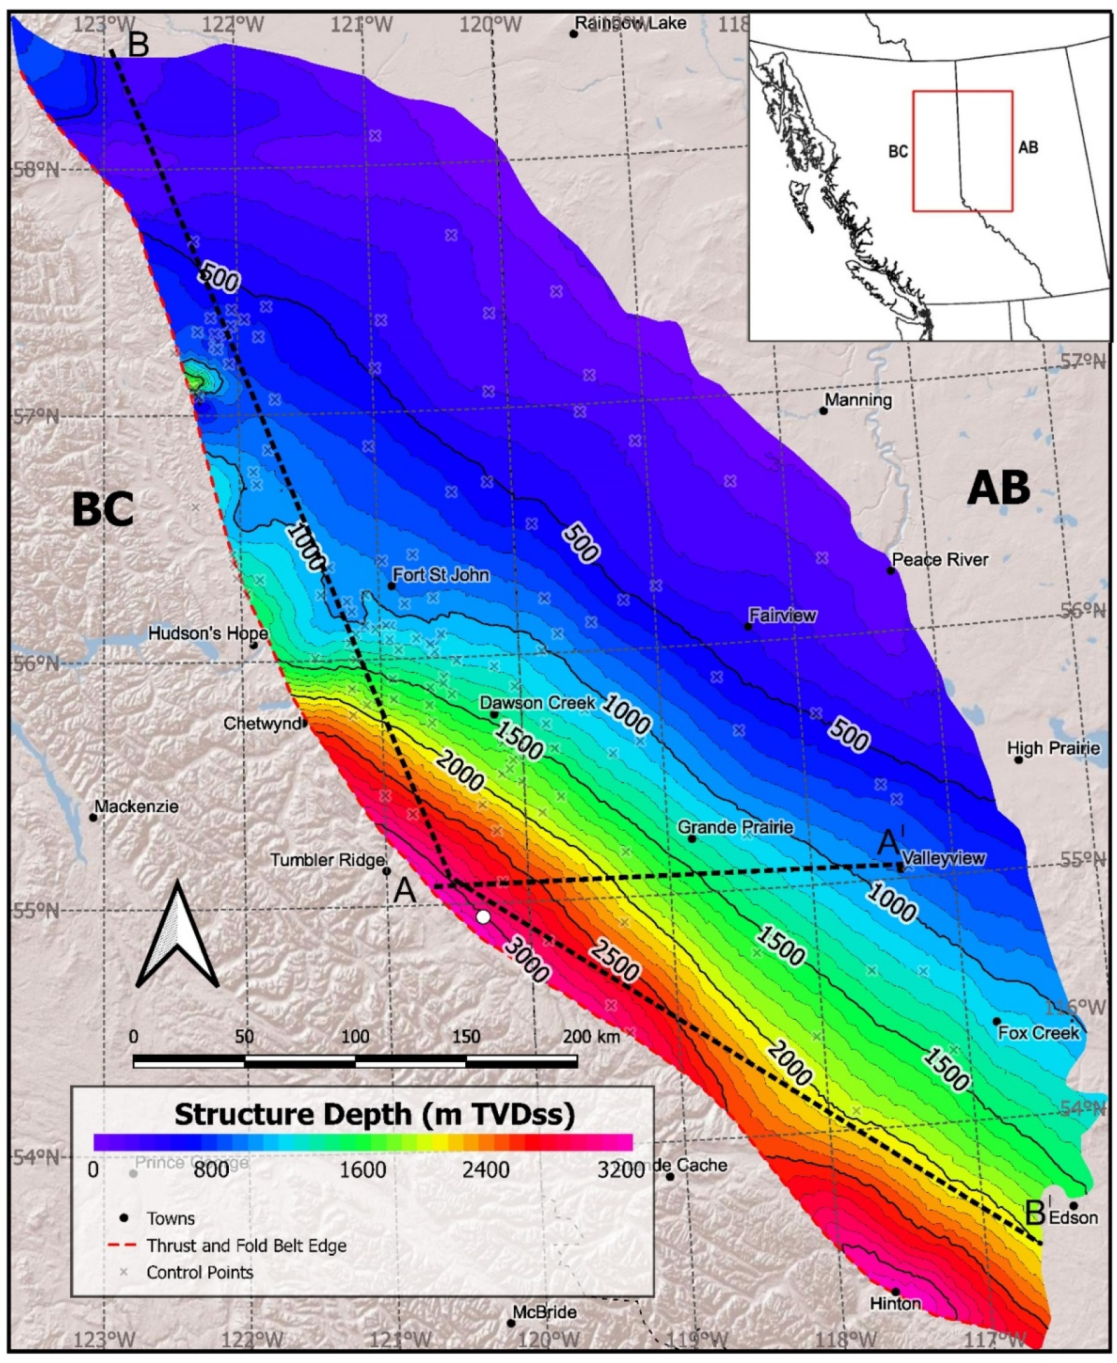
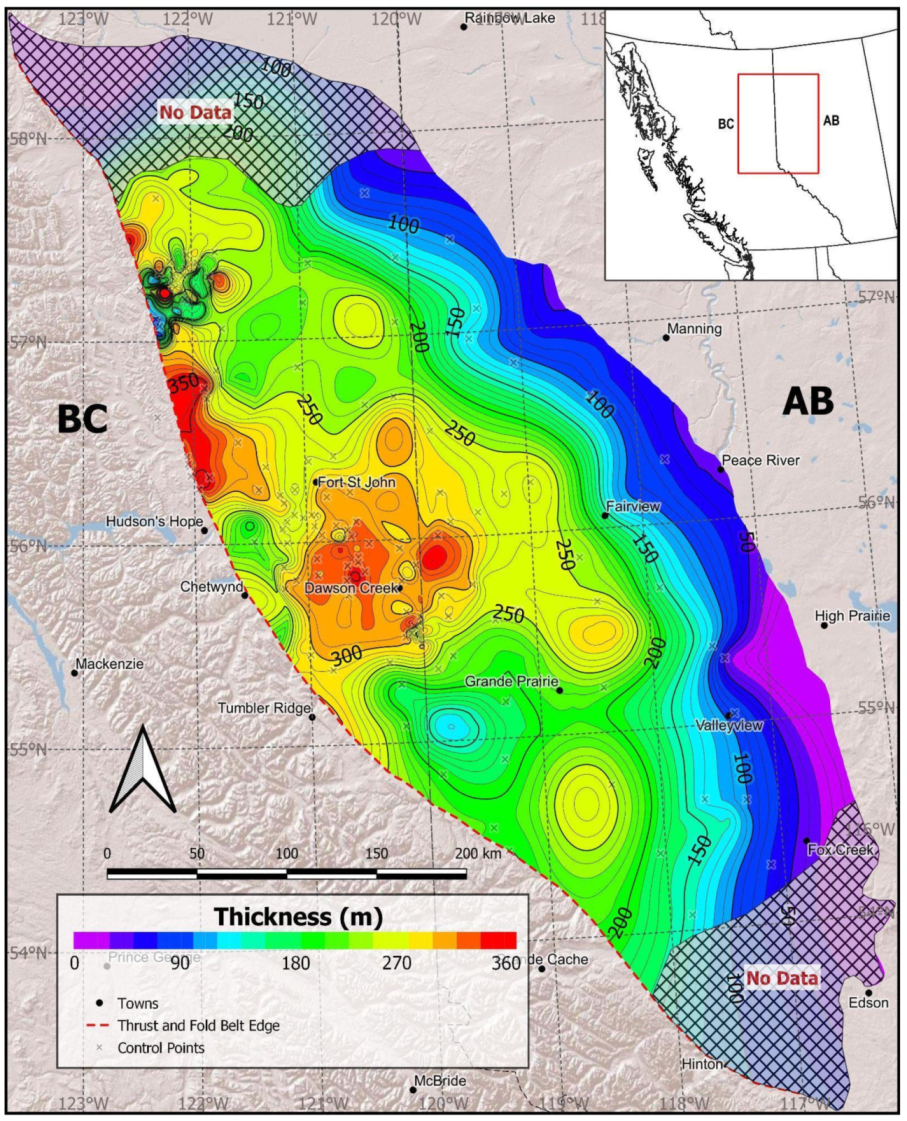
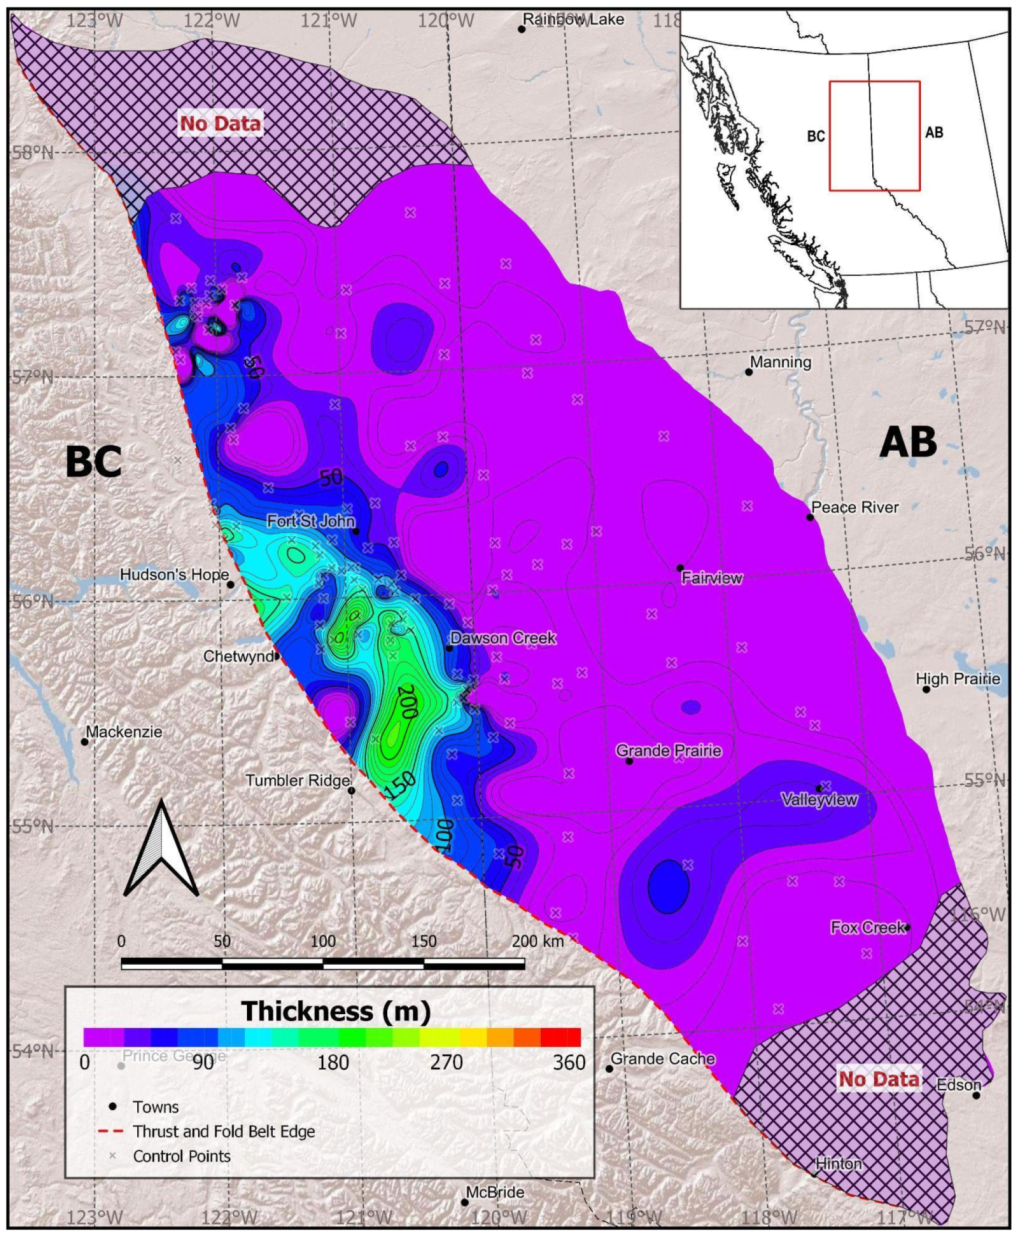
4.1. Structure and Isochore

The Montney Formation structure and isochore data were mapped (Figure 2, Figure 3, Figure 4, Figure 5 and Figure 6) using the stratigraphic picks of [31]. The subcrop area of the Montney Formation to the northwest of the fold and thrust belt forms an elongated belt extending over a maximum of 250 km and dipping to the southwest (Figure 2). The top and base structures of the Montney Formation are sub-parallel and follow the general southwesterly dip trend of the Phanerozoic in the basin (Figure 2). The present-day subsea depths to the top of the Montney Formation range from 200 m in the northeastern part of the subcrop, near the border between British Columbia and Alberta, to 3200 m along the southwestern limit of the deformation front (Figure 2). The structure on top of the Montney Formation is significantly shallower to the northwest of the Fort St. John Graben, where it forms a plateau immediately west of Fort St. John and does not exceed 1500 m of subsea elevation.
The isochore thickness of the Montney Formation generally increases towards the deformation front (Figure 3). However, there is an increase in the thickness south of the Fort St. John area due to the active subsidence of the Fort St. John Graben structure. Thickness remains consistent in most parts of the basin with the exception of the areas north of latitude 57° and west of longitude 122°, which may be due to large-scale structural features related to the Laurier Embayment ([32]; Figure 1, this study).
The thickness of the Upper Montney Formation varies between 0 and 200 m and shows significant thickness (greater than 50 m) in the proximity of the deformation front and within the Fort St. John Graben areas (Figure 4). The Upper Montney Formation is either very thin or absent in the majority of Alberta. The majority of the Montney Formation thickness is within the Middle Montney Formation (Figure 5), which ranges from 50 to 250 m across most of the BC and Alberta play areas. The thickest part of the Middle Montney is west of Fort St. John and Grand Prairie and runs parallel to the deformation front. The Middle Montney Formation thins towards the subcrop to the east, towards Peace River and High Prairie. The Lower Montney Formation thickness varies between 0 and 120 m. Similar to the Upper Montney Formation, the Lower Montney Formation is absent or very thin in Alberta with the exception of the several localised depocentres (Figure 6). The Lower Montney Formation also thins towards the eastern margins of the Montney Formation subcrop area in Alberta.

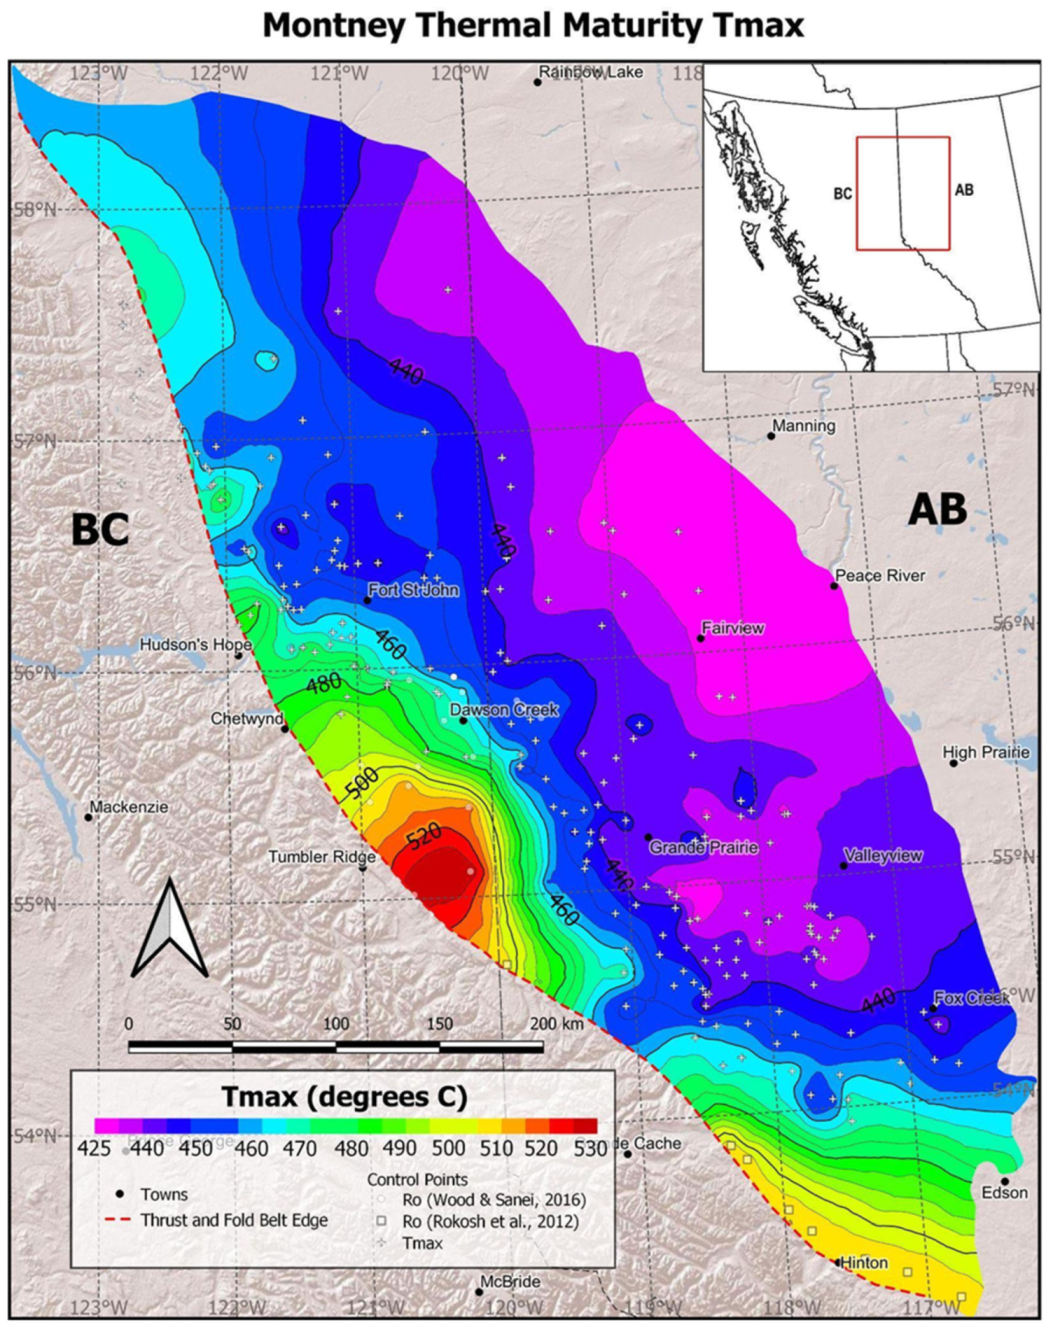
4.2. Thermal Maturity

The regional trend of thermal maturity (Tmax) is generally subparallel to the basin axis, increasing to the southwest towards the eastern limit of the deformation front (Figure 7). Thermal maturity trend deflections from the current depth of burial, such as the overmature areas south of Dawson Creek and in the southern edge, around Hinton, are caused by second- and third-order controls, such as variable amounts of eroded section, variations in the heat flow patterns, and large structural features such as Fort St. John graben [4]. Maturity trends impact the hydrocarbon composition of the Montney Formation.

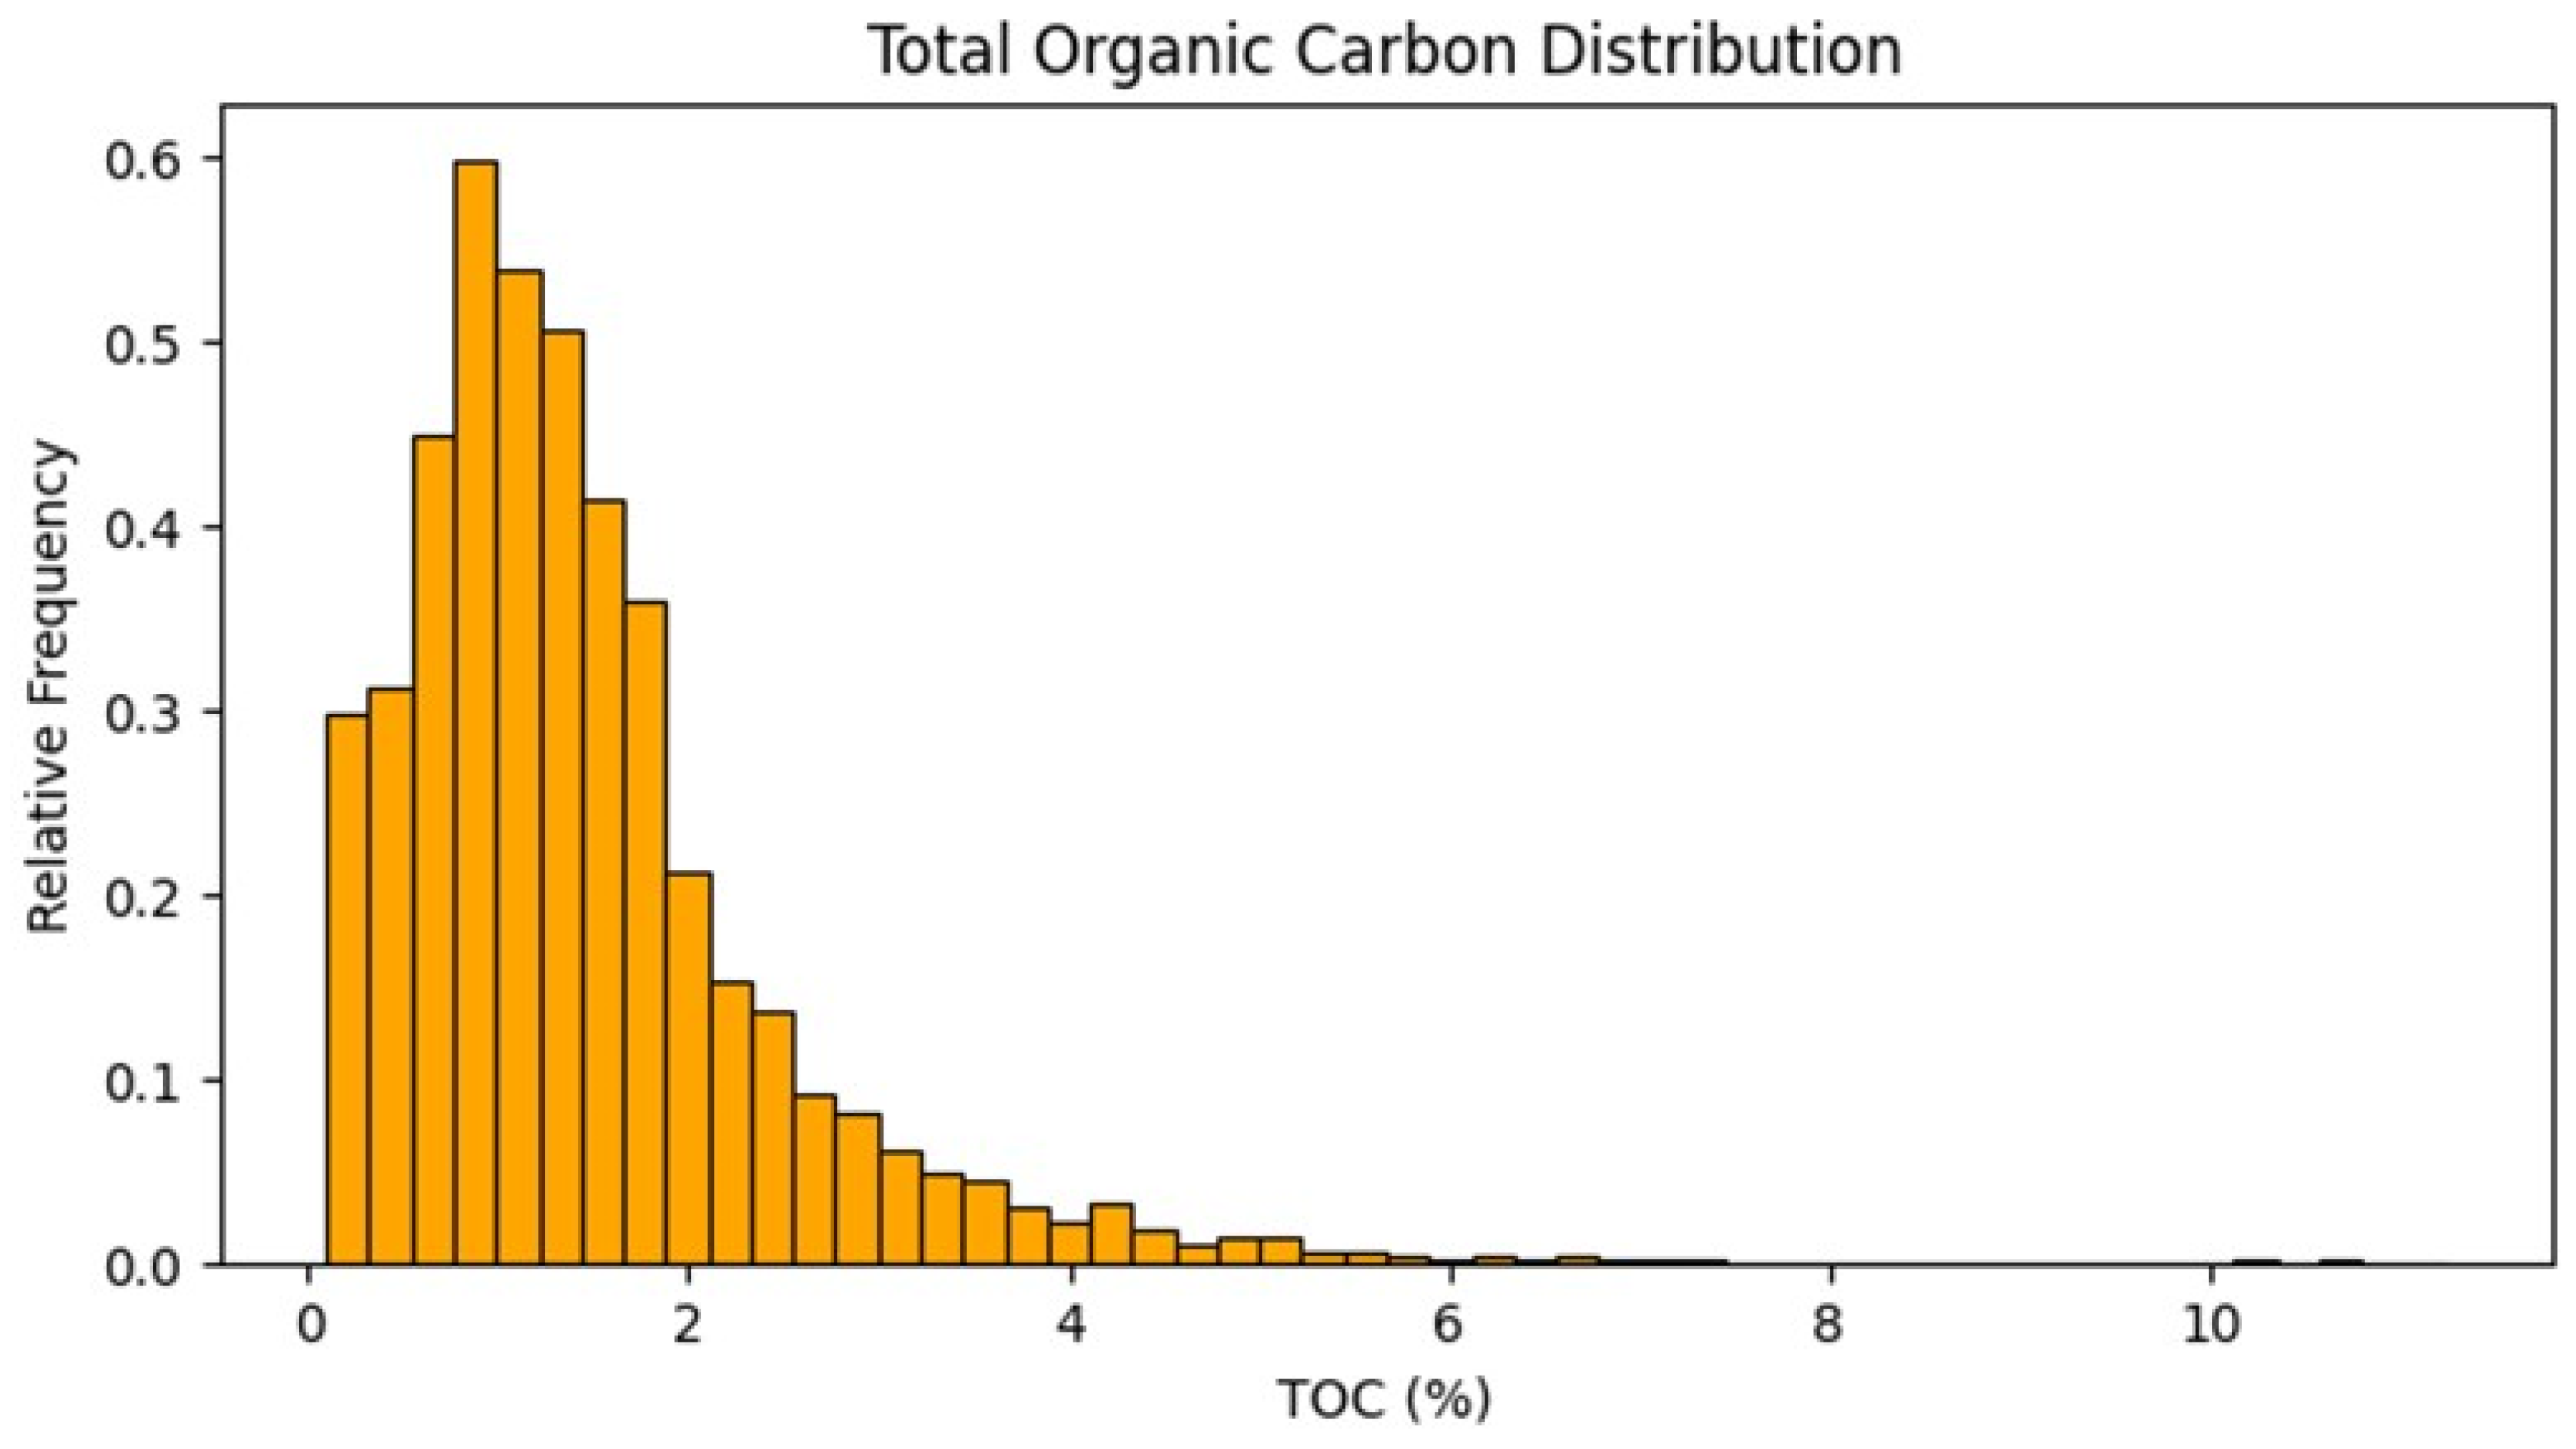
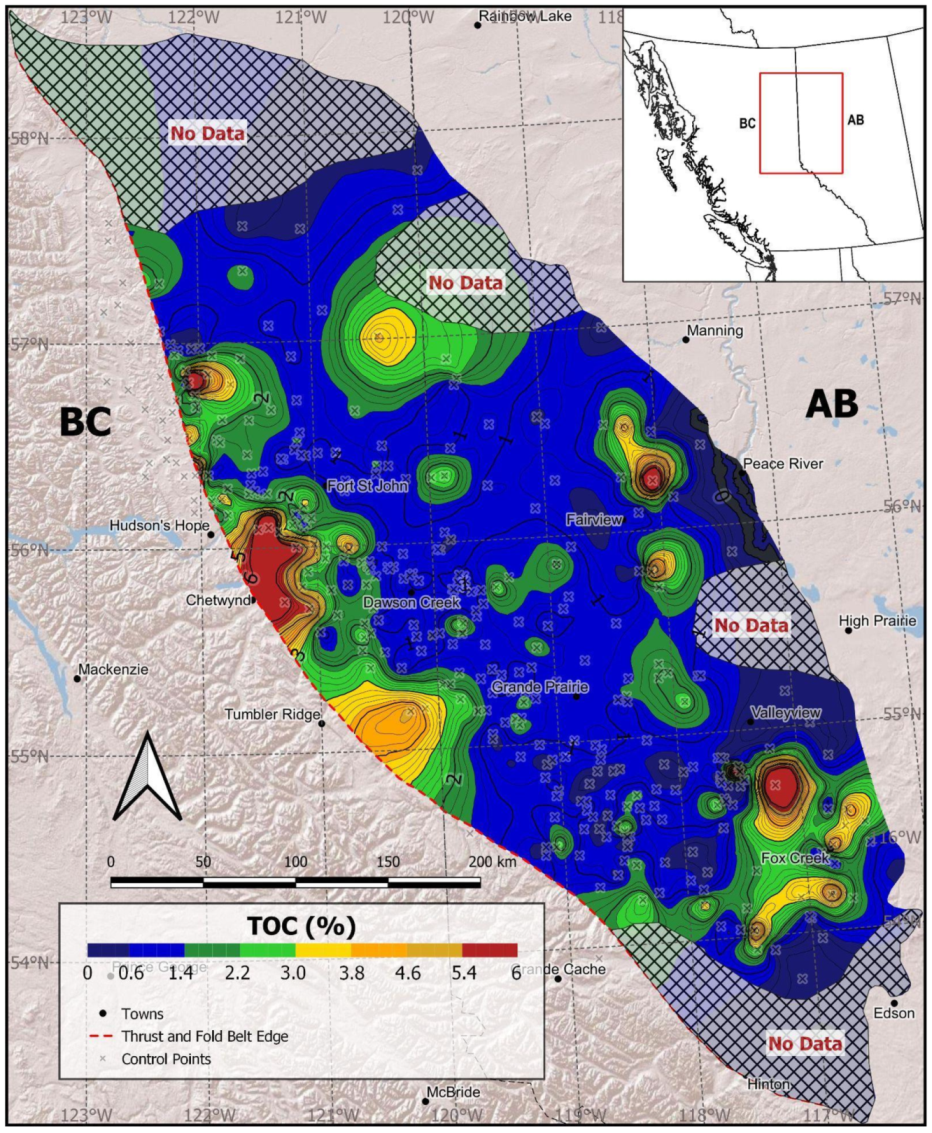
4.3. Total Organic Carbon and Kerogen

The total organic carbon (TOC) content in the Montney Formation ranges from 0.1 to 12%, with a 10th percentile of 0.4%, a median of 1.2%, and a 90th percentile of 2.7% (Figure 8). The geographic distribution of TOC content suggests higher organic richness adjacent to the deformation front (Figure 9) which coincides with a higher gamma ray and higher resistivity, particularly where the Upper Montney Formation is thicker (Figure 4). The higher TOC content in the western edge of the basin may be due to deeper marine water with anoxic bottom water (i.e., 200 to 400 m deep; [52]) that preserved the organic matter compared to more shallow marine conditions in the east in Alberta. Along the eastern edge, particularly in the southeast, there are areas of relatively higher TOC content, which are likely due to the low thermal maturity in these regions, and consequently lower kerogen transformation ratios or a difference in the depositional environment such as a decrease in oxygen content in the water column in localised deeper water settings. The geographic distribution of TOC content, however, is based on point data from sample analysis (i.e., TPH/TOC source rock analyser—SRA™) and therefore may be biased according to more heavily sampled locations and stratigraphic intervals.
The Montney Formation is predominantly composed of kerogen types II and III (Figure 10), with a hydrogen index of up to 750 mg HC/g TOC (Figure 11). The hydrogen index was measured by the TPH/TOC source rock analyser (SRA™). The HI and kerogen types are highly variable due to data sampling from diverse depositional environments of the Montney Formation (i.e., offshore deep water, nearshore bioclastic shorelines) and from across the maturation spectrum. The HI map (Figure 11) decreases in a trend that approximately follows thermal maturity, from 460 mg HC/g near the eastern edge to less than 20 mg HC/g in the overmature central western and southwestern regions as more hydrogen is converted to hydrocarbons. A kerogen reaction kinetics model (Figure 12) was created on the basis of an average of kerogen types II and III from the Doig Formation, as described in detail in [53]. The median activation energy was found to be 52 kcal/mol, with a pre-exponential factor of 1.81 × 1025/Ma.

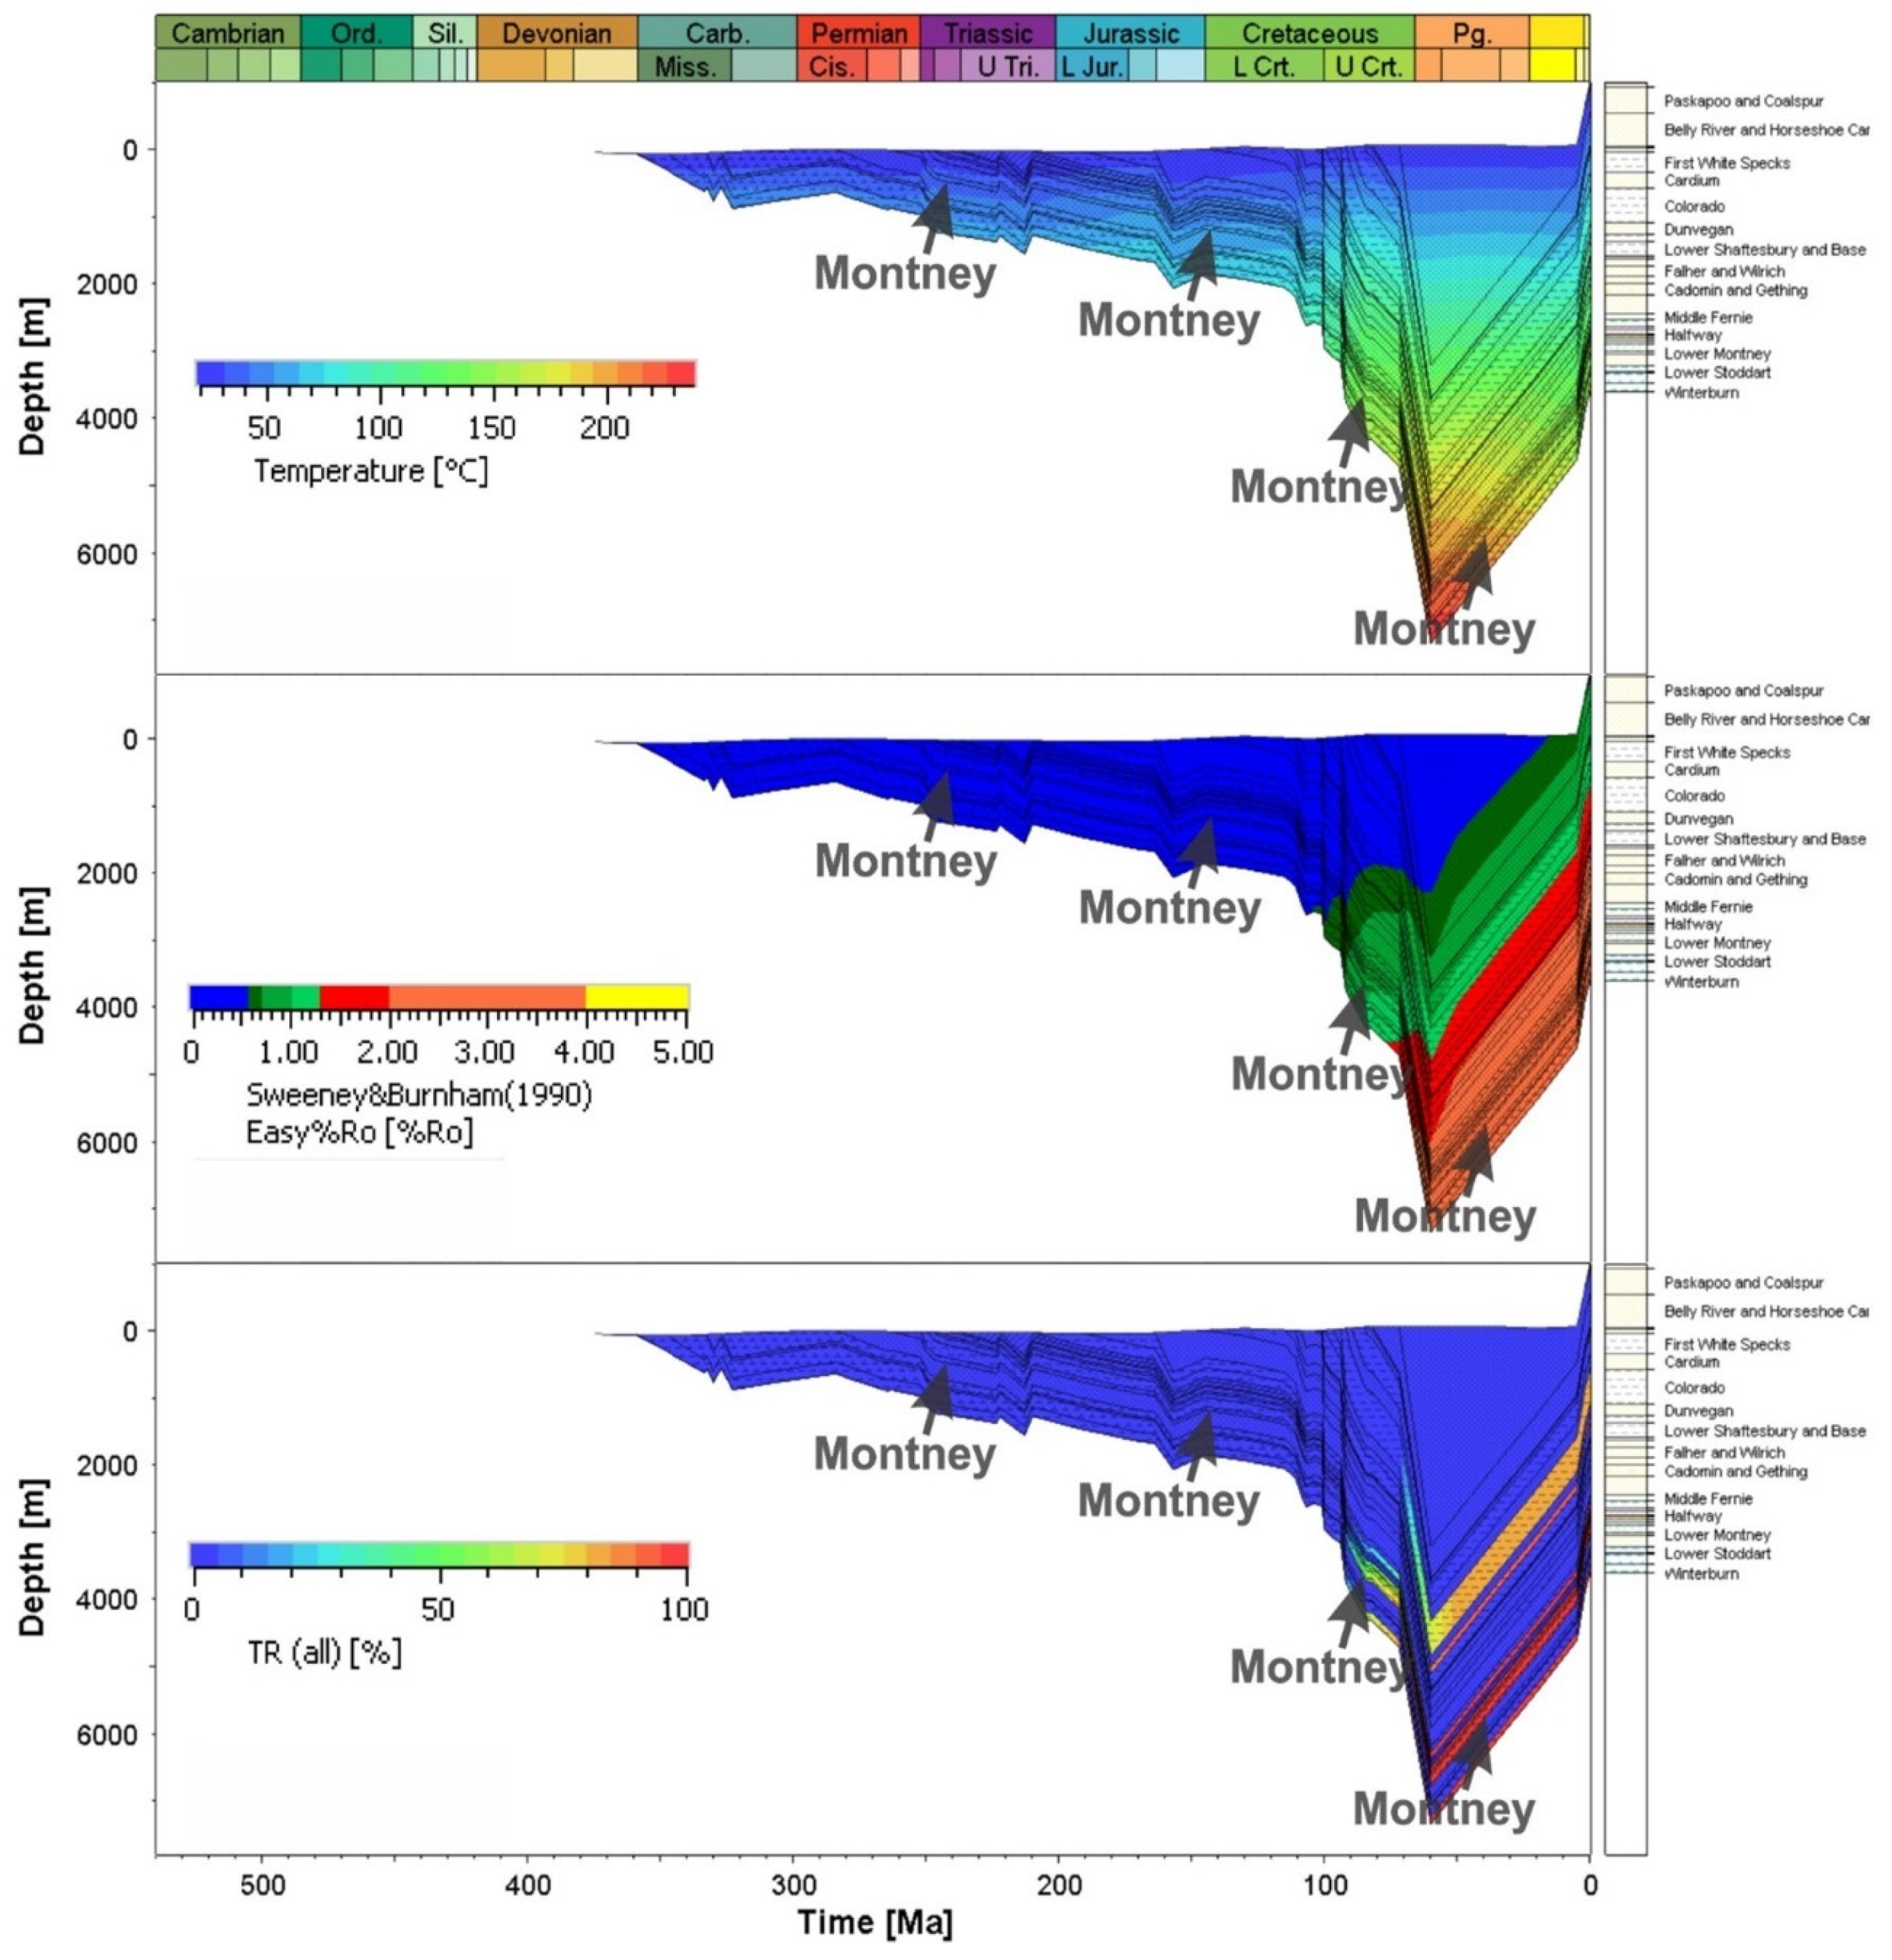
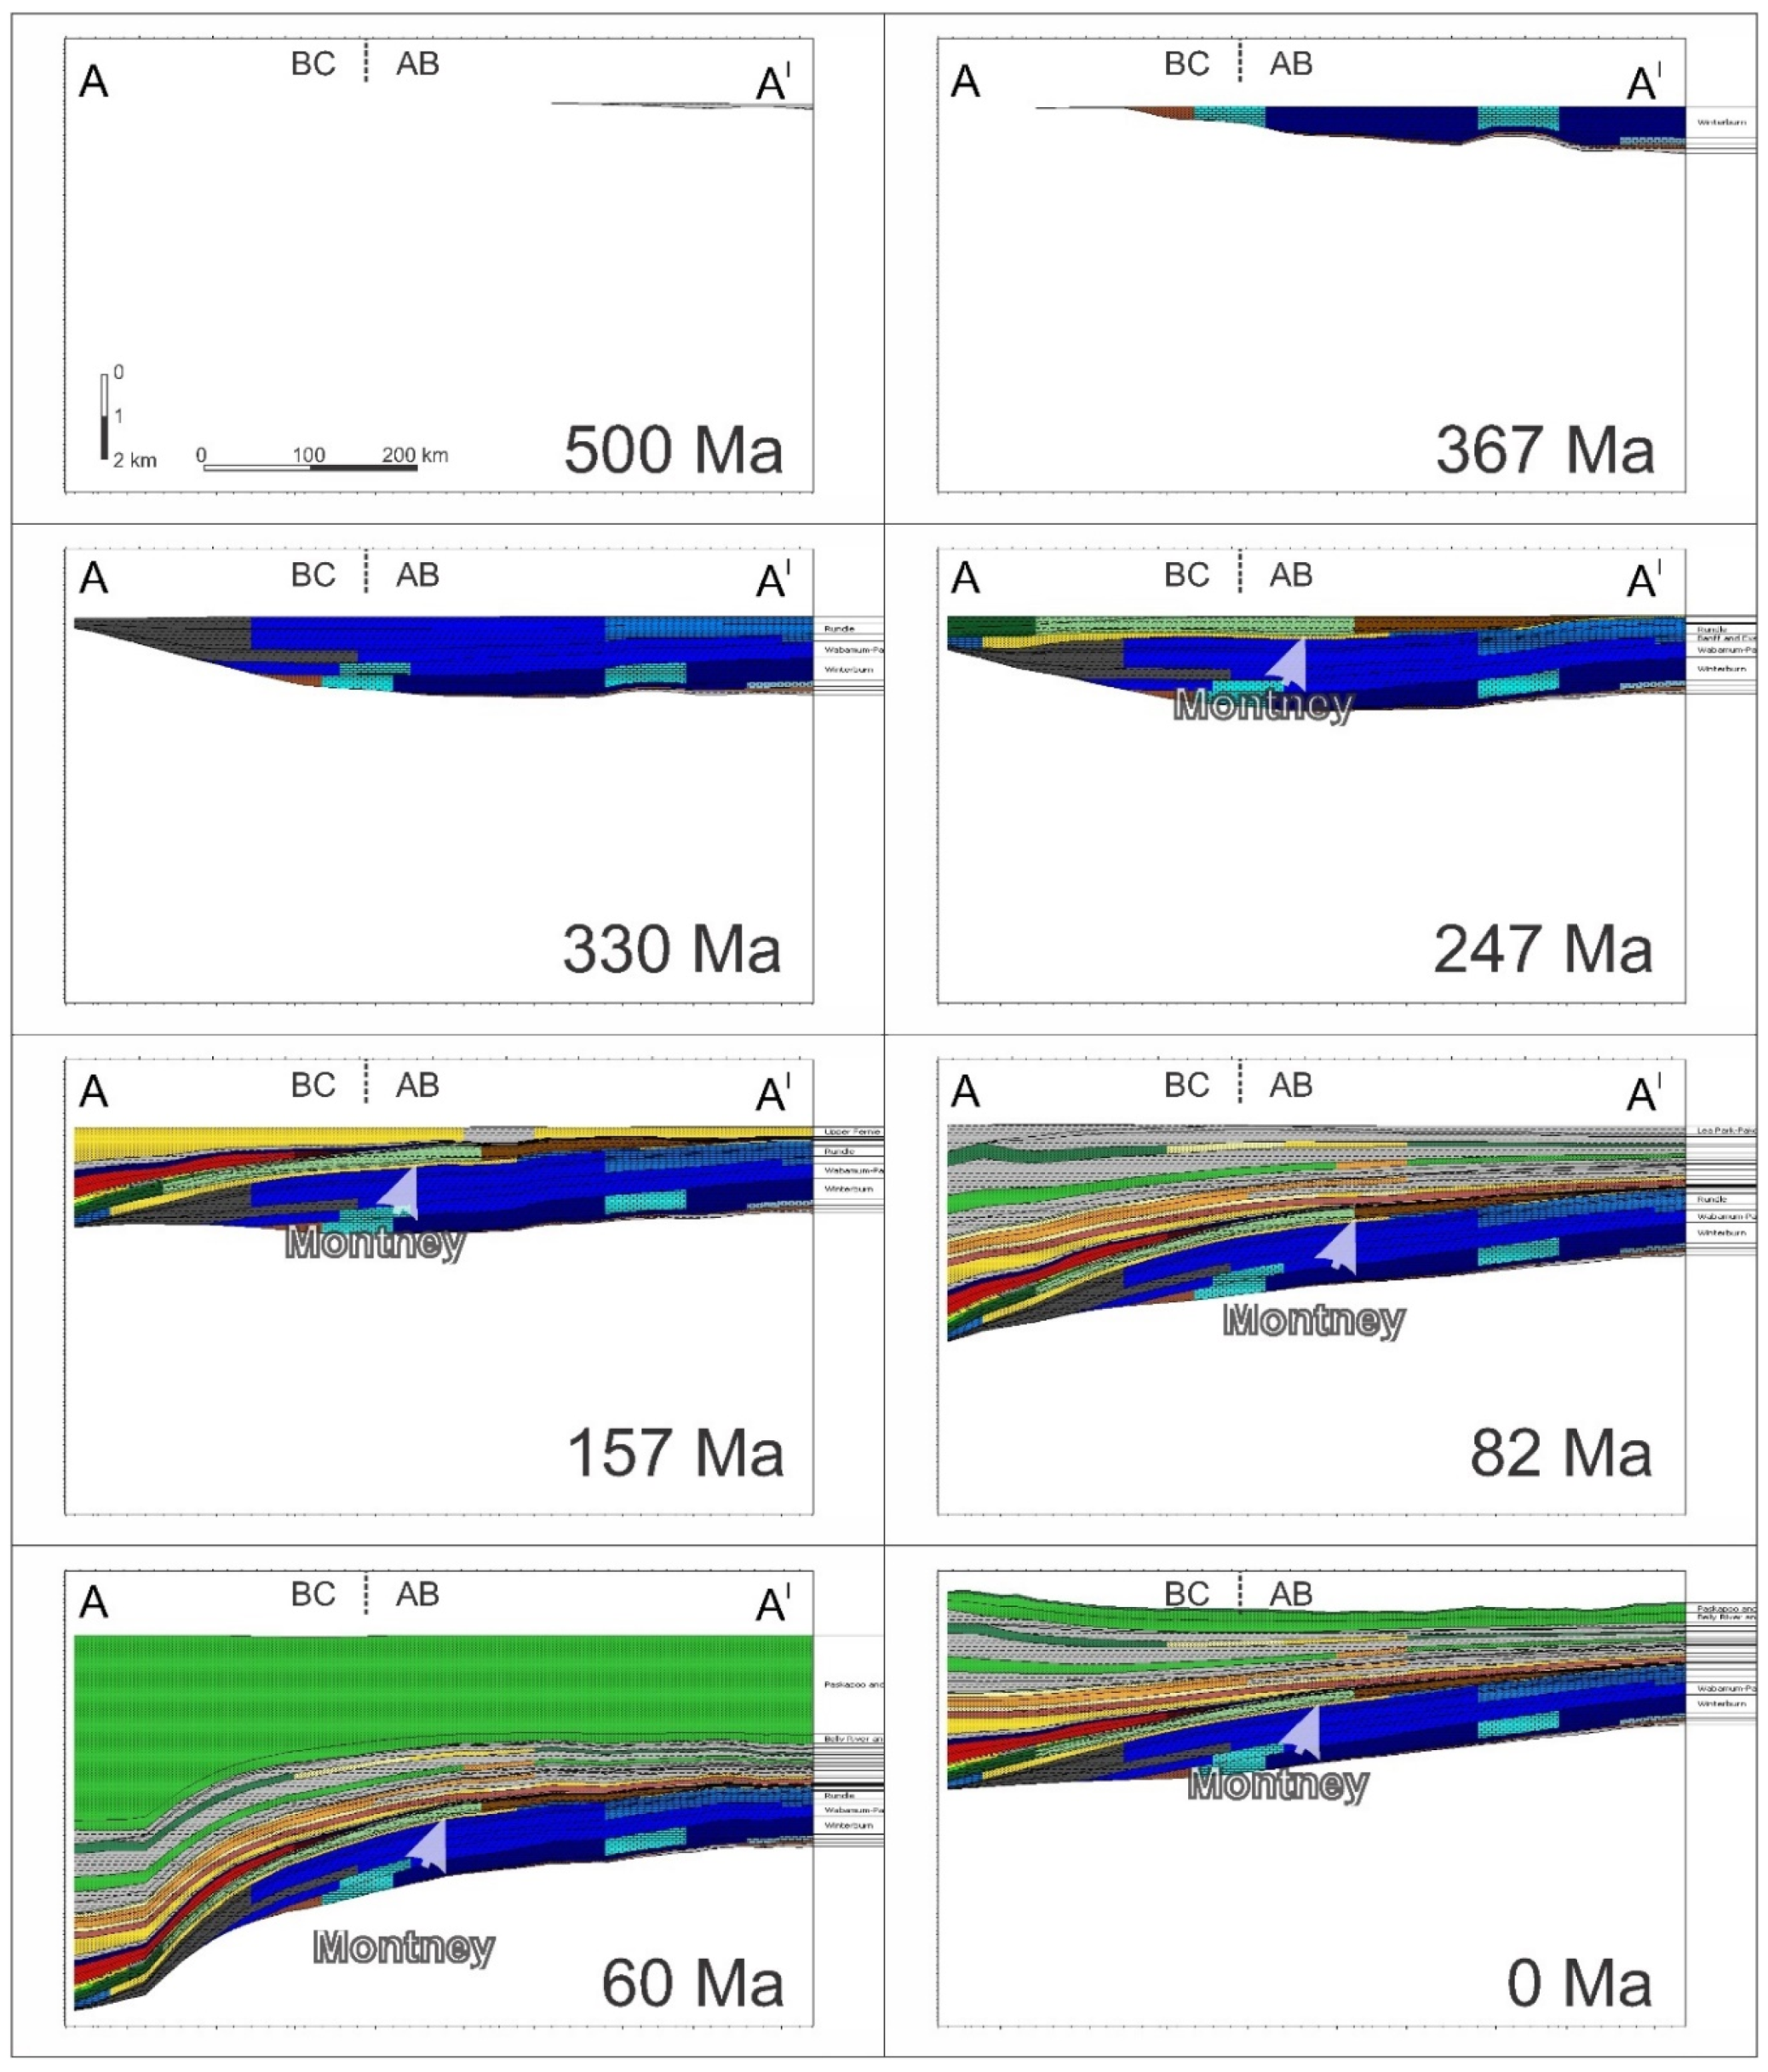
4.4. Burial and Thermal History

A one-dimensional burial history was divided into seven chronological phases with similar net subsidence rates (Figure 13). The location of the one-dimensional burial history is shown in Figure 2 (white dot). The first phase, ranging from the Cambrian to the Middle Devonian, is characterized by very low subsidence rates in the order of 3 m/Ma. During this time, sedimentation was limited to the northern part of the basin with little to no net deposition in the south.
In the second phase, from the Upper Devonian through to the Mississippian, the subsidence rate associated with the development of a carbonate platform increased to a maximum of 30 m/Ma. The highest subsidence rates in this interval are in the north of the study area, with thinning of strata towards the south.
In the third phase, after an uplift during the Pennsylvanian, sedimentation resumed from the Permian through most of the Early Cretaceous at a steady but relatively low rates of between 3 and 6 m/Ma. A few erosional unconformities with generally less than 200 m of missing section and hiatuses occur throughout this period across the entire region, but with very little impact to depth of burial. During this time, significant localized variations in relative subsidence rates occurred. With the collapse of the Peace River Arch and the Dawson Creek Graben Complex faults reactivation in the Triassic [6,20,54,55,56], the Peace River Embayment became the depocentre, with the net subsidence rates in the western central part of the basin being twice as high as towards the northern, southern, and eastern edges. In the Peace River Embayment depocenter, subsidence rates during the Triassic are as high as 15 m/Ma.
The fourth phase occurred during the Albian stage of Early Cretaceous, during the deposition of the Mannville and Fort St. John Groups, when the entire region subsided at higher rates of 50 to 90 m/Ma. During this stage of the foreland, subsidence rates were relatively uniform across the region.
In the fifth phase, during the earlier stages of Late Cretaceous, the locus of sedimentation switched to the south, which continued subsiding at similar rates, while the north part of the basin was starved of sediments.
In the sixth phase, between the Late Cretaceous and the Paleogene, the entire region underwent a marked further increase in burial rates associated with the foreland subsidence. Net subsidence rates in this phase vary from 140 m/Ma in the northern and eastern edges of the study area to 390 m/Ma in the southwest.
In the last phase, the basin underwent exhumation at rates of 50 to 80 m/Ma, starting in the Paleogene with the post-Laramide uplift to a Quaternary isostatic rebound from the removal of the ice sheets that covered much of the North America until the end of the Pleistocene.
The maximum paleo-burial depth of the Montney Formation throughout the basin history is located south of Dawson Creek, near the eastern limit of the thrust and fold belt in BC. In this region, the base of the Montney Formation reached a depth of 8600 m (Figure 14) prior to 60 Ma, when the post-Laramide event began uplifting these strata to its present-day depth of 3500 m. The maximum temperature of the Montney Formation during this time ranged from 100 to 235 °C, according to depth of overburden and regional variations in heat flow. The depocenter of the basin migrated southeast during the Late Cretaceous and Paleogene, towards its present location in central-western Alberta (Figure 15, Figure 16 and Figure 17).

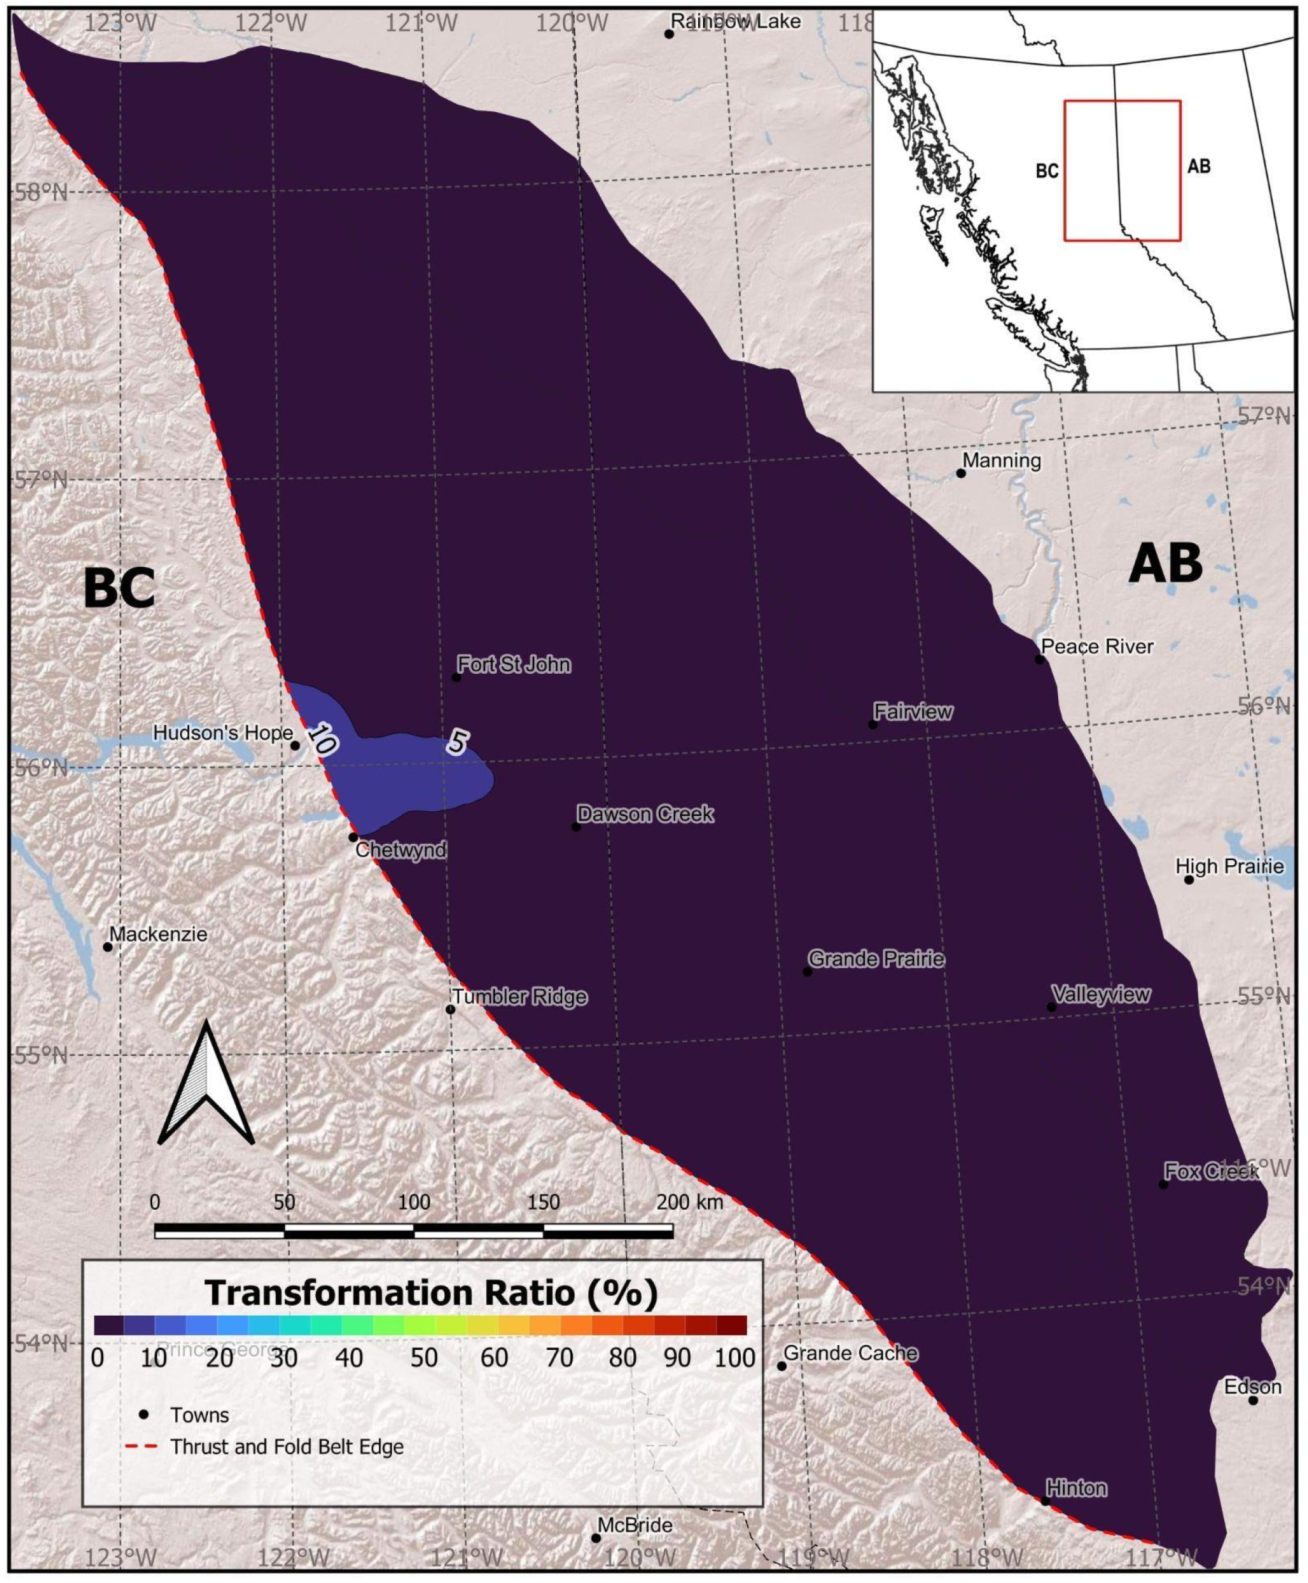
4.5. Petroleum Generation

The onset of hydrocarbon generation in the studied area of the Western Canadian Sedimentary basin (WCSB) occurred in the Pennsylvanian when the Paleozoic Duvernay and Exshaw source rocks entered the oil window (Figure 18). The Triassic Montney Formation started generating hydrocarbons at 101 Ma (Figure 19) and reached peak oil generation along most of the western boundary adjacent to the fold and thrust belt, at 85 Ma (Figure 20). From the end of the Cretaceous to the Paleocene, between 72 and 60 Ma, due to the rapid foreland subsidence in the southwest, wet gas (LHCs) generation in the Montney Formation started throughout most of the southwest, and dry gas (SHCs) started in the deepest areas (Figure 21 and Figure 22). During the Eocene, at approximately 50 Ma, a portion of the Montney Formation in the southwest reached the late dry gas window, with a complete kerogen transformation ratio before thermal maturation stopped by the rapid uplift and exhumation of Paleogene sediments (Figure 23).

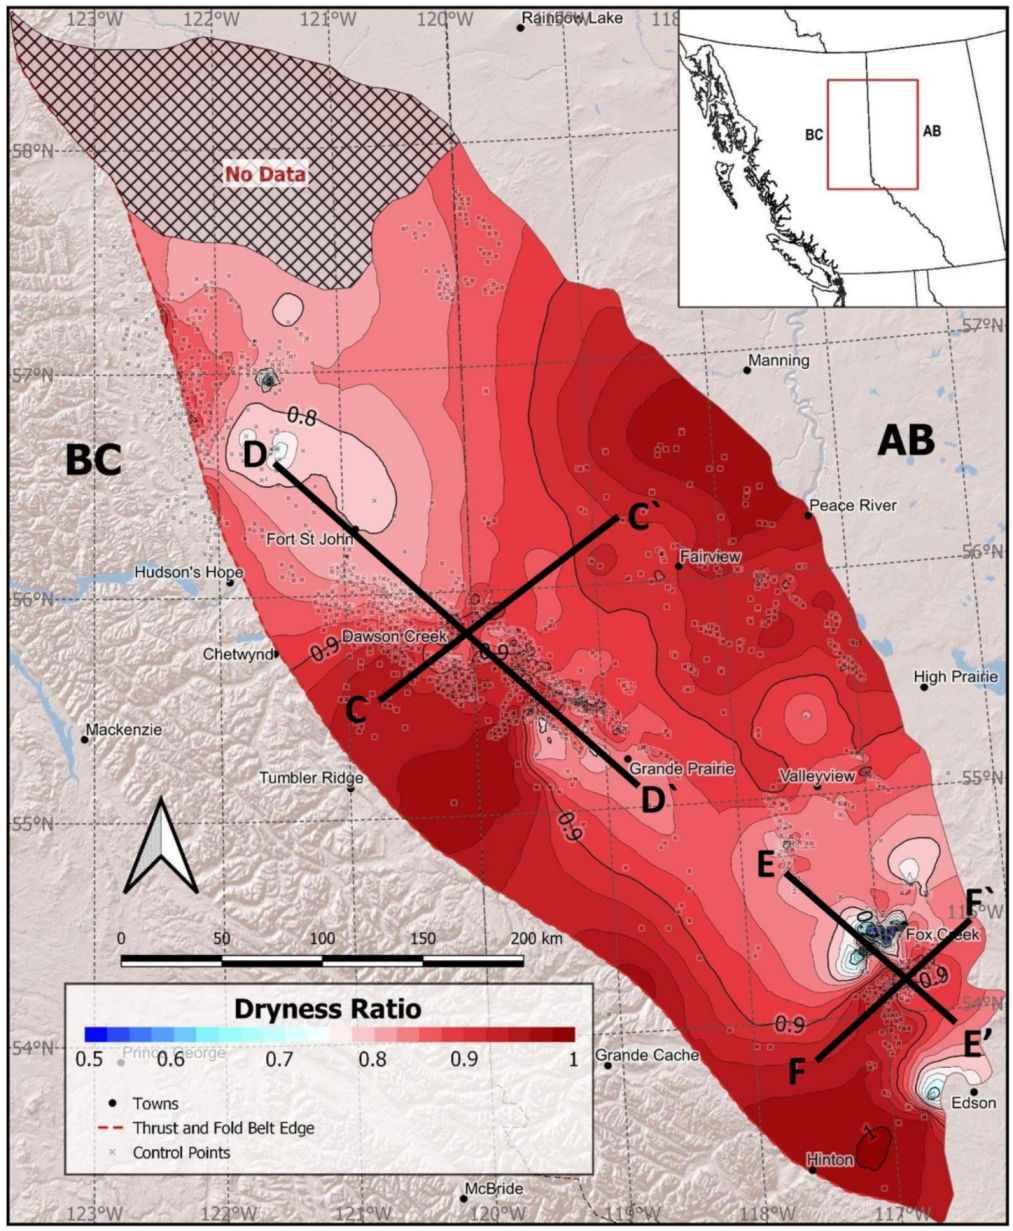
4.6. Hydrocarbon Composition Distribution

The gas dryness ratio (C1/∑C1–C5) is the methane content divided by the sum of the total hydrocarbon content of each gas sample taken in the Montney Formation. The gas dryness ratio, for the entire Montney Formation, decreased from almost completely dry gas (i.e., 0.99 to 1.0; SHCs) in the overmature central–western and southwestern areas of BC to a gas dryness index of 0.6 and 0.8 across the central part of the basin (higher LHC content), increasing again towards the east to above 0.9 (higher SHC content; Figure 24). The gas wetness increases in areas within the hydrocarbon generation window of oil (Tmax between 445 and 460 °C; Figure 7). However, there are some discrepancies in the relationship between gas dryness and maturation across the Montney Formation, and this is further explored below. The zone of dry gas in the deepest part of the basin reflects the overmaturity in this region (Tmax higher than 490 °C; transformation ratio at 100%; Figure 7 and Figure 22). Secondary cracking of wetter gases and LHCs occur in this region and would produce large volumes of methane. The same gas dryness pattern was observed when mapping the Upper, Middle, and Lower Montney Formation subzones individually (Figure 25, Figure 26 and Figure 27). The zone of relatively higher gas wetness ratio located between the Triassic subcrop edge and the deformation front flanked on both sides by dry gas regions was noted for Triassic reservoirs in the WCSB by [57]. The author suggested this distribution pattern may be caused by mixing of updip migration of thermally generated SHC gases at greater depths with shallower biogenic gas. Alternatively, gases generated by oil-prone sapropelic and gas-prone humic kerogens may also be mixed to create this complex distribution.
The iC4/nC4 isomer ratio for butane (Figure 28) and the iC5/nC5 isomer ratio of pentane (Figure 29) were mapped for the Montney Formation in both BC and Alberta. These geochemical signatures are used as a proxy for maturation processes and the ratio should increase with increasing maturity of the reservoir fluids [2,4]. In most cases, the ratio iC4/nC4 ratio increases towards the deformation front (Figure 28), as indicated by the symbols becoming larger and lighter blue and green colours. Some data points have ratios greater than 5, which may be due to erroneous readings or other geological processes, and further investigation into these anomalies is needed. The ratio between the isomers iC5/nC5 of pentane shows similar trend as iC4/nC4 ratio (Figure 28) with an increasing ratio with towards the deformation front. These two isomer ratios (iC4/nC4 and iC5/nC5) of produced hydrocarbons reflect the overall trend of increasing maturation towards the deformation front and show that the in situ generation of hydrocarbon in a self-sourced reservoir is the dominant process of hydrocarbon generation in the Montney Formation. However, there are areas that show migration of drier hydrocarbon (i.e., SHCs) from more mature areas to wetter hydrocarbon (LHCs) areas, and this is discussed below.
To examine if there are any significant differences in the hydrocarbon composition stratigraphically, and to allow for the comparison of wells within more focused areas, the large regional study was subdivided into five regional areas for both British Columbia (BC) and Alberta (AB). The five areas are referred to as the Northern B.C., Southern B.C., Northern AB, Central AB, and Southern AB (Figure 1). The change in the lithological characteristics of the Montney Formation over these regions is illustrated in cross sections C–C′, D–D′, E–E′, and F–F′ (Figure 30, Figure 31, Figure 32 and Figure 33). The distribution of the gas dryness is shown in the box and whisker plots for the Upper, Middle, and Lower Montney Formation for each region (Figure 34 and Figure 35). The number of samples for each box and whisker are shown in each figure caption. Opposing trends exist in the gas dryness between the Upper, Middle, and Lower Montney producers when comparing the northern and southern regions of the BC Montney play area. In the northern BC region, the gas dryness median and averages are similar between the Upper and Middle Montney producers; however, the Upper Montney has a narrower gas dryness range and tends to be wetter than the Middle and Lower Montney Producers. The Lower Montney producers have a drier gas composition shown by the gas dryness range and the higher median and average than the Upper and Middle Montney producers (Figure 34A). The Middle Montney producers have the broad range of values that span the ranges for both the Lower and Upper Montney producers. In the southern BC region, the upper limits to the gas dryness are similar for the Lower, Middle, and Upper Montney producers (Figure 34B), and all stratigraphic zones can contain very dry gas compositions (i.e., 90–95% methane). There is an increase in gas wetness from the Upper to Middle to the Lower Montney producer (Figure 34B). The range of gas wetness values is the highest for the Lower Montney producers (n = 7), the range in gas wetness narrows for the Middle Montney, and the range is smallest for the Upper Montney wells. The median and average is the wettest in the Lower Montney and driest in the Upper Montney wells, with the Middle Montney having intermediate results.
The Alberta Montney producers were subdivided into northern, central, and southern regions (Figure 2 and Figure 35). Overall, the Montney producers in Alberta have narrower ranges of gas wetness and are drier gas compositions than the BC wells (Figure 34). The average dryness for gas composition of Montney producers in northern AB does increase from the Upper to Middle to the Lower Montney producers (Figure 35A; note, the Lower Montney is only represented by one well). In the central AB Montney producers, the composition appears similar between the Upper, Middle, and Lower Montney producers, with the Upper Montney producers having a slightly drier composition on average. The Montney producers in the southern AB region have a similar composition between the Upper and middle sections of the Montney Formation, with the Lower Montney having a wetter composition.
There appears to be no relationship between gas composition and the Upper, Middle, and Lower sections of the Montney Formation when compared the northern, central, or southern regions of both BC and AB. This illustrates that the generation and migration of hydrocarbons in the Montney Formation is more complex and may be due to local migration pathways due to lithological changes or structures and not entirely controlled by regional scaled changes in stratigraphy or maturation. The following section illustrates that the migration of drier gases from deeper parts of the Montney Formation do occur in discrete areas.
Excess methane is plotted for the Montney producers in BC (Figure 36) and AB (Figure 37). The red line of best fit reflects the regional trend between the iC4/nC4 isomer ratio and gas dryness [4], representing in situ generation of hydrocarbons at a given maturation level. Black circles represent samples that have little excess methane and indicate that there is little to no contribution of migrated hydrocarbons, and these are plotted close to the line of best fit. As excess methane percentages increase from what is expected for the regional maturation trend, the plotted values’ colours change from green to blue to yellow to orange and red. The red plotted data represent excess methane percentages greater than 12% what is expected at this maturity level. The distribution of excess methane across BC and Alberta is shown in Figure 38 and Figure 39, respectively. These maps show that the hydrocarbon composition of the Montney Formation is complex due to two processes occurring within the system. One process is in situ generation and storage of hydrocarbons within an unconventional self-sourced reservoir, as illustrated by the low excess methane percentages in the northeast of British Columbia (Figure 38). The other process is the migration of shorter-chain hydrocarbons such as methane from more mature zones in the west and moving updip towards the eastern portion of the Montney play areas (assuming minimal local migration processes). This is illustrated by the higher excess methane percentages in the Alberta play areas in Figure 38, Figure 39 and Figure 40. Migration updip is also controlled by lineaments and lithologic changes in the Montney Formation. Changes into higher permeability lithologies are highlighted by [2] and are shown by the black dashed lines in Figure 39. It is important to note that these trends appear well defined due to the bias of operators selecting areas to drill on the basis of higher permeabilities (fractured, faults, lithological changes). Additional infill drilling along the flanks of these fairways would confirm the reason(s) drier hydrocarbon composition has migrated in this region. Changes highlighted by the excess methane percentage across the regional play area can also be due to lineaments such as the Fort St. John Graben structures (i.e., [4]). Not only do the lineaments pose a pathway for fluid migration, they also impacted the maturation trends across the area. The lower maturation trends across the graben area have impacted the hydrocarbon generation and in situ composition of the Montney self-sourcing reservoir system. This is illustrated by the changes in maturation trends (Figure 7) in the area of the Fort St. John Graben.
The trends in gas dryness and excess methane percentage distributions also highlight changes from regional trends in the Fox Creek area in southern Alberta (Figure 24, Figure 38, and Figure 40). This area is complex with a very wet Upper Montney subunit in an area west of Fox Creek (Figure 27) and also dry gas migration from deeper areas migrating east into the area south of Fox Creek (Figure 24 and Figure 40). The pink line highlights the drier gas composition contour of 0.9 (i.e., 90% methane composition in producing fluids). The wetter gas compositions north of Fox Creek does reflect the lower Tmax values shown in Figure 7 as the maturation pattern changes in this area with more of a north–south trend in maturation and not the WCSB-scale, regional trend of SW-NE. The thickness of the Montney Formation is most likely to be affected by the Fox Creek escarpment, and the thickness is greater in the northern sections (Figure 32), which correlates with the higher TOC and HI content (Figure 9 and Figure 11, respectively) and the lower gas dryness composition. The kerogen type may be responsible for the change in gas composition in this area, with more type I and II kerogen generating longer chained hydrocarbons. When comparing the excess methane percentage for the Fox Creek region (Figure 40), the blue arrow indicates a migration of drier gas into the Fox Creek area, as illustrated by the high concentration of large red bubble plots compared to the area north of the town of Fox Creek that contains smaller bubble plots in a variety of shades of green, blue, yellow, and orange. Even though the area south of Fox Creek is more mature than the area to the north of Fox Creek, the excess methane percentage indicates that the hydrocarbon composition in much drier than what is expected at the maturation level and therefore indicates that SHCs have migrated, probably from more mature areas in the south near the town of Hinton (Figure 7, Figure 24, Figure 25, Figure 26 and Figure 27).

4.7. Summary

The Montney Formation shows an increase in thickness and organic maturation (Tmax) towards the deformation front in the west of the WCSB (Figure 2 and Figure 7, respectively). The Tmax values indicate, along with the basin model, that the Montney Formation has experienced maximum burial towards the deformation front (i.e., Figure 14). The gas dryness percentage also generally increases towards the deformation front (Figure 24, Figure 25, Figure 26 and Figure 27), corresponding to increasing thermal maturity on a broad scale. There are some localised variations, such as Fort St. John Graben, that affect the general maturation trend (increasing maturity towards the west, Figure 7) and consequently the hydrocarbon composition (higher concentration of LHCs, Figure 14). These structural controls are observed in the structure maps (Figure 2). Structures such as Fort St. John Graben, the Hay River fault zone, and the Laurier Embayment had a profound effect on the depositional and maturation patterns of the Triassic strata ([4,32]; Figure 1, Figure 2, and Figure 7 in this study).
The total organic carbon content of the Montney Formation increases towards the deformation front (Figure 9), as this area was further offshore, wherein both the generation and preservation of organic matter tend to be higher. The nearshore environments also received greater volumes of clastic material that could dilute the TOC contents, which has been identified in the Cretaceous sediments of the WCSB (i.e., [58]). The hydrogen index (HI, Figure 11) for the Montney Formation correlates with the maturation trends with decreasing HI content in the remaining kerogen towards the deformation front; this trend also correlates with the transformation ratios from the basin models, indicating a greater portion of the kerogen is transformed into hydrocarbon in the deeper parts of the basin that experienced greater temperatures over longer time periods than the eastern portion of the basin.
The hydrocarbon composition of the Montney Formation is complex due to two processes occurring within the system. One process is in situ generation and storage of hydrocarbons within an unconventional self-sourcing reservoir, as illustrated by the low excess methane percentages in the northeast of BC (Figure 38). The other process is the migration of SHCs such as methane from more mature zones in the west and moving updip towards the eastern portion of the Montney play areas (assuming minimal local migration processes). This is illustrated by the higher excess methane percentages in the Alberta play areas in Figure 38 and Figure 40. Migration updip is also controlled by lineaments and lithologic changes in the Montney Formation. Changes into higher permeability lithologies are highlighted by [2] and are shown by the black dashed lines in Figure 39. Changes highlighted by the excess methane percentage across the regional play area can also be due to lineaments like the Fort St. John Graben structures [4]. The lower maturation trends across the graben area have also impacted the hydrocarbon generation and in situ composition of the Montney self-sourcing reservoir system.

5. Conclusions and Recommendations

In this study, we developed workflows that illustrate the complexity of the Montney petroleum system and the likely causes of the changes in the distribution of hydrocarbon composition. The hydrocarbon composition is complex due to first-, second-, and third-order variation across the basins. First-order variation is due to the basin-scaled maturation trends across the WCSB, and the second- and third-order variations are due to regional structural changes, structural elements, and coarser lithologies acting as conduits, changes in TOC content and types, heat flow fluctuations, and variations in depth and duration of burial. Basin modelling, coupled with mapping of organic maturation, reservoir thickness mapping, organic matter typing, hydrocarbon compositional mapping, hydrocarbon isomer ratio mapping, and excess methane mapping provide a workflow template for operators to determine second- and third-order variations seen within their play areas, and this will aid the development of a customised geological model to predict hydrocarbon compositional changes for their development strategy. Due to propriety reasons, we were unable to use seismic data in this project, and seismic data purveyors should consider release of seismic data to the science community if these complex systems are to be better understood.
Excess methane percentage calculations can provide granularity to changes in hydrocarbon compositions from play areas that contain self-sourced hydrocarbons with little to no migration to play areas that contain a mixture of self-sourced and migrated hydrocarbons. This technique provides a useful tool for understanding the hydrocarbon system, planning drilling campaigns, adjusting hydrocarbon production during market changes, and optimizing operations for increasing production efficiency.

Author Contributions

Conceptualization, R.M.B. and G.R.L.C.; methodology, G.R.L.C., P.L.S.; validation, A.A.B.; formal analysis, A.S.; investigation, G.R.L.C.; resources R.M.B.; data curation, G.R.L.C., P.L.S.; writing—original draft preparation, G.R.L.C., R.M.B., P.L.S.; writing—review and editing, A.A.B.; visualization, P.L.S.; supervision, R.M.B.; project administration, R.M.B. and G.R.L.C.; funding acquisition, R.M.B. All authors have read and agreed to the published version of the manuscript.

Funding

Funding was provided by Geoscience BC and Natural Sciences and Engineering Research Council of Canada (NSERC).

Institutional Review Board Statement

Not applicable.

Informed Consent Statement

Not applicable.

Conflicts of Interest

The authors declare no conflict of interest.

References

  1. NEB (National Energy Board). Canada’s Energy Future 2018 Supplement: Natural Gas Production; National Energy Board: Calgary, AB, Canada, 2018; p. 12. [Google Scholar]
  2. Wood, J.; Sanei, H. Secondary migration and leakage of methane from a major tight-gas system. Nat. Commun. 2016, 7, 13614. [Google Scholar] [CrossRef] [PubMed] [Green Version]
  3. Egbobawaye, E. Petroleum Source-Rock Evaluation and Hydrocarbon Potential in Montney Formation Unconventional Reservoir, Northeastern British Columbia, Canada. Nat. Resour. 2017, 8, 716–756. [Google Scholar] [CrossRef] [Green Version]
  4. Euzen, T.; Watson, N.; Fowler, M.; Mort, A.; Moslow, T. Petroleum distribution in the Montney hybrid play: Source, carrier bed; structural controls. AAPG Bull. 2021, 105, 1867–1892. [Google Scholar] [CrossRef]
  5. Bustin, R.M. Organic maturity in the western Canada sedimentary basin. Int. J. Coal Geol. 1991, 19, 319–358. [Google Scholar] [CrossRef]
  6. Eaton, D.W.; Ross, G.M.; Hope, J. The rise and fall of a cratonic arch: A regional seismic perspective on the Peace River Arch, Alberta. Bull. Can. Pet. Geol. 1999, 47, 346–361. [Google Scholar] [CrossRef]
  7. Euzen, T.; Moslow, T.; Crombez, V.; Rohais, S. Regional Stratigraphic Architecture of the Spathian Deposits in Western Canada—Implications for the Montney Resource Play. Bull. Can. Pet. Geol. Can. Soc. Pet. Geol. 2018, 66, 175–192. [Google Scholar]
  8. Compton, A.; Bincaz, I.; Bermel, C. Comparative H2S Economics for Shale Gas. 2017. Available online: www.merichem.com/index.php?option=com_content&view=article&id=312:comparative-h2s-economics-shale-gas&catid=29:technical-papers&Itemid=101 (accessed on 2 November 2017).
  9. Adams, M. A Progress Energy Montney case study in risk identification grouping and mitigation. In Geoconvention, 2016, Optimizing Resources; Geoconvention: Calgary, AB, Canada, 2016. [Google Scholar]
  10. Chalmers, G.R.L.; Bustin, R.M. Geological evaluation of Halfway-Doig-Montney hybrid gas shale-tight gas reservoir, northeastern British Columbia. Mar. Pet. Geol. 2012, 38, 53–72. [Google Scholar] [CrossRef]
  11. Zonneveld, J.; Golding, M.; Moslow, T.; Orchard, M.; Playter, T.; Wilson, N. Depositional Framework of the Lower Triassic Montey Formation, West-Central Alberta and Northeastern British Columbia; APPG Search and Discovery Article #90173 CSPG/CSEG/CWLS GeoConvention 2011; Canadian Society of Petroleum Geologists: Calgary, AB, Canada, 2011. [Google Scholar]
  12. Podruski, J.A.; Barclay, J.E.; Hamblin, A.P.; Lee, P.J.; Osadetz, K.G.; Procter, R.M.; Taylor, G.C. Conventional Oil Resources of Western Canada; Geological Survey of Canada Paper: Ottawa, ON, Canada, 1988; p. 149. [Google Scholar]
  13. Kirste, D.; Desrocher, S.; Spence, B.; Hoyne, B.; Tsang, B.; Hutcheon, I. Fluid flow, water chemistry, gas chemistry and diagenesis in the subsurface Triassic in Alberta and British Columbia. Bull. Can. Pet. Geol. 1997, 45, 742–764. [Google Scholar]
  14. Kuppe, F.; Haysom, S.; Nevoshonoff, G. Liquids rich unconventional Montney: The Geology and the Forecast. In Proceedings of the SPE Canadian Unconventional Resources Conference, Calgary, AB, Canada, 30 October–1 November 2012. Paper Number: SPE-162824-MS. [Google Scholar] [CrossRef]
  15. Riddell, T.; Layman, A.; Carpenter, C. Kaybob Montney Oil Pool Secondary Recovery Evaluation; Final Report to Trilogy Energy Company; University of Wyoming: Laramie, WY, USA, 2016. [Google Scholar]
  16. Bustin, R.M.; Bustin, A.M.M. Potential for natural-gas liquid from western Canadian shales: Regional variation in thermal maturity and gas composition, northeastern British Columbia. Geosci. BC Summ. Act. 2016, 2016, 49–54. [Google Scholar]
  17. Zumberge, J.; Ferworn, K.; Brown, S. Isotopic reversal (‘rollover’) in shale gases produced from the Mississippian Barnett and Fayetteville formations. Mar. Pet. Geol. 2011, 31, 43–52. [Google Scholar] [CrossRef]
  18. Cesar, J.; Mayer, B.; Deblonde, C.; Mort, A.; Ardakani, O. Alternative indicators to assess the distribution characteristics of methane, ethane; propane derived from petroleum in the Montney Formation, Western Canada. Fuel 2021, 294, 120524. [Google Scholar] [CrossRef]
  19. Mango, F.; Jarvie, D.; Herriman, E. Natural gas at thermodynamic equilibrium implications for the origin of natural gas. Geochem. Trans. 2009, 10, 6. [Google Scholar] [CrossRef] [PubMed]
  20. Davies, G. The Triassic of the Western Canada Sedimentary Basin: Tectonic and stratigraphic framework, paleogeography, paleoclimate and biota. Bull. Can. Pet. Geol. 1997, 45, 434–460. [Google Scholar] [CrossRef]
  21. Dixon, J. Triassic stratigraphy in the subsurface of the plains area of Dawson Creek (94A) and Charlie Lake (94A) map areas, northeast British Columbia. Bull. Geol. Surv. Can. 2009, 595, 78. [Google Scholar] [CrossRef]
  22. Edwards, D.E.; Barclay, J.E.; Gibson, D.W.; Kvill, G.E.; Halton, E. Triassic strata of the Western Canada Sedimentary Basin. In Geological Atlas of the Western Canada Sedimentary Basin; Mossop, G.D., Shetsen, I., Eds.; Canadian Society of Petroleum Geologists and the Alberta Research Council: Calgary, AB, Canada, 1994; pp. 259–275. [Google Scholar]
  23. Furlong, C.M.; Gingras, M.K.; Moslow, T.F.; Zonneveld, J.-P. The Sunset Prairie Formation: Designation of a new Middle Triassic formation between the Lower Triassic Montney Formation and Middle Triassic Doig Formation in the Western Canada Sedimentary Basin, northeast British Columbia. Bull. Can. Pet. Geol. 2018, 66, 193–214. [Google Scholar]
  24. Walsh, W.; Adams, C.; Kerr, B.; Korol, J. Egional “Shale Gas” Potential of the Triassic Doig and Montney Formations, Northeastern British Columbia: Petroleum Geology Open File 2006-02; British Columbia Ministry of Energy Mines and Petroleum Resources: Victoria, BC, Canada, 2006; p. 19. [Google Scholar]
  25. Golding, M.L.; Orchard, M.J.; Zonneveld, J.-P.; Wilson, N.S.F. Determining the age and depositional model of the Doig phosphate zone in northeastern British Columbia using conodont biostratigraphy. Bull. Can. Pet. Geol. 2015, 63, 143–170. [Google Scholar] [CrossRef]
  26. Rohais, S.; Crombez, V.; Euzen, T.; Baudin, F. The Lower and Middle Triassic of Western Canada: Passive margin, back-arc or fore-arc geodynamic setting. In Geoconvention 2016: Optimizing Resources; Geoconvention: Calgary, AB, Canada, 2016. [Google Scholar]
  27. Wüst, R.A.J.; Tu, S.; Nassichuk, B.; Bozarth, T.; Tucker, J.; Cui, A. Chemostratigraphy, petrography; SEM investigations of the Lower Triassic Montney Formation in Alberta: Implications for a new and revised diagenetic and depositional model. Bull. Can. Pet. Geol. 2018, 66, 436–471. [Google Scholar]
  28. Gibson, D.W.; Barclay, J.E. Middle Absaroka Sequence—The Triassic stable craton. In Western Canada Sedimentary Basin—A Case History; Ricketts, B.D., Ed.; Canadian Society of Petroleum Geologists: Calgary, AB, Canada, 1989; pp. 219–232. [Google Scholar]
  29. Kent, D.M. Paleogeographic evolution of the cratonic platform—Cambrian to Triassic. In Geological Atlas of the Western Canada Sedimentary Basin; Mossop, G.D., Shetsen, I., Eds.; CSPG and Alberta Research Council: Calgary, AB, Canada, 1994; pp. 69–86. [Google Scholar]
  30. Dixon, J. Regional lithostratigraphic units in the Triassic Montney Formation of western Canada. Bull. Can. Pet. Geol. 2000, 48, 80–83. [Google Scholar] [CrossRef]
  31. Davies, G.R.; Watson, N.; Moslow, T.F.; MacEachern, J.A. Regional subdivisions, sequences, correlations and facies relationships of the lower triassic Montney Formation, west-central Alberta to northeastern British Columbia, Canada—With emphasis on role of paleostructure. Bull. Can. Pet. Geol. 2018, 66, 23–92. [Google Scholar]
  32. Berger, Z.; Boast, M.; Mushayandebvu, M. The contribution of integrated HRAM studies to exploration and exploitation of unconventional plays in North America. Part 1: The Peace River Arch. Reservoir 2008, 35, 42–47. [Google Scholar]
  33. Berger, Z.; Boast, M.; Mushayandebvu, M. The contribution of integrated HRAM studies to exploration and exploitation of unconventional plays in North America. Part 2: Basement structures control on the development of the Peace River Arch’s Montney/Doig resource plays. Reservoir 2009, 36, 40–45. [Google Scholar]
  34. GPA Standard 2261-00; Analysis for Natural Gas and Similar Gaseous Mixtures by Gas Chromatography. Gas Processors Association: Tulsa, OK, USA, 2000; pp. 1–20.
  35. Espitalie, J.; Laporte, L.J.; Madec, M.; Marquis, F.; Leplat, P.; Paulet, J.; Boutefeu, A. Methode rapide decaracterisation des roches mères, de leur potential petrolier et de leur degré d’evolution. Rev. Inst. Français Pétrole 1977, 32, 32–42. [Google Scholar]
  36. Rokosh, C.D.; Lyster, S.; Anderson, S.D.A.; Beaton, A.P.; Berhane, H.; Brazzoni, T.; Chen, D.; Cheng, Y.; Mack, T.; Pana, C.; et al. Summary of Alberta’s Shale- and Siltstone-Hosted Hydrocarbon Resource Potential: ERCB/AGS Open File Report 2012-06; Energy Resources Conservation Board of Alberta and Alberta Geological Survey: Edmonton, AB, Canada, 2012; p. 327. [Google Scholar]
  37. Petersen, H.I. A reconsideration of the “oil window” for humic coal and kerogen Type III source rocks. J. Pet. Geol. 2003, 25, 407–432. [Google Scholar] [CrossRef]
  38. Majorowicz, J.A.; Jessop, A.M.; Lane, L.S. Regional heat flow pattern and lithospheric geotherms in northeastern British Columbia and adjacent Northwest Territories, Canada. Bull. Can. Pet. Geol. 2005, 53, 51–66. [Google Scholar] [CrossRef]
  39. Tuya Terra Geo Corp; Geothermal Management Company. Direct-Use Geothermal Resources in British Columbia: Report 2016-07 (Section A): Burnaby, British Columbia, Tuya Terra Geo Corp; Geothermal Management Company Inc. & Geoscience: Burnaby, BC, Canada, 2016; p. 38. [Google Scholar]
  40. Bachu, S.; Cao, S. Present and past geothermal regimes and source rock maturation, Peace River Arch Area, Canada. AAPG Bull. 1992, 76, 1533–1549. [Google Scholar] [CrossRef]
  41. Allen, P.A.; Allen, J.R. Basin Analysis: Principles and Applications; Blackwell Scientific Publications: Malden, MA, USA, 1990; p. 451. [Google Scholar]
  42. Faraj, B.; Harold, W.; Addison, G.; McKinstry, B.; Donaleshen, R.; Sloan, G.; Lee, J.; Anderson, T.; Leal, R.; Anderson, C.; et al. Shale Gas Potential of Selected Upper Cretaceous, Jurassic, Triassic and Devonian Shale Formations in the Western Canada Sedimentary Basin of Western Canada: Implications for Shale Gas Production: GRI-02/0233; Gas Technology Institute: Des Plaines, IL, USA, 2002; p. 258. [Google Scholar]
  43. Ferri, F.; Hayes, M.; Goodman, E. 2007–2011 Core and Cuttings Analyses: Petroleum Geology Open File 20013-1; BC Ministry of Natural Gas Development: Victoria, BC, Canada, 2013. [Google Scholar]
  44. Fowler, M.G.; Obermajer, M.; Snowdon, L.R. Rock-Eval/TOC Data for Eight NE British Columbia Boreholes (Map Areas 93-O to 94-H): Open File 5673; Geological Survey of Canada: Ottawa, ON, Canada, 2007. [Google Scholar] [CrossRef]
  45. Fowler, M.G.; Snowdon, L.R. Rock-Eval/TOC Data for Nine West Central Alberta Wells (Township 58 to 69, Ranges 18W5 to 12W6): Open File 3591; Geological Survey of Canada: Ottawa, ON, Canada, 1998; p. 89. [Google Scholar] [CrossRef]
  46. Fowler, M.G.; Snowdon, L.R. Rock-Eval/TOC Data for Ten Northern Alberta and British Columbia Wells: Open File 4124; Geological Survey of Canada: Ottawa, ON, Canada, 2001. [Google Scholar] [CrossRef]
  47. Ibrahimbas, A.; Riediger, C. Hydrocarbon source rock potential as determined by Rock-Eval pyrolysis, northeast British Columbia and northwest Alberta. In British Columbia Ministry of Energy and Mines Resource Development and Geoscience Branch Summary of Activities; British Columbia Ministry of Energy and Mines: Victoria, BC, Canada, 2004; pp. 7–18. [Google Scholar]
  48. Riediger, C.L. Rock-Eval/TOC Data from the Lower Jurassic “Nordegg Member” and from the Lower and Middle Triassic Doig and Montney Formations, Western Canada Sedimentary Basin, Alberta and British Columbia: Open File 2308; Geological Survey of Canada: Ottawa, ON, Canada, 1990; p. 27. [Google Scholar] [CrossRef]
  49. Romero-Sarmiento, M.-F.; Euzen, T.; Rohais, S.; Jiang, C.; Littke, R. Artificial thermal maturation of source rocks at different thermal maturity levels: Application to the Triassic Montney and Doig formations in the Western Canada Sedimentary Basin. Org. Geochem. 2016, 97, 148–162. [Google Scholar] [CrossRef]
  50. Snowdon, L.R. Rock-Eval/TOC Data for Six Wells in the Worsley Area of Alberta (Townships 80 to 87 and Ranges 3W6 to 10W6): Open File 3492; Geological Survey of Canada: Ottawa, ON, Canada, 1997; p. 51. [Google Scholar] [CrossRef]
  51. Walsh, W.; McPhail, S. Shale Gas Potential: Core and Cuttings Analysis, Northeast British Columbia: Petroleum Geology: Open File 2007-01; British Columbia Ministry of Energy, Mines and Petroleum Resources, Resource Development and Geoscience Branch: Victoria, BC, Canada, 2007; p. 10. [Google Scholar]
  52. Anderson, K.; Woods, A. Taphonomy of Early Triassic fish fossils of the Vega-Phroso Siltstone Member of the Sulphur Mountain Formation near Wapiti Lake, British Columbia, Canada. J. Palaeogeogr. 2013, 2, 321–343. [Google Scholar]
  53. Silva, P.L. Petroleum System Analaysis of the Traissic Doig Formation, Western Canada Sedimentary Basin. Ph.D. Thesis, University of British Columbia, Vancouver, BC, Canada, 2021; p. 330. [Google Scholar]
  54. Barclay, J.E.; Krause, F.F.; Campbell, R.I.; Utting, J. Dynamic casting of the Dawson Creek Graben Complex: Carboniferous-Permian Peace River Embayment, western Canada. Bull. Can. Pet. Geol. 1990, 38, 115–145. [Google Scholar] [CrossRef]
  55. Brack, L.; Abbott, G.M.; Noble, I.A.; Tang, C.W. Triassic/Jurassic fields. In Geophysical Atlas of Western Canadian Hydrocarbon Pools; Anderson, N.L., Hills, L.V., Cederwall, D.A., Eds.; Canadian Society of Exploration Geophysicists and Canadian Society of Petroleum Geologists: Calgary, AB, Canada, 1987; pp. 187–215. [Google Scholar]
  56. Davies, G.R.; Moslow, T.F.; Sherwin, M.D. The Lower Triassic Montney Formation, west-central Alberta. Bull. Can. Pet. Geol. 1997, 45, 474–505. [Google Scholar]
  57. Desrocher, S. Isotopic and Compositional Characterisation of Natural Gases in the Lower and Middle Triassic Montney, Halfway and Doig Formations, Alberta Basin. Master’s Thesis, University of Calgary, Calgary, AB, Canada, 1997. [Google Scholar]
  58. Chalmers, G.R.L.; Bustin, R.M. Lower Cretaceous gas shales in northeastern British Columbia, Part II: Evaluation of regional potential gas resources. Bull. Can. Pet. Geol. 2008, 56, 22–61. [Google Scholar] [CrossRef]
Figure 1. The location of wells sampled (cross symbol) for hydrocarbon composition and the location of the subdivided regional areas used in this study. Major structural elements that affect the deposition of the Montney Formation are also shown (modified from [32,33]).
Energies 15 08677 g001
Figure 2. Structure on top of the Montney Formation in British Columbia and Alberta. The structure map shows an increasing depth to the top of the Montney Formation towards the southwest. The white dot shows the location of the one-dimensional basin model.
Energies 15 08677 g002
Figure 3. Thickness distribution of the Montney Formation British Columbia and Alberta. The impact of the Fort St. John Graben (see Figure 1) is shown by the localised thickening of the Montney Formation in the Fort St. John and Dawson Creek areas (red and orange shaded contours).
Energies 15 08677 g003
Figure 4. Thickness distribution of the Upper Montney Formation in British Columbia and Alberta. The distribution shows an increase in thickness towards the deformation front and within the structures of the Fort St. John Graben complex (see Figure 1). The Upper Montney Formation is thin to absent in Alberta.
Energies 15 08677 g004
Figure 5. Thickness distribution of the Middle Montney Formation in British Columbia and Alberta. The Middle Montney Formation is a significant component of the total Montney Formation thickness.
Energies 15 08677 g005
Figure 6. Thickness distribution of the Lower Montney Formation in British Columbia and Alberta. The Lower Montney Formation is inconsistent in its thickness distribution with localised thicknesses along the deformation front and near Fairview, Alberta.
Energies 15 08677 g006
Figure 7. Distribution of the thermal maturity indicator, Tmax, for the Montney Formation. Changes in the maturation trends within the Fort St. John area (to cooler blue colours and lower maturity) are due to the Fort St. John Graben structures (see Figure 1) impacting the maturation process.
Energies 15 08677 g007
Figure 8. Total organic carbon (TOC) content histogram for the Montney Formation. This distribution is based on 10,000 Rock Eval analyses that were within the public domain. See the main text for details.
Energies 15 08677 g008
Figure 9. The average total organic carbon (TOC) content distribution of the entire Montney Formation. Higher TOC contents were observed along the western edge of the basin adjacent to the deformation front, and this may be due to deeper water, anoxic bottom water preserving greater amounts of organic material.
Energies 15 08677 g009
Figure 10. Pseudo-Van Krevelen plot of Montney Formation Rock Eval analyses. The plot shows a large variability in kerogen types across the entire formation, which is not surprising, as the Montney Formation would represent many depositional environments (i.e., offshore deep water, nearshore bioclastic shorelines) and maturation levels. Kerogen that contains low HI and OI are due to the high transformation ratio experienced in areas of high maturation (high Tmax values).
Energies 15 08677 g010
Figure 11. Distribution of hydrogen index in the Montney Formation. The HI values decrease towards the deformation front and the deeper parts of the WCSB. The decrease in HI values reflects the increase maturity of the Montney Formation as it was more deeply buried and more hydrogen is converted to hydrocarbons.
Energies 15 08677 g011
Figure 12. Kerogen activation energy distribution used in the Montney Formation basin model. The model was derived from the Doig Formation and is described in detail in Silva (2021). The median activation energy was calculated as being 52 kcal/mol, with a pre-exponential factor of 1.81 × 1025/Ma.
Energies 15 08677 g012
Figure 13. One-dimensional burial history of the basin at a location in BC shown in Figure 2 (white circle), highlighting the Montney Formation and showing temperature, maturity, and transformation ratio as overlays (respectively, from top to bottom).
Energies 15 08677 g013
Figure 14. Maximum depth of burial of the Lower Montney Formation. No control points are shown on this map as the data were generated by Basin Model back-stripping simulation.
Energies 15 08677 g014
Figure 15. Cross-section A–A′ along the stratigraphic dip of the basin, showing the burial at different times, highlighting the Montney Formation. Facies legend shown below in Figure 16, and location is shown in Figure 2. Note the cross-section at time 0 Ma is still the A–A′ location.
Energies 15 08677 g015
Figure 16. Legend for facies used in the basin model and shown in cross-sections A–A′ and B–B′ (Figure 15 and Figure 17, respectively).
Energies 15 08677 g016
Figure 17. Cross-section B–B′ along the stratigraphic strike of the basin, showing the burial at different times, highlighting the Montney Formation. Facies legend shown below in Figure 16, and location is shown in Figure 2. Note the cross-section at time 0 Ma is still the B–B′ location.
Energies 15 08677 g017
Figure 18. Petroleum generation of the source rocks simulated in the basin model, showing the onset and plateauing of generation. The Colorado Group provided the largest volumes of hydrocarbons, with the Montney Formation producing the fourth largest volumes after the Duvernay and Gordondale formations.
Energies 15 08677 g018
Figure 19. Kerogen transformation ratio in the Middle Montney Formation at 101 Ma. This was the initial generation of hydrocarbons in the Montney Formation.
Energies 15 08677 g019
Figure 20. Kerogen transformation ratio in the Middle Montney Formation at 85 Ma. This was the time when the Montney Formation was at peak generation of hydrocarbons.
Energies 15 08677 g020
Figure 21. Kerogen transformation ratio in the Middle Montney Formation at 72 Ma. Due to the rapid foreland subsidence in the southwest, wet gas (LHCs) generation in the Montney Formation started throughout most of the southwest.
Energies 15 08677 g021
Figure 22. Kerogen transformation ratio in the Middle Montney Formation at 60 Ma. With continued rapid foreland subsidence, areas along the deformation were at 100% transformation ratios, and secondary cracking of wetter hydrocarbons to dry gas (SHCs) started in the deepest areas.
Energies 15 08677 g022
Figure 23. Present day kerogen transformation ratio in the Middle Montney Formation. The subsidence continued until approximately 50 Ma, and the Montney Formation in the southwest reached the late dry gas window (transformation ratio at 100%) before thermal maturation arrested by the rapid uplift and exhumation of Paleogene sediments.
Energies 15 08677 g023
Figure 24. Distribution of gas dryness ratio on the entire Montney Formation. The wetter region at Fox Creek in the SE of the map is the conventional Montney coquina reservoir in the Kaybob oilfield. This is part of the bioclastic shoreline succession [11] of the Montney Formation and highlights the diverse range of reservoir types in the Montney Formation. The map shows the location of cross-sections C–C′, D–D′, E–E′, and F–F′ (Figure 30, Figure 31, Figure 32 and Figure 33).
Energies 15 08677 g024
Figure 25. The distribution of the gas dryness ratio for the Lower Montney Formation. A similar gas dryness pattern was observed from individually mapping the Upper and Middle Montney Formation subzones.
Energies 15 08677 g025
Figure 26. The distribution of the gas dryness ratio on the Middle Montney Formation. A similar gas dryness pattern was observed from individually mapping the Upper and Middle Montney Formation subzones.
Energies 15 08677 g026
Figure 27. The distribution of the gas dryness ratio on the Upper Montney Formation. The gas wetness increases in the Upper Montney Formation near Fox Creek, Alberta, compared to the Middle (Figure 26) and Lower (Figure 25) Montney subunits.
Energies 15 08677 g027
Figure 28. Distribution of thermal maturity in the Montney Formation and bubble map overlay of the iC4/nC4 ratio. In most cases, the ratio iC4/nC4 ratio increases towards the deformation front, as indicated by the symbols becoming larger and lighter blue and green colours. Ratios that are greater than 5 are probably anomalies and need to be further investigated.
Energies 15 08677 g028
Figure 29. Distribution of thermal maturity in the Montney Formation and bubble map overlay of the iC5/nC5 ratio. The ratio between the isomers iC5/nC5 of pentane shows a similar trend to the iC4/nC4 ratio with an increasing ratio towards the deformation front. Ratios that are greater than 5 are probably anomalies and need to be further investigated.
Energies 15 08677 g029
Figure 30. NE-SW cross-section along the depositional dip near the Dawson Creek area. See Figure 24 for the location of the cross-section C–C′. The Upper Montney Top is the brownish yellow line, the Middle Montney Top is the dark blue line, the Lower Montney Top is light bluish green line, and the base of the Montney at the Belloy Top is the dark red line. The Upper Montney subunit becomes thinner, and the overall gamma ray values for the Montney formation decrease towards the NE into Alberta.
Energies 15 08677 g030
Figure 31. NW-SE cross-section along the depositional strike near the Dawson Creek area. See Figure 24 for the location of the cross-section D–D′. The Upper Montney is more organic rich and/or clay rich than the Middle and Lower Montney, as illustrated by the higher gamma ray values. The Upper Montney Top is the brownish yellow line, the Middle Montney Top is the dark blue line, the Lower Montney Top is light bluish green line, and the base of the Montney at the Belloy Top is the dark red line. The Montney Formation is thick (>250 m) across the majority of this cross-section as it is part of the Fort St. John graben area. The thickness dramatically reduces towards the SE as the cross-section exits the graben.
Energies 15 08677 g031
Figure 32. NW-SE cross-section along the depositional strike near the Fox Creek area. See Figure 24 for the location of the cross-section E–E′. The Upper Montney Top is the brownish yellow line, the Middle Montney Top is the dark blue line, the Lower Montney Top is the light bluish green line, and the base of the Montney at the Belloy Top is the dark red line. The thickness of the Montney Formation is most likely to be affected by the Fox Creek escarpment, and the thickness is greater in the northern sections, which correlates with the higher TOC and HI content and the lower gas dryness composition. The kerogen type may be responsible for the change in gas composition in this area, with more type I and II kerogen generating longer-chained hydrocarbons.
Energies 15 08677 g032
Figure 33. NE-SW cross-section along the depositional dip near the Fox Creek area. See Figure 24 for the location of the cross-section F–F′. The Upper Montney Top is the brownish yellow line, the Middle Montney Top is the dark blue line, the Lower Montney Top is light bluish green line, and the base of the Montney at the Belloy Top is the dark red line. The Montney formation dramatically thins to the NE into Alberta. This cross-section cuts through the higher gas dryness area of Fox Creek and the sandier facies at a depth of 1920 m in 100110405823W500, potentially acting as a conduit for drier gas migrating from a downdip.
Energies 15 08677 g033
Figure 34. Box plot for the gas dryness ratio for northern (A) and southern regions (B) of British Columbia (BC). See Figure 2 for the location of these regions. There are no consistent trends between the Upper, Middle, and Lower Montney subunits when comparing the hydrocarbon compositions. The Montney formation becomes drier in hydrocarbon composition from the Upper to Middle to Lower Montney subunits in the northern region of BC. The reverse is true in the southern region of BC. The number of samples are n = 78 for Northern BC Upper Montney wells, n = 159 for Southern BC Upper Montney wells, n = 135 for Northern BC Middle Montney wells, n = 7 for Northern BC Lower Montney wells, n = 159 for Southern BC Upper Montney wells, n = 98 for Southern BC Middle Montney wells, and n = 7 for Southern BC Lower Montney wells.
Energies 15 08677 g034
Figure 35. Box plot for the gas dryness ratio for the northern (A), central (B), and southern (C) regions of Alberta (AB). See Figure 2 for the location of these regions. There are no consistent trends between the Upper, Middle, and Lower Montney subunits when comparing the hydrocarbon composition. The Montney Formation becomes slightly drier in hydrocarbon composition from the Upper to Middle to Lower Montney subunits in northern AB. The Upper Montney is slightly drier than the Middle and Lower Montney subunits in Central AB. In the southern AB region, the gas composition is similar in the Upper and Middle Montney subunits with a wetter Lower Montney subunit. For northern AB Upper Montney wells, n = 172, with n = 54 for northern AB Middle Montney, n = 1 for northern AB Lower Montney, n = 323 for Central AB Upper Montney, n = 2229 for Central Middle Montney, n = 528 for Central AB Lower Montney, n = 1415 for southern AB Upper Montney, n = 363 for southern AB Middle Montney, and n = 57 for southern AB Lower Montney wells.
Energies 15 08677 g035
Figure 36. Cross plot of gas dryness and the iC4/nC4 ratio for all BC Montney producers at the time of this report. The iC4/nC4 is used as a maturity indicator with the line best representing the regional maturation trend from [4]. An excess methane percentage was calculated from the deviation away from the expected gas composition of the regional maturation trend. Wells that have high excess methane (i.e., red colours) have a greater ex situ (migrated) gas content compared to wells noted by black symbols. Wells represented by black or green symbols have lower ex situ gas contents, and the hydrocarbons are the result of in situ generation that is typical of a self-sourcing reservoir compared to the AB Montney producers outlined in Figure 37.
Energies 15 08677 g036
Figure 37. Cross plot of gas dryness and the iC4/nC4 ratio for all Alberta Montney producers at the time of this study. The iC4/nC4 is used as a maturity indicator with the line best representing the regional maturation trend from [4]. An excess methane percentage was calculated from the deviation away from the expected gas composition of the regional maturation trend. Wells that have high excess methane (i.e., red colours) have a greater ex situ gas content compared to wells noted by black symbols. Wells represented by black or green symbols have low ex situ gas contents, and the hydrocarbons are the result of in situ generation that is typical of a self-sourcing reservoir. The Alberta Montney producers have a greater contribution of migrated gas than the BC wells.
Energies 15 08677 g037
Figure 38. The excess methane percentage (symbols) for Montney Producers in BC and Alberta. The excess methane percentage is the calculated increase percentage of methane based on the iC4/nC4 ratio regional maturation trend of [4]. The methane gas dryness percentage is also shown as contour lines. The contour interval is 0.025 (i.e., 2.5%). Darker colours are indicative of hydrocarbon compositions that are aligned with the regional maturation trends across the basin and probably self-sourced hydrocarbons or very limited migration distances. The larger orange and red symbols indicate locations that have the hydrocarbon composition not aligned with regional maturation trends, and there is a larger component of migrated hydrocarbons in the reservoir. This is well illustrated by the Montney in eastern Alberta that is a more conventional petroleum system.
Energies 15 08677 g038
Figure 39. Expanded view of the Fort St. John to Grand Prairie areas that are the focus of the [2] and [4] studies. Black dashed lines with arrows indicate the direction of more mature, drier gas (higher methane content) having migrated updip from the BC/Alberta boundary into less mature, more liquid-rich sections of the Montney Alberta play area. See Figure 38 for the scale and legend.
Energies 15 08677 g039
Figure 40. Expanded view of gas composition near the town of Fox Creek, Alberta. See Figure 38 for the location. The pink line highlights the drier gas composition contour of 0.9 (i.e., 90% methane composition in producing fluids). The blue arrow indicates a migration of drier gas into the Fox Creek area, as illustrated by the high concentration of large red bubble plots compared to the area north of the town of Fox Creek that contains smaller bubble plots in a variety of shades of green, blue, yellow, and orange. See Figure 38 for the scale and legend.
Energies 15 08677 g040
Publisher’s Note: MDPI stays neutral with regard to jurisdictional claims in published maps and institutional affiliations.

