Abstract
This study aimed to investigate the repeatability and reliability of saccadic latency and fixation stability as a function of sighting-dominance and contact lens wear. Eye movements were recorded in 12 healthy adults who performed a prosaccade and a fixation task in four conditions; baseline, retest, non-sighting eye viewing and plano contact lens wear. The results showed that saccadic latency and fixation stability (indexed via logBCEA) have good internal consistency, reliability and repeatability, which are not influenced by sighting-dominance or contact lens wear. For standard deviation of eye position, internal consistency was low to moderate. The results also indicated that the non-sighting eye is slightly less stable than the sighting eye and that wearing a contact lens decreases precision.
Introduction
Over the last decades, there has been an extreme development in eye tracking technology and the use of video-based eye tracking devices has become increasingly popular. Applications for both basic and applied research paradigms are widespread (Reingold, 2014; Wade & Tatler, 2011). Yet, the number of articles focusing on data quality are limited, and there is a need for standardized methods, tasks and parameters (Smyrnis, 2008). This study was conducted to investigate the internal consistency, reliability and repeatability of saccade latency and fixation stability in healthy adults performing two frequently used tasks; a prosaccade task and a fixation task.
Reliability and Repeatability
Saccade latency, or the reaction time of a visually guided saccade, is not only the speed of a motor response, but is also considered an indirect measure of visual processing speed (McDowell, Dyckman, Austin, & Clementz, , 2008). It has been suggested that saccade latency is trait-like in nature (Ettinger et al., 2003) and that it can serve as a biomarker for people at risk for several psychiatric and neurodegenerative disorders (Blekher et al., 2009). Saccade latency in healthy adults is around 200 ms, and previous studies have found good to excellent test-retest repeatability of saccade latency in healthy individuals (Blekher et al., 2009; Ettinger et al., 2003; Klein & Fischer, 2005; Wilson, Glue, Ball, & Nutt, 1993). Zhang and colleagues explored the possibility of using saccades as a biometric verification tool, and found no change in saccade latency over a time span of up to 16 months (Zhang, Laurikkala, & Juhola, 2014). Wöstmann and colleagues found excellent internal consistency for prosaccades, Cronbach’s alpha were 0.91 (Wöstmann et al., 2013). They also looked at test-retest repeatability after 11 weeks and found just as high consistency (Cronbach’s alpha 0.92) and high correlations (ICC 0.80, Pearson 0.81) (Wöstmann et al., 2013). In that study, they used 60 trials, and found that for saccade latency, Pearson’s correlation were 0.83 with only 25% of trials (15 trials). For binocular saccades, Kloke and Jaschinski found that differences between individuals were much larger than the difference between test and retest about 8 days later (Kloke & Jaschinski, 2006). Kloke and Jaschinski reported that about 20 trials were enough to observe individual differences in the asymmetry of binocular saccades (Kloke & Jaschinski, 2006).
Fixation stability, or the stillness of the eye, is considered a measure of attention ability (Rommelse, Van der Stigchel, & Sergeant, 2008). Fixation stability performance during a certain time interval can be reported in different ways, amongst others standard deviation of eye position (Ukwade & Bedell, 1993). Ukwade and Bedell found in their study that standard deviation of eye position was 8.9 arcmin when healthy adults fixated a fixation cross for 10 seconds and that this did not deteriorate with repeated testing, even if they changed target contrast (Ukwade & Bedell, 1993). The bivariate contour ellipse area (BCEA) measure of fixation stability was first introduced by Steinman (Steinman, 1965), and is considered more complete than standard deviation of eye position, as it takes into account the correlation between x and y coordinates (Castet & Crossland, 2012). BCEA encompasses a certain percentage of eye position coordinates, most often 68% that incorporates one standard deviation of the highest density points. LogBCEA is often selected in studies to approximate normal distribution. A study on fixation stability in patients with macular disease found that a grading system had poor reliability (30% of patients had a different grading on retest) whereas the logBCEA method had a coefficient of repeatability (CR) of 0.61, which represents the maximum difference that can be expected between two measurements in 95% of test-retest pairs. That study also reported similar test-retest logBCEA with paired t-test (p=.426) (Chen et al., 2011). In healthy adults looking at stationary stimuli, the test-retest variability of fixation stability between trials during the same day measured by BCEA is reported to be between 20-27% (Crossland & Rubin, 2002). Blignaut and Beelders compared standard deviation, root-mean square (RMS) and BCEA as precision measures in two different eye trackers using an artificial eye (Blignaut & Beelders, 2012). They found that both the standard deviation and the RMS could lead to a false sense of good precision in the case of a high sampling rate eyetracker, and propose the use of the BCEA method as it provides an intuitive quantity that is independent of frame rate (Blignaut & Beelders, 2012). Ettinger and colleagues reported fixation stability as number of saccades during four fixations of 20 seconds duration (Ettinger et al., 2003). They found ICC of 0.54 and Pearson’s correlation of 0.55 for retest approximately 58 days later (Ettinger et al., 2003).
Ocular dominance
The vast majority of eye tracking studies use monocular recording both because monocular eye trackers are cheaper and because of the assumption that the two eye makes similar movements (Holmqvist et al., 2011). Eye trackers of common use have left eye tracking as default and studies of eye movement reliability have used recordings from left eye only (Ettinger et al., 2003), despite the fact that about ¾ of the adult population have right eye dominance (Ito et al., 2013; Momeni-Moghaddam, McAlinden, Azimi, Sobhani, & Skiadaresi, 2014). It has been shown in previous studies that processing speed may vary between the dominant and the non-dominant eye with about 14 ms (Coren & Porac, 1982). A study of saccade latency in the dominant eye in relation to the non-dominant eye did not find any systematical differences between the two eyes, but they did find that most participants showed a latency asymmetry between 10 and 20 ms (Moiseeva, Slavutskaya, & Shul'govskii, 2000).
Asymmetry in the latency of saccade is connected to a well-known phenomenon of transient divergence between the eyes during a saccade. This phenomenon is thoroughly investigated by (amongst others) Collewijn and co-workers who showed that with horizontal saccades between stationary stimuli, the eyes diverged up to 3° during saccades, and the latency of the abducting eye was consistently 1 ms shorter that the adducting eye (Collewijn, 2001). Another study reported binocular asymmetry in saccade latency up to 1.4 ms in some subjects, and perfect symmetry in others (Kloke & Jaschinski, 2006). It has been shown that binocular asymmetry and transient divergence of the eyes during a saccade results in a corrective convergence movement during the following fixation (Hendriks, 1996; Kloke & Jaschinski, 2006). It has been discussed if transient divergence is beneficial for rapid sensory intake during the following fixation as suggested by Collewijn, or if it is a disadvantage leading to poorer binocular intake of visual information as Hendricks proposed (Kloke & Jaschinski, 2006). Yang and Kapoula showed that binocular coordination of saccades and fixation stability after a saccade are poorer in children than in adults, and that this may have implications for reading in young children (Yang & Kapoula, 2003). Some studies have reported larger variability of saccade latency in dyslexic subjects, as well as poor fixation stability (Bednarek, Tarnowski, & Grabowska, 2006, Biscaldi, Fischer, & Aiple, 1994, Biscaldi, Fischer, & Hartnegg, 2000, Biscaldi, Gezeck, & Stuhr, 1998). Ocular dominance was not reported in these studies (Bednarek et al., 2006; Biscaldi et al., 1994; Biscaldi et al., 2000; Biscaldi et al., 1998; Collewijn, 2001; Hendriks, 1996; Kloke & Jaschinski, 2006; Yang & Kapoula, 2003). The contribution of ocular dominance to binocular fixation stability has been investigated for years, with a controversy regarding the importance of ocular dominance for reading. During the 1980’s, Stein and his group published several studies suggesting that unstable ocular dominance was associated with reading difficulties and that monocular occlusion therapy would improve ocular dominance stability as well as reading performance (Stein, Richardson, & Fowler, 2000, Stein, Riddell, & Fowler, 1987, Stein, Riddell, & Fowler, 1988). The importance of ocular dominance for reading has not been confirmed (Zeri, De Luca, Spinelli, & Zoccolotti, 2011), nor has the importance of ocular dominance for monocular fixation stability been clarified.
Contact lens artefacts
Soft contact lenses are commonly used by healthy adults (up to 15% of the population (Morgan et al., 2010)) and these persons are frequently enrolled in studies of eye movements (Holmqvist et al., 2011). Data quality may be poorer with the use of a contact lens, due to the reflection from small air bubbles between the eye and the lens. The eye tracker confuses the reflection from the air bubbles with the reflection from the cornea, and perceives a movement of the eye (Holmqvist et al., 2011). The suggested solution to this problem is to manually defocus the camera in the eye tracker, but not all eye trackers have this possibility. Additionally, defocusing will result in reduced accuracy, as the corneal reflection will become larger (Nystrom, Andersson, Holmqvist, & van de Weijer, 2013). Nystrom and colleagues found that contact lenses increases offset significantly (Nystrom et al., 2013). From clinical observations, we know that the movement of a contact lens sometimes lags behind the movement of the eye. From this, we speculated that the corneal reflex observed by the eye tracker might be influenced by this lag and disturb data quality. Van der Geest and Frens compared video-oculography with the gold standard of eye movement recording, the scleral search coil technique, and one of their findings was that saccadic peak velocity was slightly higher in the video system (van der Geest & Frens, 2002). They suggest that this may be related to the viscoelastic coupling between the annulus in the search coil and the cornea. This might also be the case with contact lens wear, the coupling between the contact lens and the cornea might theoretically lead to artificially high velocity measures and thus shorter saccade latency.
Summary
Studies have found that there are considerable inter-individual differences in both saccadic latency and fixation stability and many, but not all, individuals show an interocular difference. There is a lack of studies reporting ocular dominance in participants. The effect of wearing a soft contact lens on saccade latency or fixation stability is not previously reported.
The primary aim of this study was to investigate reliability and repeatability of saccade latency and fixation stability in a prosaccade task and a fixation task. We also wanted to compare two methods of reporting fixations stability, standard deviation of horizontal and vertical eye position and logBCEA.
Secondary aims were to explore the possible difference between saccadic latency and fixation stability in dominant versus non-dominant eye, and the effect of wearing contact lenses during these measures of eye movements.
Materials and methods
Subjects
Twelve healthy adult subjects (one male), aged between 20 and 39 years (mean 27.3 ±5.9 years) were recruited from the student and employee populations at the Buskerud University College. Subjects underwent a thorough optometric examination prior to participation. Inclusion criteria included visual acuity better than logMAR 0.1 at distance and near (6 m and 40 cm), no need for refractive correction, normal binocular vision and normal accommodation for age (Scheiman & Wick, 2002).
The dominant eye was determined by a sighting test at distance (6 m) and near (40 cm). Sighting tests have high test-retest reliability, and the vast majority of studies agree that there is a sighting-dominant eye for each person (Mapp, Ono, & Barbeito, 2003, Rice, Leske, Smestad, & Holmes, 2008). This sighting test is similar to what is recommended in eye tracking literature (Holmqvist et al., 2011), and what has been reported as clinically repeatable (Rice et al., 2008). The contact lens that was used was a daily disposable soft contact lens with no refractive correction (material: hilafilcon B; curvature: 8.6 mm; diameter: 14.2 mm). Presumably, daily disposable lenses have decreased risk of air bubbles and less-than-perfect lens fit. Additionally, participants were allowed sufficient adaptation time to the contact lens. They were also given a drop of tear film stabilizer to increase comfort during the experiment (Peterson, Wolffsohn, Nick, Winterton, & Lally, 2006).
None of the subjects had any previous experience with eye movement testing, and they were naïve to the purpose of the experiment. All subjects gave informed consent prior to inclusion in the study. The experiment was conducted in accordance with the Declaration of Helsinki (WMA, 2013), and was approved by Regional committees for medical and health research ethics.
Procedure
The experiments were presented on a fast phosphor monitor with a 100 Hz refresh rate (Phillips 20T). The resolution of the monitor was 1024x768 pixels. The room was dimly illuminated. Background color on the monitor was dark grey, with an even luminance of 22 cd/m² across the screen. Stimulus color was light yellow, with an even luminance of 276 cd/m², the contrast level was 92%. Throughout the experiments, the subject sat in a firmly mounted chair 100 cm from the monitor, adjusted in height so that the subject’s eyes were in line with the center of the screen. A chin- and forehead rest was used in order to minimize head movements.
The stimulus were viewed binocularly. A video-based eye tracking system, the IScan ETL-300, recorded the vertical and horizontal position of one eye with a sampling frequency of 120 Hz. Data from the eye tracking processor in the camera was extracted by the use of ISCAN’s Raw Eye Movement Data Acquisition Software (ISCAN, 2003). Eye position data, with accompanying time stamps, were exported to Excel for post-experimental analysis. The camera was placed 40 cm from the participant, in line with the recorded eye’s line of sight. Prior to each experimental session, the eye-tracker was calibrated by the presentation of five 0.5° boxes, located in the center and in the four corners of a square subtending 20° x 20°.
Noise and precision was measured specifically for this laboratory setup and the tasks described. Instrument noise, measured using an artificial eye, was below 0.05 pixels in all directions. Human noise, measured using a trained observer, was below 2.61 pixels, which corresponded to 0.055° at the experimental testing distance. Precision in this task was 0.161° (RMS), calculated from more than 1500 trials with a trained observer.
There was one saccade experiment with twenty-four trials and one fixation experiment with sixteen trials. The subjects were instructed to maintain attention during the experiments, which lasted either 48 (saccade experiment) or 64 (fixation experiment) seconds. Subjects performed a couple of practice runs prior to the experiment and there was a short break between the saccade experiment and the fixation experiment.
Saccade Experiment. A simultaneous presentation visually guided saccade task was used. A trial started with the appearance of a fixation cross at the center of the screen, which was visible for one second. When the fixation cross was extinguished, a bright yellow dot 0.2° in diameter simultaneously appeared at one of eight possible positions, chosen at random, which was placed at the vertices of a regular octagon, 5° from the fixation cross. The dot was visible for one second. When the dot was extinguished, the fixation cross re-appeared immediately, signaling the start of a new trial. Subjects were instructed to look at the dot as quickly and accurately as possible.
Fixation Experiment. The fixation task was identical to the saccade task, except the dot was visible for three seconds instead of one second.
The experiments were repeated in four conditions, (1) recordings from the dominant eye (‘Control’), (2) repeated recordings from the dominant eye, with a separation of minimum one day and maximum 49 days (‘Retest’), (3) recording from the non-dominant eye (‘NonDom’) and (4) wearing a pair of contact lenses with no refractive power (‘Lens’). Conditions (3) and (4) was recorded in a random sequence, on the same day as condition (1). Testing were performed during approximately the same time of the day, between 10 AM and 15 PM for all participants. An experienced operator performed all testing sessions (one of the authors: GHV).
Data Analysis
Data were analyzed using velocity and duration criteria, as well as by visual inspection of the data. The first trial of each task and trials that included blinks were not included in the analysis.
Saccade latency. Saccade onset was defined as the time at which eye velocity exceeded 20°/s for more than 32 ms after stimulus appearance (that is, 4 consecutive eye tracker sampling points). Saccade offset was defined as the time after saccade onset at which eye velocity decreased below 20°/s. This velocity threshold has been used in previous, similar research (Biscaldi et al., 2000; Klein & Fischer, 2005). Each trial elicited one saccade (the return saccade for next trial was not included in the analysis). Latencies shorter than 120 ms was rejected, assuming this was probably a temporal anticipated movement (Zhang et al., 2014). Likewise, if the participant made corrective saccades, the trial was excluded. This was done to increase the probability that only visually guided prosaccade latencies were collected from the experiment.
Fixation stability. Saccadic suppression typically persist for approximately 80 ms after the end of a saccade (Holmqvist et al., 2011). Perceptual input may improve fixation stability, thus we chose to define the fixation period as starting 80 ms after saccade offset and ending 80 ms prior to saccade onset. Each trial elicited one fixation period, fixations of the cross in the center of the screen was not included in the analysis. In order to obtain similarity of fixation durations across subjects and trials, fixations lasting less than 50 sampling points, or 0.4 s, were also excluded from analysis.
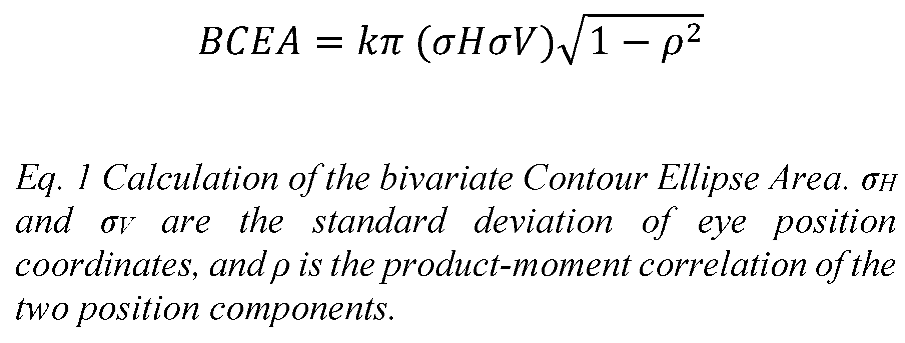
The sampling frequency of the eye tracker (120 Hz) was too low to detect microsaccades. Therefore, in this study, ‘fixation stability’ refers to ‘eye position stability during the fixation task’. Fixation stability was reported as horizontal and vertical standard deviation of eye position from the mean (σH and σV), in arcminutes. Fixation stability was also reported as the logarithm of the bivariate contour ellipse area (BCEA), in arcminutes². The bivariate ellipse area (BCEA) is calculated by Equation 1 (Eq. 1). The BCEA presupposes that the distribution of fixation points are Gaussian, which has been shown to be a reasonable assumption for people with good visual acuity (Steinman, 1965). k is commonly set to 2.28 so that the BCEA encompasses 68% or one standard deviation of the highest density points (Amore et al., 2013; Castet & Crossland, 2012; Chen et al., 2011). In this work, we calculated both the 68% BCEA as well as the 95% BCEA (k=5.98) that incorporates two standard deviations of eye position coordinates.
For statistical analysis, we used logBCEA to approximate normal distribution (Amore et al., 2013; Cesareo et al., 2014; Chen et al., 2011).
Statistics
Statistical analysis was performed using the IBM© SPSS Statistics version 22 (Copyright IBM Corp. and other(s), 1989, 2013). The α level was set at 0.05. The Kolmogorov-Smirnov test was used to look at normal distributions in the datasets. Cronbach’s coefficient alpha was used to assess internal consistency. To compute Cronbach’s alpha, we calculated the mean of two consecutive time sections of equal length for each parameter (Ettinger et al., 2003). A Cronbach’s α of 0.7 to 0.8 or above is generally considered acceptable (Field, 2013).
Repeated measure univariate analyses of variance (ANOVA) was used to analyze differences in saccade latency and fixation stability across test conditions, and paired t-tests were used for pairwise comparison. The α level was set to 0.05, with Bonferroni adjustment for multiple comparisons.
Intraclass correlation coefficient (ICC) is the most appropriate method for reliability analysis of continuous data (Bartko, 1991) and was selected to assess stability in all test conditions (‘Control’ vs. ‘Retest’, ‘Control’ vs. ‘Lens’, ‘Control’ vs. ‘NonDom’). We selected an absolute agreement definition (type A) (Field, 2013). Pearson productmoment correlation coefficient (Pearson’s r) will normally be higher that ICC because Pearson’s r does not account for within-subject variance, or systematic differences across conditions (Ettinger et al., 2003). We calculated both ICC and Pearson’s r to assess differences between the two and to allow for comparisons with previous studies that have used Pearson’s r (for example (Klein & Berg, 2001)).
Results
None of the participants had a refractive error above 0.75 DS hypermetropia or myopia, or an astigmatism above 0.50 DC. All participants had visual acuity at the test distance of 0.0 logMAR or better. Accommodation amplitude, accommodation facility and relative accommodation were within expected values (According to established clinical criteria (Scheiman & Wick, 2002)), as well as fusional reserves, heterophorias and vergence facility. None of the participants had any decompensation of heterophorias or any history of patching or visual training. Neither did any of them have problems with reading. All participants had the same dominant eye at distance (6 m) and near (40 cm), which was the right eye for seven (57,3%) and the left eye for five (41,7%). Retest was performed on average 21 days after the first testing, range 1-49.
Saccade latency
1086 trials were analyzed, 66 (5.7%) were excluded (first trials or blinks). The mean (± standard deviation) number of included trials per condition was 23 (±1), range 17-23. Mean saccade latency and standard deviation were calculated for each subject and each condition (Figure 1). The variability within subjects across conditions were 2.4% on average, ranging from 1.3%-3.5%. Saccade latency had normal distribution in all conditions (‘Control’: D(12)=0.153, p=.200; ‘Retest’: D(12)=0.155, p=.200, ‘NonDom’: D(12)=0.176, p=.200), ‘Lens’: D(12)=0.189, p=.200).
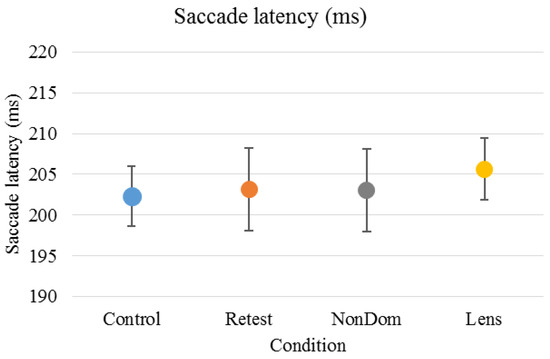
Figure 1.
Mean (±standard deviation) saccade latency was 202 (±12) ms for the ‘Control’ condition, 203 (±17) ms for the ‘Retest’ condition, 203 (±17) ms for the ‘NonDom’ condition and 206 (±13) ms for the ‘Lens’ condition. Error bars represent the standard errors.
Saccade latency had high internal consistency in the ‘Retest’, ‘NonDom’ and ‘Lens’ conditions, Cronbach’s α were .957, .864 and .855, respectively. The ‘Control’ condition had moderate internal consistency, Cronbach’s α were .694. There were no significant differences between test conditions (repeated measure ANOVA). For reliability and repeatability across conditions, see Table 1.

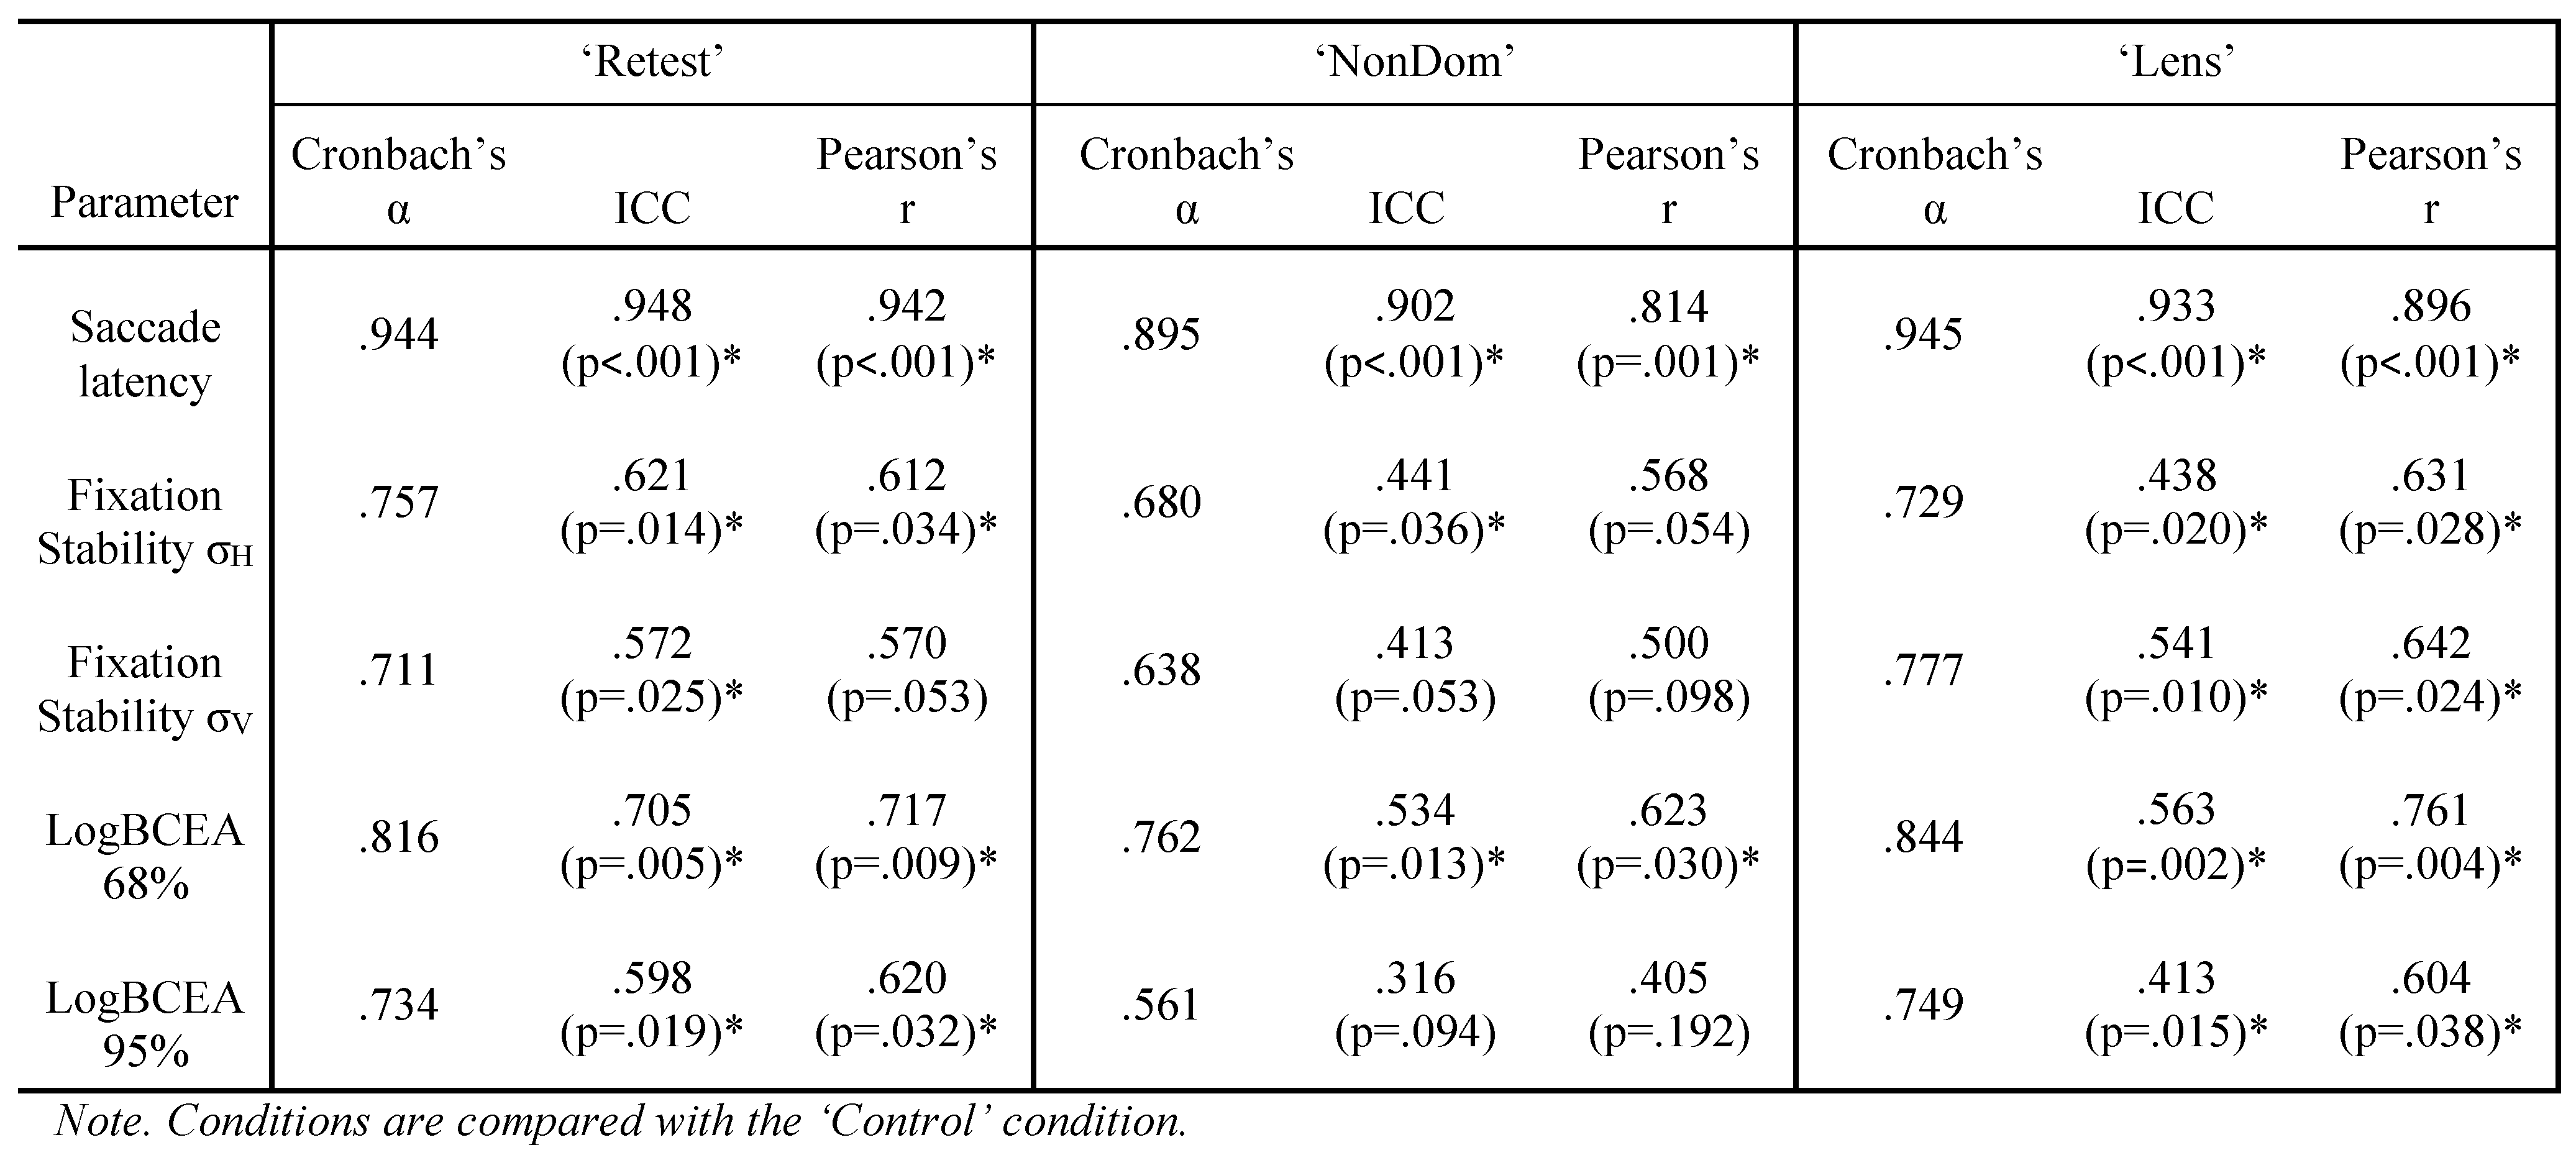
Table 1.
Cronbach’s α, Intraclass Correlation Coefficient and Pearson’s r for eye movement parameters across conditions. * indicates p<.05.
Fixation Stability
667 trials were analyzed, 101 (13.5%) were excluded (first trials or blinks). The mean (± standard deviation) number of included trials per condition was 14 (±2), range 7-16.
Standard deviation of eye position. Mean horizontal (σH) and mean vertical (σV) standard deviation, measured in arcminutes from mean eye position, were calculated for each subject and each condition (Figure 2). For σH, the variability within subjects were 10.6% on average, ranging from 3.5%-23.4%. For σV, the variability within subjects were 13.4% on average, ranging from 5.1%-26.8%.
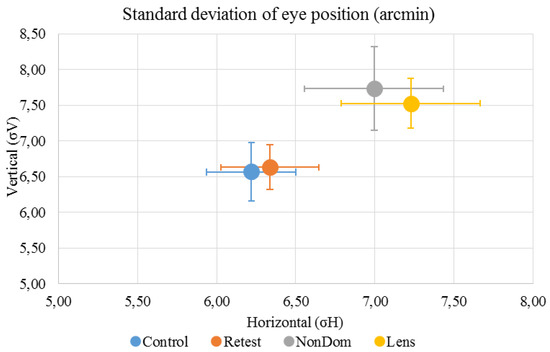
Figure 2.
Mean (±standard deviation) horizontal standard deviation (σH ) was 6.22 (±1.04) arcmin for the ‘Control’ condition, 6.34 (±1.03) arcmin for the ‘Retest’ condition, 7.00 (±1.46) arcmin for the ‘NonDom’ condition and 7.23 (±1.46) arcmin for the ‘Lens’ condition. Mean (±standard deviation) vertical standard deviation (σV) was 6.57 (±1.40) arcmin for the ‘Control’ condition, 6.63 (±1.05) arcmin for the ‘Retest’ condition, 7.73 (±1.95) arcmin for the ‘NonDom’ condition and 7.53 (±1.17) arcmin for the ‘Lens’ condition. Error bars represent the standard errors.
σH had normal distribution in all conditions (‘Control’: D(12)=0.167, p=.200; ‘Retest’: D(12)=0.226, p=.092, ‘NonDom’: D(12)=0.118 p=.200, ‘Lens’: D(12)=0.133, p=.200). σV had normal distribution in all conditions except the ‘NonDom’ condition (‘Control’: D(12)=0.157, p=.200, ‘Retest’: D(12)=0.149, p=.200, ‘NonDom’: D(12)=0.284 p=.008, ‘Lens’: D(12)=0.207, p=.165).
σH had moderate internal consistency in the ‘Retest’, ‘NonDom’ and ‘Lens’ conditions, Cronbach’s α were .646, .781 and .562, respectively. The ‘Control’ condition had low internal consistency, Cronbach’s α were .453. There were no significant differences between test conditions. σV had moderate internal consistency in the ‘Control’ and the ‘Retest’ condition, Cronbach’s α were .603 and .577, respectively. The ‘NonDom’ had low internal consistency, Cronbach’s α were .353. The ‘Lens’ condition had negative internal consistency, Cronbach’s α were -.807. A negative Cronbach’s α can be due to too few participants in the sample, or very poor internal consistency (Field, 2013). σV was just significantly different between test conditions (repeated measure ANOVA V=0.562, F3,9 = 3.847, p=.050). Paired t-test showed that the ‘Lens’ condition were significantly different from the ‘Control’ Condition (p=.024). For reliability and repeatability, see table 1.
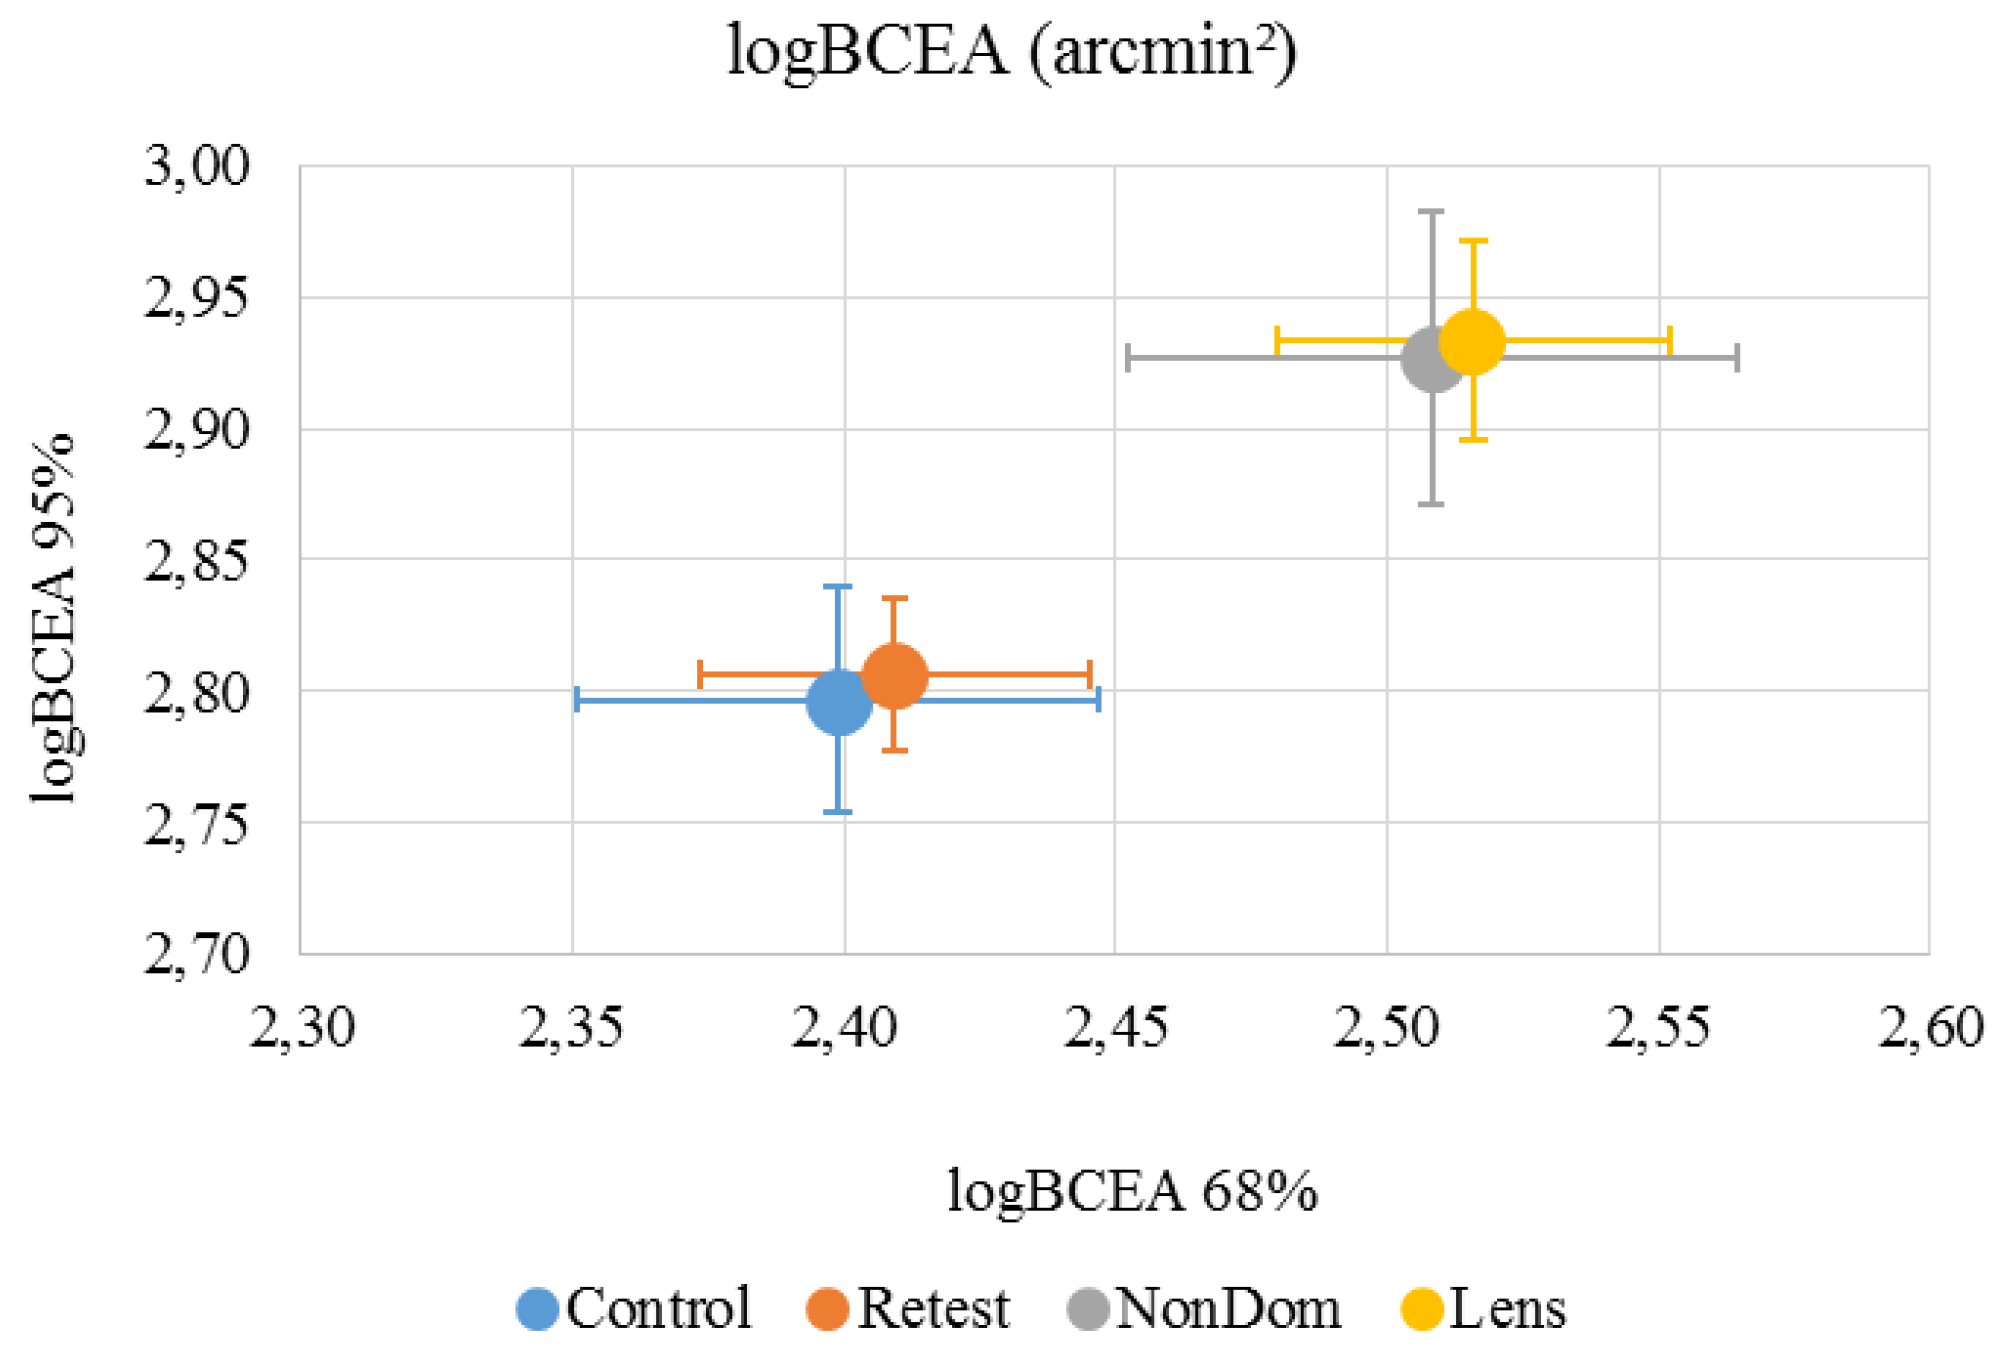
LogBCEA. Mean logBCEA and standard deviation for 68% and 95% of eye positions, measured in arcmin² were calculated for each subject and each condition (Figure 3).
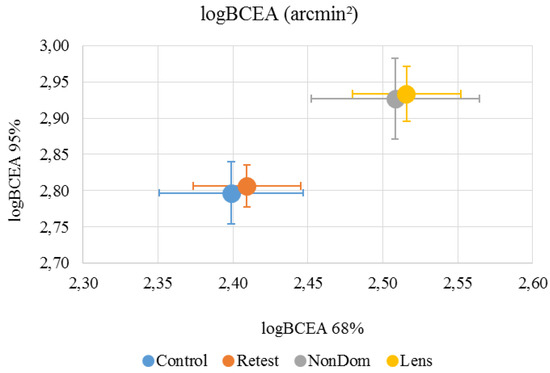
Figure 3.
Mean (±standard deviation) logBCEA 68% was 2.40 (±0.16) arcmin² for the ‘Control’ condition, 2.41 (±0.12) arcmin² for the ‘Retest’ condition, 2.51 (±0.19) arcmin² for the ‘NonDom’ condition and 2.52 (±0.12) arcmin² for the ‘Lens’ condition. Mean (±standard deviation) logBCEA 95% was 2.80 (±0.14) arcmin² for the ‘Control’ condition, 2.81 (±0.10) arcmin² for the ‘Retest’ condition, 2.93 (±0.19) arcmin² for the ‘NonDom’ condition and 2.93 (±0.13) arcmin² for the ‘Lens’ condition. Error bars represent the standard errors.
The variability within subjects were 3.4% on average, ranging from 1.0%-7.3%. LogBCEA 68% had high internal consistency in the ‘Control’, ‘Retest’ and ‘NonDom’ conditions, Cronbach’s α were .752, .872 and .792, respectively. The ‘Lens’ condition had low consistency, Cronbach’s α were .293. LogBCEA 95% had high internal consistency in the ‘Control’, ‘Retest’ and ‘NonDom’ conditions, Cronbach’s α were .702, .872 and .792, respectively. The ‘Lens’ condition had low consistency, Cronbach’s α were .341. For reliability and repeatability, see table 1.
LogBCEA 68% was significantly different between test conditions (repeated measure ANOVA, V=0.606, F3,9 = 4.618, p=.032). Paired t-test showed that both the “NonDom” condition and the ‘Lens’ condition were significantly different from the ‘Control’ Condition (p=.035 and p=.003, respectively). LogBCEA 95% was also significantly different between test conditions (repeated measure ANOVA, V=0.634, F3,9 = 5.198, p=.023). Paired t-test showed that both the “NonDom” condition and the ‘Lens’ condition were significantly different from the ‘Control’ Condition (p=.037 and p=.003, respectively). To make sure that the observed differences between dominant and non-dominant eye were not due to asymmetries in the setup, we compared logBCEA 68% and 95% between right eye and left eye. Mean (± standard deviation) logBCEA 68% was 2.44 (±0.18) arcmin² for the right eye, and 2.44 (±0.12) arcmin² for the left eye. Mean (± standard deviation) logBCEA 95% was 2.86 (±0.18) arcmin² for the right eye, and 2.86 (±0.12) arcmin² for the left eye. There were no significant differences between the eyes.
Discussion
Interpreting the results
Internal consistency. The results show moderate to high internal consistency (Cronbach’s α) for saccade latency in all conditions. This indicates that the number of trials (24) in this experiment are sufficient to report reliable values. Wöstmann and colleagues used 60 trials, and found that reliability for standard deviation of saccade latency and saccadic gain increased with increasing trial numbers (Wöstmann et al., 2013). They concluded that 60 trials are optimal, although no significant change between 75% and 100% of trials was observed (Wöstmann et al., 2013). In our opinion, this indicates that 45 trials is enough, and our study indicates that fewer trials may be sufficient for reliable saccade latency measures. Kloke and Jaschinski reported that about 20 trials were enough to observe individual differences in the asymmetry of binocular saccades (Kloke & Jaschinski, 2006). We suggest at least 24 trials as a reliable number of trials when saccade latency is the parameter of interest.
For fixation stability measured with logBCEA, internal consistency was high in the ‘Control’, ‘Retest’ and ‘NonDom’ condition. This indicates that the number of trials (16) in these experiments are sufficient to report reliable values.
For fixation stability measured with standard deviation of eye position, internal consistency was variable, for the ‘Retest’ condition it was moderate with both σH and σV, whereas for the other conditions, consistency was low for one of the two meridians. Internal consistency was also low in the ‘Lens’ condition, measured with logBCEA. This indicates that values from these trials are not highly reliable.
Repeatability. Both ICC and Pearson’s correlation between ‘Control’ and ‘Retest’ are high for saccade latency and fixation stability with logBCEA 68%, this means that these are stable measures in healthy adults which are not influenced by a test interval up to 49 days. Fixation stability measured with logBCEA 95% and standard deviation of eye position, have moderate ICC and Pearson’s correlations.
Ocular dominance. ICC and Pearson’s correlation between ‘Control’ and ‘NonDom’ are high for saccade latency, and low to moderate for fixation stability regardless of reporting method.
Contact lens wear. ICC and Pearson’s correlation between ‘Control’ and ‘NonDom’ are high for saccade latency, and low to moderate for fixation stability regardless of reporting method.
Saccade latency
Our results show that saccade latency is a reliable and repeatable measure in healthy adults, and this supports current thinking about latency being ‘trait’-like in nature. One large study on test-retest reliability for saccade measures found slightly poorer correlations compared to this study (Pearson’s r = 0.74 vs. 0.94), but their sample included participants from 6 to 88 years old (Klein & Fischer, 2005). This may suggest, as the authors discuss, that age can influence saccade latency reliability.
Previous research has discovered small horizontal saccade latency asymmetries (1.0-1.4 ms) without reporting ocular dominance (Collewijn, 2001; Kloke & Jaschinski, 2006). Kloke and Jaschinski concluded that asymmetry between eyes varies between individuals but has good reliability (Kloke & Jaschinski, 2006). Our study did not detect any difference in saccade latency related to ocular dominance, and this supports previous findings of small binocular asymmetries. The finding may be explained by the knowledge that afferent signals from the eye is projected to both hemispheres in the brain, and efferent signals to the extraocular muscles originates in both hemispheres of the brain (for a review on ocular dominance, see (Mapp et al., 2003). Thus, there is no evidence that the two eyes have different cortical representation. Nevertheless, there are previous research that has found a difference in processing speed between the two eyes (Coren & Porac, 1982; Moiseeva et al., 2000). The studies from Moiseeva and colleagues found latency asymmetry of 17-37 ms, but failed to find a consistent relation to ocular dominance. They used a sighting test (the Rosenbach test) to identify the dominant eye (Moiseeva et al., 2000). Sighting tests and sensory tests for ocular dominance agree in about 50% of individuals, and do not always correlate (Johansson, Seimyr, & Pansell, 2015; Lopes-Ferreira et al., 2013). There is agreement that individual differences can be substantial, and that some individuals have more prominent ocular dominance than others (Zeri et al., 2011). It has been found that in binocular viewing conditions, many subjects do not show a pronounced eye dominance (Johansson et al., 2015). In our study, all participants showed presumably stable ocular dominance (they had same eye preference for distance and near), they had equal visual acuity and no binocular vision problems. This may explain why we did not find any latency differences, assuming that latency differences are due to a prominent ocular dominance. Niechwiej-Szwedo and colleagues found that subjects with amblyopia show increased saccadic latency compared to control subjects (Niechwiej-Szwedo, Chandrakumar, Goltz, & Wong, 2012, Niechwiej-Szwedo, Kennedy, et al., 2012). Further exploration of saccade latency differences should include participants with both stable and unstable dominance, preferably tested with more than one sensory test (Johansson et al., 2015).
Fixation Stability
In 2013, Nystrom et al published a large scale-study on eye tracking data quality (Nystrom et al., 2013). They used binocular viewing while recording gaze positions from both eyes in 149 university students, and they found that accuracy was reduced with about 0.025 degrees (that is 1.5 arcmin) in the non-dominant eye. This is may indicate that the non-dominant eye may have poorer fixation stability, although, as they point out, the limitation of the interpretation is the calibration procedure, it may just be a reflection of the dominant eye being more reliable in realigning its gaze direction (calibration was done monocularly) (Nystrom et al., 2013). Ukwade and Bedell (1993) found in their study that standard deviation of horizontal eye position was 8.9 arcmin when healthy adults fixated a fixation cross for 10 seconds. They did not find any difference between the two eyes (although this was not the topic for their study). We found that standard deviation of horizontal eye position was 6.22 (±1.04) arcmin in the ‘Control’ condition and 7.00 (±1.46) arcmin in the ‘NonDom’ condition and although there was no significant difference between these, when using logBCEA, both 68% and 95% of eye position areas were significantly larger with the nondominant eye. This may reflect that the non-dominant eye has more unstable fixation that the dominant eye. The results have implications for recording of fixations in reading research. Unstable fixation leads to slower reading (Falkenberg, Rubin, & Bex, 2007) and there is a longstanding controversy regarding reading and ocular dominance (Stein et al., 2000), for a review see (Mapp et al., 2003). If accuracy is poorer when tracking a non-dominant eye as reported by Nystrom and colleagues (Nystrom et al., 2013), it could lead to misconception about fixations in a word – which letter is being fixated? To make clear scientific claims, we need to know the difference of monocular and binocular stability, preferably in relation to ocular dominance. Fixation stability in the non-dominant eye needs to be investigated further.
In the study from Nystrom et al (2013), the use of contact lenses also reduced accuracy, but it improved precision. This was expected, due to their standard procedure of defocusing the camera when a subject wore contact lenses. A larger corneal reflex will decrease accuracy, but increase precision in the same way as a large pupil will. We did not use the defocusing principle in recording with a contact lens and this may explain why fixation stability with a contact lens had poor internal consistency in our study. In our study, precision decreased with a contact lens, which polluted the other repeatability measures. If wearing of contact lenses produce monocular instability in studies, this may influence the results. Previous studies have found that small refractive errors do not significantly influence fixation stability (Ukwade & Bedell, 1993). For clinical studies, researchers should consider to record fixations with participants not wearing their contact lenses if refractive errors are small. Participants that needs to wear contact lenses for appropriate visual acuity should not be included in eye tracking studies when precision is a high demand.
Conclusion
This study shows that saccade latency is a robust measure in healthy adults with excellent test-retest repeatability and no asymmetry between the dominant and non-dominant eye with binocular viewing. Saccade latency was not significantly influenced by wearing a contact lens. About 24 trials is sufficient to yield good internal consistency. The results also show that fixation stability measured with logBCEA 68% is a reliable measure in healthy adults with excellent test-retest reliability. About 16 trials is sufficient to yield good internal consistency. For contact lens wearers, the number of trials should be increased. The dominant eye should be selected for recording in all studies with a high precision demand.
This study provides evidence that the calculation of logBCEA is the method of choice for fixation stability measurements, compared to standard deviation of eye position.
Further studies are needed to confirm that the results from this study can be transferred to other groups of participants. In particular, we will welcome studies on children and adults with poor binocular coordination.
References
- Amore, F. M., R. Fasciani, V. Silvestri, M. D. Crossland, C. de Waure, F. Cruciani, and et al. 2013. Relationship between fixation stability measured with MP-1 and reading performance. Ophthalmic and Physiological Optics 33, 5: 611–617. [Google Scholar]
- Bartko, J. J. 1991. Measurement and reliability: statistical thinking considerations. Schizophrenia Bulletin 17, 3: 483–489. [Google Scholar]
- Bednarek, D. B., A. Tarnowski, and A. Grabowska. 2006. Latencies of stimulus-driven eye movements are shorter in dyslexic subjects. Brain and Cognition 60, 1: 64–69. [Google Scholar]
- Biscaldi, M., B. Fischer, and F. Aiple. 1994. Saccadic eye movements of dyslexic and normal reading children. Perception 23, 1: 45–64. [Google Scholar]
- Biscaldi, M., B. Fischer, and K. Hartnegg. 2000. Voluntary saccadic control in dyslexia. Perception 29, 5: 509–521. [Google Scholar]
- Biscaldi, M., S. Gezeck, and V. Stuhr. 1998. Poor saccadic control correlates with dyslexia. Neuropsychologia 36, 11: 1189–1202. [Google Scholar]
- Blekher, T., M. R. Weaver, X. Cai, S. Hui, J. Marshall, J. G. Jackson, and et al. 2009. Test-retest reliability of saccadic measures in subjects at risk for Huntington disease. Investigative Ophthalmology & Visual Science 50, 12: 5707–5711. [Google Scholar]
- Blignaut, P., and T. Beelders. 2012. The Precision of Eye-Trackers: A Case for a New Measure. Paper presented at the ETRA 12: Proceedings of the Symposium on Eye Tracking Research and Applications, New York, NY, USA. [Google Scholar]
- Castet, E., and M. Crossland. 2012. Quantifying eye stability during a fixation task: a review of definitions and methods. Seeing Perceiving 25, 5: 449–469. [Google Scholar]
- Cesareo, M., D. Manca, E. Ciuffoletti, V. De Giovanni, F. Ricci, C. Nucci, and et al. 2014. Evaluation of fixation stability using different targets with the MP1 microperimeter. International Ophthalmology. [Google Scholar]
- Chen, F. K., P. J. Patel, W. Xing, M. D. Crossland, C. Bunce, G. S. Rubin, and et al. 2011. Intrasession repeatability of fixation stability assessment with the Nidek MP-1. Optometry and Vision Science 88, 6: 742–750. [Google Scholar]
- Collewijn, H. 2001. Interocular timing differences in the horizontal components of human saccades. Vision Research 41, 25-26: 3413–3423. [Google Scholar]
- Coren, S., and C. Porac. 1982. Monocular asymmetries in visual latency as a function of sighting dominance. American Journal of Optometry and Physiological Optics 59, 12: 987–990. [Google Scholar] [PubMed]
- Crossland, M. D., and G. S. Rubin. 2002. The use of an infrared eyetracker to measure fixation stability. Optometry and Vision Science 79, 11: 735–739. [Google Scholar] [PubMed]
- Ettinger, U., V. Kumari, T. J. Crawford, R. E. Davis, T. Sharma, and P. J. Corr. 2003. Reliability of smooth pursuit, fixation, and saccadic eye movements. Psychophysiology 40, 4: 620–628. [Google Scholar]
- Falkenberg, H. K., G. S. Rubin, and P. J. Bex. 2007. Acuity, crowding, reading and fixation stability. Vision Research 47, 1: 126–135. [Google Scholar] [PubMed]
- Field, A. 2013. Discovering statistics using IBM SPSS statistics, 4th ed. SAGE. [Google Scholar]
- Hendriks, A. W. 1996. Vergence eye movements during fixations in reading. Acta Psychologica 92, 2: 131–151. [Google Scholar]
- Holmqvist, K., M. Nyström, R. Andersson, R. Dewhurst, H. Jarodzka, and J. van de Weijer. 2011. Eye Tracking A Comprehensive Guide to Methods and Measures, 1 ed. New York: Oxford University Press. [Google Scholar]
- ISCAN, I. 2003. Operating Instructions Iscan ETL-300. Ito, M., Shimizu, K., Kawamorita, T., Ishikawa, H., Sunaga, K., & Komatsu, M. (2013). Association between ocular dominance and refractive asymmetry. Journal of Refractive Surgery 29, 10: 716–720. [Google Scholar]
- Johansson, J., G. O. Seimyr, and T. Pansell. 2015. Eye dominance in binocular viewing conditions. Journal of Vision 15, 9: 21. [Google Scholar]
- Klein, C., and P. Berg. 2001. Four-week test-retest stability of individual differences in the saccadic CNV, two saccadic task parameters, and selected neuropsychological tests. Psychophysiology 38, 4: 704–711. [Google Scholar]
- Klein, C., and B. Fischer. 2005. Instrumental and testretest reliability of saccadic measures. Biological Psychology 68, 3: 201–213. [Google Scholar]
- Kloke, W. B., and W. Jaschinski. 2006. Individual differences in the asymmetry of binocular saccades, analysed with mixed-effects models. Biological Psychology 73, 3: 220–226. [Google Scholar] [CrossRef] [PubMed]
- Lopes-Ferreira, D., H. Neves, A. Queiros, M. Faria-Ribeiro, S. C. Peixoto-de-Matos, and J. M. GonzalezMeijome. 2013. Ocular dominance and visual function testing. BioMed Research International 2013 (doi): 238943. [Google Scholar] [CrossRef]
- Mapp, A. P., H. Ono, and R. Barbeito. 2003. What does the dominant eye dominate? A brief and somewhat contentious review. Perception & Psychophysics 65, 2: 310–317. [Google Scholar]
- McDowell, J. E., K. A. Dyckman, B. P. Austin, and B. A. Clementz. 2008. Neurophysiology and neuroanatomy of reflexive and volitional saccades: evidence from studies of humans. Brain and Cognition 68, 3: 255–270. [Google Scholar] [CrossRef]
- Moiseeva, V. V., M. V. Slavutskaya, and V. V. Shul'govskii. 2000. The effects of visual stimulation of the dominant and non-dominant eyes on the latent period of saccades and the latency of the peak of rapid pre-saccade potentials. Neuroscience and Behavioral Physiology 30, 4: 379–382. [Google Scholar] [CrossRef] [PubMed]
- Momeni-Moghaddam, H., C. McAlinden, A. Azimi, M. Sobhani, and E. Skiadaresi. 2014. Comparing accommodative function between the dominant and non-dominant eye. Graefe's Archive for Clinical and Experimental Ophthalmology 252, 3: 509–514. [Google Scholar] [CrossRef] [PubMed]
- Morgan, P. B., N. Efron, M. Helland, M. Itoi, D. Jones, J. J. Nichols, and et al. 2010. Demographics of international contact lens prescribing. Contact Lens & Anterior Eye 33, 1: 27–29. [Google Scholar]
- Niechwiej-Szwedo, E., M. Chandrakumar, H. C. Goltz, and A. M. Wong. 2012. Effects of strabismic amblyopia and strabismus without amblyopia on visuomotor behavior, I: saccadic eye movements. Investigative Ophthalmology & Visual Science 53, 12: 7458–7468. [Google Scholar]
- Niechwiej-Szwedo, E., S. A. Kennedy, L. Colpa, M. Chandrakumar, H. C. Goltz, and A. M. Wong. 2012. Effects of induced monocular blur versus anisometropic amblyopia on saccades, reaching, and eye-hand coordination. Investigative Ophthalmology & Visual Science 53, 8: 4354–4362. [Google Scholar]
- Nystrom, M., R. Andersson, K. Holmqvist, and J. van de Weijer. 2013. The influence of calibration method and eye physiology on eyetracking data quality. Behavioral Research Methods 45, 1: 272–288. [Google Scholar] [CrossRef]
- Peterson, R. C., J. S. Wolffsohn, J. Nick, L. Winterton, and J. Lally. 2006. Clinical performance of daily disposable soft contact lenses using sustained release technology. Contact Lens & Anterior Eye 29, 3: 127–134. [Google Scholar]
- Reingold, E. M. 2014. Eye tracking research and technology: Towards objective measurement of data quality. Visual Cognition 22, 3: 635–652. [Google Scholar]
- Rice, M. L., D. A. Leske, C. E. Smestad, and J. M. Holmes. 2008. Results of ocular dominance testing depend on assessment method. Journal of American Association for Pediatric Ophthalmology and Strabismus 12, 4: 365–369. [Google Scholar] [PubMed]
- Rommelse, N. N., S. Van der Stigchel, and J. A. Sergeant. 2008. A review on eye movement studies in childhood and adolescent psychiatry. Brain and Cognition 68, 3: 391–414. [Google Scholar] [PubMed]
- Scheiman, M., and B. Wick. 2002. Clinical Management of Binocular Vision: Heterophoric, Accommodative, and Eye Movement Disorders, 2nd ed. Philadelphia ed.): Lippincott Williams & Wilkins. [Google Scholar]
- Smyrnis, N. 2008. Metric issues in the study of eye movements in psychiatry. Brain and Cognition 68, 3: 341–358. [Google Scholar] [CrossRef]
- Stein, J. F., A. J. Richardson, and M. S. Fowler. 2000. Monocular occlusion can improve binocular control and reading in dyslexics. Brain 123, Pt 1: 164–170. [Google Scholar]
- Stein, J. F., P. M. Riddell, and M. S. Fowler. 1987. Fine binocular control in dyslexic children. Eye 1(Pt 3), 433–438. [Google Scholar]
- Stein, J. F., P. M. Riddell, and S. Fowler. 1988. Disordered vergence control in dyslexic children. British Journal of Ophthalmology 72, 3: 162–166. [Google Scholar]
- Steinman, R. M. 1965. Effect of Target size, Luminance and Color on Monocular Fixation. Journal of the Optical Society of America 55, 9: 1158–1165. [Google Scholar] [CrossRef]
- Ukwade, M. T., and H. E. Bedell. 1993. Stability of oculomotor fixation as a function of target contrast and blur. Optometry and Vision Science 70, 2: 123–126. [Google Scholar]
- van der Geest, J. N., and M. A. Frens. 2002. Recording eye movements with video-oculography and scleral search coils: a direct comparison of two methods. Journal of Neuroscience Methods 114, 2: 185–195. [Google Scholar] [PubMed]
- Wade, N. J., and B. W. Tatler. 2011. Origins and applications of eye movement research. Edited by S. P. Liversedge, I. D. Gilchrist and S. Everling. In The Oxford Handbook of Eye Movements. Oxford: Oxford University Press, Vol. 1, pp. 17–45. [Google Scholar]
- Wilson, S. J., P. Glue, D. Ball, and D. J. Nutt. 1993. Saccadic eye movement parameters in normal subjects. Electroencephalography and Clinical Neurophysiology 86, 1: 69–74. [Google Scholar] [PubMed]
- WMA. 2013. WMA Declaration of Helsinki Ethical Principles for Medical Research Involving Human Subjects. http://www.wma.net/en/30publications/10policie. World Medical Association. [Google Scholar]
- Wöstmann, N. M., D. S. Aichert, A. Costa, K. Rubia, H. J. Moller, and U. Ettinger. 2013. Reliability and plasticity of response inhibition and interference control. Brain and Cognition 81, 1: 82–94. [Google Scholar]
- Yang, Q., and Z. Kapoula. 2003. Binocular coordination of saccades at far and at near in children and in adults. Journal of Vision 3, 8: 554–561. [Google Scholar] [PubMed]
- Zeri, F., M. De Luca, D. Spinelli, and P. Zoccolotti. 2011. Ocular dominance stability and reading skill: a controversial relationship. Optometry and Vision Science 88, 11: 1353–1362. [Google Scholar]
- Zhang, Y., J. Laurikkala, and M. Juhola. 2014. Biometric verification of a subject with eye movements, with special reference to temporal variability in saccades between a subject's measurements. International Journal of Biometrics 6, 1: 75–94. [Google Scholar]


Copyright © 2016. This article is licensed under a Creative Commons Attribution 4.0 International License.