1. Introduction
Intelligent window design has been used to address problems associated with the regulation of heating and glare within buildings by dynamically controlling the amount of incoming solar radiation. One way to achieve this is through the integration of a thermotropic layer into the window design. Thermotropic materials reversibly change their transmission behaviour based upon the amount of heat they are exposed to. For example, when a thermotropic hydrogel is exposed to temperatures below its designed threshold switching temperature/transition temperature (T
s), the two main components, water and polymer, are homogeneously mixed [
1,
2]. This is due to the hydrophillicity of the polymer structure and therefore results in a transparent material. Above the threshold switching temperature, the polymer behaves hydrophobically resulting in water being quenched out of the polymer network and resulting in phase separation. With sufficient disparity between the refractive indices of these two phases, diffusion of light occurs via scattering with a resultant ‘clouding’ of the system [
1,
2]. For glazing purposes, an optically transparent appearance is required and so below their T
s thermotropic materials need to allow for at least 85% light transmission [
3,
4].
The amount of solar radiation incident upon facades and rooftops in the UK has been estimated as around seven times greater than the amount of electricity used within these buildings [
5]. This abundance of utilisable solar energy is a great potential opportunity for integrating solar power harnessing technologies into current and future building design. Previously published research has been conducted into the use of photovoltaics (PV) for powering electrochromic materials in glazing, i.e., using an electric field (rather than heat) to influence optical properties [
6]. However, there has been little research undertaken on the reverse situation, i.e., using PV cells to harvest scattered solar radiation produced upon heating a thermotropic material above its T
s [
7]. This harvested solar energy could be converted into electricity via solar cells and used to power air conditioning or other electrical needs within a building. A variation of this idea has been to use luminescent solar collectors (LSC) for concentrating solar radiation onto PV cells situated at the edges of windows. However, despite increased research into LSC’s, their performance requires further optimisation, e.g., photostability of organic dye based concentrators over prolonged ultraviolet (UV) exposure periods or the relatively low luminescent quantum efficiency exhibited by Quantum dot based luminescent concentrators [
8,
9,
10].
Recently, an innovative design of a Concentrating PV (CPV) smart window system has been proposed to integrate renewable energy technologies and energy savings technologies into current window systems [
11,
12], as shown in
Figure 1. The CPV design involves optically coupling PV cells around the edges of a glazing unit with a thermotropic layer laminated within. Above a certain threshold temperature, the thermotropic layer is thermally activated to scatter light within the glazing unit directing a high proportion of this scattered light via total internal reflection toward the solar cells. Below the designed threshold temperature/transition temperature (T
s), the thermotropic material (e.g., polymer) is water-soluble and therefore the layer appears transparent as shown in
Figure 1b. Above the threshold T
s the water and polymer components separate and the thermotropic layer becomes translucent with a diffuse reflectivity, which is ascribed to the soluble-to-insoluble phase transition of the thermotropic material. The relatively high reflectivity induced by this thermotropic layer leads to scattering of the majority of incoming sunlight, which, when harvested by the integrated solar cells, results in the generation of renewably sourced electricity [
11,
12], as shown in
Figure 1a.
The system is “smart” by automatically responding to climatic conditions, thus balancing solar energy entering indoor space for passive lighting and heating in a cooling season and redirecting solar energy to the solar cells for electricity generation in a hot season, which in traditional design is controlled by blinds or shutters and therefore lost as heat to the outdoor environment. Consequently, the designed system has the potential to improve energy efficiency for buildings. To achieve solar energy conversion in such a “smart” window system, commercial solar cells can be employed to generate electricity via light reflected by the thermotropic layer when its temperature is above the T
s. Therefore, the major challenge to realise the “smart” window system is to obtain a thermotropic layer with the desired threshold T
s for any given climatic condition and with the appropriate transmittance/reflectance properties, both of which are highly dependent on the material composition. To be of practical application, the optimal threshold T
s would need to correlate with the balance temperature of the building (i.e., the temperature at which it switches from a need for heating to a need for cooling). An ideal thermotropic layer would therefore be required to have an adjustable T
s in the temperature range between 25 °C and 40 °C which would allow for its application in a variety of climatic conditions. For maximum efficiency of this system, it is essential that above the T
s the thermotropic layer mostly reflects light, rather than absorbing the solar radiation. This light scattering property of thermotropic materials has been widely demonstrated in their provision of passive overheating protection for solar absorbers [
13]. A final requirement for optimising the operation of this system is that the scattered light be within the wavelength range of 350–1100 nm so as to be compatible with the spectral response of the solar cells.
Hydroxypropyl cellulose (HPC) was chosen to test for its suitability for use as the thermotropic polymer for this CPV smart window system due to its clear advantages when considering environmental and safety concerns. Cellulose is a polysaccharide found within plant material and is therefore an abundant and sustainable organic polymer source with ~5 × 10
11 metric tons generated annually [
14]. Cellulose is therefore low cost, innocuous and biodegradable. HPC has previously been considered as a suitable biopolymer for thermotropic glazing both independently [
15,
16] and as part of an interpolymer complex [
17,
18,
19]. In addition, HPC is water-soluble due to the substitution of reactive hydroxyl groups on the cellulose structure with hydrophobic hydroxypropyl groups which results in weakened intermolecular hydrogen bonding within the cellulose [
20]. HPC chains are dissolved within water at temperatures below the T
s due to a sheath of tightly bound water molecules surrounding HPC chains via hydrogen bonding resulting in HPC chains being uncoiled and separated. When the temperature is increased, the solubility of HPC decreases due to the additional thermal energy disrupting the polymer-water hydrogen bonding. Concurrently, the structure shrinks until a high enough temperature is reached whereby the cellulose ether collapses on itself allowing for aggregation and precipitation of HPC chains out of solution and thereby reducing light transmittance [
21,
22].
Previous research on the T
s of HPC has mainly focused upon using concentrations of up to only 2 wt. % HPC; however, these studies did not systematically vary HPC concentration. Also, only transmittance of HPC has been measured with the reflectance property of HPC critical to the potential of electricity generation via integrated solar cells in a CPV smart window system being so far neglected [
15,
18,
19]. Another report by Nishio et al. [
23] studied the variation in HPC T
s with increased HPC concentration in increments of 10 wt. % HPC and showed that between 10 and 40 wt. % HPC there was very little, if any, change observed in T
s. A further knowledge gap that exists for aqueous HPC is in the potential observation of hysteresis of light transmittance when samples undergo heating and cooling cycles. Therefore, the research conducted in this paper will focus upon both transmittance and reflectance behaviour of aqueous HPC at systematically increased HPC concentrations between 1 and 6 wt. %. Furthermore, the knowledge gained from aqueous phase HPC will be used to develop a thermotropic hydrogel layer between two glass sheets to simulate the “truncated” version of the smart window (no integrated PV) to monitor transmittance and reflectance under varying environmental temperatures in order to demonstrate the potential applicability of HPC membranes for electricity generating ‘smart’ windows.
3. Results
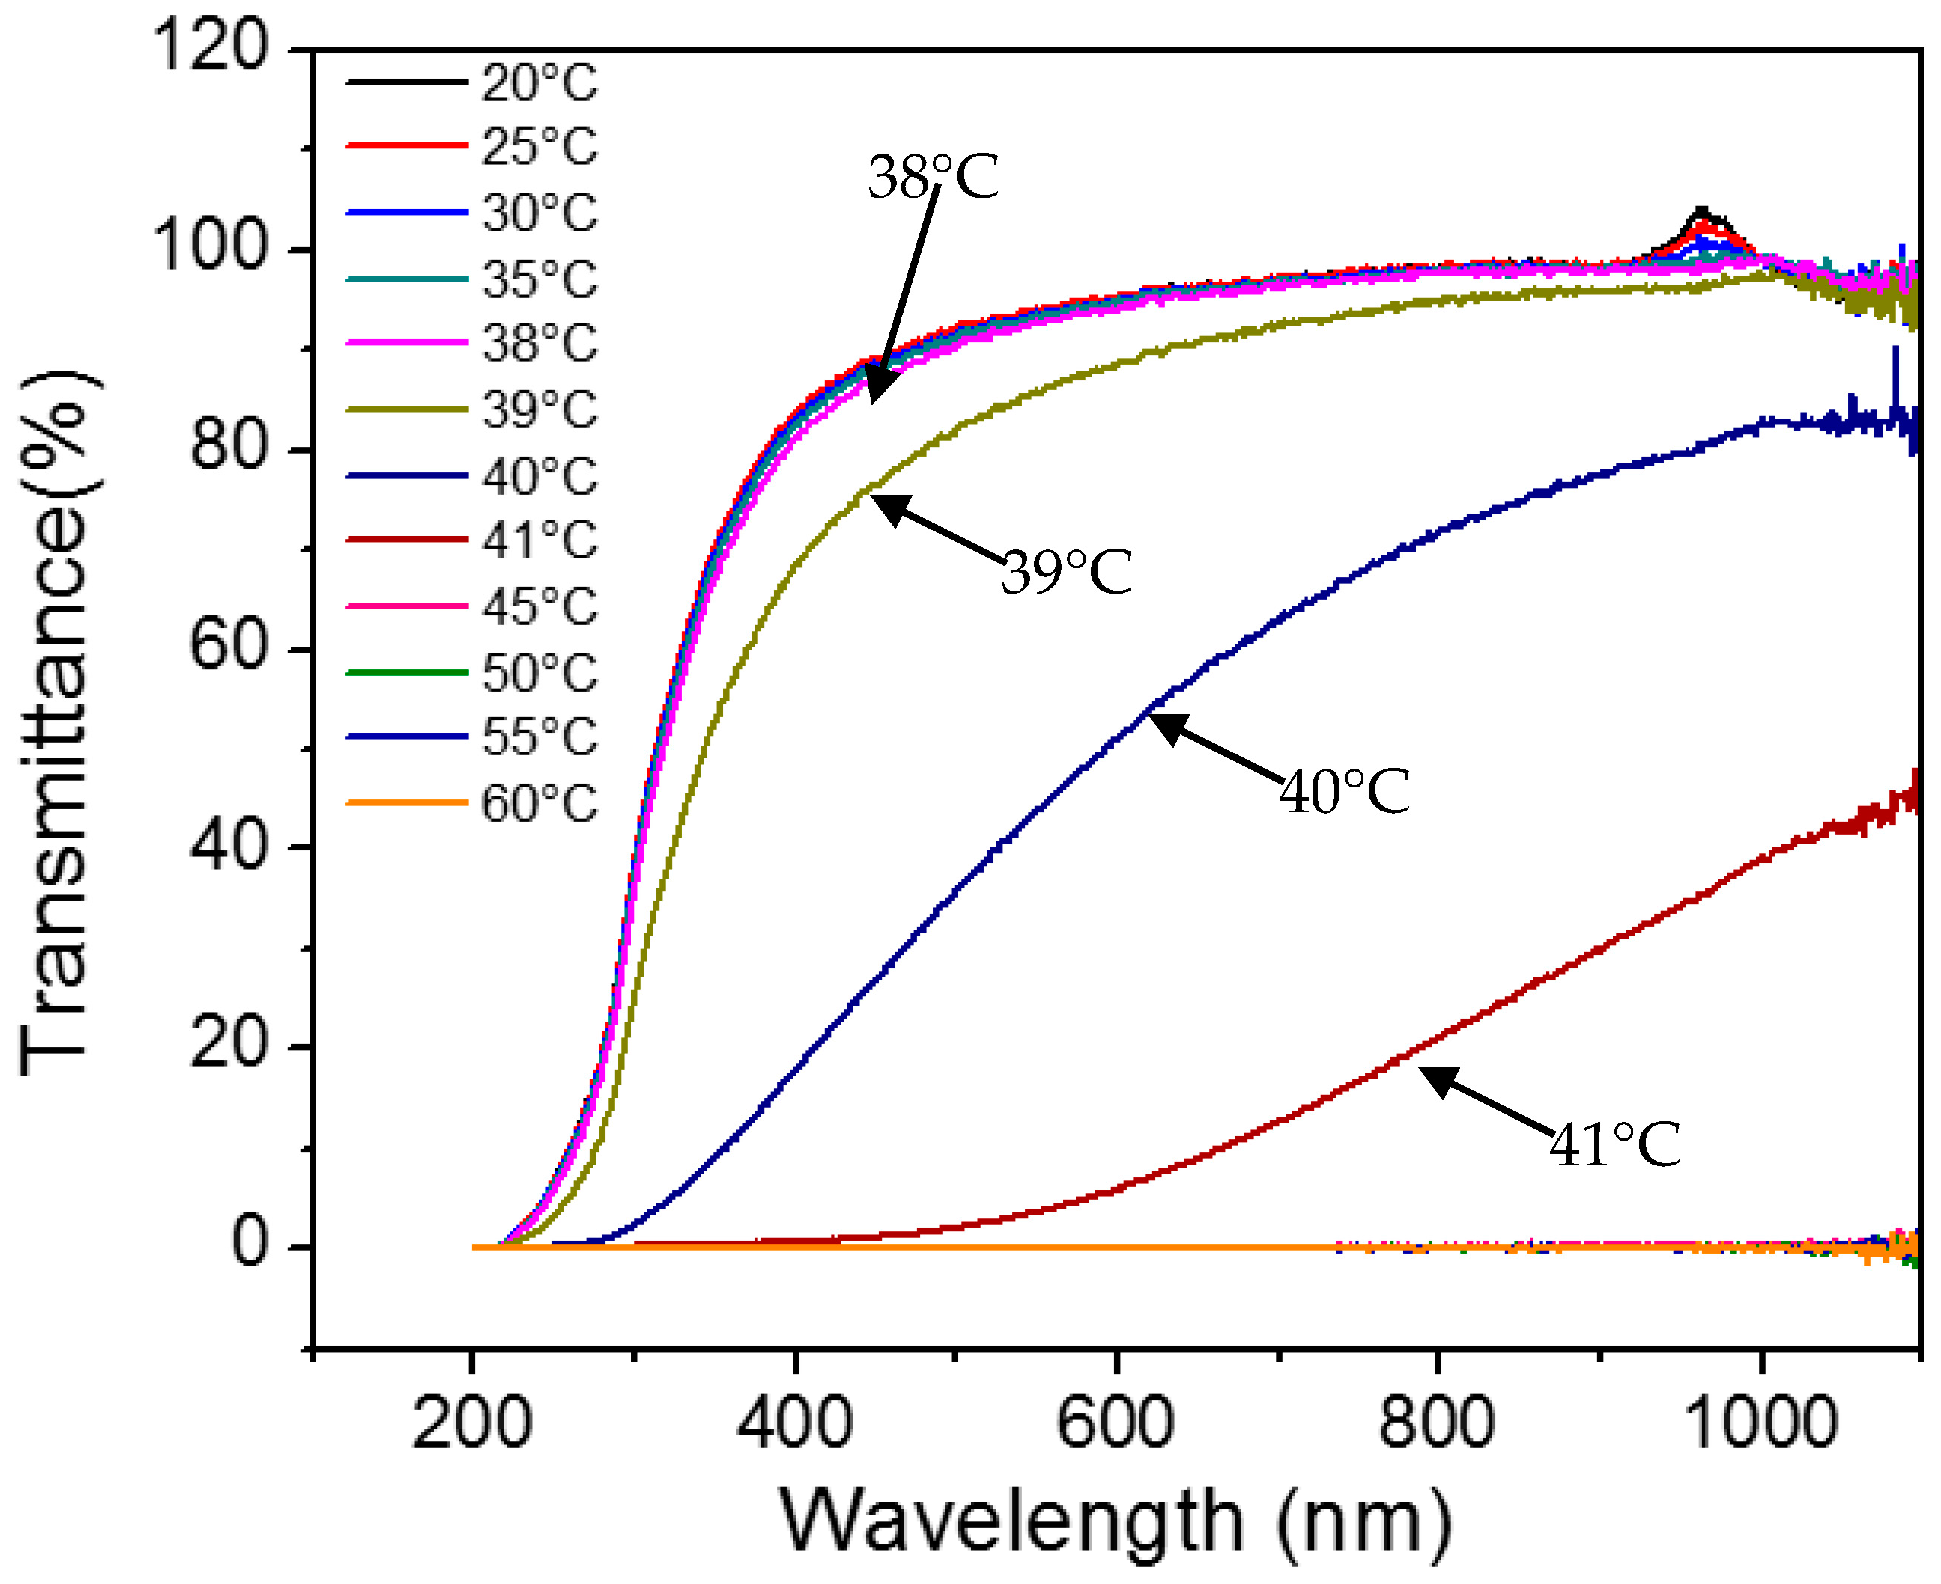
A typical UV-Vis transmittance spectrum with increased temperature for an aqueous solution of HPC is shown in
Figure 2 whereby most transmittance below the T
s occurs in the near infrared and visible light regions. From
Figure 2, it can be seen that transmittance decreases upon increasing the liquid temperature, being approximately 100% below 38 °C and near 0% when above 45 °C. There is no significant difference for the transmittance data from 20 °C to 38 °C.
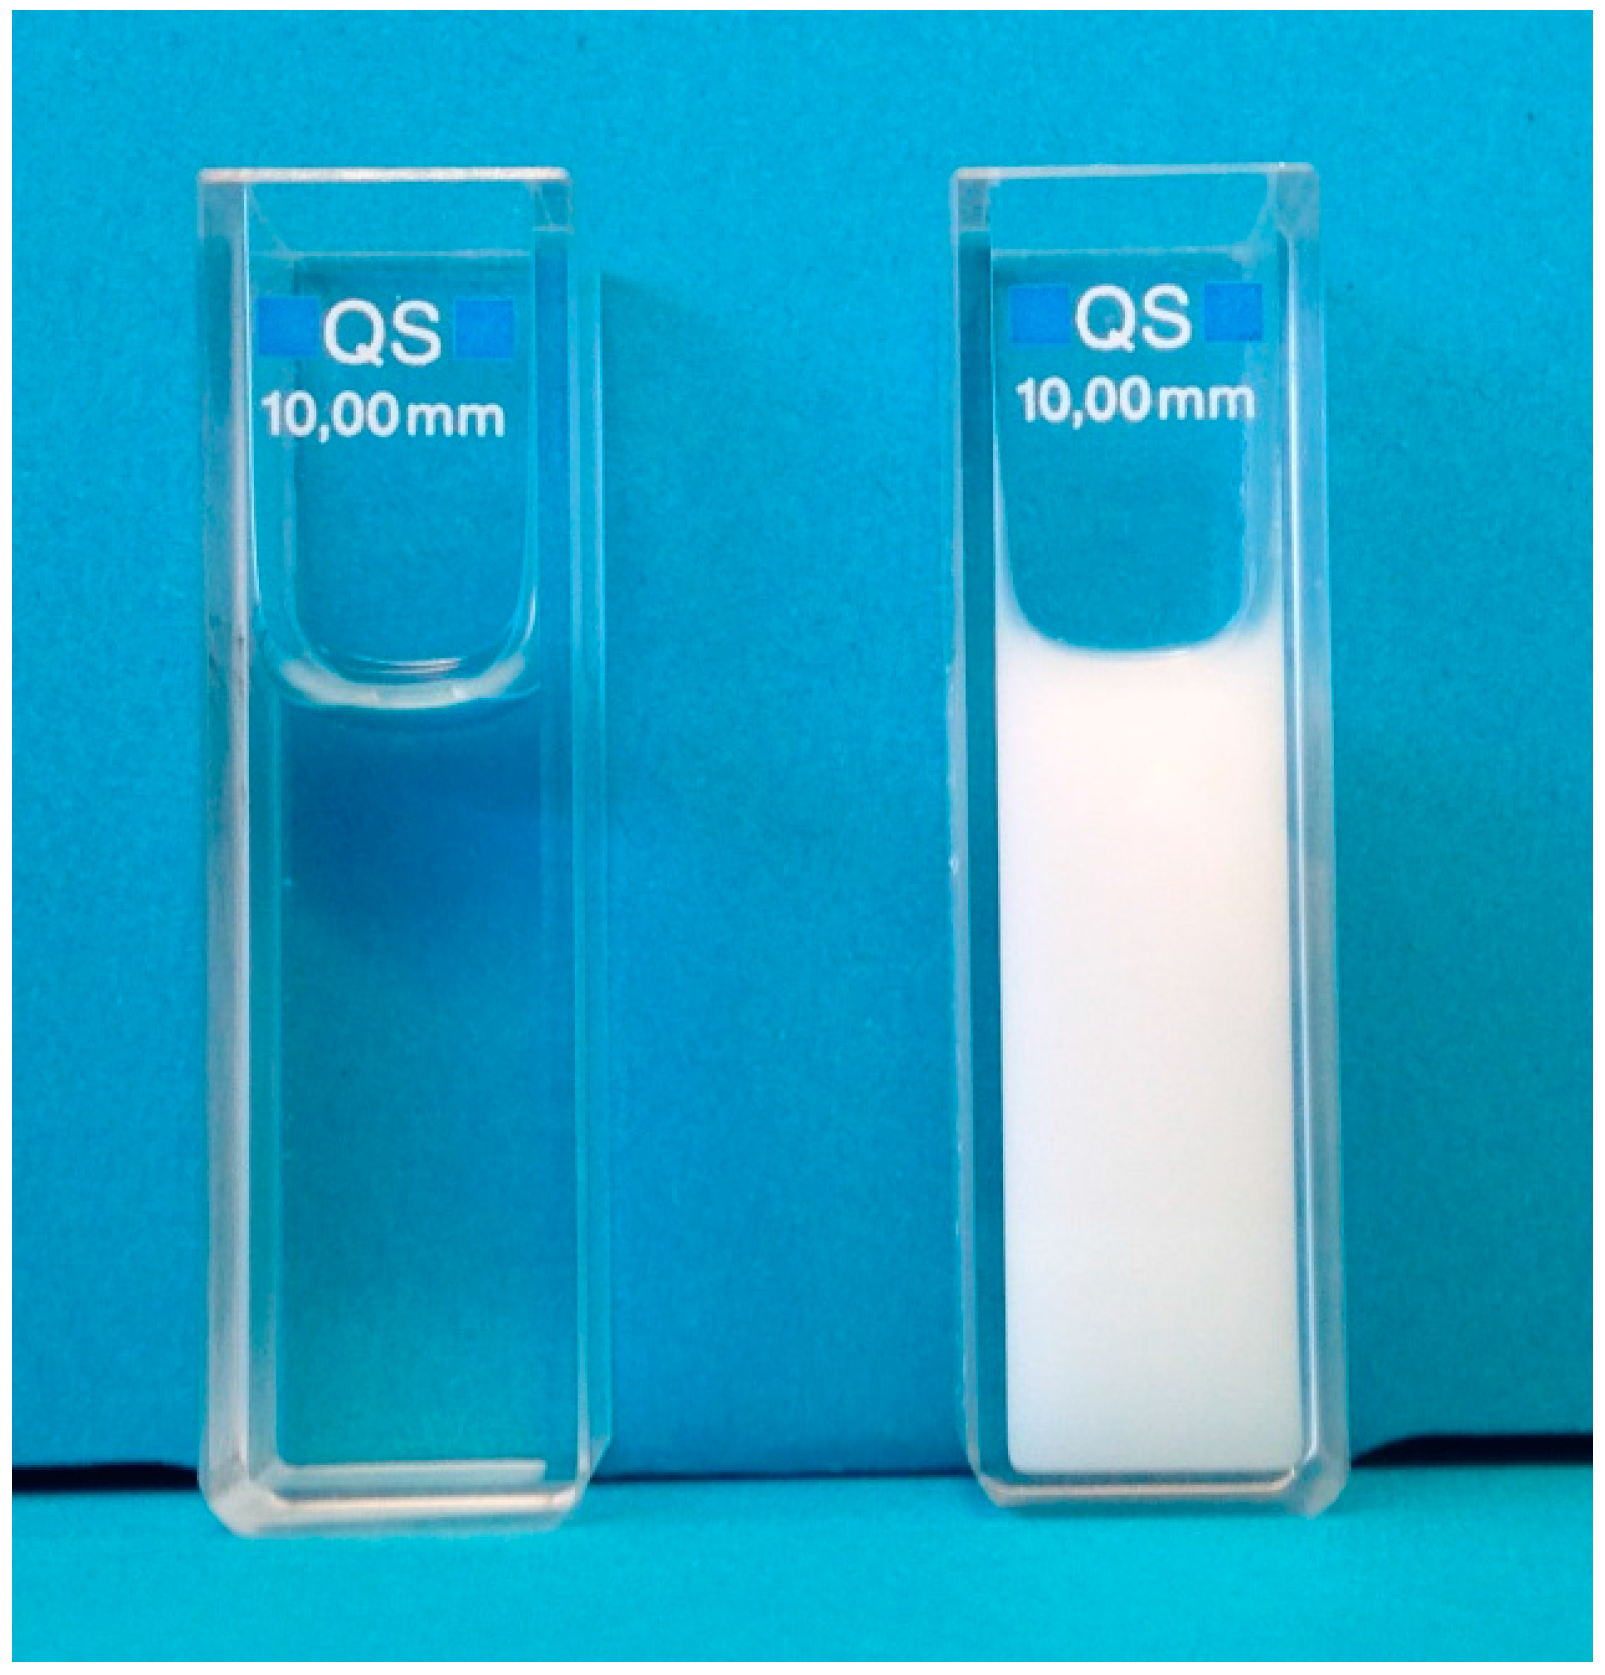
Figure 3 shows the visual change in transparency observed for a representative liquid HPC sample of 3 wt. % HPC both below and above the T
s. Below the T
s, water and HPC are homogeneously mixed due to the hydrophillicity of the polymer structure resulting in a transparent material. Above the T
s, the polymer behaves hydrophobically, resulting in water being quenched out of the polymer network resulting in phase separation and an opaque appearance.
The T
s of the HPC aqueous solutions was found to be dependent upon the concentration of HPC, the higher the wt. % of HPC the lower the T
s.
Figure 4 shows how varying the temperature between 20 °C and 70 °C affected the transmittance behaviour of each aqueous HPC sample as measured at 600 nm. The spectral response of the silicon solar cells to be used in the ‘smart’ window system is in the wavelength range of 400 nm to 1200 nm, additionally 600 nm is in the centre of the visible light range. For the consideration of electricity generation and also daylight application, the value of 600 nm was plotted for further discussion. The T
s, taken as 50% transmittance, was measured at 44 °C for 1 wt. % HPC and 40 °C for 6 wt. % HPC. A decrease in T
s with increased HPC concentration would be expected given that inter- and intrachain hydrophobicity drive the aggregation of HPC chains, therefore less thermal energy would be required to precipitate HPC out of solution at higher HPC concentrations. At 5 wt. % and higher concentrations of HPC, the T
s was observed to become static at 40 °C which may indicate that 5 wt. % HPC is a saturation point for the amount of hydrophobic interaction that can occur in any given aqueous HPC sample. Below the T
s there is only an observed 3% decrease in light transmittance when increasing HPC concentration from 1 wt. % (~98% transmittance) up to 6 wt. % HPC (~95% transmittance).
To calculate the average transmittance of visible light in the wavelength range 430 nm–780 nm and the average direct solar transmittance in the wavelength range 440 nm–950 nm, BSI Standards BS EN 410:2011 [
26] were applied as shown in Equations (1) and (2), respectively.
τv(λ) is the visible light transmittance.
Dλ is the relative spectral distribution of illuminant D65.
τ(λ) is the spectral transmittance of the glazing.
V(λ) is the spectral luminous efficiency for photopic vision defining the standard observer for photometry.
Δ(λ) is the wavelength interval.
τe(λ) is the solar direct transmittance.
Sλ is the relative spectral distribution of the solar radiation.
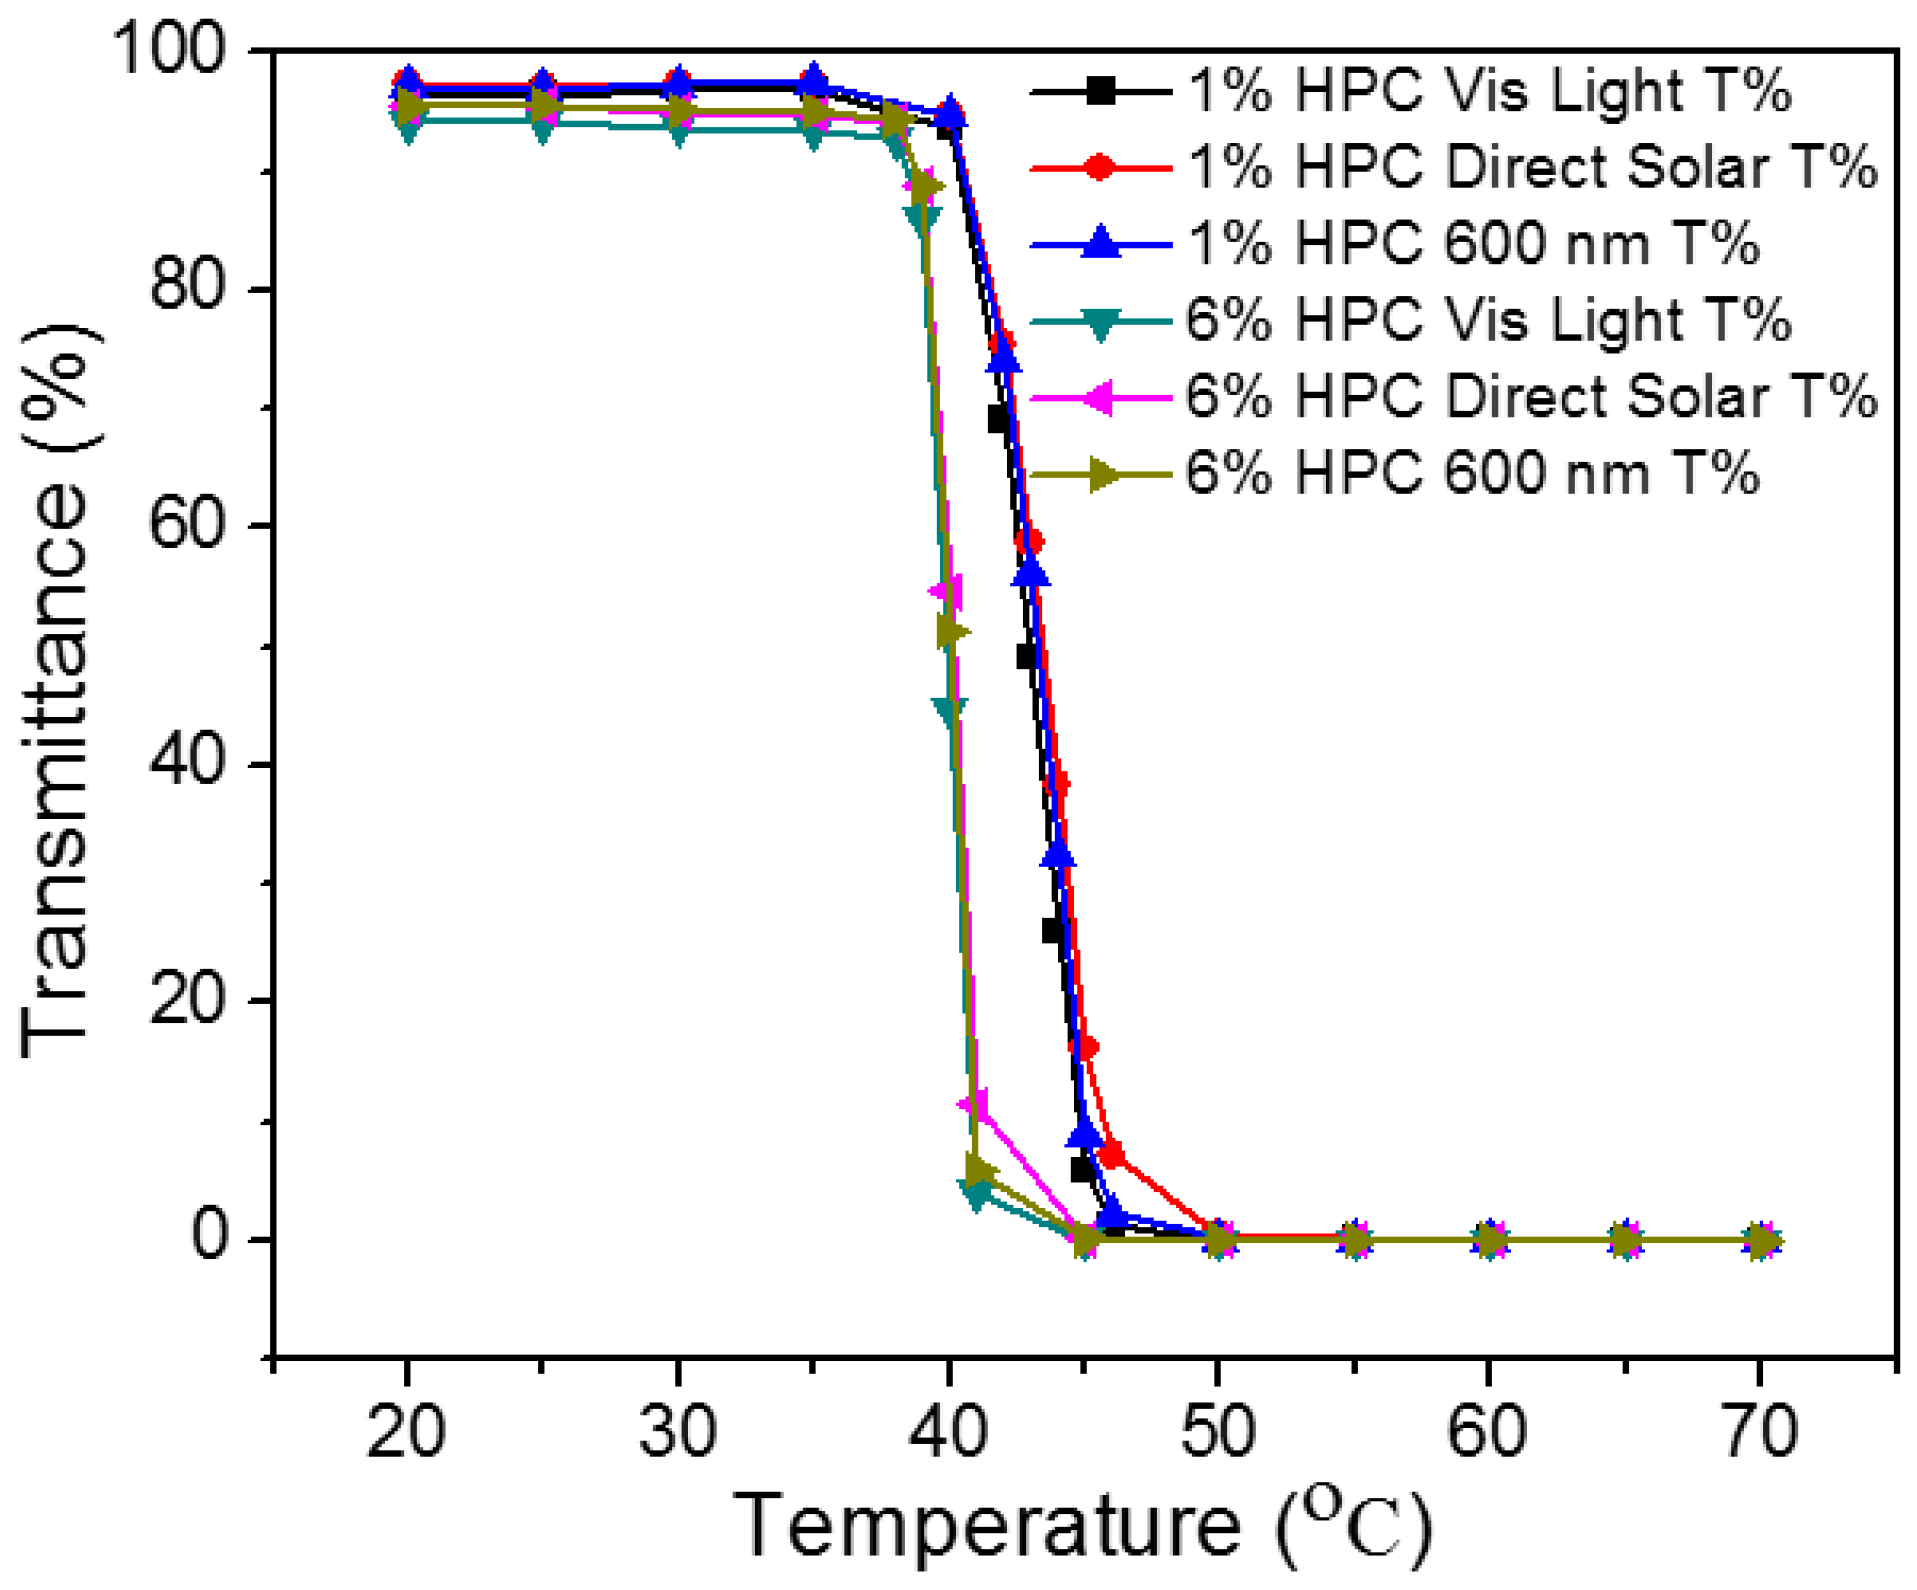
Figure 5 shows the averaged transmittance values calculated using Equation (1) (labelled as Vis Light T%) and Equation (2) (labelled as Direct Solar T%) for the 1 wt. % and 6 wt. % HPC samples. For a given sample, the similarity in transmittance values calculated at all stages of the heating process indicates that reliable transmittance data can be assumed from the 600 nm transmittance values that are recorded directly during experiments and so this is the data reported in the rest of this paper.
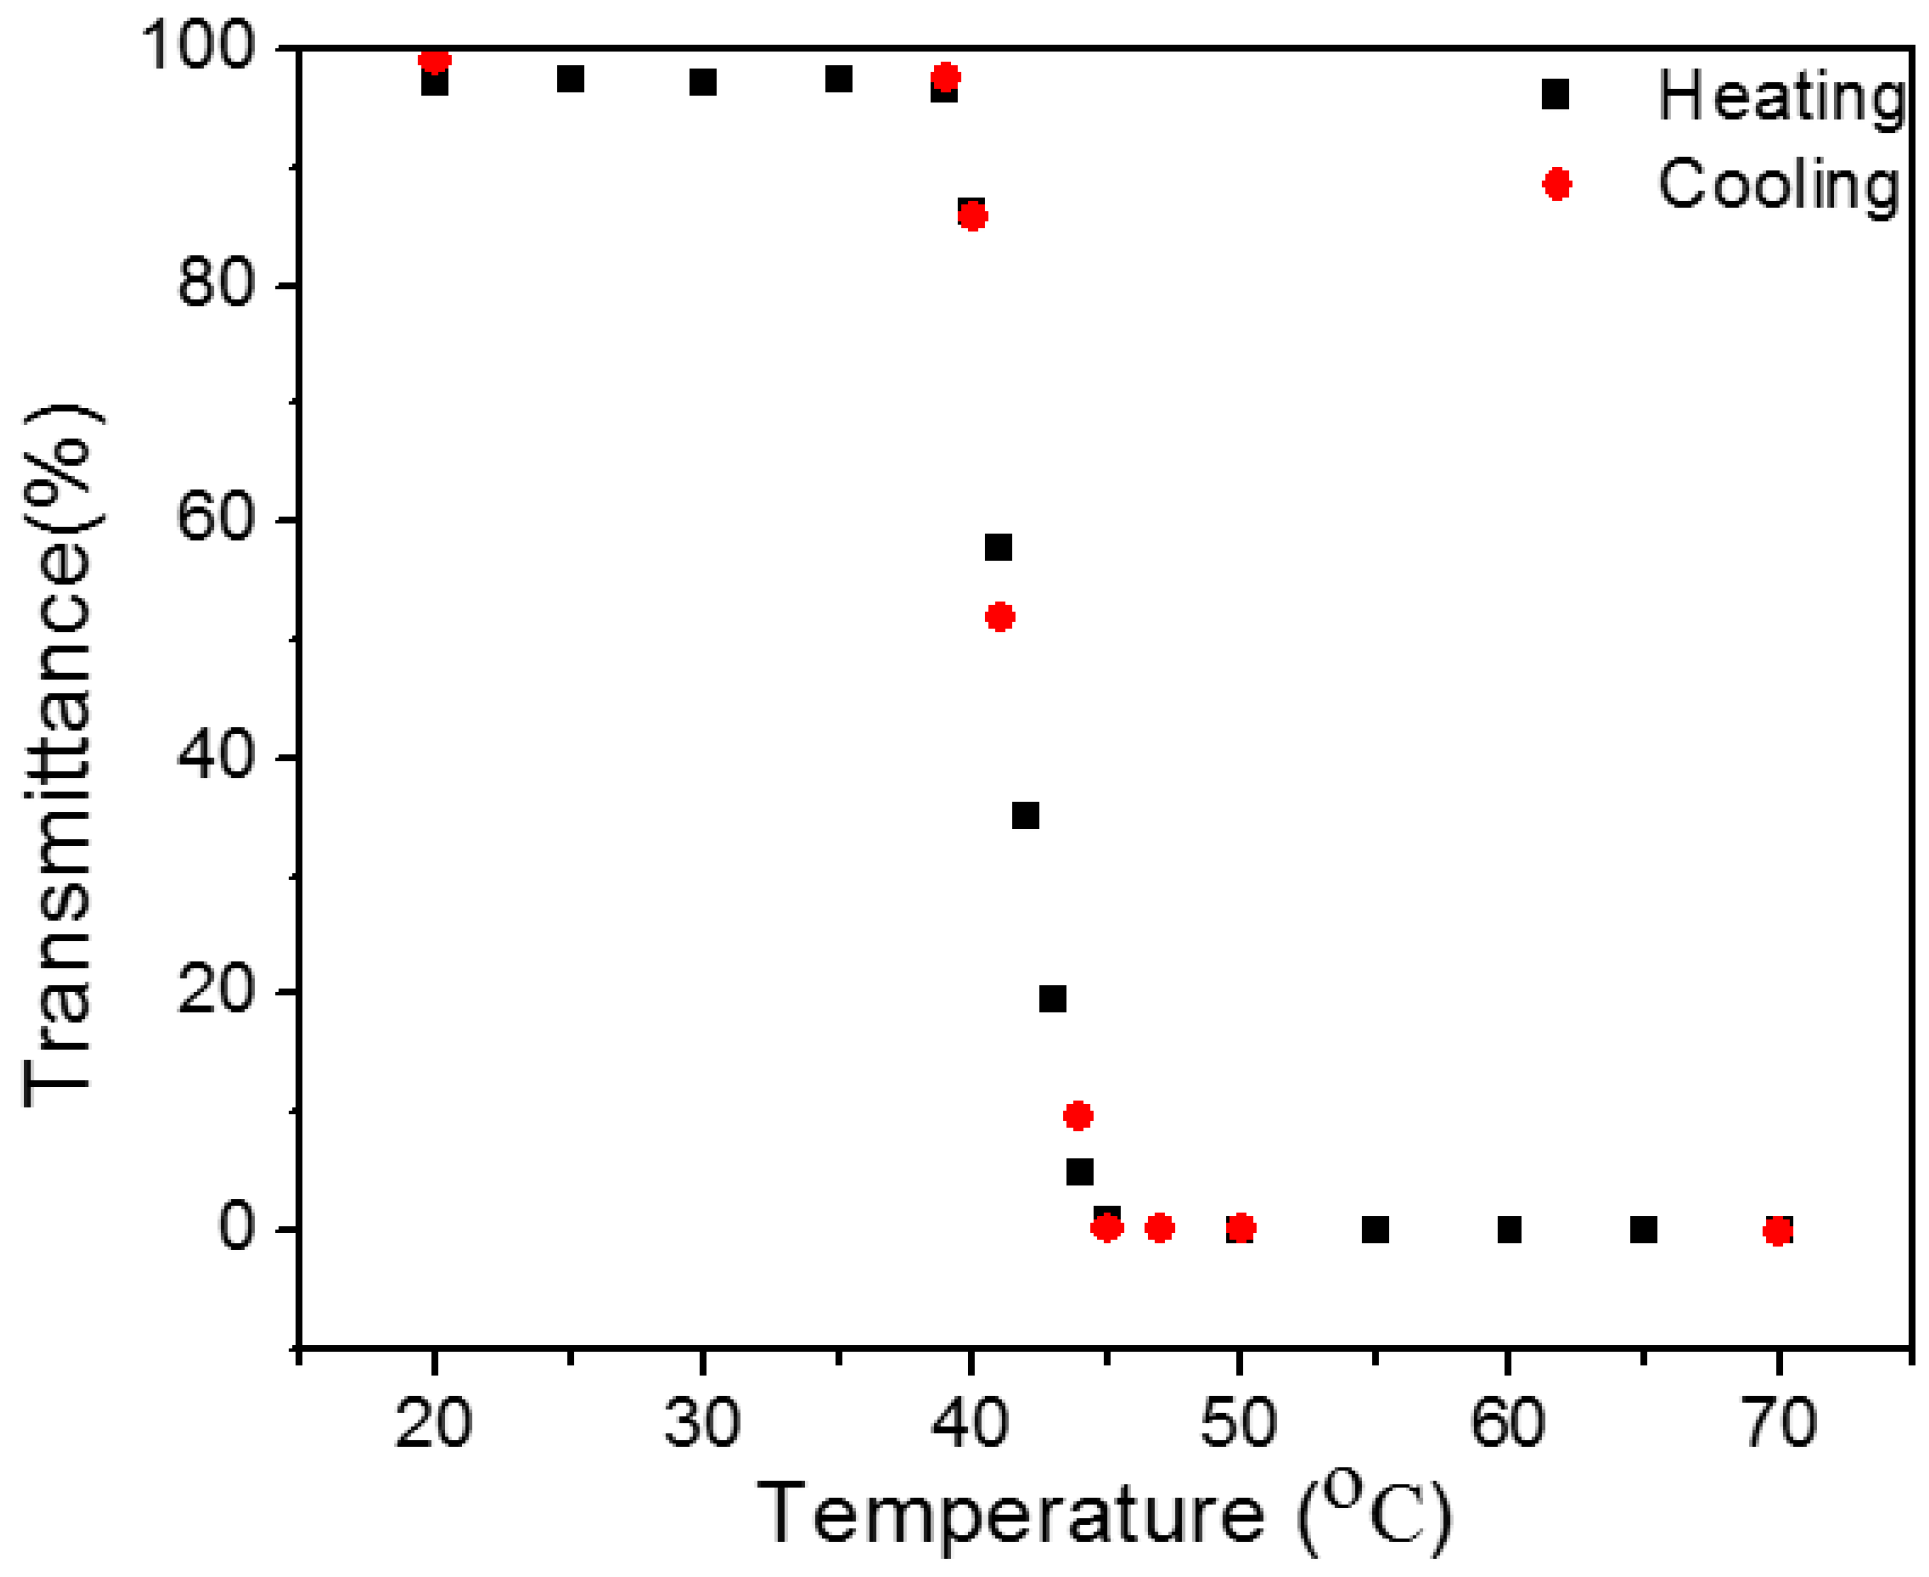
After heating aqueous HPC samples up to 70 °C, samples were incrementally cooled back down to room temperature with measurements taken after 20 min equilibration periods as shown for a representative 2 wt. % HPC sample in
Figure 6. This figure clearly shows that, on cooling from 70 °C, the light transmittance of the sample has not been affected by prior heating. This is a promising attribute for potential use within a thermotropic ‘smart’ window.
Aqueous HPC samples from 1 wt. % to 6 wt. % HPC were then analysed for potential reflectivity of light in the temperature range between 20 °C and 55 °C.
Figure 7 shows a typical UV-Vis reflection spectrum with increased temperature for a representative HPC aqueous sample. Prior to any change in transparency due to the temperature dependency of HPC solubility in water, a reflectance of ~10% is recorded from the transparent liquid itself. The data in
Figure 7 confirms that above the T
s aqueous samples of HPC are reflecting incoming light within the stated 350–1100 nm wavelength range required for use by the solar cells. HPC therefore has the potential to be used as the thermotropic component of the proposed novel CPV device which relies on this reflected light being harvested by solar cells embedded at the edge of the glazing unit.
Upon increasing HPC concentration in aqueous solution from 1 wt. % up to 6 wt. % HPC, reflectance was also observed to increase, as can be seen in
Figure 8.
It is proposed that above the Ts samples with higher HPC concentration will be subjected to increased aggregation and precipitation of HPC chains out of solution, therefore resulting in the observed increase in the amount of light being reflected by the HPC.
To calculate the average reflectance of visible light in the wavelength range 430 nm–780 nm and the average direct solar reflectance in the wavelength range of 440 nm–950 nm, BSI Standards BS EN 410:2011 [
26] were again used as shown in Equations (3) and (4), respectively.
ρv(λ) is the light reflectance.
Dλ is the relative spectral distribution of illuminant D65.
ρ(λ) is the spectral reflectance of the glazing.
V(λ) is the spectral luminous efficiency for photopic vision defining the standard observer for photometry.
Δ(λ) is the wavelength interval.
ρe(λ) is the solar direct reflectance.
Sλ is the relative spectral distribution of the solar radiation.
The data calculated for visible light and direct solar reflectance, as well as for reflectance measured at 600 nm, is shown in
Figure 9. This data coincides with that observed in
Figure 7 whereby above the T
s reflectance is highest in the visible light range as compared to light in the wavelength range of 780 nm to 950 nm.
Transmittance and reflectance data for the 6 wt. % HPC aqueous sample are shown in
Figure 10. Transmittance and reflectance were measured using differing baselines and due to this the data values do not total 100% below the T
s. The transmittance of the HPC aqueous sample is relevant to its solvent liquid (water) and therefore shows a higher transmittance when compared with air. The measured reflectance is relevant to the reference WS-1 diffuse reflectance standard (100% reflectance), with the transparent HPC aqueous sample showing ~10% reflectivity before transition. Both light reflectance and transmittance start to increase at ~38 °C; however, transmittance sharply declines to nearly 0% transmittance within ~8 °C range whereas reflectance is still observed to increase by 20–40% after this point. This could potentially be attributed to temperature induced hydrophobicity of the HPC occurring in stages due to different types of water bonding being present in solution. Specifically, water molecules that are hydrogen bonded to OH groups on the HPC chain will dissociate first followed by dissociation of OH groups bonded to methyne, methyl and methylene groups at higher temperatures [
27]. The breaking of this latter group of bonds results in hydrophobic interaction of the methyl groups in HPC subsequently then leading to coil-to-globule transition occurring. This would also further explain the increase in reflectivity observed upon increasing the HPC concentration.
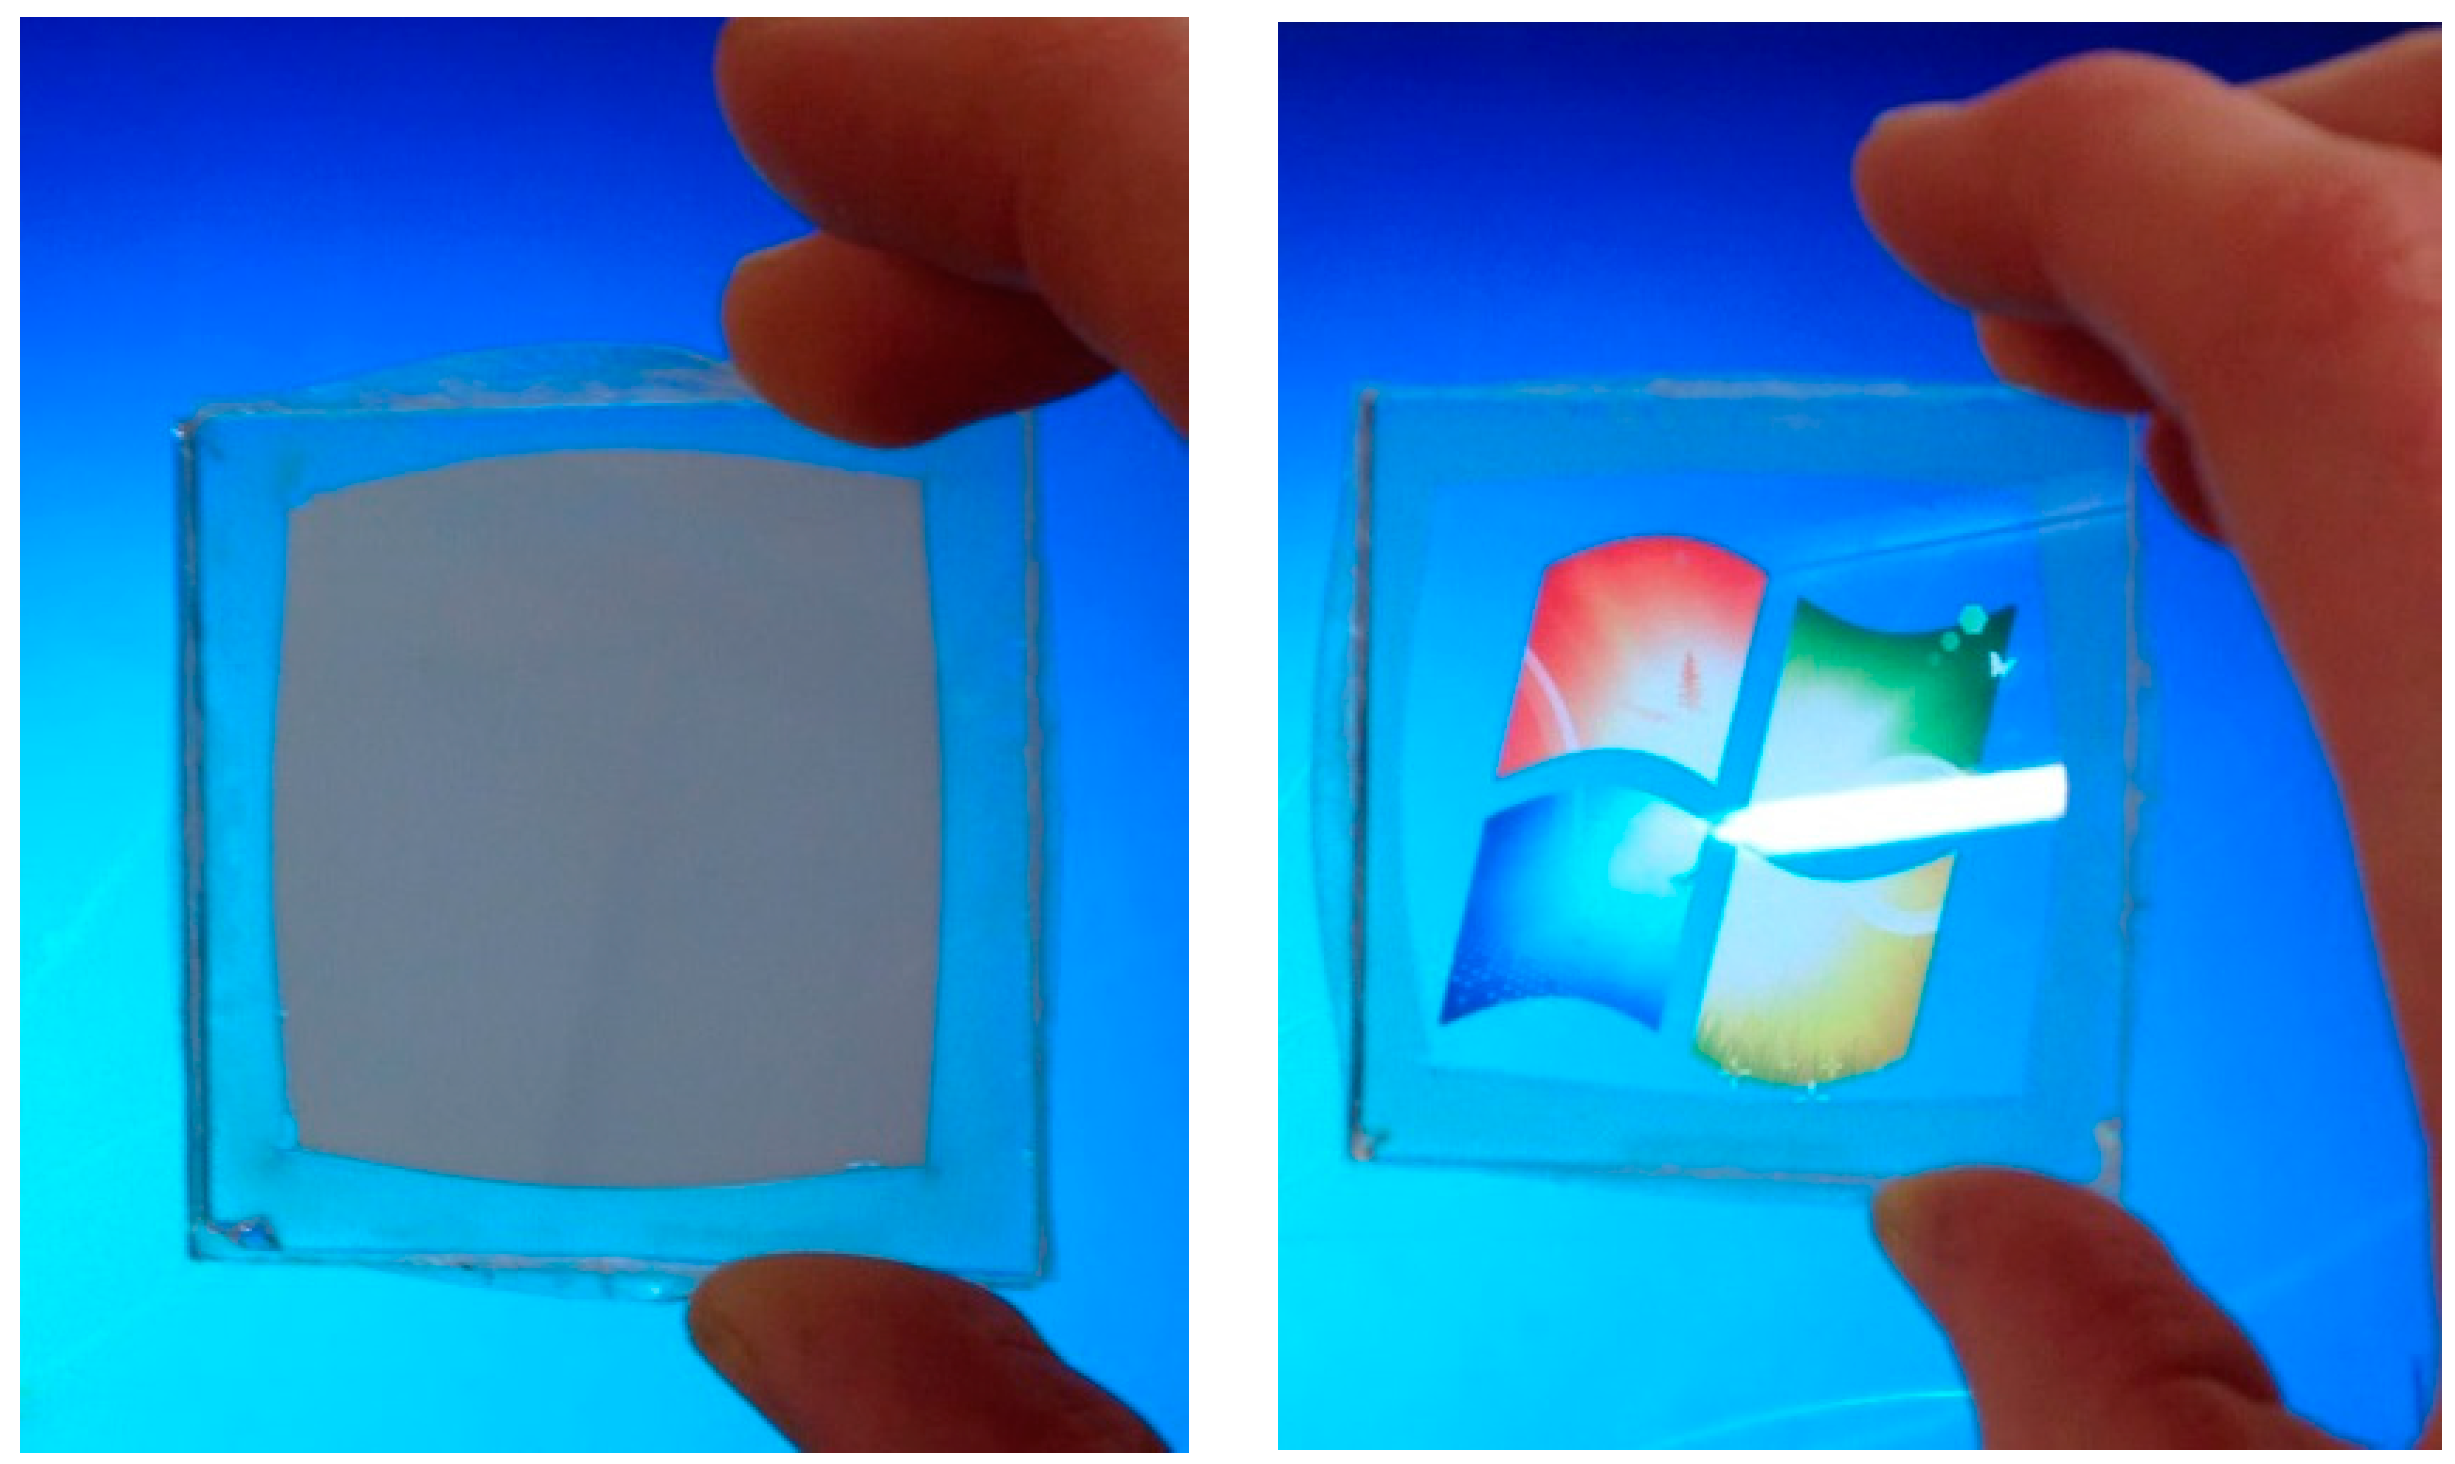
The 6 wt. % HPC aqueous sample was then used to synthesise thermotropic hydrogel membranes within a “truncated” version (no integrated PV) of the CPV ‘smart’ window system in order to compare transmittance and reflectance data for a membrane sample with that of the aqueous samples.
Figure 11 shows photographs of the 6 wt. % HPC membrane sample both below and above the T
s. It can be seen that below the T
s the optical transparency of the membrane is sufficient for glazing purposes (left), whilst above the T
s the membrane transitions to an opaque state (right).
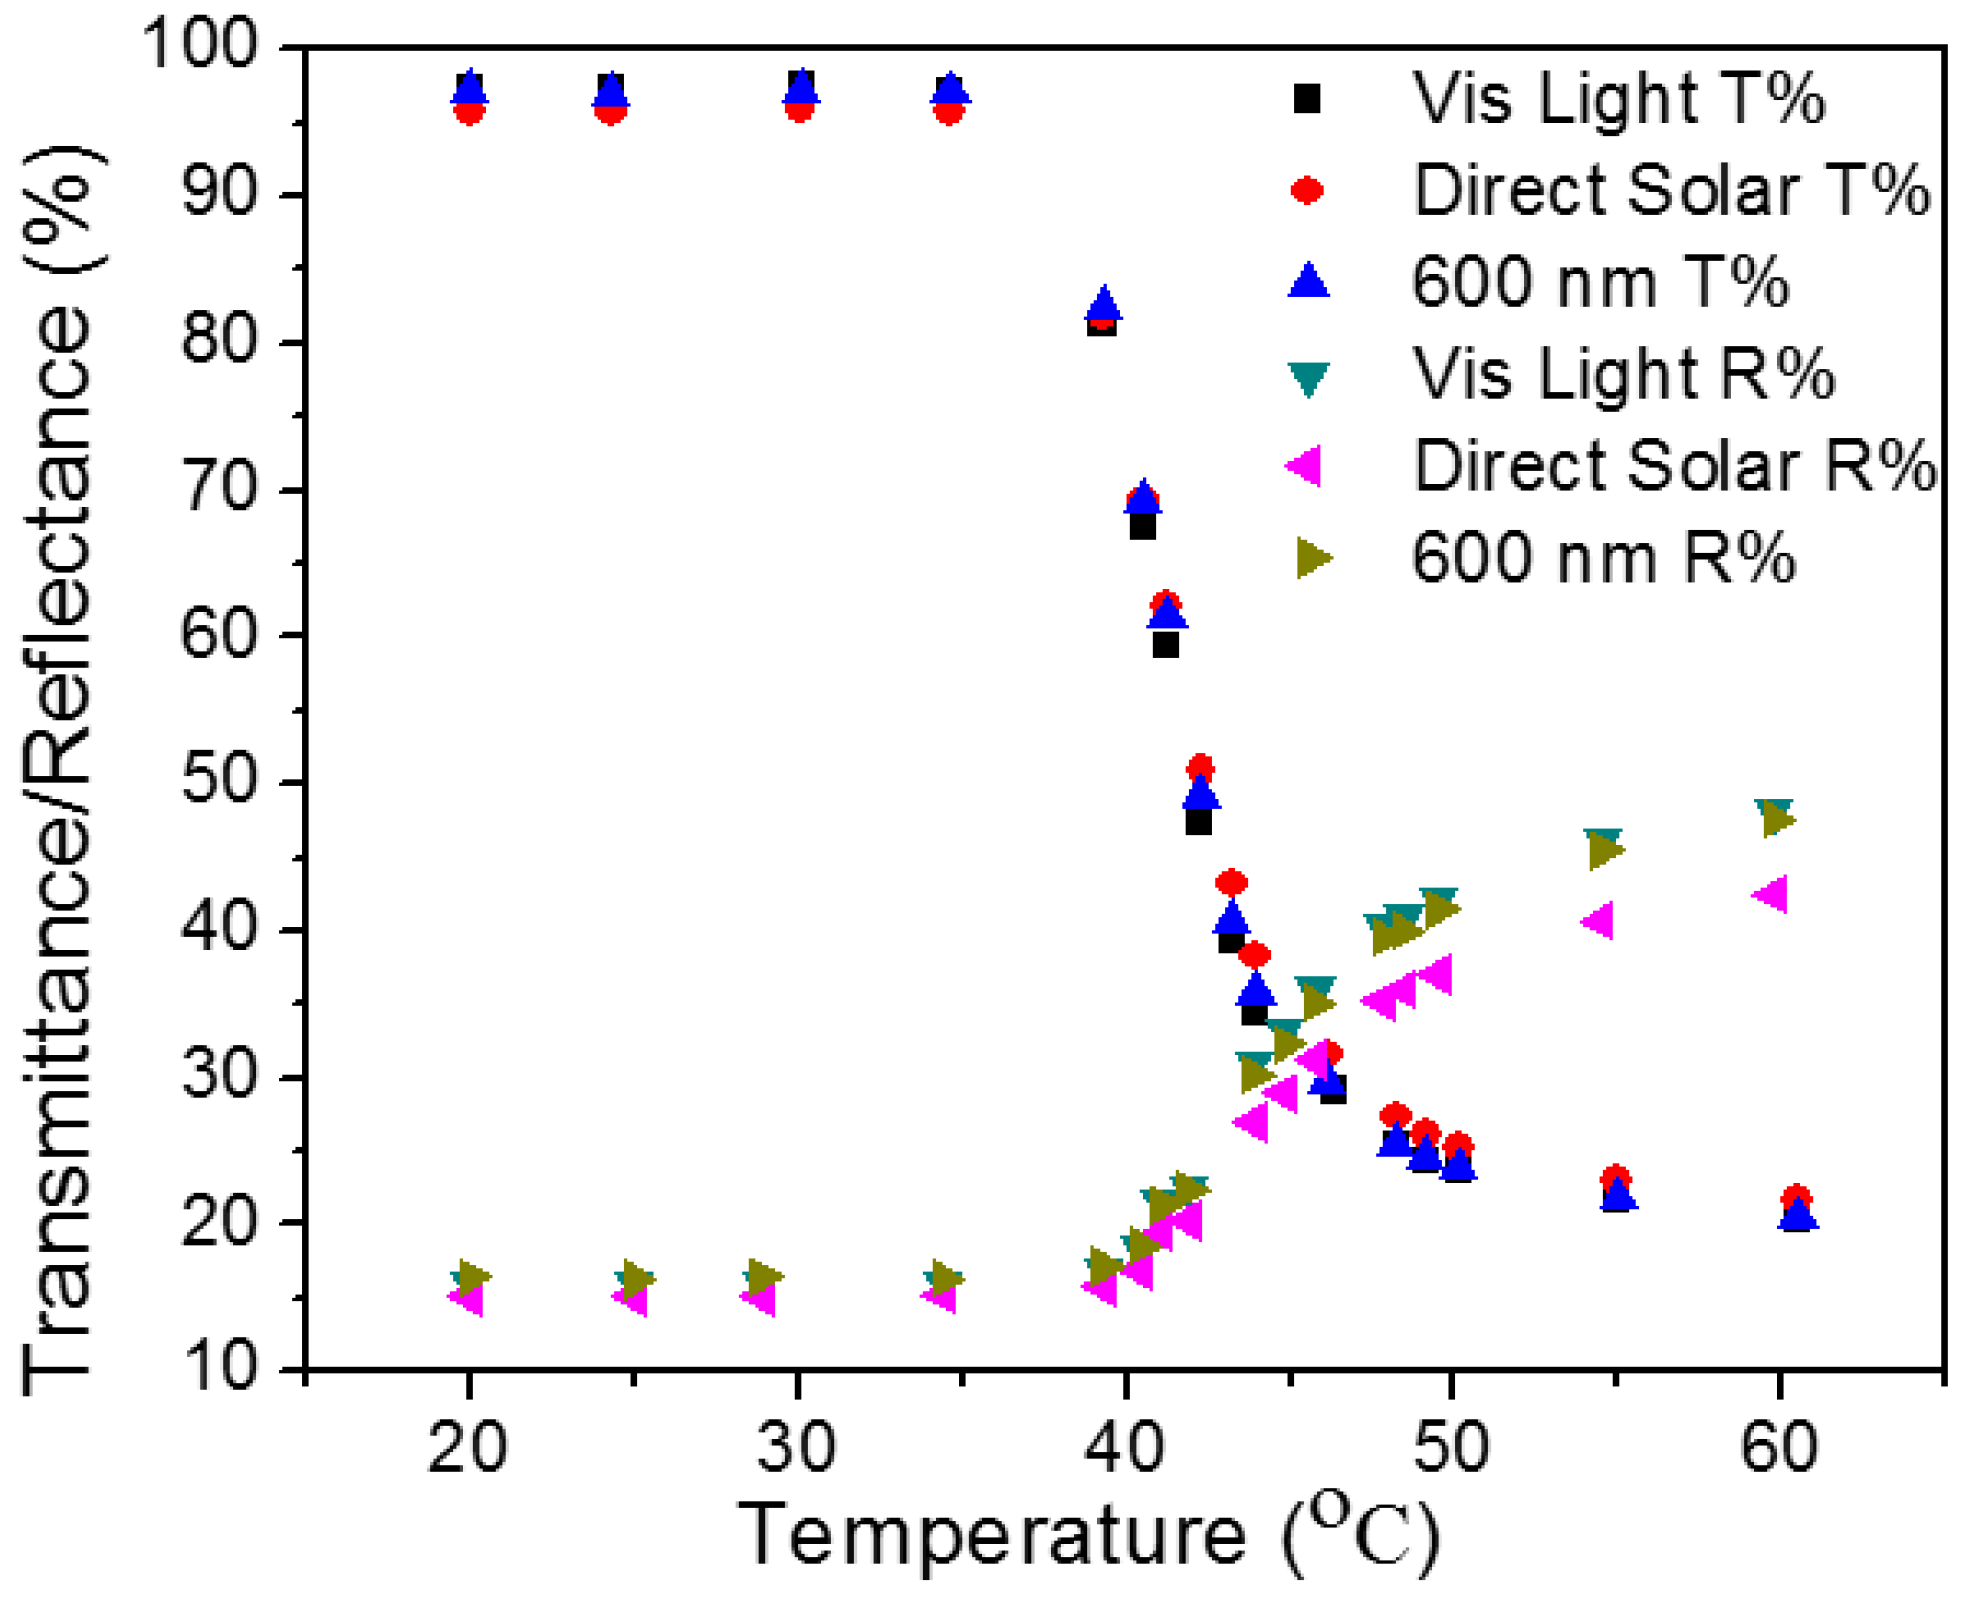
The presence of the gelling agent in the molecular structure of the HPC membrane caused several main effects. Firstly, the T
s of the membrane sample increased to 42 °C, as shown in
Figure 12, as compared to 40 °C for the same concentration of HPC in aqueous solution. Temperature switching from high to low transmittance in the membrane sample occurred over a 15 °C temperature range, almost double that observed for the aqueous HPC samples. Reflectance above the T
s decreased by around 20% in the membrane sample as compared to the aqueous sample, as shown in
Figure 10. There is also a stronger correlation between transmittance change and reflectance change in the membrane sample than observed for the liquid samples, with both transmittance and reflectance starting to change at ~39 °C and levelling off at around 55 °C. Again, below the T
s the data values for transmittance and reflectance do not total 100% due to different baselines being applied. The measured transmittance was not compared with air, but was relative to a single layer of 4 mm glazing.
The 2 °C increase in Ts of the membrane sample, as compared to the aqueous sample, is likely due to the increased strength of the hydrogen bonding between OH groups of the HPC and gelling agent, as compared to OH bonding of HPC with aqueous water. This also explains the greater Ts range observed for the membrane sample. The reduced reflectivity observed for the membrane sample above the Ts, as compared to aqueous samples, may also be explained by this stronger hydrogen bonding between gelling agent and HPC.


