Abstract
This study focuses on the development of electric vehicles (EV) in the private passenger vehicle fleet in Beijing (China), analyzes how EVs will penetrate in the market, and estimates the resulting impacts on energy consumption and CO2 emissions up to 2030. A discrete choice model is adopted with consideration of variables including vehicle technical characteristics, fuel prices, charging conditions and support policies. Results show that by 2030, without technological breakthrough and support policies, the market share of EV will be less than 7%, with gasoline dominating the energy structure. With fast technological progress, charging facility establishment, subsidies and tax breaks, EVs will account for 70% of annual new vehicle sales and nearly half of the vehicle stock by 2030, resulting in the substitution of nearly 1 million tons of gasoline with 3.2 billion kWh electricity in 2030 and the reduction of 0.6 million tons of CO2 emission in 2030. Technological progress, charging conditions and fuel prices are the top three drivers. Subsidies play an important role in the early stage, while tax and supply-side policies can be good options as long-term incentives.
1. Introduction
The last two decades saw the significant development of the economy and society in China as well as increasing demand for energy and CO2 emissions due to the rapid growth. The total energy consumption increased 50% in ten years and reached 4.3 billion ton of coal equivalent (TCE) in 2014 [1]. China produced 9 Gt CO2 emissions from fuel combustion in 2013 (three times those in 1990), accounting for 28% of the world total CO2 emissions from fuel combustion. However, as the largest emitter, China’s per-capita emissions is only one-third of that of the United States, the second largest emitter [2]. In December 2015, a new climate agreement was finalized at COP21 in Paris, which extended mitigation obligations to both developed and developing countries. The COP21 Paris agreement was built on voluntary emissions reduction pledges for 2020 [2]. China has submitted its national climate pledge (so-called Intended National Determined Contribution or INDC) that the CO2 emissions will peak around 2030, and China will make a positive effort to reach the target as soon as possible. This means the main energy-related sectors, such as power, building and transport, have to explore decarbonization transition pathways.
The CO2 emissions produced by transport accounted for 23% of global CO2 emissions in 2013, and grew by 1.9% annually over the last decade [3]. Transport became the second largest sector for CO2 emission globally. Emissions from road transport, which accounted for 75% of total transport-related emissions in 2013 and increased 68% since 1990, were the main driver for the fast growth of transport emissions [2]. The rising income and living standards boosted the automobile market in China in the past decade. China is now the largest automobile market in the world, with annual sales or over 24 million vehicles. By the end of 2014, the population of private passenger vehicles in China reached 109 million, which was almost eight times that of ten years ago [4]. The associated energy and environmental problems have drawn more and more attention. The fuels consumed by the growing vehicle population was primarily sourced from petroleum. China’s oil import dependency exceeded 60% in 2015 [5]. In some regions, vehicle emissions are considered to be one of the main causes for air quality problems. Meanwhile, the transport sector is facing the challenge to reduce CO2 emissions. It’s very likely that the rising standard of living over the coming decade will keep stimulating the demand for travel and vehicles. New technologies, which are required to not only meet the growing demand for vehicles but also reduce the impact on energy security and environment, are needed for the revolution in transportation energy system. Electric vehicles (EVs), including battery electric vehicles (BEVs) and plug-in hybrid electric vehicle (PHEVs) that are fully or partially driven by electricity, with a low greenhouse gas (GHG) emission power mix is considered to be a good choice [6].
The Chinese government is very positive and ambitious in promoting the electrification of vehicles due to the fact that the development of EVs can benefit domestic oil security, urban environments and promote technological innovation, transformation and upgrading of China’s automotive industry. Targets of EV technology development and market penetration are set in industry planning [7,8]. The market share of EVs in annual sales is expected to exceed 5% and 20% in 2020 and 2025, respectively. The cumulative production and sales of EVs could reach 5 million by 2020. Support policies has been introduced to encourage and guide the development of EVs, which cover technology innovation, production access, demonstration, financial subsidies, tax breaks, etc. For instance, the government has set up key projects for EV technology R&D during the 10th and 12th Five-year Plan. A new energy vehicle demonstration program was conducted during 2009–2012 in China. Twenty five cities, including Beijing, have participated in the program and all these cities have set promotion targets and support policies. EVs are exempt from purchase taxes and consumers can benefit from purchase allowances. In November 2016, the Technology Roadmap for Energy-efficient and New Energy Vehicles was released, which represents a blueprint for the development of EVs in the coming 15 years. A policy combining EV credits and a cooperative average fuel consumption credit is in the pipeline.
In 2015, sales of EVs in China’s passenger vehicle market experienced a threefold growth. The EV stock reached 310,000, accounting for a quarter of the global total. The market share of EVs was close to 1%. This is the result of significant efforts made by both government and industry over nearly ten years. Although China is the largest EV market, it still faces barriers and uncertainty to greater EV adoption. The current market prosperity is mainly driven by government policy. Some enterprises were merely driven by subsidies and not committed to advanced technology R&D [9]. The characteristics and demand of consumers may not be well understood and analyzed in product designs. Although the cost of battery packages has dropped dramatically, the price of EVs without subsidy still can’t compete with conventional cars. Range anxiety and charging, especially home charging, are still major concerns for many potential consumers.
The goal of this research was to analyze how EVs will penetrate the private passenger vehicle market in Beijing and estimate the resulting impact on energy consumption and CO2 emission up to 2030. A discrete choice model was adopted to analyze the factors affecting the penetration of EVs. Five vehicle technologies are considered for four vehicle classes with consideration of variables including vehicle costs, energy costs, vehicle technical characteristics, charging conditions, taxes, subsidies and annual vehicle mileage traveled. Then a case study of Beijing was conducted using the developed model. Scenario analysis is adopted to explore the possible future of EV deployment in Beijing with plausible trends of key factors. Three scenarios are studied: Stagnation, Rapid Growth (RG) and Rapid Growth Plus (RG+). Each scenario is designed with an envisaged state of technology progress and charging conditions. In addition, several support policies are simulated in the scenarios in order to evaluate the effects and determine which one is most effective. The policies are primarily financial support, including purchase tax break and subsidy for EVs. This research developed a feasible approach to identify key drivers of EV penetration and quantitatively studied the impact of multiple factors on the EV market share as well as the resulting changes in energy consumption and CO2 emissions, and evaluated the effects of support policies.
This paper has five sections. Section 2 presents the methodology and structure of the model developed; Section 3 presents the definition and design of scenarios and policy instruments simulated; the results of the scenarios are analyzed and discussed in Section 4; and final conclusions are drawn in Section 5.
2. Methodology
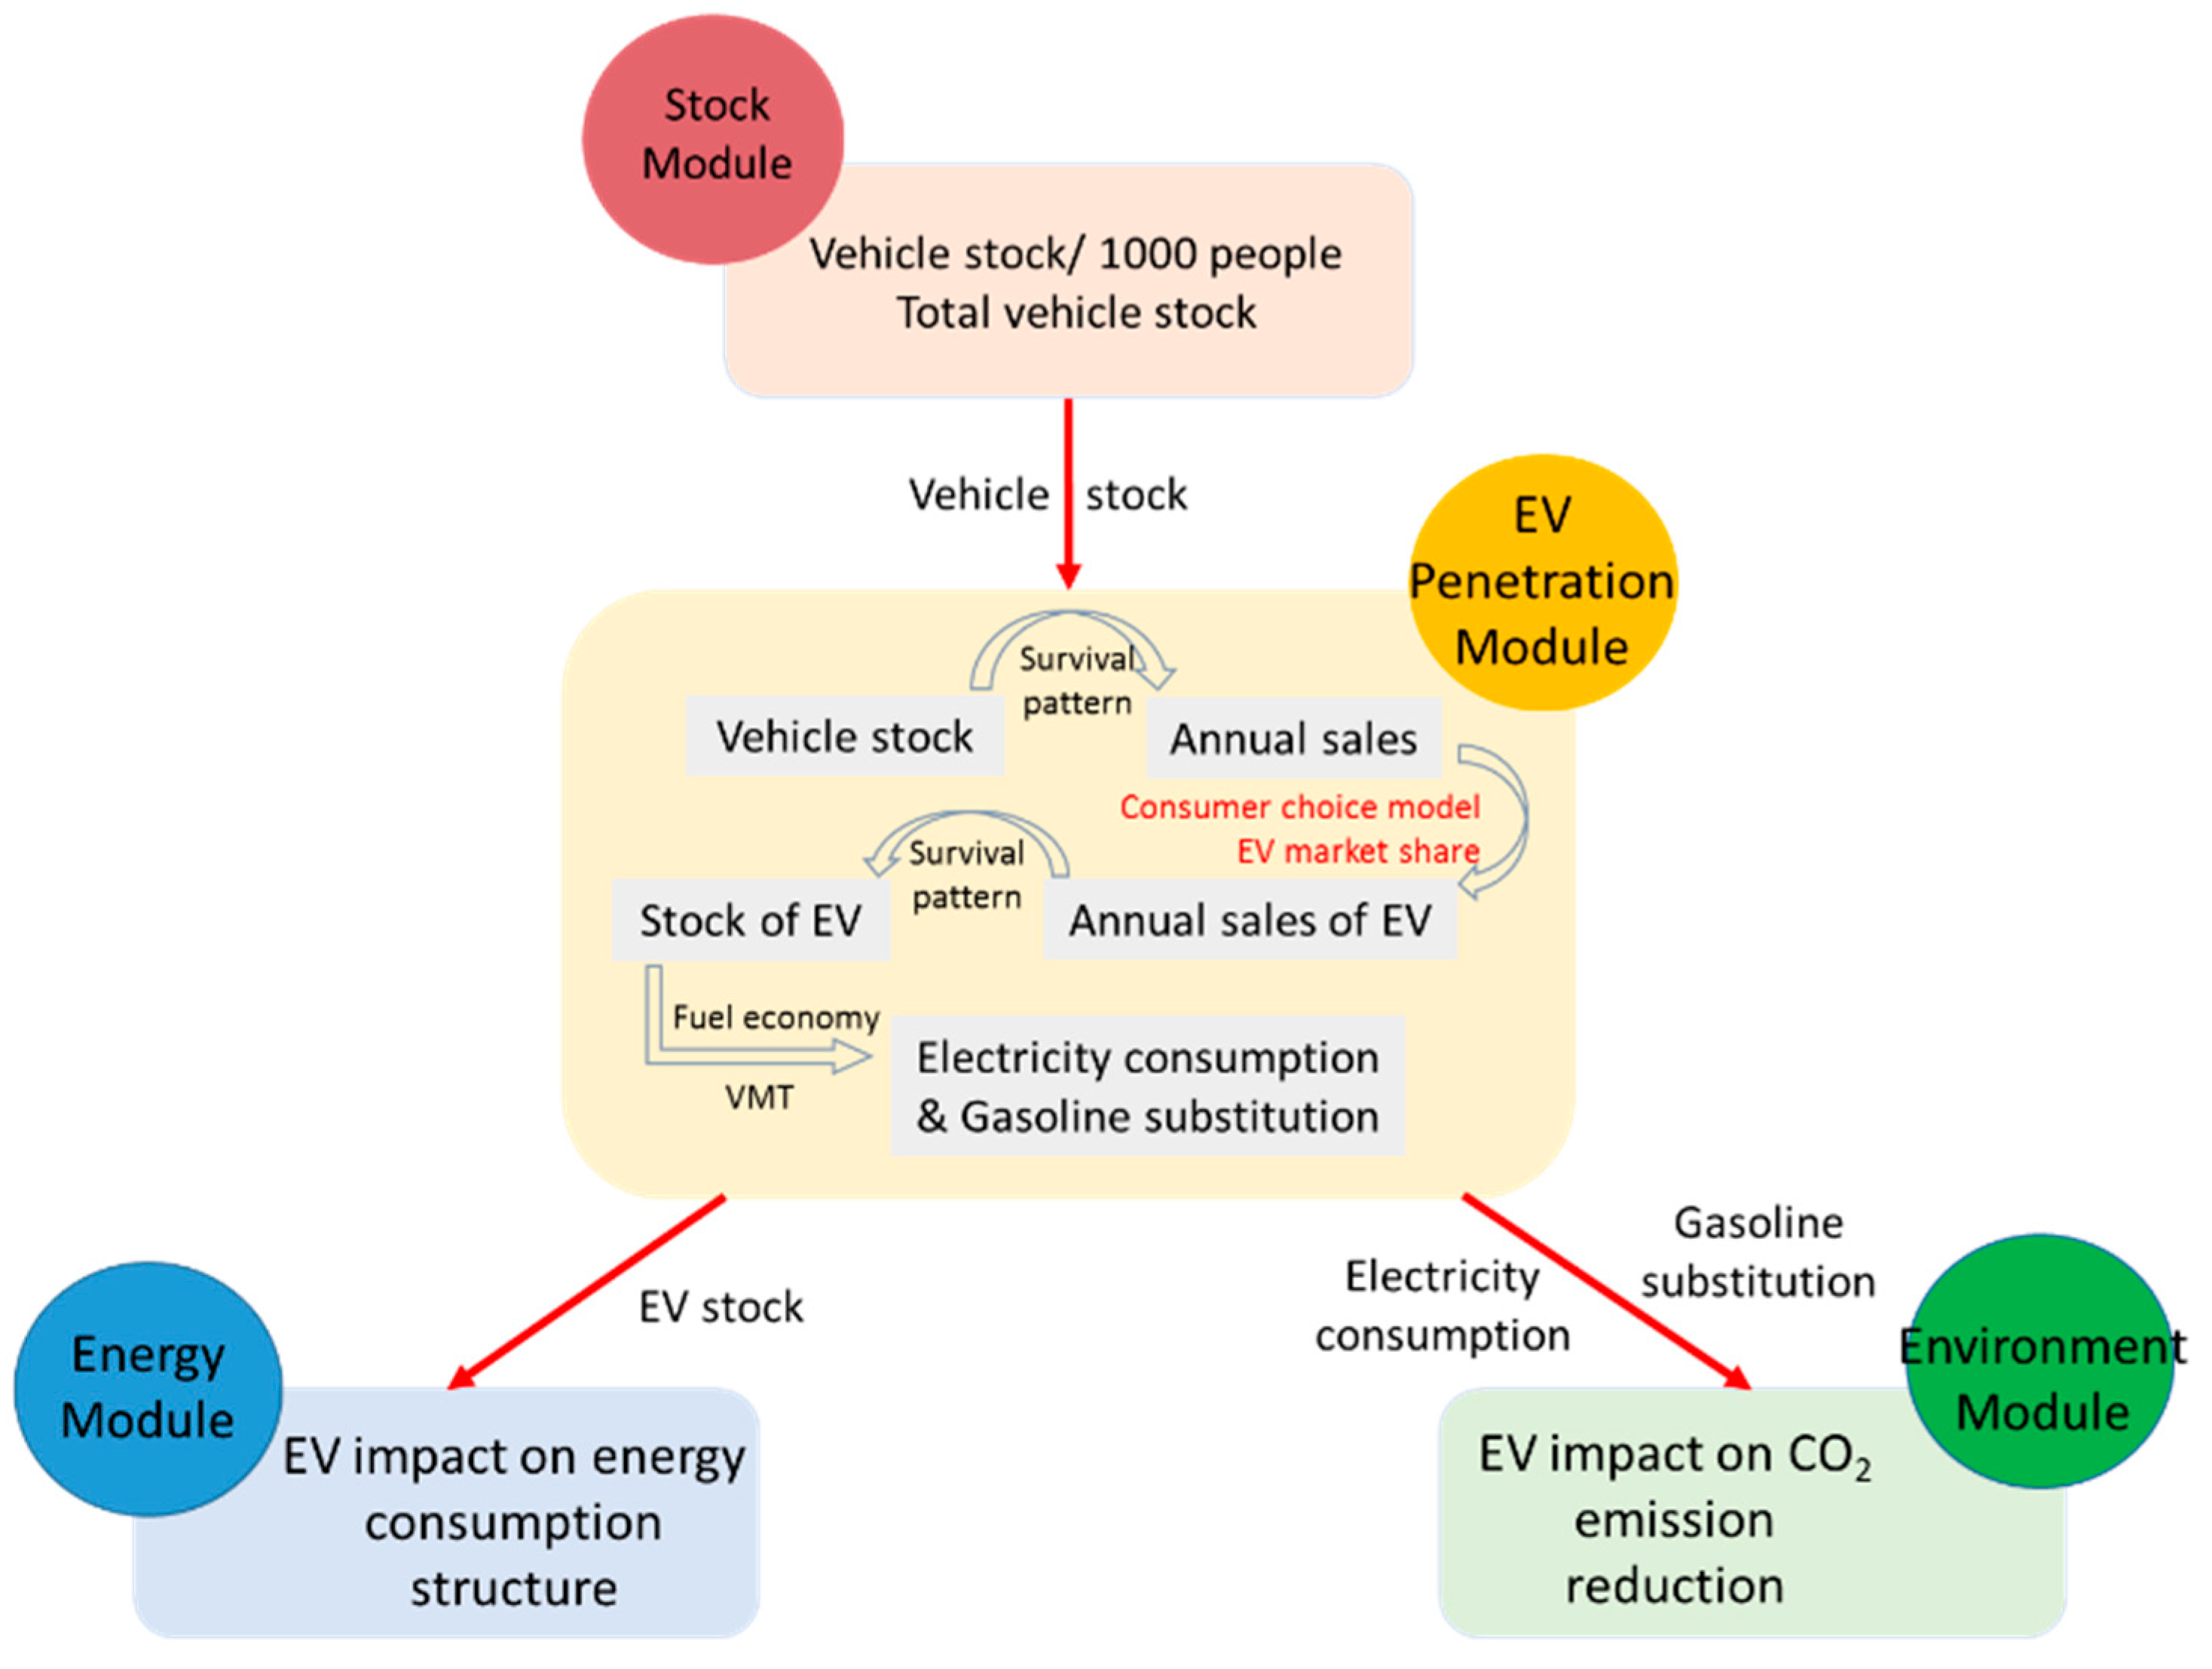
The Passenger Vehicle Consumer Choice Model (PVCCM) is designed to forecast consumer choice probabilities, which is equal to market shares, of vehicle technologies based on vehicle attributes and estimate the corresponding changes in energy consumption and CO2 emission. The model is coded in MATLAB with input and output databases in Excel. The core methodology adopted is the discrete choice method. The model covers the period from the base year (2013 in this study) to 2030 with a time step of one year. The model consists of four main modules: EV Penetration, Stock, Energy and Environment, as shown in Figure 1. The variable matrix has three dimensions: vehicle class, type of technology and attributes. There are four classes of passenger vehicles based on engine size: mini (≤1 L), small (1–1.6 L), medium (1.6–2.5 L) and large (>2.5 L). Five vehicle technology types are considered: conventional gasoline vehicle, BEV100 (BEVs with a range of 100 km), BEV200 (BEVs with a range of 200 km), PHEV20 (PHEVs with an all-electric-range of 20 km) and PHEV50 (PHEVs with an all-electric-range of 50 km). The following section will provide a detailed description of the main modules.
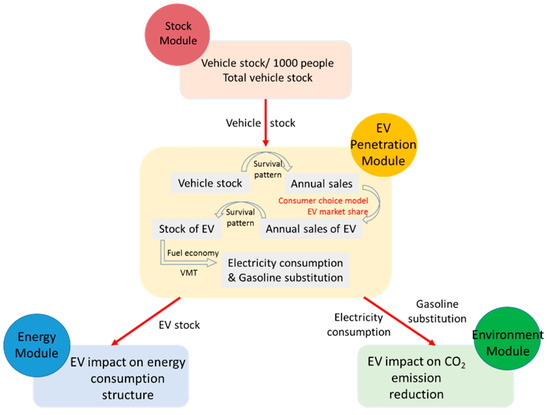
Figure 1.
The framework of Passenger Vehicle Consumer Choice Model (PVCCM). EV: electric vehicles; VMT: vehicle mileage traveled.
2.1. EV Penetration Module
The EV Penetration Module is the core of the model. This module is developed to analyze consumer choice of vehicle technologies based on a series of attributes and predict the market share of each technology. The input of the module is a series of selected vehicle attributes, fuel-related attributes and variables relating to refueling/charging conditions. The output is the market share by vehicle technology type. A nested multinomial logit model with fixed preference of vehicle attributes is adopted, which is based on the random utility theory. A rational consumer will choose a vehicle technology based on the utility derived from their concerned attributes. The top level of the model is the choice among four vehicle classes. The next level is the choice among three vehicle technology set: conventional, BEV and PHEV within a vehicle class. Then consumers choose between different powertrain technologies in each set. In the conventional set there is conventional gasoline internal combustion engine vehicle. The BEV set consists of two types with different on-board battery capacities: BEV100 and BEV200. The PHEV set includes PHEV20 and PHEV50.
The probability () that a consumer will choose vehicle technology j in technology set k can be derived as a function of the utility of the technology by assuming the unobservable part of the utility is random and subject to independent and identical Gumbel distribution, as shown in Equation (1) [10]:
where n is the number of vehicle technology types in set k. Vj is the consumer utility (or generalized cost) of vehicle technology j, which is a weighted sum of functions of observable attributes xi,j, as shown in Equation (2):
Here βj is the weight of attribute xi,j. m is the number of attributes of technology j. Vehicle technologies are characterized by the following attributes: purchase price, fuel economy, range, performance and maintenance cost, fuel price and refueling/charging convenience.
The general cost of technology set k depends on the average utility level within set k given by the following Equation (3) and is passed to the upper level to get the probability () of choosing set k in vehicle class l by the same way of calculating [11]:
Given the share (Sl) of vehicle class l in total annual passenger vehicle sales, the market share of vehicle technology j in vehicle class l is the product of Sl and the conditional probabilities. Then the market share of vehicle technology j in total annual passenger vehicle sales is the sum of the market shares in for vehicle classes, as shown in Equation (4):
2.2. Stock Module
The Stock Module calculates the total sales of passenger vehicles, sales of each vehicle class and sales and stock of each vehicle technology. With exogenous factors including vehicle survival patterns and the predicted passenger vehicle stock, the total passenger vehicle sales in year y can be calculated by the following Equation (5):
Stocky denotes the passenger vehicle stock in year y. Salesx denotes the vehicle sales in year x. sry-x represents the percentage of vehicles that are sold in year x while still in use in year y, namely the survival rate. Survival pattern is usually described by a Weibull distribution as sr(t) = e^((−(t/T) ^k)), where t is the vehicle age, T and k are characteristic parameters. In this research, the value for these parameters are obtained from a study on vehicle survival patterns in China [12]. The regressed coefficients of private passenger vehicles are adopted here.
The market shares by vehicle classes are calculated using historical sales data and the future market shares are estimated by trend extrapolation. The proportion of mini and small vehicles will increase due to the policy of promoting vehicles with smaller engines. The total sales are divided into each vehicle class by multiplying their market shares. Within each vehicle class, the sales are split by vehicle technology endogenously by the market share of each vehicle technology from the EV Penetration module. After obtaining the sales of vehicle technology j, the stock in year y can be estimated using the survival pattern, as shown in Equation (6):
2.3. Energy Module
According to Lang’s research, energy consumption at the fuel use phase accounts for more than 72% of the total life cycle energy consumption of EV in China [13]. Through estimating the change in fuel use, the evolution of energy consumption due to technology turnover can be studied. In this module, the electricity consumed by EV as well as the gasoline saved as a result are estimated with the fuel economy of each vehicle technology and annual vehicle kilometers traveled, as shown in Equation (7). Only end-use phase energy consumption is considered here to help decision-makers gain an intuitive understanding of the effect of substitution of gasoline with electricity by EV usage:
ECy denotes the electricity consumption by EV in year y. FE_Ej,x is the fuel economy of EV technology j sold in year x, which is measured by kWh/100 km. VKTy is the average annual mileage travelled in year y. When FE_Ej,x is replaced by fuel economy of conventional gasoline vehicle sold in year y, the gasoline consumption saved by EV (GSy) can be estimated.
2.4. Environment Module
Using the CO2 emission factors of gasoline and electricity, the impact of adopting EV on CO2 emission can be assessed by Equation (8). Both end-use phase energy-related and electricity power station CO2 emissions are considered here to assess the full implication on CO2 emissions from EV usage:
ΔCO2 is the CO2 emission reduction in year y by adopting EV. efG is the emission factor of gasoline. efE is the emission factor of electricity.
The emission factor of gasoline, 98.86 g CO2/MJ, is obtained from a previous study on the lifecycle analysis of automobile energy in China [14]. The emission factor of electricity depends on the power mix and power generation technologies. This research adopts the emission factor from a study on long-term energy planning of China’s electricity sector, which including the consideration of the evolution in power mix and regional difference [15]. The emission factor of electricity in North China regional grid (covering majorly six provinces: Beijing, Tianjin, Hebei, Shandong, Shanxi, Inner Mongolia Autonomous Region), where Beijing is located, is about 946 g CO2/kWh in 2013, and will decline to 820 g CO2/kWh by 2030. This assumption has already taken into account the recent promises and actions from the Beijing and surrounding area governments will act very aggressively to reduce coal use in the near future.
3. Scenarios and Policy Analysis
Scenarios are plausible conjectures about what could happen in the future based on past and present trends and conjectures about how these trends may evolve in the future [16]. They are widely used to aid in planning and policy decision making in a variety of areas. The purpose of this research is to explore the possible future for the technology structure, energy supply and CO2 emission in the passenger vehicle sector. Three exploratory scenarios are built to experiment with different directions of development in technology, charging infrastructure and support policies, and the implications for energy and environment.
3.1. Scenario Design
There are two types of factors which could have a strong impact on the future. The predetermined factors represent the common features of scenarios and therefore are identical in all scenarios. Another kind of factors are those that are highly uncertain or depend on will and have potentially high impact on the system, referred to as main drivers. In this research, energy price, fuel economy and travel demand are considered as predetermined factors. Technological change and charging conditions are identified to be main drivers, which represent the main factors that define how scenarios differ. With the speed of technology progress, which is represented by the speed of battery cost reduction, varies from slow to fast, three scenarios are formed: Stagnation, Rapid Growth (RG) and Rapid Growth Plus (RG+).
- Stagnation: describes a future with a slow technological change and insufficient charging facilities;
- Rapid Growth (RG): describes a future with medium speed technological change and charging facilities meeting charging demand;
- Rapid Growth Plus (RG+): describes a future with fast technological change and sufficient charging facilities.
The key factors characterizing the scenarios are discussed below.
3.1.1. Predetermined Factors
The data for predetermined factors are summarized in Table 1.

Table 1.
Data for predetermined factors.
• Energy price
Energy prices affect the operation costs of vehicles directly. The price of gasoline depends on crude oil price, processing cost, circulation cost, profit and taxes, etc. Crude oil price plays the most important role. The surplus of oil supply over demand caused the dramatic fall in oil price from the end of 2014. In the latest version of World Energy Outlook, International Energy Agency (IEA) provides its insights for the future trend of oil price. In two main scenarios, the Current Policies Scenario and the New Policies Scenario, oil price is expected to grow from now to 2040 [17]. The rise is underpinned by three main considerations. The first is the investment for new production to keep pace of the demand. The second is that oil production will be more expensive with the depletion of “easy oil”. The third includes geopolitical risks in low cost oil producing regions, and the intention of main producers in Organization of Petroleum Exporting Countries (OPEC) to defend a global price level, which has already been put into action. In terms of taxes, fuel tax may increase and a carbon tax may be imposed to lower fuel demand. Based on the above consideration, gasoline price is set to edge gradually higher from 2016 to 2030. The historical data is based on the average price of 93# gasoline in Beijing.
The electricity price is also expected to rise due to the de-carbonization of the power system. To achieve the targets in the Intended Nationally Determined Contributions (INDCs) submitted to United Nations Framework Convention on Climate Change (UNFCCC), China promises to increase the share of non-fossil fuels in primary energy consumption to around 20% and lower CO2 emission per unit of GDP by 60%–65% from 2005 level by 2030 [18]. The reform in power generation is imperative. To reduce the CO2 emission from coal power plants, in addition to improving efficiency, advanced technologies such as carbon capture and storage (CCS) are necessary, which may increase the cost of coal fired electricity. The proportion of renewable energy in power generation will increase in the future. Although the cost of renewable power is declining, it’s still higher than coal fired power, which leads to a rise in electricity price. On the other hand, the electricity price consumers pay for charging differs by ways of charging. Electricity price for home charging is the cheapest, about 0.47 RMB/kWh in Beijing. The price in public charging stations is about twice that of home charging, and a service fee of 0.4–0.8 RMB/kWh is charged.
• Vehicle stock
The vehicle population in Beijing has been growing fast since 2000. From 2002 to 2010, the vehicle population increased 2.4 times, with an average annual growth rate of over 16%. Rapid growth was followed by severe traffic congestion and inadequate parking spaces. To easy the traffic jam problem, Beijing government have adopted increment control policy on vehicles since 2011 and new license plates have been issued through lottery with a certain annual quota. Specific waivers for new energy vehicles have been introduced since 2013. With the control policies, the average annual growth rate of vehicle population dropped to 4.2% in the period from 2011 to 2014. In recent years, with the pressure to improve air quality, the control policy becomes more stringent reflected by the declining annual quota as vehicle pollutant emissions is one of the major causes of haze. Considering the city’s traffic capacity and air quality issue, the policy on controlling vehicle population increment is very likely to continue. In this research, the results of a previous study on vehicle population in Beijing, which estimates the vehicle ownership through the elasticity of ownership per thousand people to GDP per capita, is adopted as the basis of the projection of vehicle population [19]. The projection is adjusted taking the control policy and the government target for vehicle population into consideration. The vehicle population is estimated to be under 5.7 million before 2017 and gradually increase to 7.7 million by 2030.
• Fuel economy
The fuel consumption rate of passenger vehicles in China continues to decline in the past decade. The company average fuel consumption (CAFC) rate of conventional passenger vehicles was 7.02 L/100km in 2015 [7]. Since the first phase of the fuel economy standard was implemented in 2006, the average fuel economy improved by 1.7% annually [20]. Long-term targets were put forward in industry planning [8] in which the CAFC will further decline to 5 L/100 km, 4 L/100 km and 3.2 L/100 km in 2020, 2025 and 2030, respectively [8]. Multiple measures are taken to ensure the realization of the targets. The fuel economy standard is tightened gradually. The Phase IV fuel economy standard comes into effect in 2016. According to some analysis, the upgrades of conventional energy efficient technologies can contribute 40%–80% of the reduction in fuel consumption rate. In addition, the introduction of new energy vehicle can bring about 15%–35% of reduction [20]. If the CAFC credit trade system and NEV credit trade system under discussion can be well designed and put into practice, the fuel economy targets are more likely to be achieved in a flexible manner. Hence, the fuel economy is set to be the target values in corresponding years across all scenarios.
• Travel demand
The survey data of annual vehicle kilometers traveled (VKT) reported by the Beijing Transportation Research Center shows that the average annual VKT of private passenger vehicles has fallen by half from 26,750 km in 2002 to 13,150 km in 2013 while the vehicle ownership has increased significantly [21]. This trend is confirmed by the results of several other surveys conducted in Beijing and other cities. With the development of urban public transport system and railway system, the VKT is projected to continue to decrease gradually over time. In this research, the VKT is set to gradually decline to 10,000 km in 2030 in all scenarios from the current status.
3.1.2. Main Drivers
• Technological change
With the continuous investment in the R&D of EV-related technologies and the scale expansion, technologies are more mature and the cost of battery system, which accounts for the main part of the cost, are reduced dramatically. According to the industry evaluation, the cost of battery pack has reduced from $1000/kWh to $410/kWh between 2007 and 2014, with an average annual reduction rate of 14% [22]. The PHEV cost monitored by the US DOE also shows a 73% reduction between 2008 and 2015 [23]. There is no doubt that technologies will continue to progress, which leads to improvement in energy density and performance, as well as longer lifetime for batteries. Coupled with economies of scale coming from widespread adoption of EV, the cost of battery systems is going to decline further. According to a World Bank report, the cost of battery pack can reduce to $325/kWh by 2020 through material improvements, design standardization, sourcing and production optimization [24]. From the IEA report, the potential cost in 2020 could be $300/kWh based on the estimation of learning rate [6].
Ambitious targets for battery cost has been set to move towards cost parity with conventional vehicles. The US DOE set a target of $125/kWh for PHEVs by 2022, which implies an annual cost decrease of 10.3% between 2016 and 2022 and appears realistic given the reductions already achieved. Some auto manufactures announced even more ambitious targets such as $100/kWh for BEVs by 2020 [23]. China has also set targets in its industry planning. The cost is expected to be 1000–1500 RMB/kWh around 2020 and further drop to 800–1100 RMB/kWh by 2030.
In all scenarios, technologies continue to progress and battery cost decreases over time. However, the speed of technology progress, i.e., the speed of battery cost reduction, varies. In the Stagnation scenario, no major breakthrough occurs and the battery cost decreases quite slow, to around 2000 RMB/kWh by 2030. In the RG scenario, the cost will be around 1500 RMB/kWh in 2020 and further decline to 1200 RMB/kWh in 2030. In the RG+ scenario, technology breakthrough and economies of scale will help the cost drop to around 1000 RMB/kWh by 2030. The estimation of battery cost in different scenarios are summarized in Table 2.

Table 2.
Battery cost in different scenarios (unit: RMB/kWh).
• Charging conditions
Charging conditions have a direct impact on the daily use of EVs, especially for BEVs in the early stage when the electric range is quite limited. The charging infrastructure construction depends on policy orientation, local land use planning, parking condition, etc. In big cities, people usually live in high-rise buildings and private parking spaces are scarce. Land cost for public charging stations are therefore high. This makes charging infrastructure construction more difficult. An index of charging convenience is used to describe charging conditions, which is the relative convenience to refueling. The charging convenience varies from poor to well across the scenarios. When we set the convenience value of refueling of gasoline vehicle as 1, EV charging convenience values in future in different scenario are shown in Table 3.

Table 3.
EV charging convenience in different scenarios.
3.1.3. Policy Settings
Two policy instruments are implemented in the RG and RG+ scenarios: subsidies and tax breaks. Subsidies aimed at encouraging the purchase of EVs come from both the central government and the Beijing municipal government. The national subsidy policy has three stages: 2010–2012, 2013–2015 and 2016–2020. In 2010–2013, the subsidy standard was 3000 RMB/kWh. The maximum subsidy is 50,000 RMB per vehicle for PHEVs and 60,000 RMB per vehicle for BEVs, as shown in Table 4. From 2013, the subsidy policy changed from capacity-based to range-based. The amount of subsidy depends on the all-electric-range and declines year by year. The Beijing local government provides subsidies for BEVs in line with national subsidies and the cap for the total subsidy is no more than 60% of the vehicle price. The current policy is valid until 2017. Tax breaks is applied to the purchase tax, which is 5% and 10% for conventional vehicles with engine sizes ≤ 1.6 L and > 1.6 L, respectively while being free for EVs before 2017. In both scenarios, subsidies last until 2020, while the city level subsidy in the RG scenario is half of that in the RG+ scenario. After 2017, the purchase tax is 8% for EVs in the RG scenario and 6% in the RG+ scenario.

Table 4.
National subsidy standards for electric vehicles (unit: 10,000 RMB).
4. Results and Discussion
4.1. Market Share of Electric Vehicles
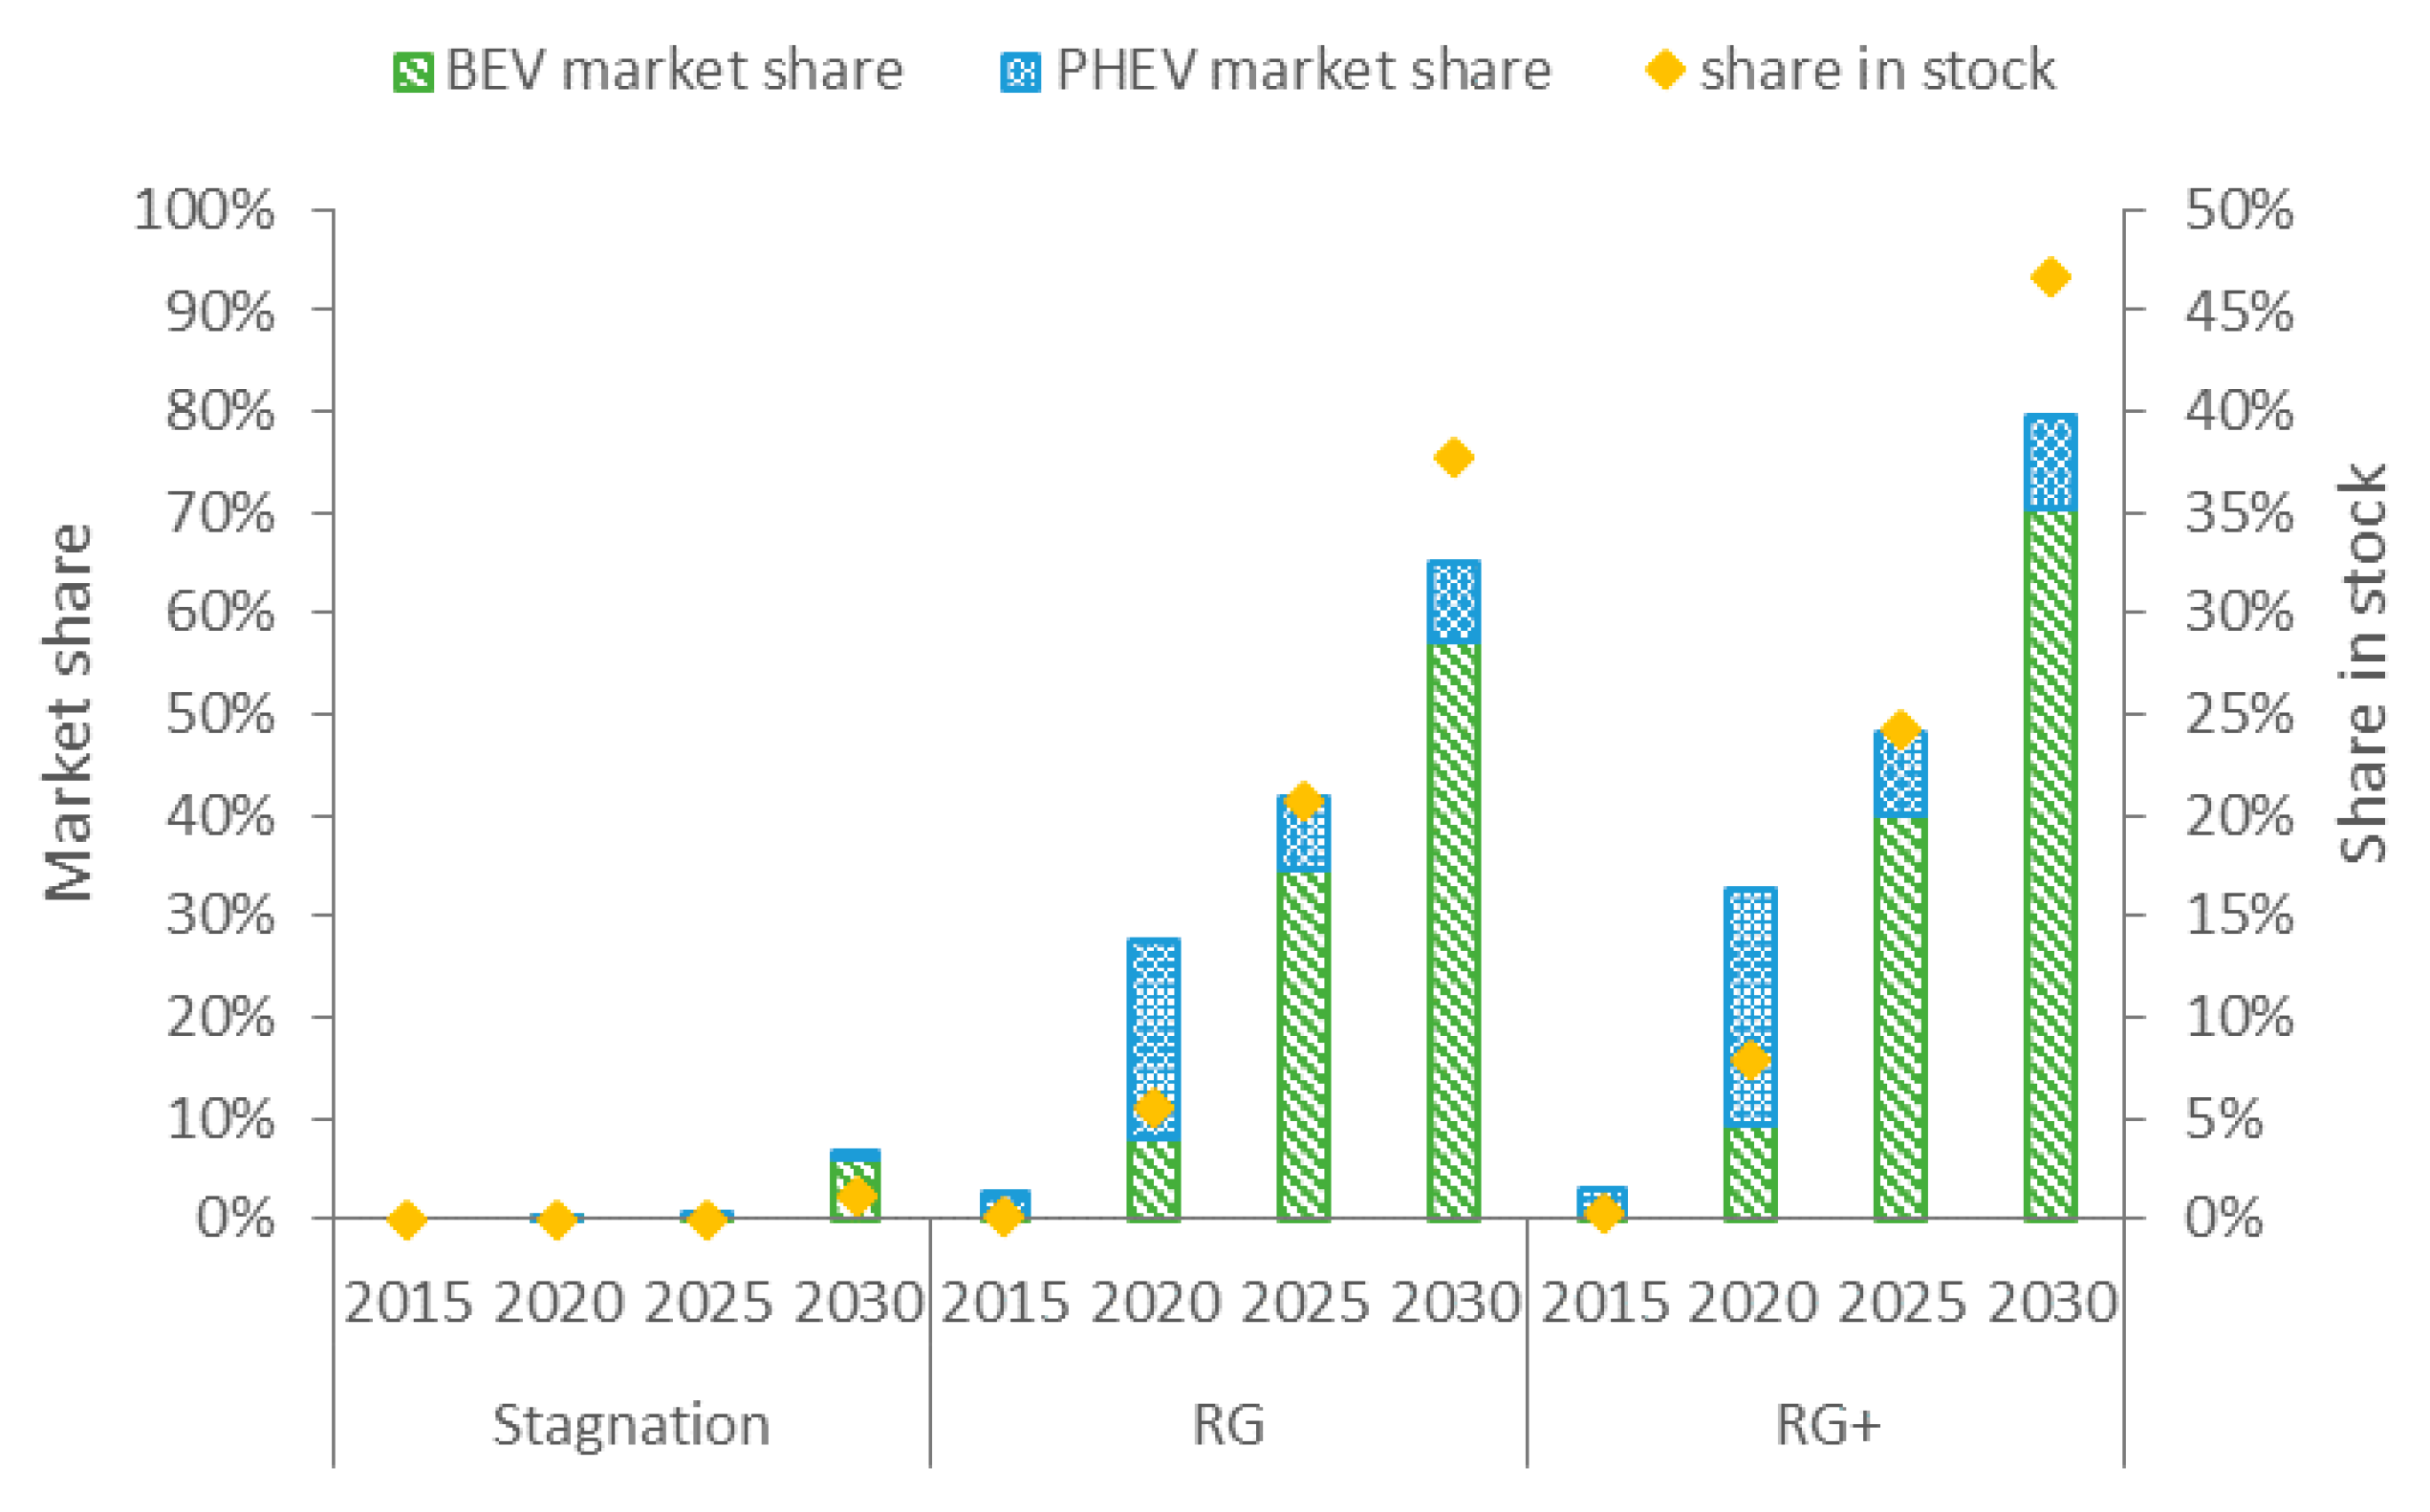
As shown in Figure 2, in the Stagnation scenario, market share (share in annual sales) of EVs is less than 1% until 2025. With slow penetration, the market share is around 7% by 2030. In the RG scenario, the market share is 28% in 2020 due to the cost reductions and subsidies. The market share further increases to 65% by 2030 with continuous cost reductions and tax breaks. The average growth rate of market share during 2015–2020 is more than 60%, compared with around 10% in the 2021–2030 period. Since cost reduction continues in both periods while the purchase subsidy phases out after 2020, this shows that the purchase subsidy plays a strong role in the fast growth of market share during the early stage when the cost of EVs is still relatively high. After 2025, when the cost of EVs is competitive with conventional vehicles, the market share of EVs still increases due to the advantage in operation cost.
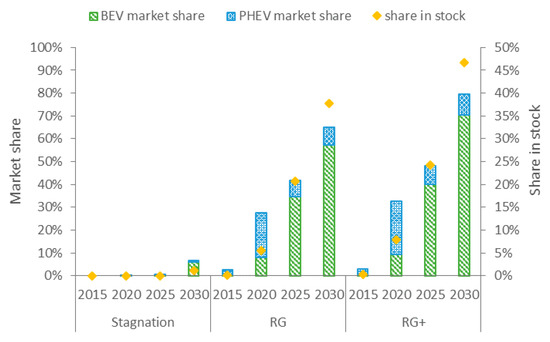
Figure 2.
Electric vehicle’s share in annual sales (left axis) and share in stock (right axis) in Beijing in each scenario. RG: rapid growth; RG+: rapid growth plus; BEV: battery electric vehicles; PHEV: plug-in hybrid electric vehicles.
In the RG+ scenario, the market share increases by 5% and 15% in 2020 and 2030 relative to the RG scenario because of lower cost of EVs and better charging conditions. In the early stage, PHEVs take up more market share than BEVs while after 2020 BEVs exceed PHEVs. This is because the battery system cost accounts for a smaller portion of the total vehicle cost for PHEVs. At the early stage with relatively high battery costs and poor charging conditions, PHEVs are more favorable in terms of price and less limited by charging conditions. With lower battery cost and better charging conditions, BEVs become more popular due to their lower fuel cost.
4.2. The Electrification of Private Passenger Vehicle Stock
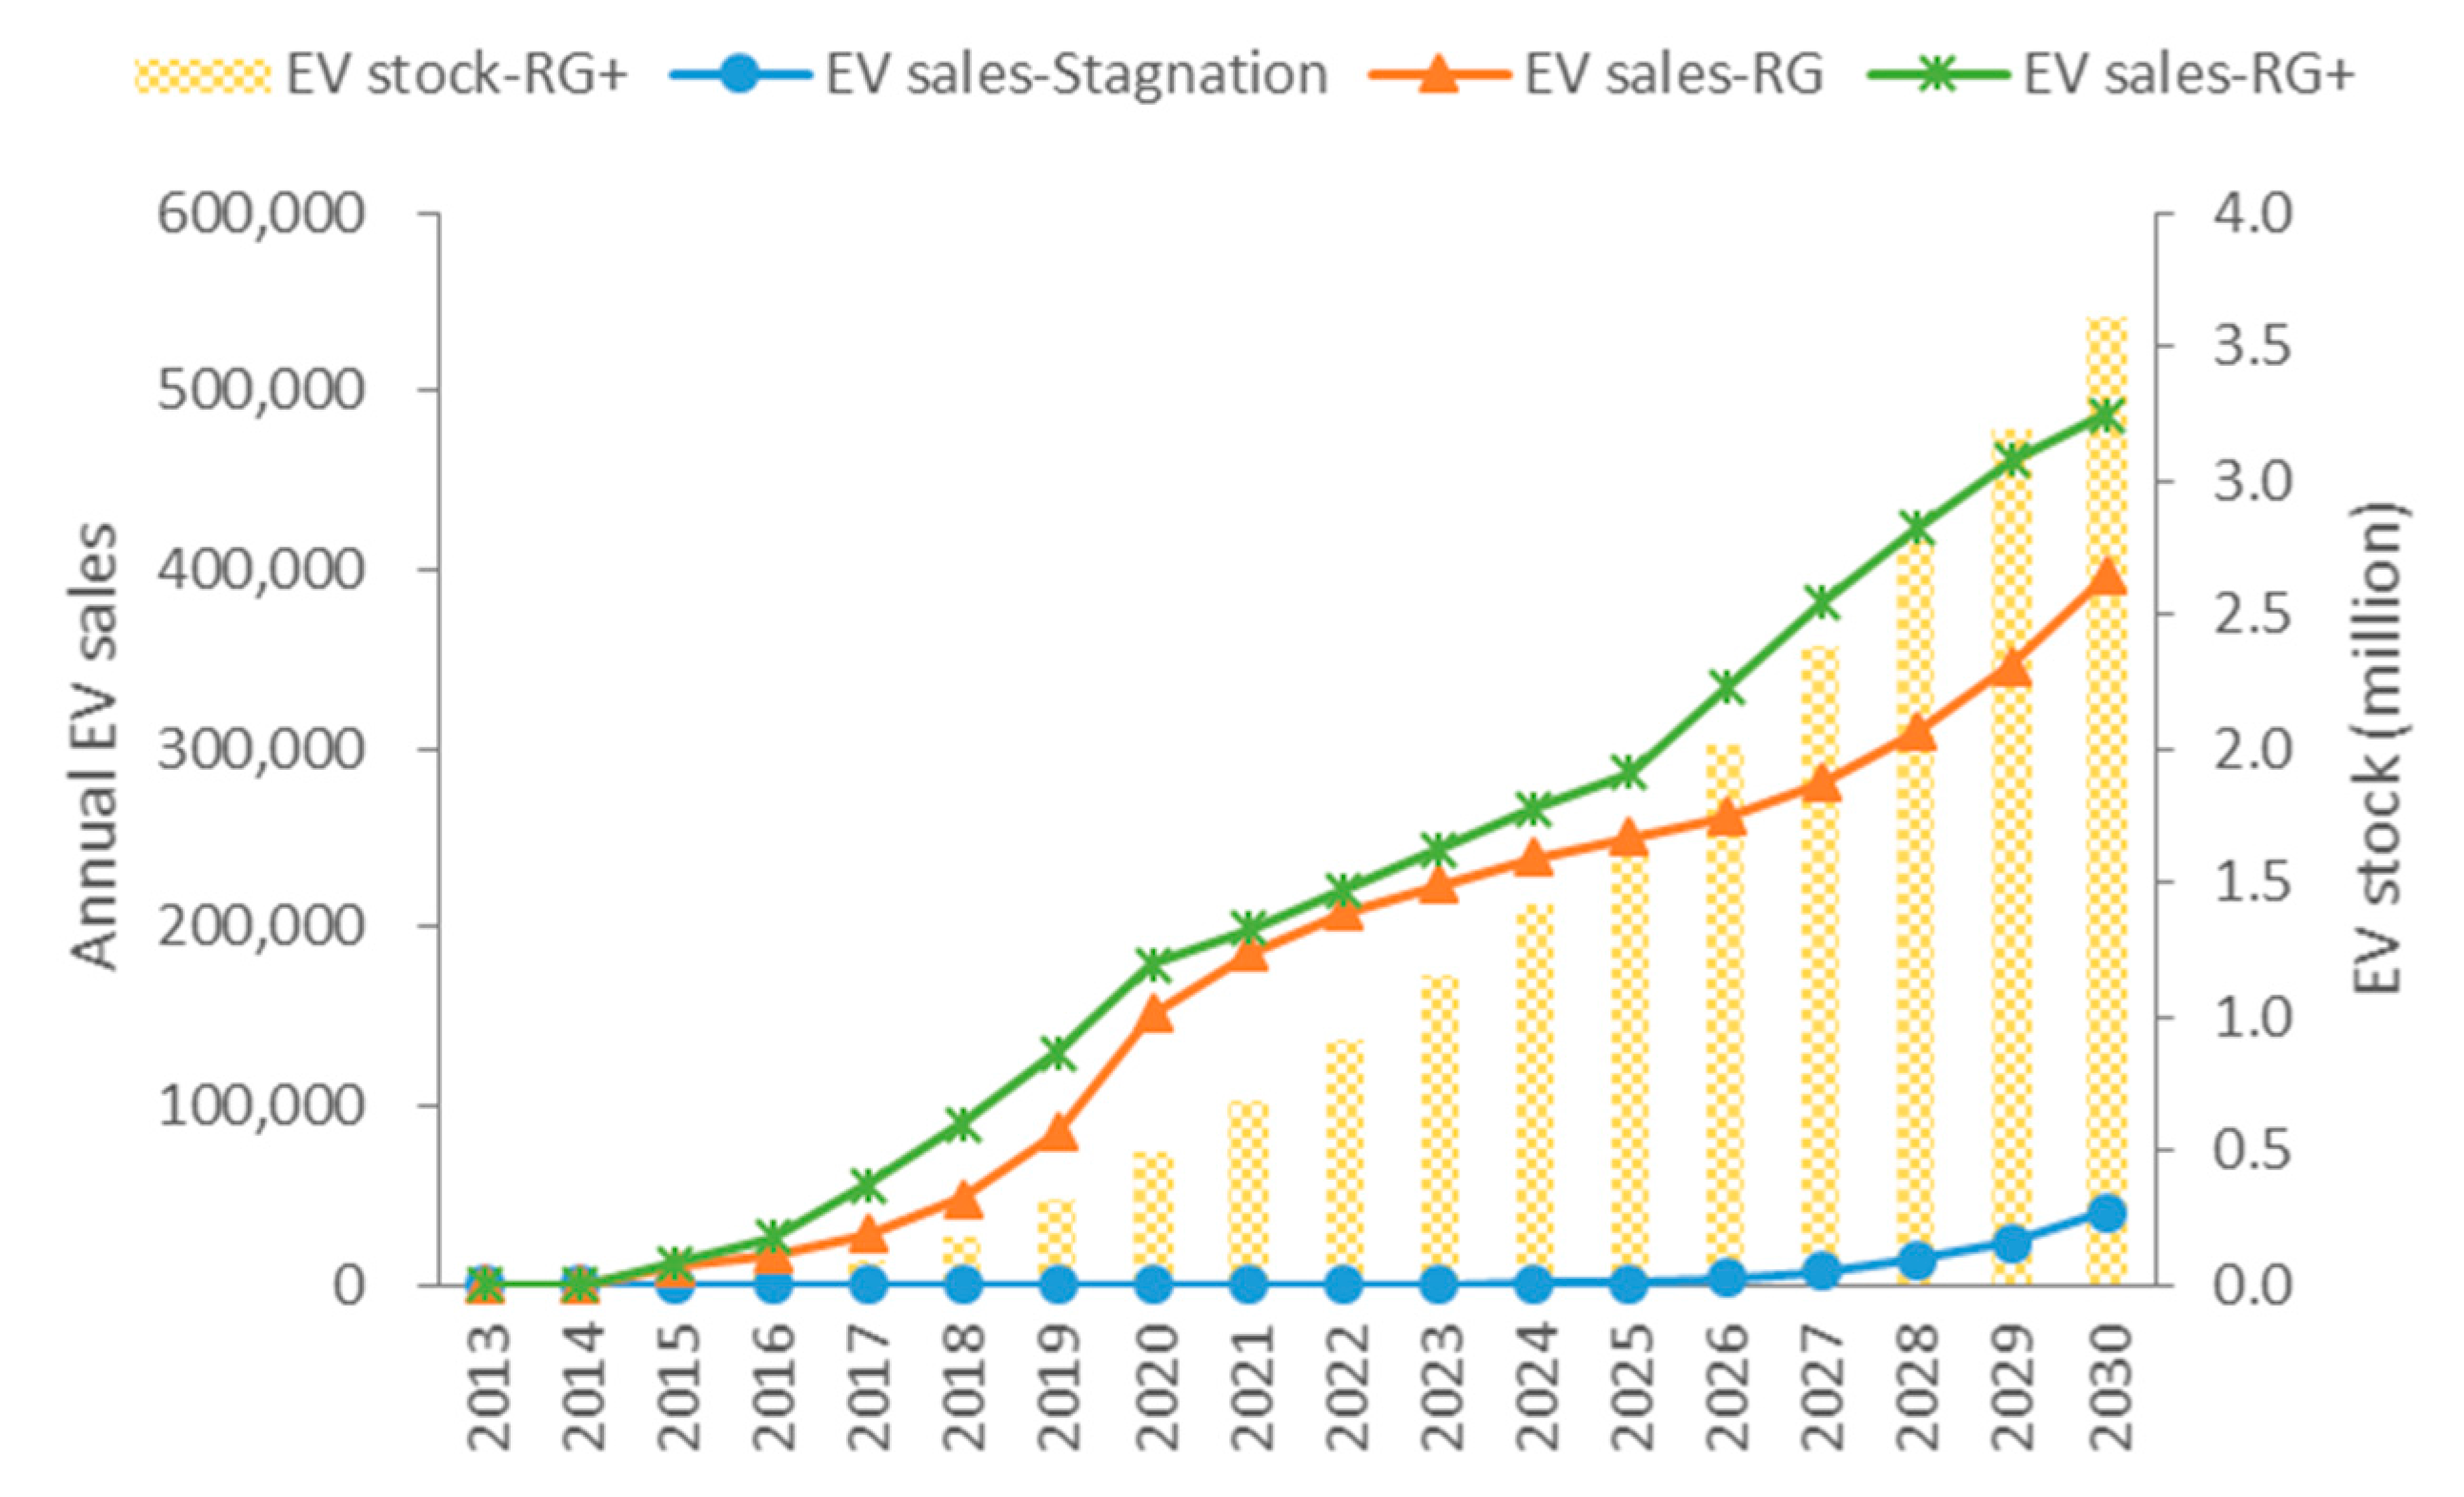
Under the Stagnation scenario, EVs account for 1.2% of the private passenger vehicle stock in 2030, which is still dominated by conventional vehicles. The EV stock is around 84,000. In the RG scenario, EVs account for one-fifth of the total stock by 2025. There are about 2.9 million EVs by 2030 (see Figure 3), which is 38% of the total stock. In the RG+ scenario, the EV stock surpasses 3.6 million by 2030 and nearly 47% of the total stock are EVs.
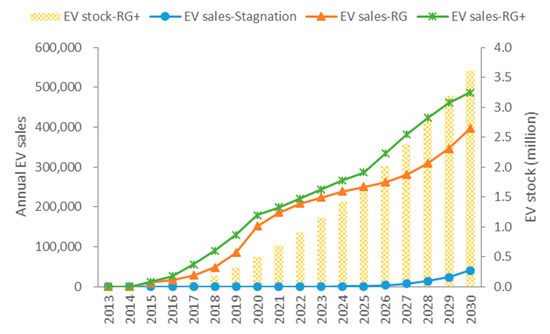
Figure 3.
Annual electric vehicle sales (left axis) and stock of electric vehicles (right axis) in Beijing in different scenarios. EV: electric vehicles; RG: rapid growth; RG+: rapid growth plus.
4.3. Gasoline Substitution and Electricity Consumption by Electric Vehicles
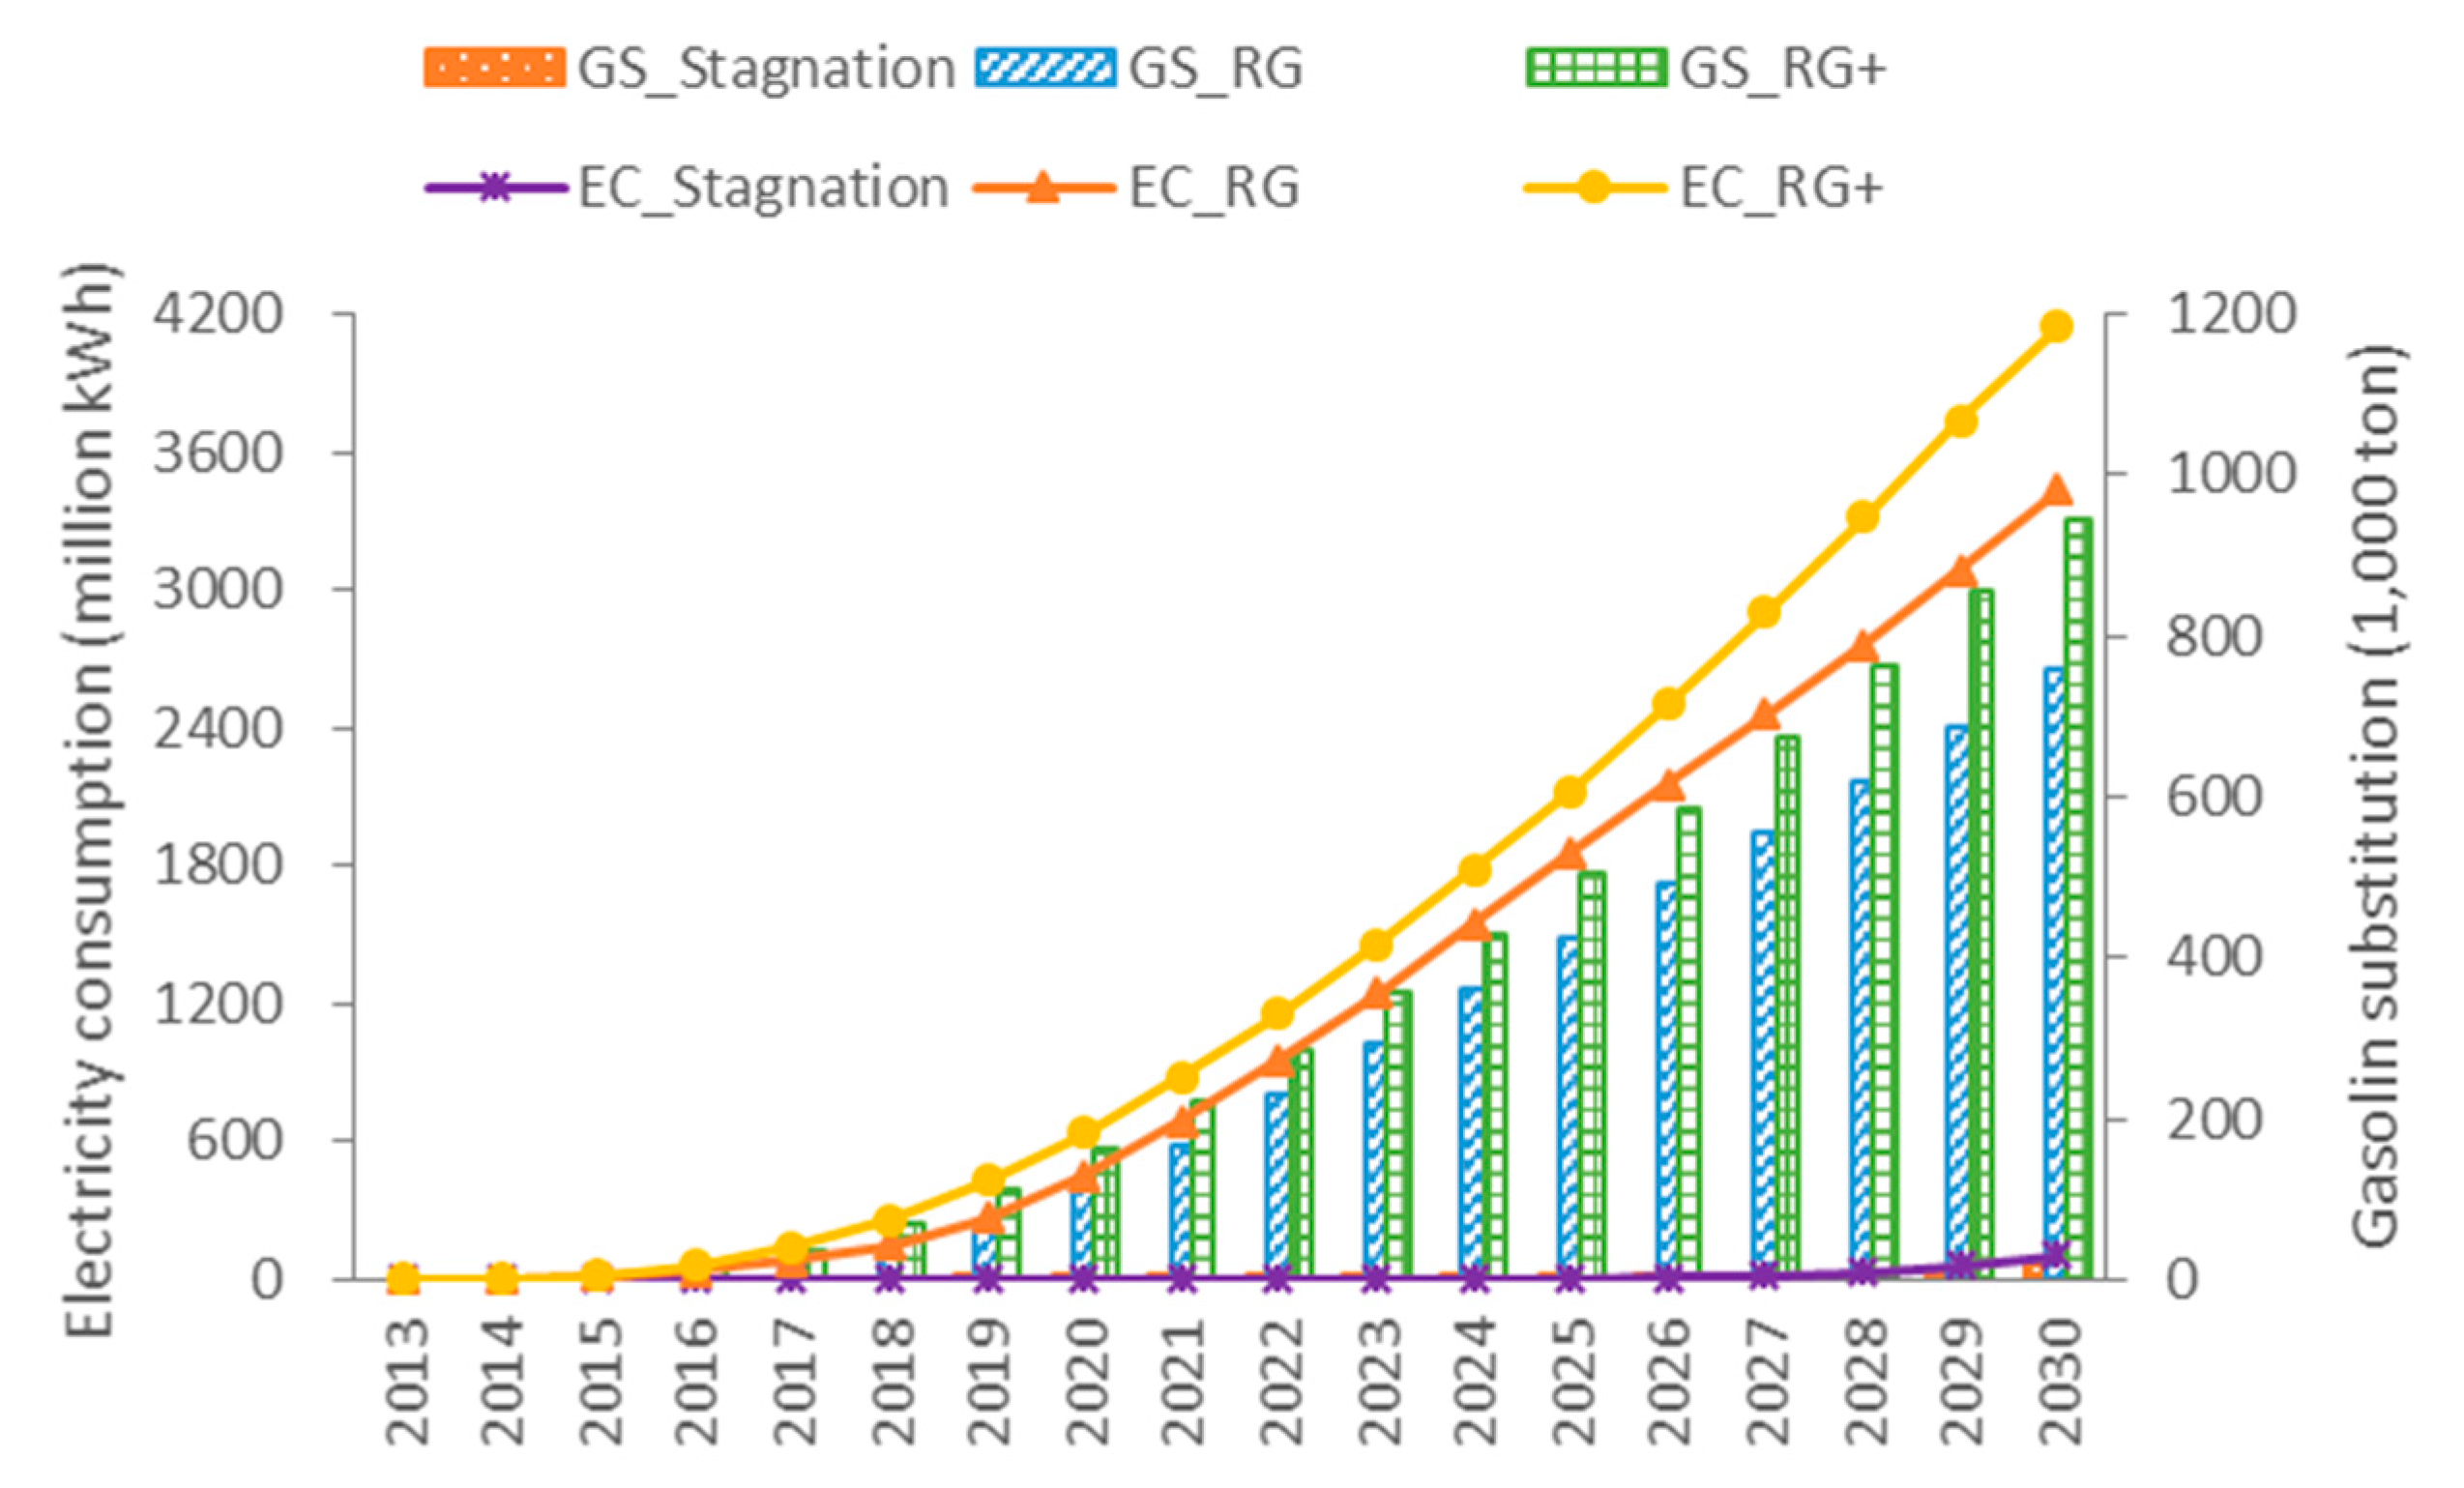
As shown Figure 4, in the Stagnation scenario, with very low electrification rate the energy consumption is still dominated by gasoline. EVs consume 103 million kWh electricity instead of 23,000 tons of gasoline. However, the RG and RG+ scenarios show that widespread adoption of EVs changes the energy consumption structure of the private passenger vehicle sector. In the RG scenario, EVs consume 3.4 billion kWh of electricity by 2030, replacing 760,000 tons of gasoline, which is equivalent to 17% of the total gasoline consumption of Beijing in 2014. In the RG+ scenario, with a larger adoption of EVs, 4.1 billion kWh electricity is consumed replacing 942,000 tons of gasoline, which equals one-fifth of the total gasoline consumption in 2014. By converting the units of gasoline and electricity to MJ, it can be found that EVs save 62%–72% energy to serve the same travel demand. In Wang’s research, the energy consumption per 100 km for EVs is 56%–83% lower than conventional vehicles. The difference is because the special driving cycle in Beijing adopted in the research, which is characterized by low speed, long idle times and severe speed changes, affects the energy consumption of conventional vehicles more than EVs [25].
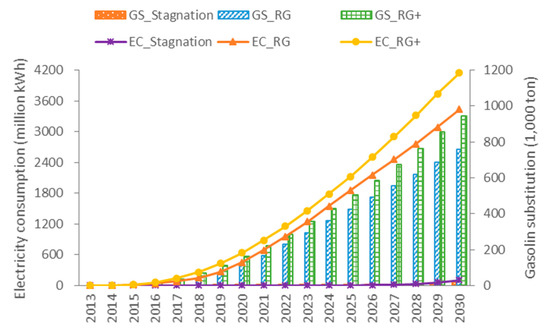
Figure 4.
Electricity consumption (left axis) and gasoline consumption saved by electric vehicles. GS: Gasoline substitution; EC: electricity consumption; RG: rapid growth; RG+: rapid growth plus.
4.4. CO2 Emission Reduction from Electric Vehicles
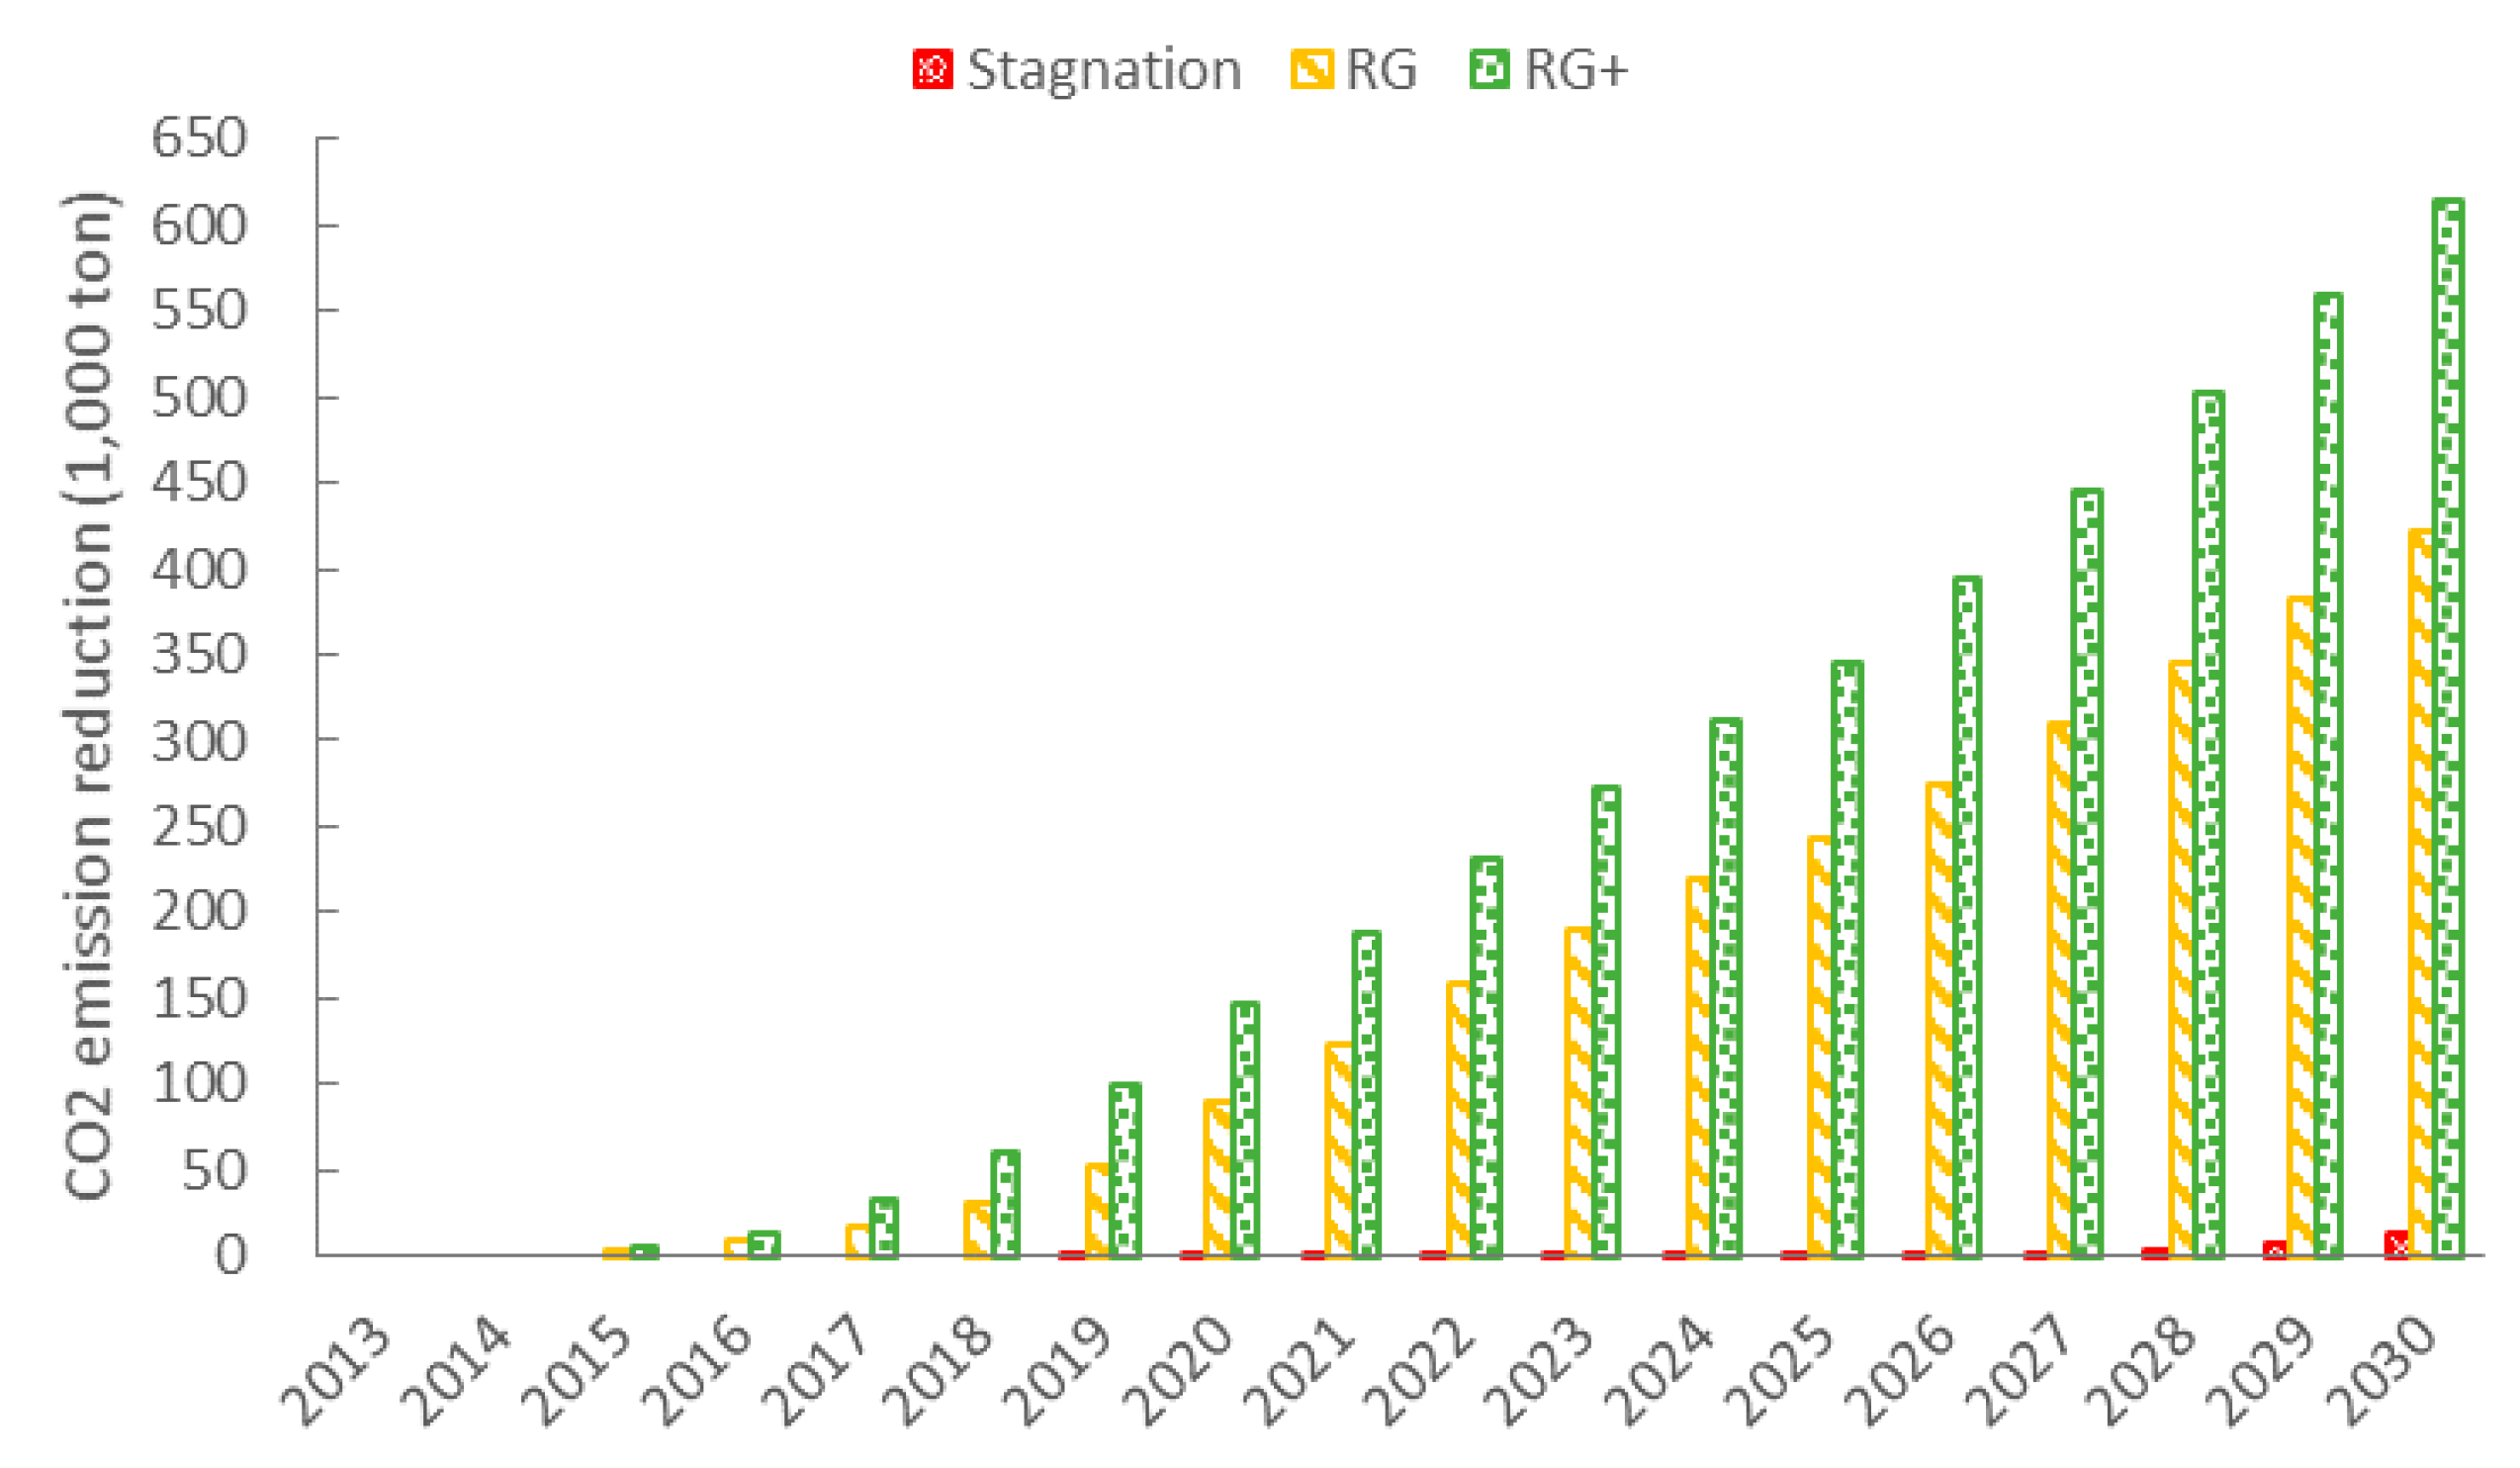
In the Stagnation scenario, due to low market share of EVs, CO2 emission reduction is insignificant, amounting to less than 13,000 tons in 2030. In the RG scenario, as illustrated in Figure 5, with larger adoption of EVs, the emission reduction effect is obvious. By 2030, 0.42 million tons of CO2 emissions are avoided due to the substitution of gasoline by electricity. In the RG+ scenario, 46% more CO2 emission reduction is achieved.
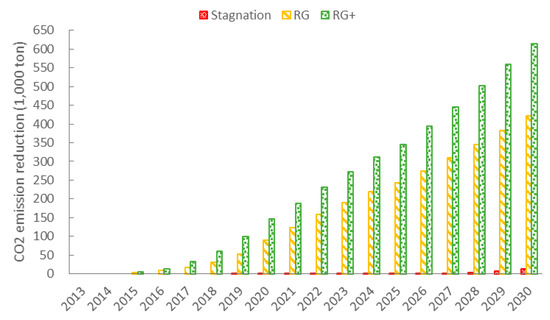
Figure 5.
Annual CO2 emission reduction by electric vehicles in Beijing under different scenarios. RG: rapid growth; RG+: rapid growth plus.
4.5. Discussion on Key Factors
There is a sharp difference in terms of the shares of EVs between the Stagnation scenario and the RG/RG+ scenarios. It is interesting to examine which factors led to such dramatic differences. Technological progress is the primary factor for the diffusion of EVs. The pace of technological change determines the price of battery systems and EVs, which are the biggest concerns for most consumers. This is consistent with the findings from Hou’s research that battery price is one of the most significant economic parameters in the total cost of vehicle ownership [26]. On the contrary, the cost of EVs will decline with the expansion of market size. After EVs reach cost parity with conventional vehicles, the advantage in fuel cost is gradually revealed. Technological progress also brings about better battery performance. With improvements of energy density, EVs can carry batteries of larger capacity under the premise of not increasing the curb weight, which means longer range and less range anxiety. With the extension of battery life, which is expected to be comparable to vehicle life, consumers don’t need to worry about extra expenses for battery exchange.
Charging availability is the second concern of consumers. Charging conditions affect the daily use of EVs directly. In the ideal situation, consumers drive EVs during the daytime and recharge the vehicle back home at night using cheaper electricity. However, consumers living in cities like Beijing don’t always have their own parking spaces at home, which means they may not be able to install home charging facilities. In this case, publically accessible charging facilities are essential to satisfy the charging demand. Meanwhile, in order to achieve long-distance travel, an intercity fast-charging network is necessary. The stock of publicly accessible chargers is growing fast in China, almost doubling in 2015 [23]. By the end of 2015, five charging stations and 21,000 charging outlets were built in Beijing, including 12,000 home charging outlets. According to the charging facility construction planning, 435,000 charging outlets will be deployed during 2016–2020, including 360,000 home charging outlets. With these charging facilities, the charging conditions will be greatly improved [27].
Another big concern of consumers is the fuel cost. With better fuel economy and lower energy price, EVs have an advantage in fuel cost per km traveled. The electricity price per kWh differs by charging modes. The electricity price for home charging is the cheapest, which is around 0.47 RMB/kWh in Beijing. For workplace charging, the price is about 2.5 times higher than home charging. The price for public charging carries a service fee, which is capped before 2020. The charging service fee at most public charging facilities in Beijing now is 0.4 RMB/kWh. Some shopping malls offer free charging to attract customers. The average electricity price for consumers depends on the mix of charging modes.
There are other factors that are not possible to control directly in our model, i.e., the grade of city contamination that might force policy makers to implement measures in favor of the adoption of EVs. These aspects are to some degree included indirectly through vehicle purchase price, charging convenience and fuel-energy cost in this study based on the assumption that local governments will make efforts to provide subsidy to reduce EV purchase and/or fuel cost and encourage charging infrastructure establishment.
4.6. Policy Implications
Policy supports play an important role in the diffusion of EVs. During the early stage when the cost of EVs is still high, subsidies lowers the purchase price directly, which attracts early adopters and helps to foster the early market. With increasing EV sales, a continuous subsidy will be a large financial expenditure. Hence, it’s necessary that the subsidies have an effective phase-out mechanism and there be other follow-on policies. The current subsidy policy will expire after 2020 and several policies are under discussion. A possible way is to implement EV credit management, like the zero-emission vehicle (ZEV) Program in California, which is a long-term supply-side mechanism for stimulating auto manufacturers to continue producing and selling EVs without subsidies. It’s shown in the results that tax breaks help the penetration of EVs after subsidies end, which reduces the purchase price to a certain extent.
In addition to reducing the purchase cost of consumers, policies, especially local government policies, can also focus on improving the usability of EVs. One direction is to reduce the operation cost of EVs, like differentiating charging for parking and tolls on roads to give preferential treatment to EVs. Another direction is to improve the convenience of driving EVs, such as providing dedicated parking lots, access to bus lanes, and better charging conditions.
In the case of Beijing, there are some special policies to control traffic and air pollution. Beijing has a ban-day policy to control the traffic on roads, which bans a portion of private vehicles during busy hours. Beijing also adopts a policy restricting the availability of license plates to control the growth of vehicle stock, which issues new license plates up to an annual quota through a lottery. Exempting EVs from ban-day policies and free license plates will make them more attractive and favor the adoption of EVs.
5. Conclusions
This research focuses on the penetration of electric vehicles (EVs) in the private passenger vehicle market and the impact of technological turnover in the vehicle fleet on the energy consumption structure and CO2 emissions of the passenger vehicle sector in Beijing. A Passenger Vehicle Consumer Choice Model was developed along with three scenarios to implement an estimation of EV market share and evaluation of changes in energy consumption and CO2 emissions in a case study of Beijing.
According to our estimation, without obvious technological advances and support policies, the market share of EVs will be less than 7% by 2030, and the energy structure will still be dominated by gasoline. Under fast technological progress, charging facility construction and the support from subsidies and tax breaks, which lead to significant cost reductions and better charging conditions, EVs will take 70% of the annual sales and account for nearly half of the total private passenger vehicle stock by 2030. These EVs will substitute 923,000 tons of gasoline, which is equivalent to 20% of the gasoline consumption by Beijing in 2014, with 3.2 billion kWh electricity and reduce 0.62 million tons of CO2.
The analysis shows that purchase price, charging convenience and fuel/energy cost are the top three concerns of consumers. When the purchase price becomes comparable to conventional vehicles determines the time to enter rapid growth period for EVs. Technological progress bringing about cost reduction and improvement of performance is the best driver for the diffusion of EVs. Charging conditions is also a primary driver by affecting consumers’ daily use of EVs directly. Another main driver is the average fuel cost which depends on the fuel economy of vehicles and the prices of energy.
Regarding the policies implemented, subsidies plays an important role in the early adoption of EVs by cutting down consumers’ purchase cost of EVs directly. Taking into account the financial burdens and long-term incentives, policies can shift to tax systems and supply-side incentives. It’s shown in the analysis that purchase tax relief can reduce consumers’ purchase cost and promote the penetration of EVs after subsidy phase-out. Policies on the supply side, such as EV credit management, can stimulate auto manufacturers to adjust the product mix structure spontaneously through setting requirements for EV share and establishing a system for credit verification and trading.
Some local policy instruments aimed at reducing the operation cost and improving the convenience of driving EVs may have big influences on consumer choice. In Beijing, parking fees are high and traffic congestion occurs frequently. Restriction measures are adopted to control the growth of vehicle population and the use of conventional vehicles. In this situation, differential management policies can favor the adoption of EVs. Policies on the supply side discussed before are another direction to replace subsidies as long-term incentives. While worthy of further discussion, these policies are beyond the scope of this research.
Acknowledgments
This project was co-sponsored by the National Natural Science Foundation of China (71690240, 71690244, 71373142 and 71673165) and International Science & Technology Cooperation Program of China (2016YFE0102200). Lin Zhenhong of the US Oakridge National Lab is thanked for his great help in the modelling.
Author Contributions
Xunmin Ou and Xiliang Zhang conceived and designed the research framework; Qian Zhang performed the model development and analyzed the data; Qian Zhang, Xunmin Ou and Xiaoyu Yan wrote the paper.
Conflicts of Interest
The authors declare no conflict of interest.
References
- Department of Energy Statistics, National Bureau of Statistics, China. China Energy Statistical Yearbook; China Statistics Press: Beijing, China, 2015.
- International Energy Agency. CO2 Emissions from Fuel Combustion Highlights 2015; International Energy Agency: Paris, France, 2015. [Google Scholar]
- International Energy Agency. Tracking Clean Energy Progress 2016; International Energy Agency: Paris, France, 2016. [Google Scholar]
- National Bureau of Statistics, CHINA. Data of Vehicle Ownership. Available online: http://data.stats.gov.cn/easyquery.htm?cn=C01&zb=A0G0J&sj=2014 (accessed on 22 December 2016).
- Sun, X.; Qian, X.; Jiang, X. Domestic and International Oil and Gas Industry Development Report in 2015; Petroleum Industry Press: Beijing, China, 2016. [Google Scholar]
- Trigg, T.; Telleen, P.; Boyd, R.; Cuenot, F.; D’Ambrosio, D.; Gaghen, R.; Gagné, J.; Hardcastle, A.; Houssin, D.; Jones, A. Global EV Outlook: Understanding the Electric Vehicle Landscape to 2020; International Energy Agency: Paris, France, 2013. [Google Scholar]
- The State Council of China. Energy-Efficient and New Energy Vehicle Industry Plan (2012–2020); The State Council of China: Beijing, China, 2012.
- Consultative Committee on National Manufacturing Upgrade Strategy. Made in China 2025 Key AreasTechnology Roadmap; Ministry of Industry and Information Technology of the People’s Republic China: Beijing, China, 2015.
- China Automotive Technology & Research Center. Annual Report on New Energy Vehicle Industry in China (2016); Social Scince Academic Press: Beijing, China, 2016. [Google Scholar]
- Train, K.E. Discrete Choice Methods with Simulation; Cambridge University Press: Cambridge, UK, 2009. [Google Scholar]
- Greene, D.L. TAFV Alternative Fuels and Vehicles Choice Model Documentation; Center for Transportation Analysis, Oak Ridge National Laboratory: Oak Ridge, TN, USA, 2001.
- Hao, H.; Wang, H.; Ouyang, M.; Cheng, F. Vehicle survival patterns in China. Sci. China Technol. Sci. 2011, 54, 625–629. [Google Scholar] [CrossRef]
- Lang, J.; Cheng, S.; Zhou, Y.; Zhao, B.; Wang, H.; Zhang, S. Energy and environmental implications of hybrid and electric vehicles in China. Energies 2013, 6, 2663–2685. [Google Scholar] [CrossRef]
- Ou, X.; Zhang, X. Life-Cycle Analysis of Automotive Energy Pathways in China; Tsinghua University Press: Beijing, China, 2011. [Google Scholar]
- Xiong, W. Development of the China Renewable Electricity Planning and Operations Model and Its Application. Ph.D. Thesis, Tsinghua University, Beijing, China, 2016. [Google Scholar]
- Virdis, M.R. Energy to 2050: Scenarios for a Sustainable Future; Organization for Economic: Paris, France, 2003. [Google Scholar]
- International Energy Agency. World Energy Outlook 2016; International Energy Agency: Paris, France, 2016. [Google Scholar]
- Su, W. Enhanced Actions on Climate Change: China’s Intended Nationally Determined Contributions; National Development and Reform Commission of the People’s Republic China: Beijing, China, 2015.
- Lu, H. Sustainable Urban Mobility; The Institute of Transportation Engineering at Tsinghua University (THU-ITE): Beijing, China, 2016. [Google Scholar]
- Innovation Center for Energy and Transportation. Annual Report on China Passenger Vehicle Fuel Consumption Development 2016; Innovation Center for Energy and Transportation: Beijing, China, 2016. [Google Scholar]
- Beijing Transport Institute. Annual Report on Trasport Development in Beijing 2015; Beijing Transport Institute: Beijing, China, 2015. [Google Scholar]
- Nykvist, B.; Nilsson, M. Rapidly falling costs of battery packs for electric vehicles. Nat. Clim. Chang. 2015, 5, 329–332. [Google Scholar] [CrossRef]
- International Energy Agency. Global EV Outlook 2016: Beyond one Million Electric Cars; International Energy Agency: Paris, France, 2016. [Google Scholar]
- PRTM Management Consultants, Inc. The China New Energy Vehicles Program-Challenges and Opportunities; PwC China: Beijing, China, 2011. [Google Scholar]
- Wang, H.; Zhang, X.; Ouyang, M. Energy consumption of electric vehicles based on real-world driving patterns: A case study of Beijing. Appl. Energy 2015, 157, 710–719. [Google Scholar] [CrossRef]
- Hou, C.; Wang, H.; Ouyang, M. Battery sizing for plug-in hybrid electric vehicles in Beijing: A TCO model based analysis. Energies 2014, 7, 5374–5399. [Google Scholar] [CrossRef]
- Beijing Municipal Commission of Development and Reform. Beijing Electric Vehicle Charging Infrastructure Special Plan (2016–2020); Beijing Municipal Commission of Development and Reform: Beijing, China, 2016.
© 2017 by the authors. Licensee MDPI, Basel, Switzerland. This article is an open access article distributed under the terms and conditions of the Creative Commons Attribution (CC BY) license ( http://creativecommons.org/licenses/by/4.0/).

