
Mapping Urban Heat Demand with the Use of GIS-Based Tools

AGH University of Science and Technology, Faculty of Energy and Fuels, Al. Adama Mickiewicza 30, Krakow 30-059, Poland
*
Author to whom correspondence should be addressed.
Energies 2017, 10(5), 720; https://doi.org/10.3390/en10050720
Submission received: 21 March 2017
/
Revised: 8 May 2017
/
Accepted: 10 May 2017
/
Published: 19 May 2017
Abstract
:This article presents a bottom-up approach for calculation of the useful heat demand for space heating and hot water preparation using geo-referenced datasets for buildings at the city level. This geographic information system (GIS) based approach was applied in the case study for the city of Krakow, where on the one hand the district heat network is well developed, while on the other hand there are still substantial number of buildings burning solid fuels in individual boilers and stoves, causing air pollution. The calculated heat demand was aggregated in the grid with 100 m × 100 m spatial resolution to deliver the heat map depicting the current situation for 21 buildings types. The results show that the residential buildings, in particular one- and multi-family buildings, have the highest share in overall demand for heat. By combining the results with location of the district heat (DH) network, the potential areas in its close vicinity that have sufficient heat demand density for developing the net were pointed out. Future evolution in heat demand for space heating in one-family houses was evaluated with the use of deterministic method employing building stock model. The study lays a foundation for planning the development of the heating system at the city level.
1. Introduction
Energy system planning plays a key role in urban development to ensure a reliable supply of clean energy. In countries with cold winters such as Poland, the largest share in final energy consumption in the residential sector is the use of energy for space heating. Broad use of coal and wood as fuel in low efficiency and obsolete boilers results in pollutant emissions from low stacks and consequently very high air pollution [1]. Providing proper measures, like fuel and/or technologies switches with thermo-modernization of buildings, contributes to emission reduction of both air pollutants and greenhouse gases (GHG). Therefore, it is important to propose efficient tools for assisting heat system planning in urban areas. For example, [2] used MATLAB and Modelica models to assist building energy management systems to enhance efficiency in heating [3,4,5] recreated specific buildings in TRNSYS energy simulation model to evaluate the potential of retrofit strategies.
However, to develop an energy plan at a city level, a general energy situation in a given area has to first be recognized. More specifically, in the case of heat systems, this means to analyze past, present, and prospective demands for space heating and domestic hot water. The energy intensity resulting from conditions of buildings that vary widely is one of the major factors. Moreover, the dynamics of urban development indicating new buildings and residents makes the situation even more complex. An increasing number of computational methods are used for these types of planning. The use of geographic information system (GIS) significantly improves the analysis and makes it possible to map the spatial distribution of useful heat demand more accurate and much easier to interpret for stakeholders and investors at all levels related to the local heat market. Several studies were accomplished on a national or broader level to estimate useful heat demand. They mainly used general energy statistics and applied population distribution and land use to provide spatially gridded values [6,7,8]. Nevertheless, this kind of assessment is not accurate enough on a city level. For mapping heat demand in a city, [9] used multi-layer functions in GIS tools to identify “heat zones.” After producing a base map with various building types, heat demand was allocated based on dwellings and population density for domestic usage and on gas consumption for other building types. By comparing the heat sources and sinks, six heat zones were identified, and different stages of development recommendation were proposed. Some studies used the concept of building stocks for mapping heat demand. The national building typologies were developed under the TABULA project in which residential buildings were divided into several stocks based on their function and construction period [10]. In each stock, there was one representative building with its characteristics noted in detail. In [11], the first step for urban heat system optimization was to locate heat demand by building stock concept before being gridded for energy system modelling. In [12], the heat loss in district heating (DH) distribution pipes were evaluated employing GIS. In [13], Turin was used as a case study city. The heat consumption was calculated for each building as function of surface to volume ratio and construction period and calibrated with real data from 21 buildings of energy consumption, external temperatures and an average value of percentage for the heated volume in building blocks. If some available data were aggregated, [14] proposed a statistical downscaling approach assisting GIS analysis to disaggregate from post-code level to individual dwellings. In addition to heat demand assessment, [15] also demonstrated the application of GIS to retrofitting measures and renewable energy sources (RES) potentials. Nonetheless, the accuracy and resolution depend on the available data. For instance, Denmark has a detailed national database of buildings that has been applied to several heat atlases and national/regional heat saving potential assessment [16,17,18]. In spite of this, the highest principle of developing a local heat map is to adopt the local conditions and the available data.
A specific feature of the Polish centralized power sector is the large share of electricity produced in cogeneration, which is close to 20%. This is quite exceptional compared to other Member States. Polish DH networks covers a large share of the thermal needs in the cities. Centralized heating systems cover on average 70% of their heat demand, so that about 12 million Polish citizens are supplied by the centralized DH systems. Krakow is a good example: the current network with a length of 830 km cover substantial city area making DH operator Miejskie Przedsiębiorstwo Energetyki Cieplnej S.A. (MPEC) the main heat supplier in the city [19]. Regardless, Krakow is one on the most polluted cities in the EU [20]. However, for the last few years, Krakow has been the leading city in the introduction of measures aimed at counteracting “low stack emissions” in Poland. In 2016, the Government Office in Krakow proposed the antismog resolution with the aim of banning the use of solid fuels in Krakow staring from 1 September 2019. In this case study, we developed a customized heat map for further planning of heat system expansion to mitigate air pollution. This study lays a foundation for planning the development of smart district heat systems at the city level that are necessary in the future to complement to increase the flexibility of the power system by managing excess electricity generated from renewable energy sources [21].
Despite the current absence of a complete database and consistent records regarding energy intensity or energy consumption of each individual building, it is necessary to collect, integrate, and harmonize the available spatial data characterizing the building structures as well as energy infrastructure. The main aim of this work was therefore to develop a method for estimating the heat demand in buildings and apply it to deliver a spatially gridded heat demand map for Krakow. A bottom-up approach was proposed from the demand side, using limited spatial data in a systematic way, which can be applied to other cities. Most importantly, the resulting maps are concise and clearly deliver the current heat situation for different building types and locations in a city, which makes a significant contribution to improving the process of energy development planning. Methods for short- and mid-term projections of useful heat demand are also proposed. The former uses available spatial dataset containing information on buildings under construction and buildings that are planned for construction within next three years. The latter employs a building stock model and covers the period up to 15 years.
2. Materials and Methods
The description of the methodology starts with a brief introduction of the used software, followed by presentation of the required input data. Finally, the heat demand calculation method is described. This study uses Krakow as an example, but these methods can be applied in other cities.
2.1. Tools
The main tools used in the study were Quantum GIS (QGIS) and PostgreSQL (Postgres). Both tools are free, have friendly graphic interphases, and their online communities are active, which is beneficial and supportive for researchers in all fields. QGIS allows users to browse, view, edit, and create vector data, raster maps and databases in a variety of formats, including shapefile format and spatial data for PostgreSQL/PostGIS. Postgres is a server relational database compliant with the structured query language (SQL). The extension PostGIS allows direct data transfer between PostgreSQL and QGIS and vice versa. In this study, QGIS was used for spatial editing and calculation and displaying the results. PostgreSQL was used for storing the data and massive batch calculations.
2.2. Required Inputs
The most critical input for the analysis were the geo-referenced data on buildings. This data should include, at least, boundaries of buildings, utility type of the building, and number of floors. Additionally, datasets describing boundaries of the city and its districts help not only in visualization of the results but also in calculations. Finally, the energy intensity of buildings is required as well. The values used are presented in more details in Section 2.4.2. In case of this study, the data were provided mainly by the Krakow Government Office. As information needed was kept in different datasets, some harmonization work in advance was therefore necessary to prepare the final database. This database contained information on building level, distinguishing among 21 building function categories (including four types of residential buildings). It contained also number of floors, address and the installed heating technologies.
2.3. Grid Characteristics
The calculation results are shown in the grid of spatial resolution 100 m × 100 m covering the entire city. Such aggregation was necessary in order to maintain residents’ anonymity and also to display results in a clear format. The first step before the actual calculation of heat demand was to clip the buildings with the gridlines by the geoprocessing tool so the demand of buildings can be displayed by grid cell proportional to the areas of the buildings taken up by the cells. In this study, the grid lines fit with another existing project on heating technologies inventory that consists of 33,414 one-hectare-cells.
2.4. Description of Heat Demand Calculation Method
The nomenclatures, superscripts, and subscripts are listed in Nomenclature.
2.4.1. Main Equation
The total heated area of the building was calculated according to the following formula:
For each zone s S, building type t T and for every energy service u U, specific demand coefficients were applied. Useful heat demand for each building and energy service was calculated according to the following equations:
Then, the heat demand for each energy service was summed up in each cell k for each type of building by the formula,
Finally, overall heat demand including all energy services in each cell was calculated according to the formula,
2.4.2. Heat Demand Coefficients
The ratios between external and heated floor areas (cf) as well as the annual heat demand coefficients for each type of energy services and buildings were taken from [22]. For instance, the values of coefficient used in case of residential buildings, which were critical, are presented in Table 1. Moreover, Krakow as a city experienced different development stages, and districts have been developed variously within the city. Thus, some balance zones were identified. A balance zone was defined as the areas with relative homogeneity of energy intensity of buildings within while distinctive from another zone due to historical reasons. In addition to the non-specified areas, two balance zones were noted by different specific heat demands for multi-family buildings due to different stages of city development (thus different U-values of building) as follows:
- post-war multi-family buildings: buildings usually built between 1945–1965 year in the traditional technology;
- residential blocks: apartment blocks technologies prefabricated usually built since the mid-60s.
2.5. Calculation of the Final Energy Consumption
2.6. Description of Heat Demand Forecasting Method
Forecasts of annual heat demand were split into two types depending on the forecasting period.
2.6.1. Short-Term Projections
Short-term projections accounting for the period of up to three years made use of the available spatial dataset containing information on buildings under construction and buildings that are planned for construction during this time. Since the planned building boundaries were available in spatial dataset, the methodology applied was similar to that applied to existing buildings. An area located at the south-west part of the city was demonstrated in which the expected new buildings would be multi-family houses. The specific energy demand for heating for these expected buildings was assumed to meet the national requirement 73.8 kWh/(m2⋅year) [10].
2.6.2. Mid-Term Projections
The approach proposed for mid-term demand projections for the next 15 years is demonstrated in detail for one-family buildings (OFH). The starting point was the total existing heated area Af of in the base year i.e., 2015. In Table 1, the average specific heat demand coefficients used for different buildings types are presented. However, one should note that heat demand can vary greatly in the building stock of a given type due to different materials used in the past for buildings construction and insulation (modern materials have much lower U-values of materials and building’s elements, which at present are determined by the law), different building design, different internal and external heat gains, different behaviors of residents, and different requirements in terms of thermal comfort. Often, building stock models (BSM) associate specific heat demand coefficients with the construction year of the building [24]. However, for buildings in Krakow, such data is not included in the available spatial datasets. In this study similarly as in [25] it was assumed that the useful heat demand variations of buildings can be characterized by normal distribution. In our study, we used normal distribution with the mean equal to 184.1 kWh/(m2⋅year) (Table 1). The standard deviation was calibrated to reach the national minimum requirement equal to circa 85 kWh/(m2⋅year) within 3σ (Figure 1a).
The total heated area of buildings was then split into eight energy intensity classes with the use of cumulative distribution function. The sum of frequency of all classes is unity.
To estimate future heat demand for existing buildings, several factors are usually considered as described in [26]. In this study, we took into account annual thermo-modernization rates of the existing buildings, which varied for different energy intensity groups as presented in Figure 1b. The logic behind assuming higher refurbishment rates for buildings with higher heat demand was that those are in majority older buildings. On the other hand, buildings belonging to class I and II are modern and unlikely to be thermo-modernized within next 15 years. The exact percentage of the buildings undergoing thermo-modernization is not monitored thoroughly in Krakow. For the Organisation for Economic Co-operation and Development (OECD) countries, building renovation rates are often less than 1% per year [26]. In this study, the average weighted (by area) renovation rate is 1.8% per year. For each energy intensity class, the average useful heat demand was used (Figure 1b). In Poland, energy renovations typically results in 20–40% energy intensity improvement [10].
Heat demand projection for useful heat for space heating for existing buildings is then calculated using the following equation:
Regional statistics report demolishing rate of existing building equal to zero for the last four years. Therefore, for simplicity, it was assumed that demolishing rate will be maintained at zero in the near future. The decrease in heat demand due to thermo-modernization of existing buildings could be partly compensated by additional heat demand of new buildings. According to regional statistics [27], the average new useful floor area additions in residential buildings in the period 2010–2015 relative to overall floor area was circa 2%. This rate of new area addition was used in demand projections. Useful heat demand for space heating of new buildings will also decrease in future in line with [28]. Therefore, it was assumed that the energy heat demand coefficient will be 69 kWh/(m2⋅year) till 2020 and 52.1 kWh/(m2⋅year) thereafter. Finally, moving forward, the total useful heat demand for space heating of existing and new buildings was calculated with the use of the following equation:
3. Results and Discussion
3.1. Base Year Situation
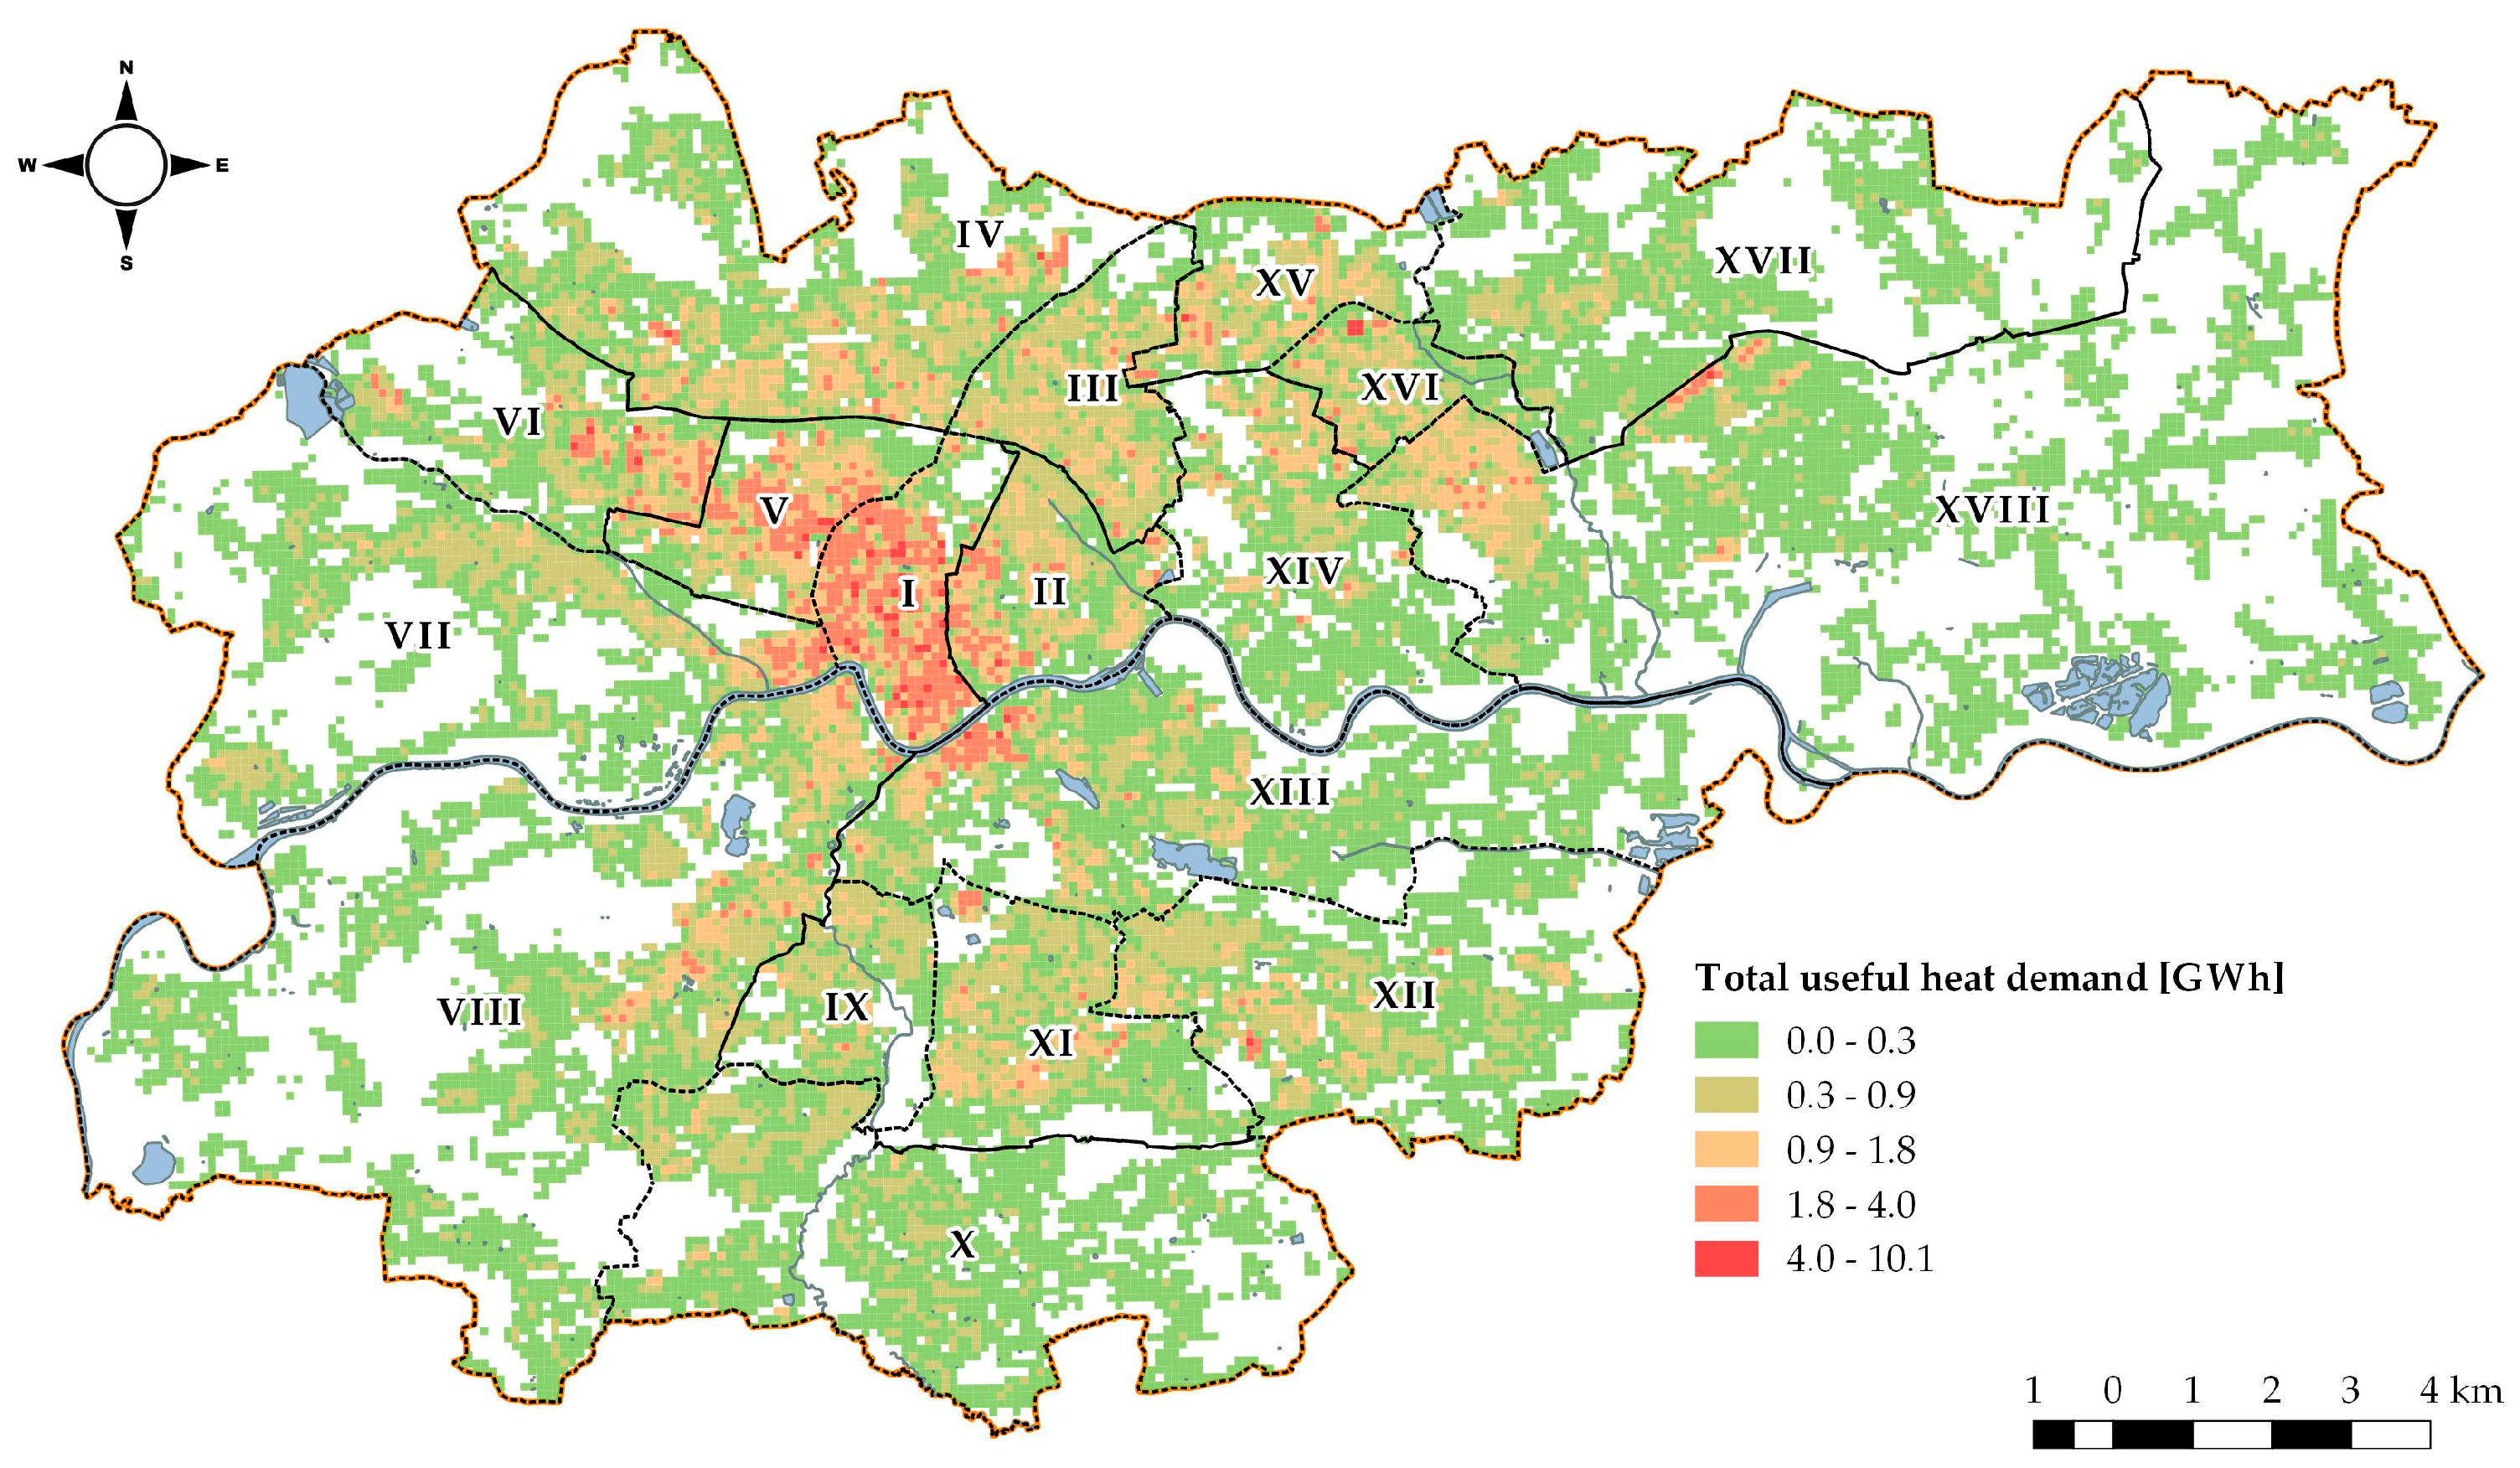
A spatially-gridded useful heat demand distribution for Krakow for 2015 is presented in Figure 2. The grid has 100 m × 100 m spatial resolution and each cell contains the information which can be viewed by building type, type of heat demand (space heating, ventilation, hot water) in GWh per year and build up area in m2. Such grid was selected as it is consistent with the one used in ongoing projects related to air pollution in Krakow i.e., the Monit-Air and LIFE integrated project.
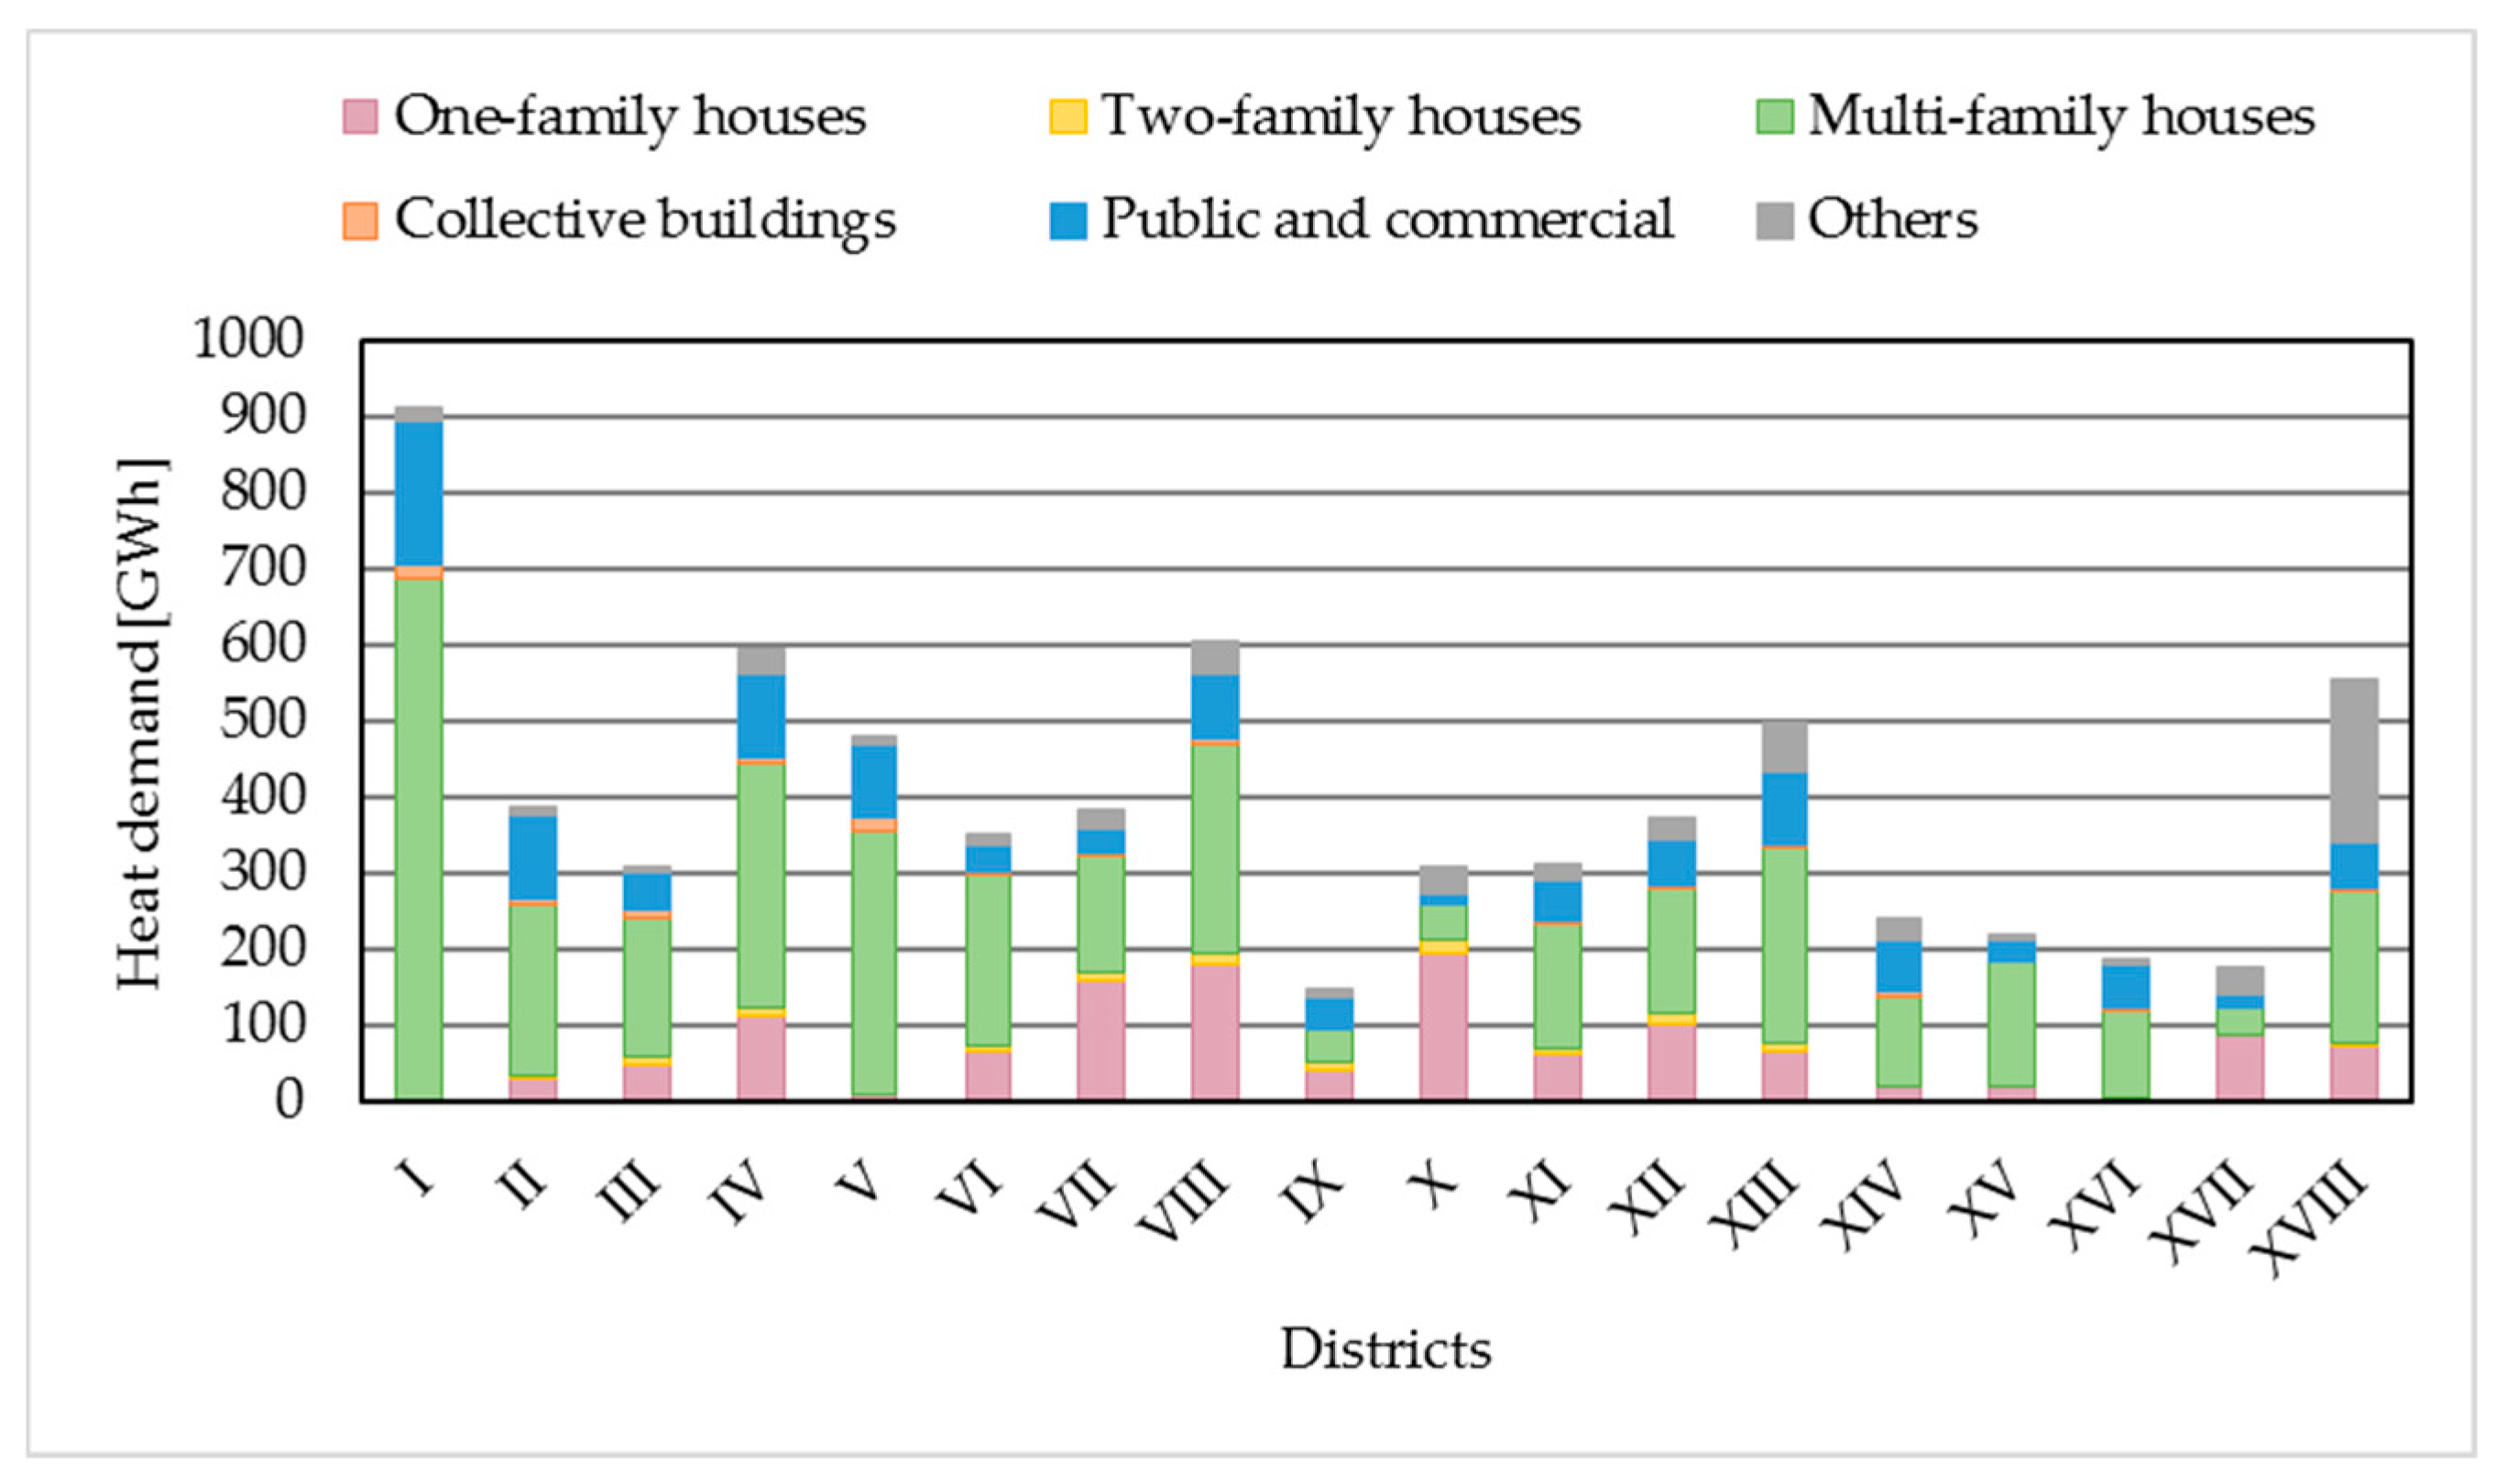
The results displayed by administrative units is useful for the local stakeholders to identify the focus for different districts. The breakdown of demand by building types in each district shows that residential buildings have the highest share in overall heat demand, among which one-family houses and multi-family houses have the biggest share, as depicted in Figure 3.
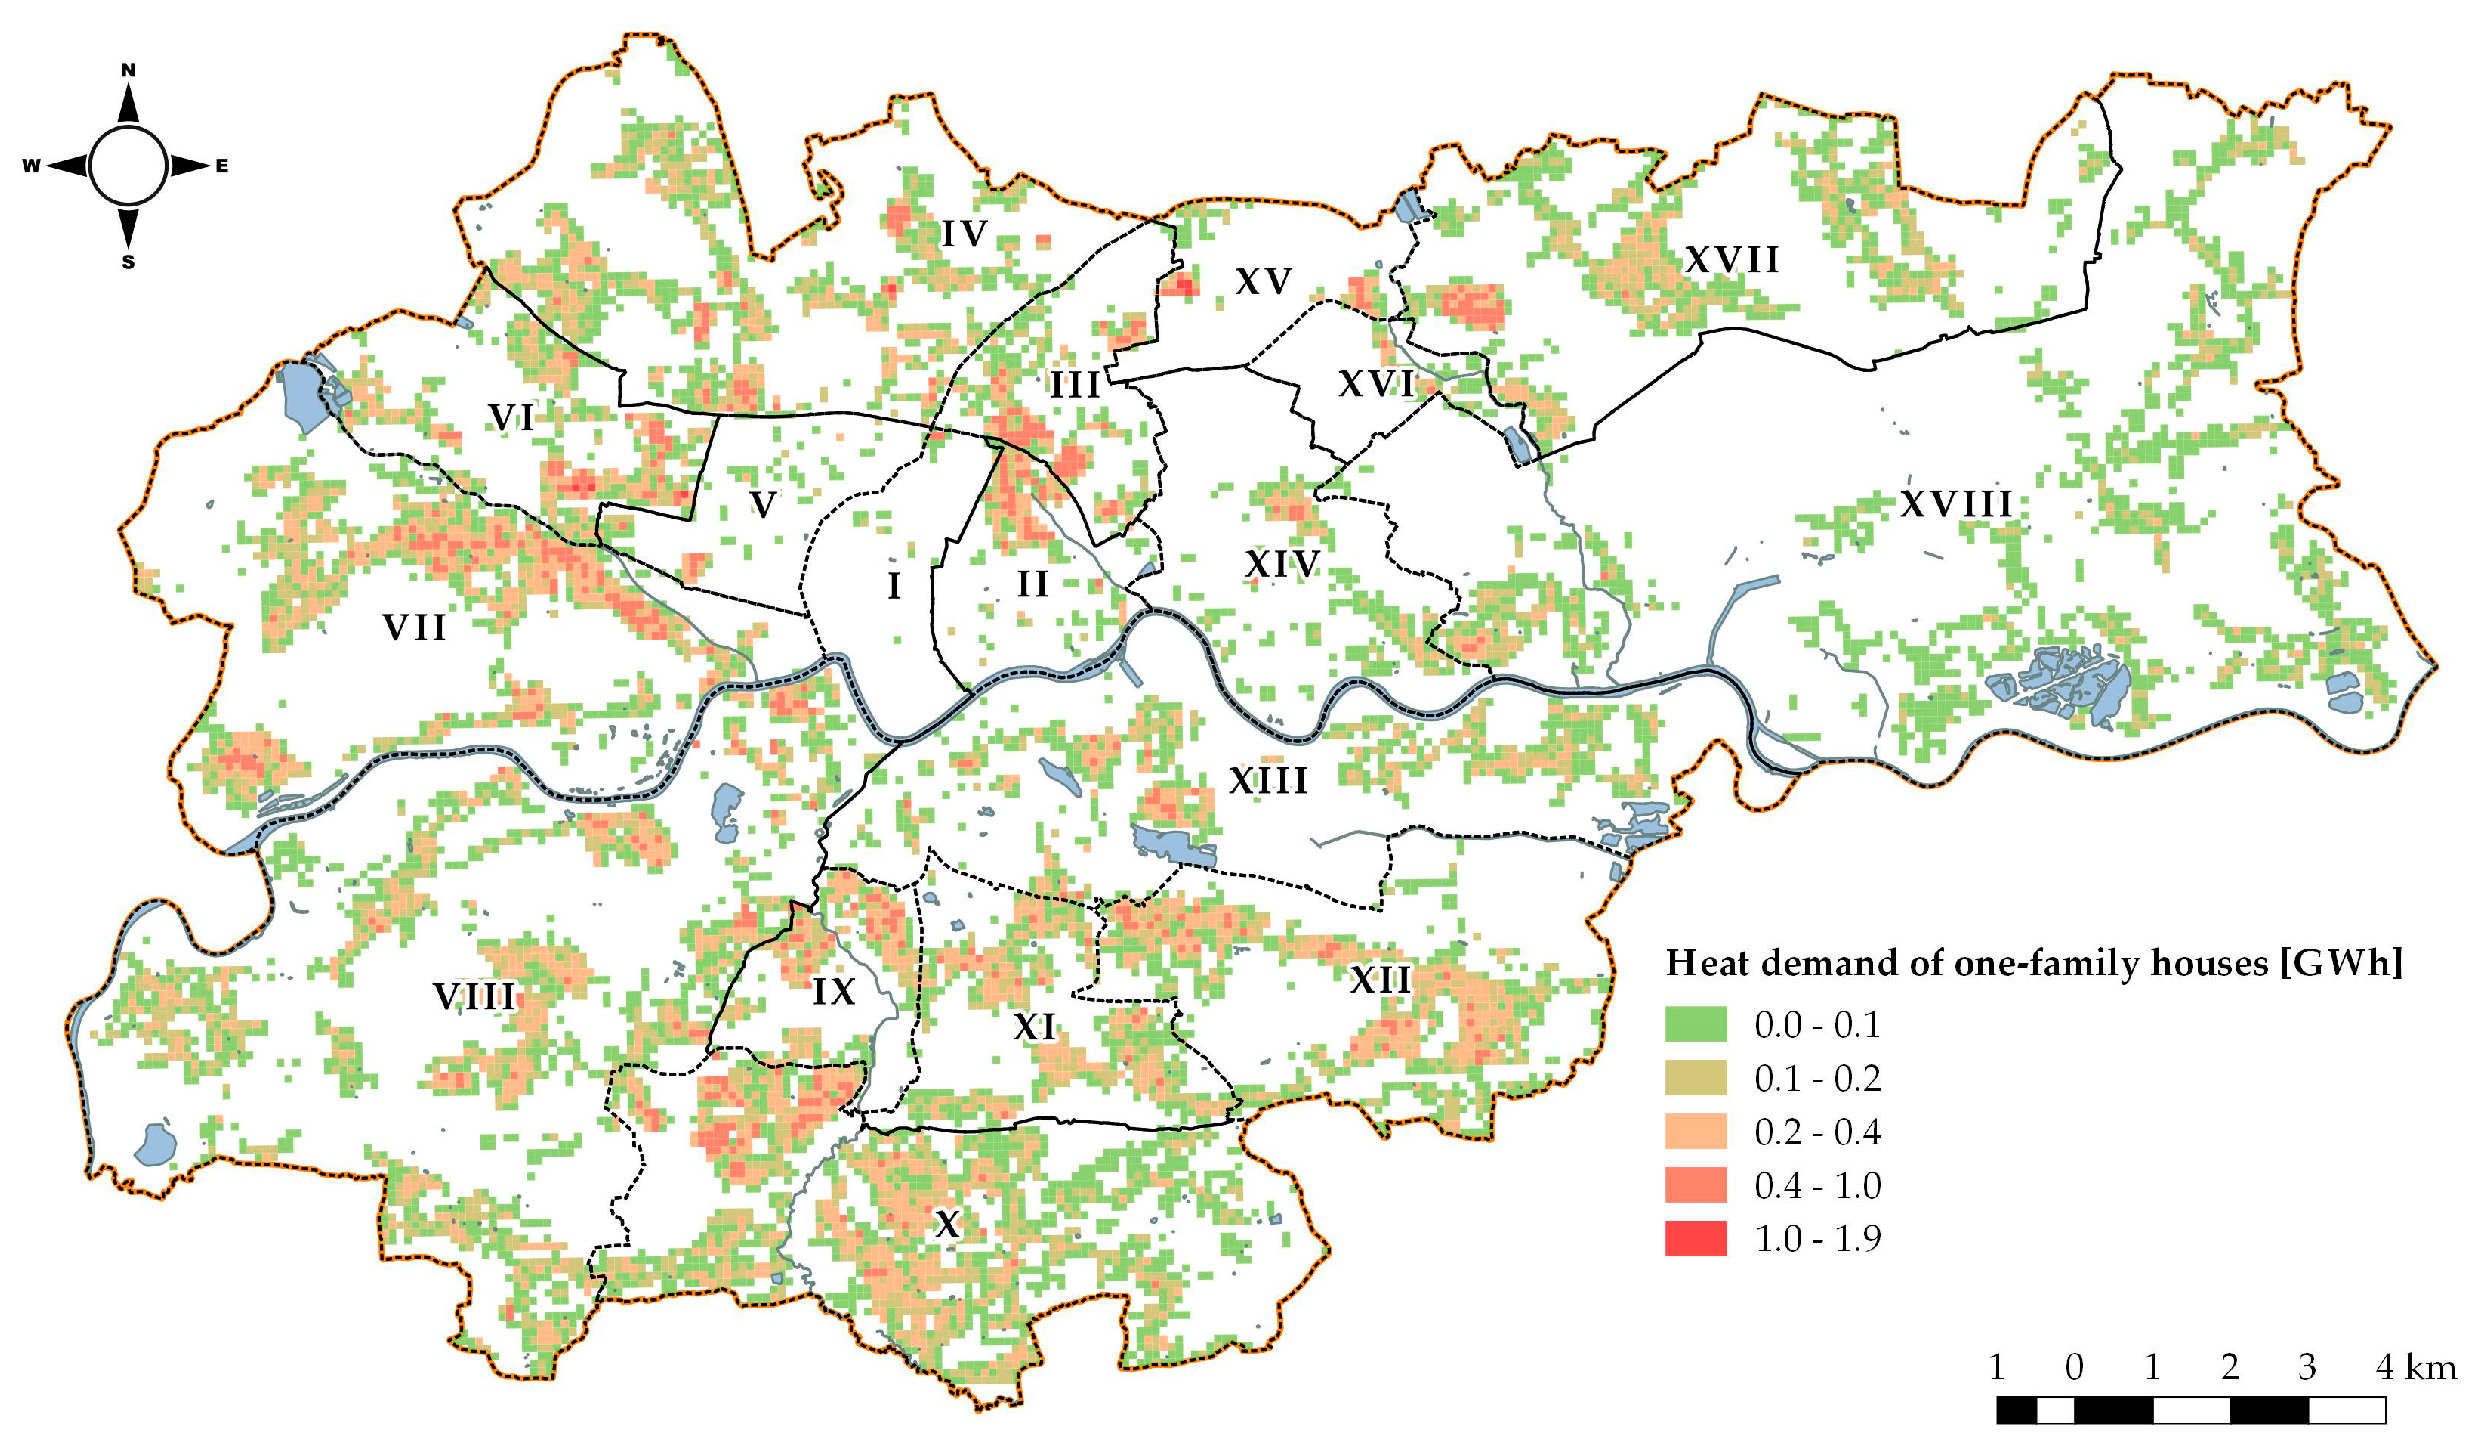
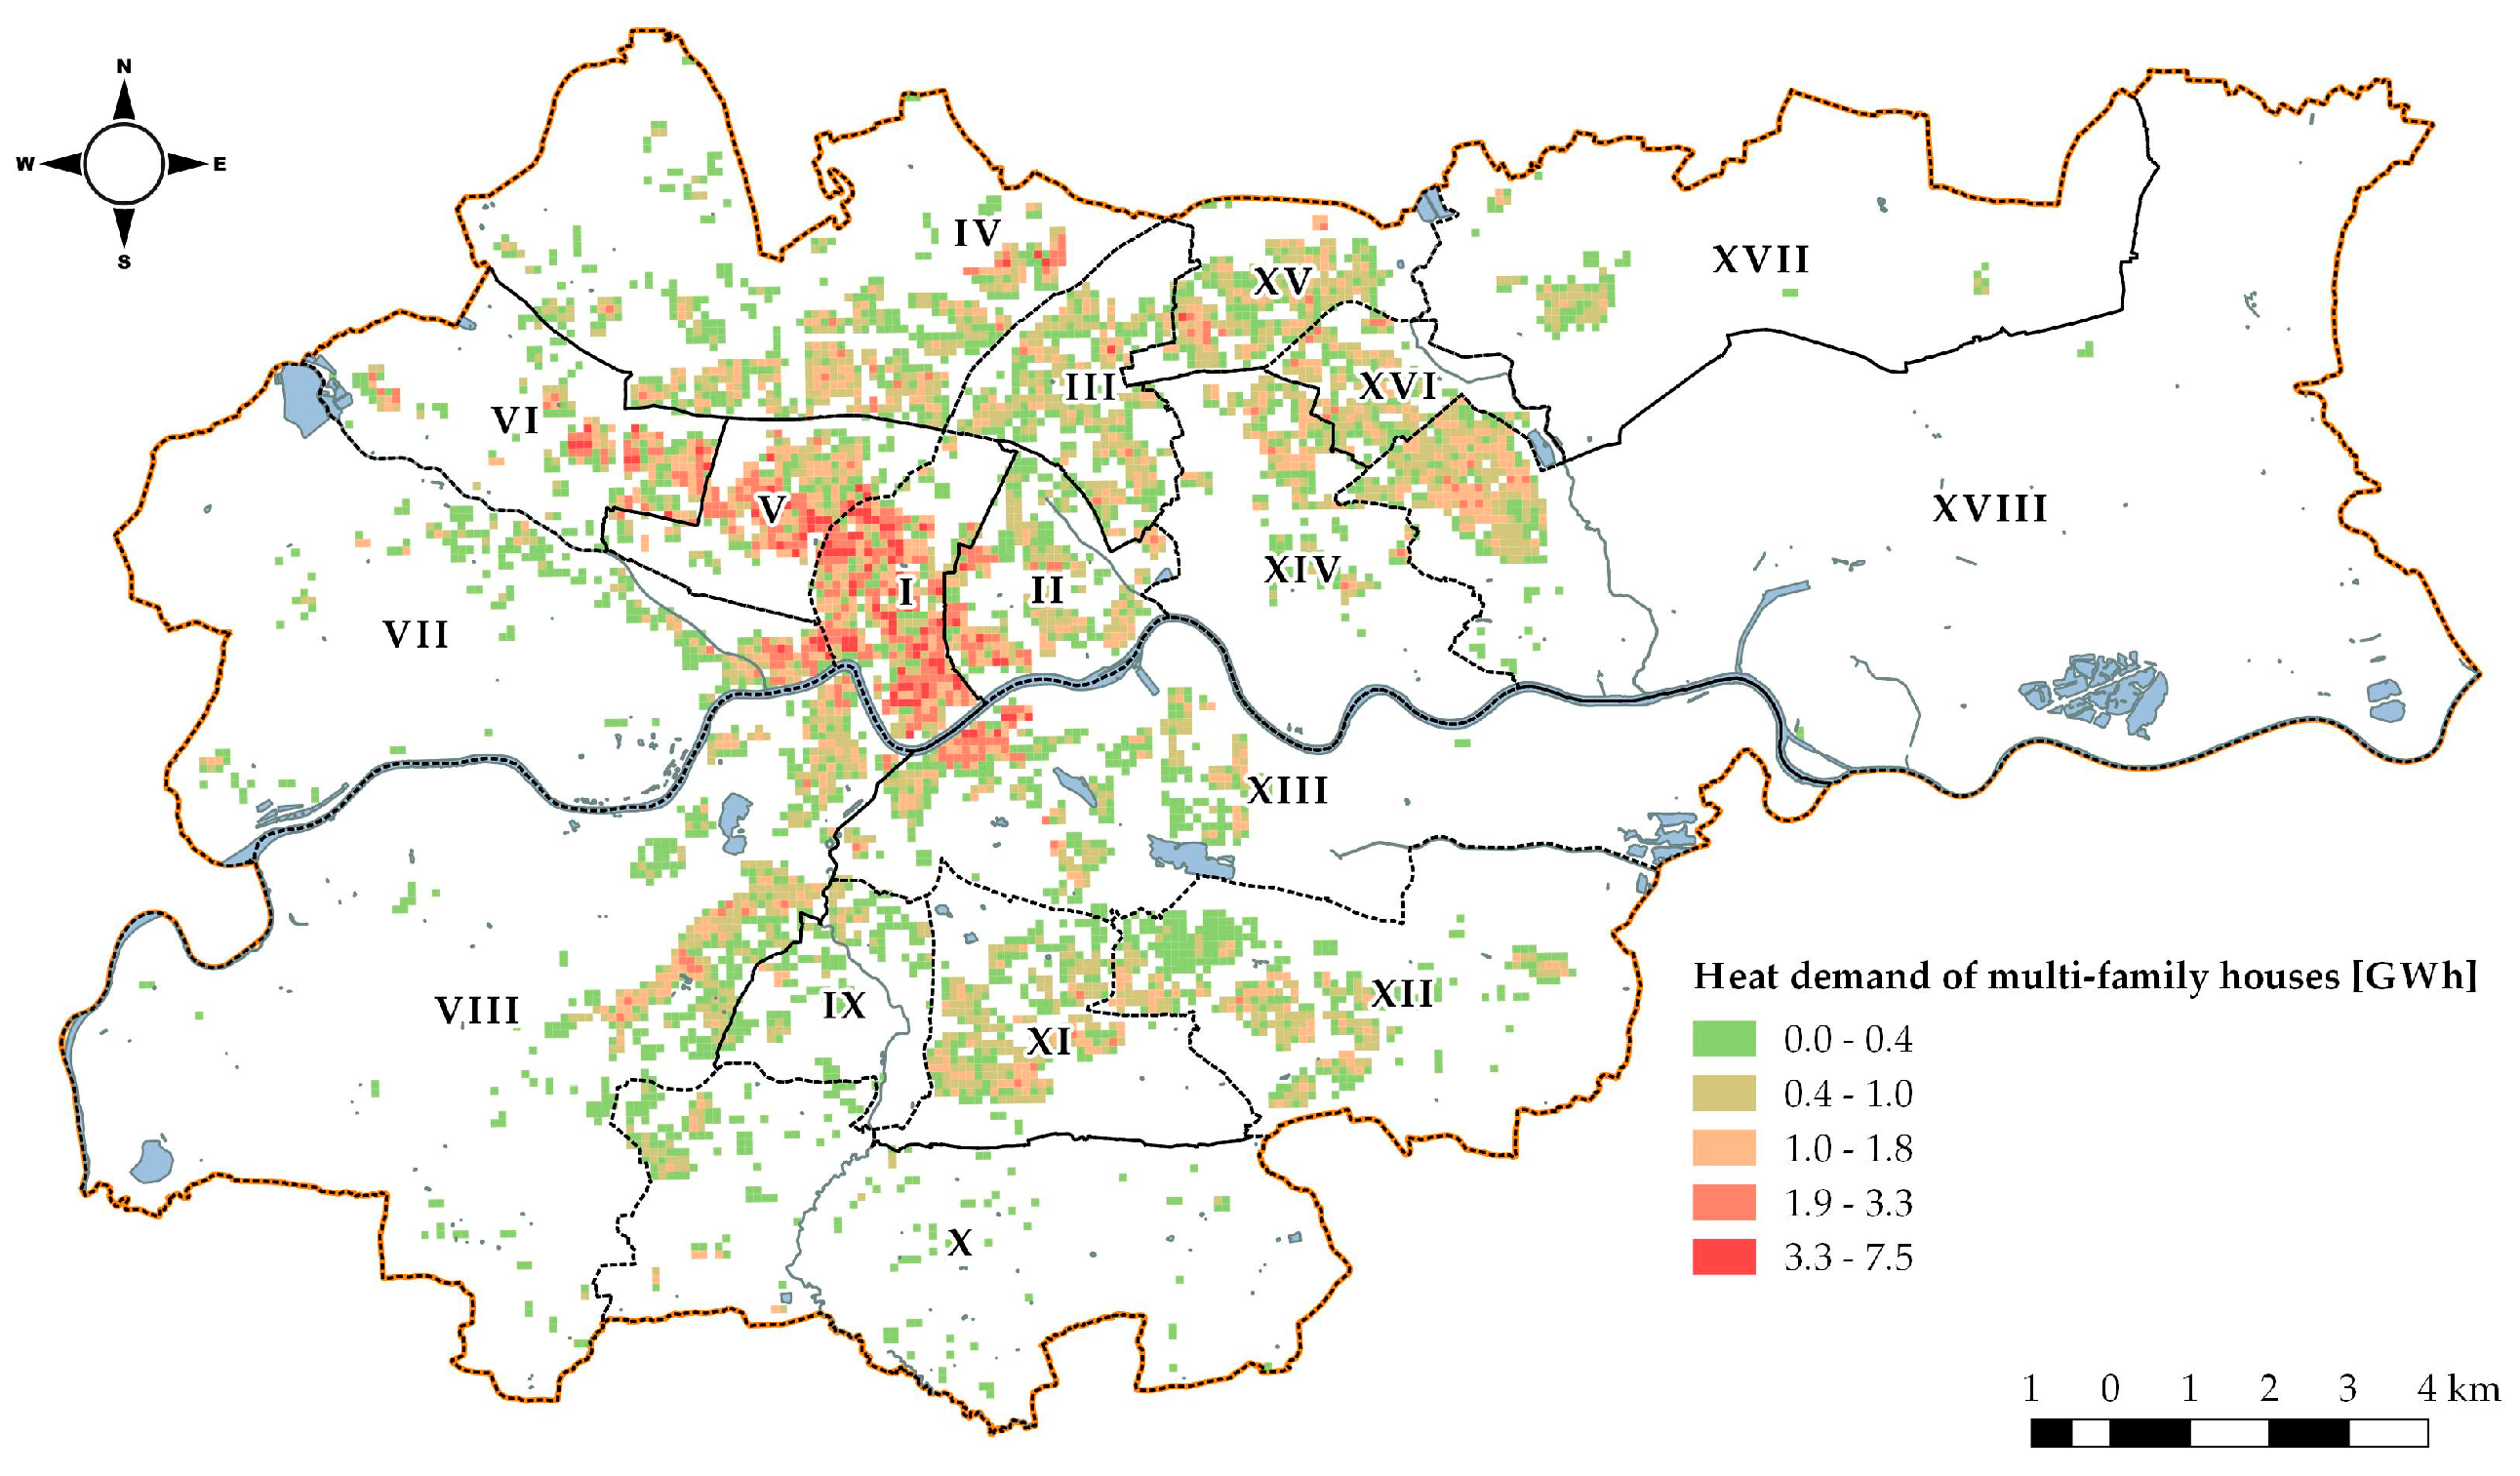
District heating systems in Polish cities are regarded as natural monopolies. The municipal DH network operators are in favor of connecting larger, multi-family buildings with greater heat demand density rather than one family houses (OFH) for economic reasons. The spatial distribution of heat demand from one-family and multi-family buildings are presented in Figure 4 and Figure 5, respectively. Splitting the heat demand into one-family and multi-family houses may be useful for evaluation of energy savings potential in these two building groups as well as to analyze to what extent the heat demand could be met by the use of RES (solar energy in particular). The existing support programs for RES and energy efficiency are different for OFH and collective buildings.
In Districts I, III, and V located in the city center, multi-family houses dominate the heat demand. The occurring heat demand density is among the highest in the city, and therefore space heating using DH system in this area is more economically viable than in other areas. In districts VII and X, the share of one-family houses is much higher than that in other districts, so enhancing the quality of individual heating systems has higher priority. However, looking at Figure 3, one can see that there are areas in Krakow dominated by OFH that have sufficient heat demand density to consider connection of these buildings to the existing DH network or the alternative development of new distributed DH networks. The heat demand for other sectors in district XVIII plays an important role, and therefore the planning is expected to put the attention on the industrial sector.
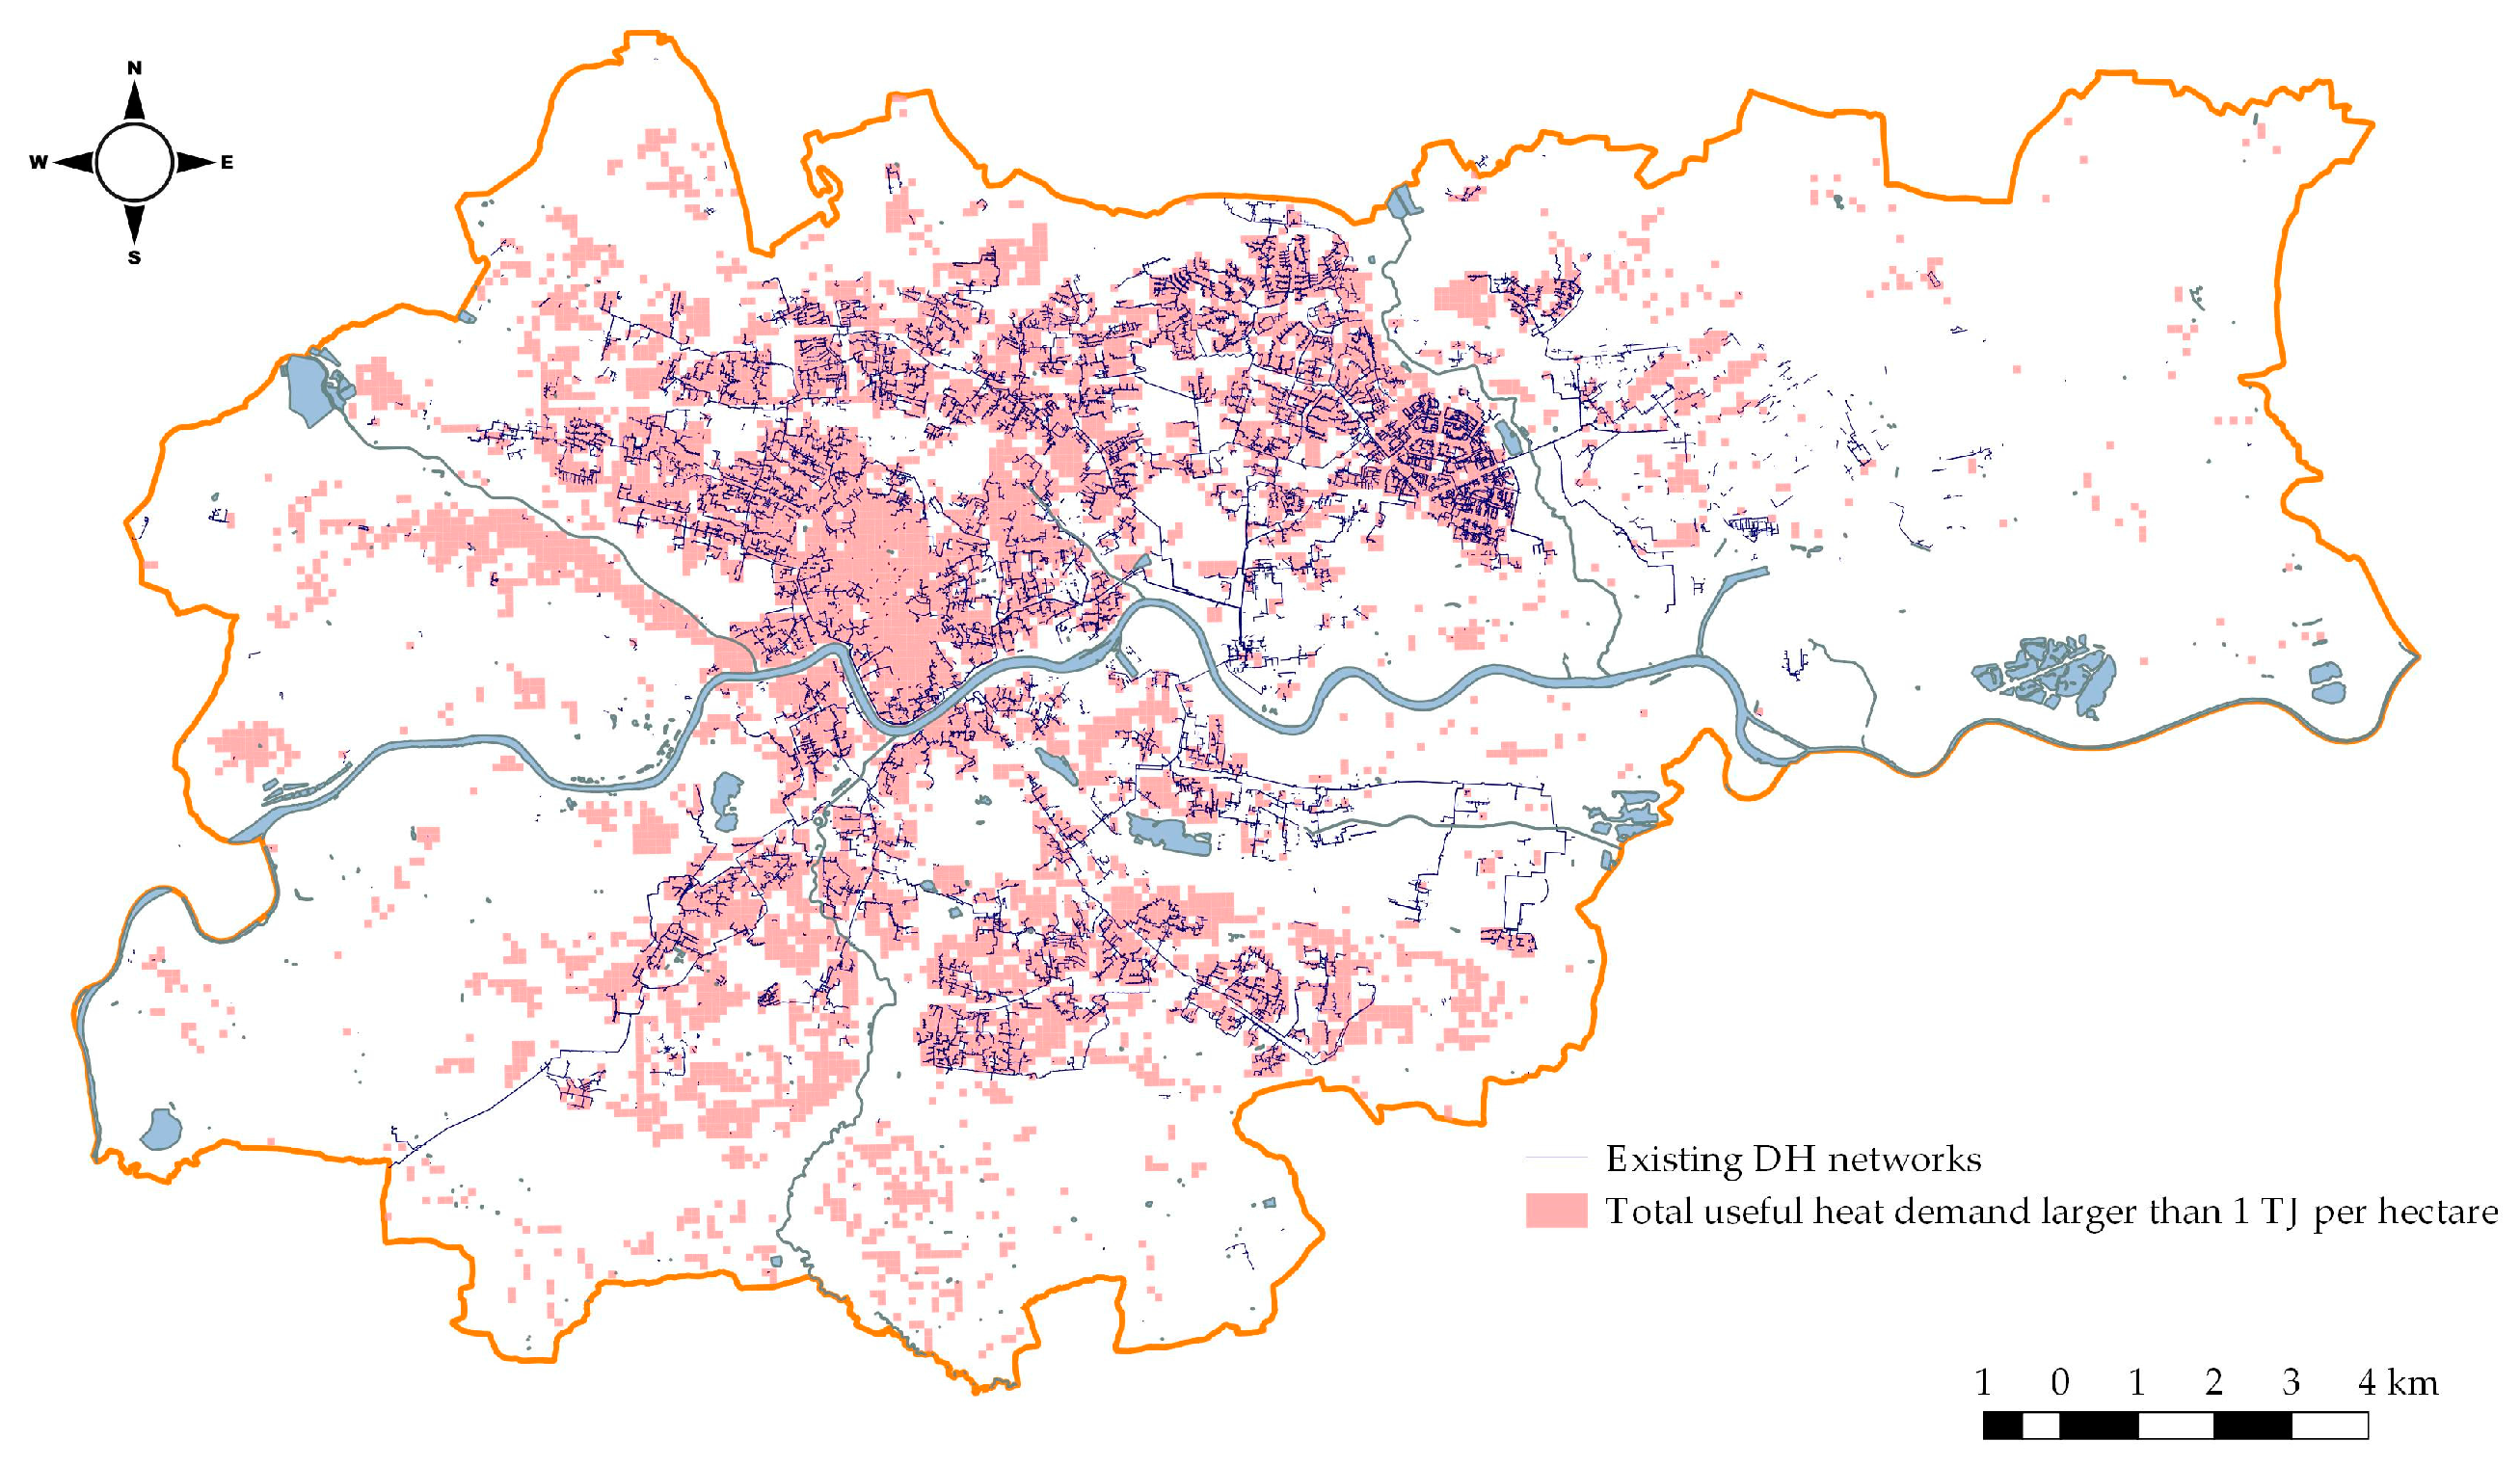
The overall spatial heat demand distribution was put together with the DH networks. Assuming, that conventional district heating networks require heat demand densities above one TJ per hectare [29] to be developed, such areas were identified (Figure 6). One can observe that besides the city center (District I), which includes a large part of historical protection area resulting in limited network development, there are still many regions without DH networks matching the minimum heat demand criteria.
The results should be used by local heat network operators while planning the expansion of the municipal heating system. Areas where the heat demand density does not meet the minimum density criteria and where solid fuels are used were also found. It is worth mentioning that there are still close to 15,000 buildings indicated using solid fuel, what results in overall solid fuel consumption of more than 230 GWh, as presented in Table 3. For these regions, specially tailored programs for fuel/technology switch and energy efficiency improvements can be prepared. Additionally, the costs as well as emission reductions of such programs can be estimated to better manage and direct public funds spending. In such cases, the economic viability of development of distributed DH networks that will not be connected to the main MPEC network and which have lower heat density requirements could be assessed.
3.2. Demand Projections
The exemplary results of short term projection for a selected area in Krakow are presented in Figure 7. Within three years, it can be expected that the heat demand in this area will increase by more than 40% due to the newly constructed buildings. Such spatial heat demand projections can be done in other parts of the city and be useful for stakeholders who can offer the buildings developers connection to the DH network.
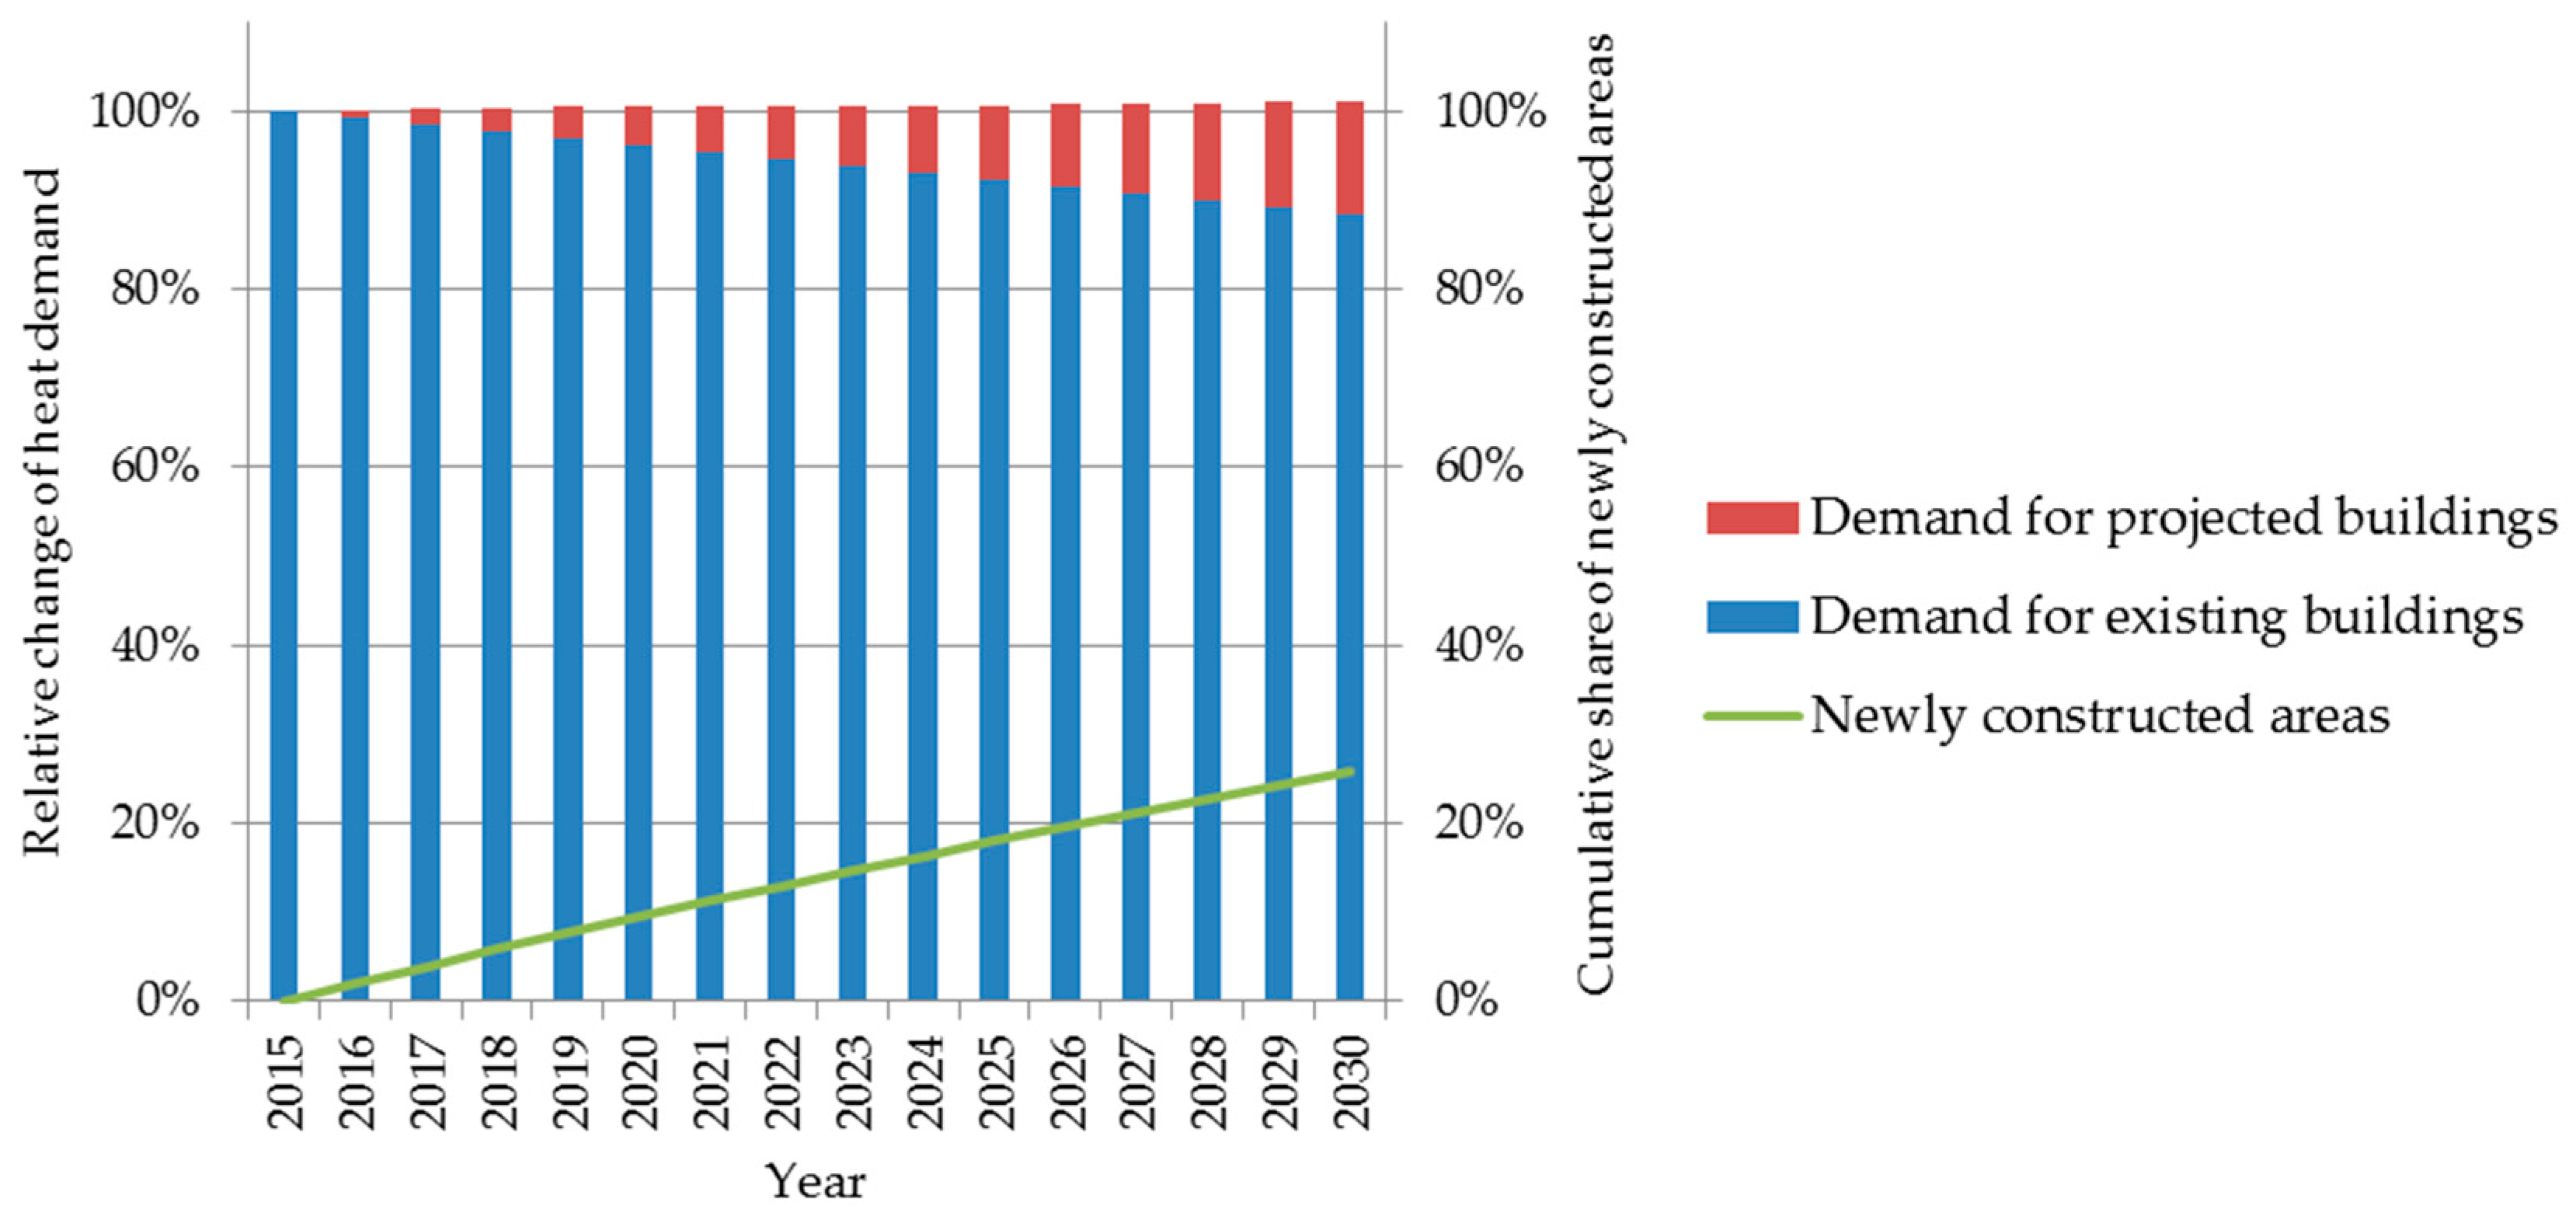
The results of mid-term projection with the use of building stock approach for OFH in Krakow are presented in Figure 8. Two opposing factors affect the total heat demand. On one hand, the existing buildings will be refurbished, leading to a decrease in heat demand. On the other hand, new construction generates new demand that compensates this loss. Consequently, with the assumptions described in Section 2.4 and Section 2.6, the total demand for useful heat will not change much in the next 15 years. Looking at Figure 8, one can note that newly added areas (after 2015) will constitute more than 25% of the total heated area in 2030. However, as their heat requirements are much lower, they will have only 12.5% share in total useful heat demand.
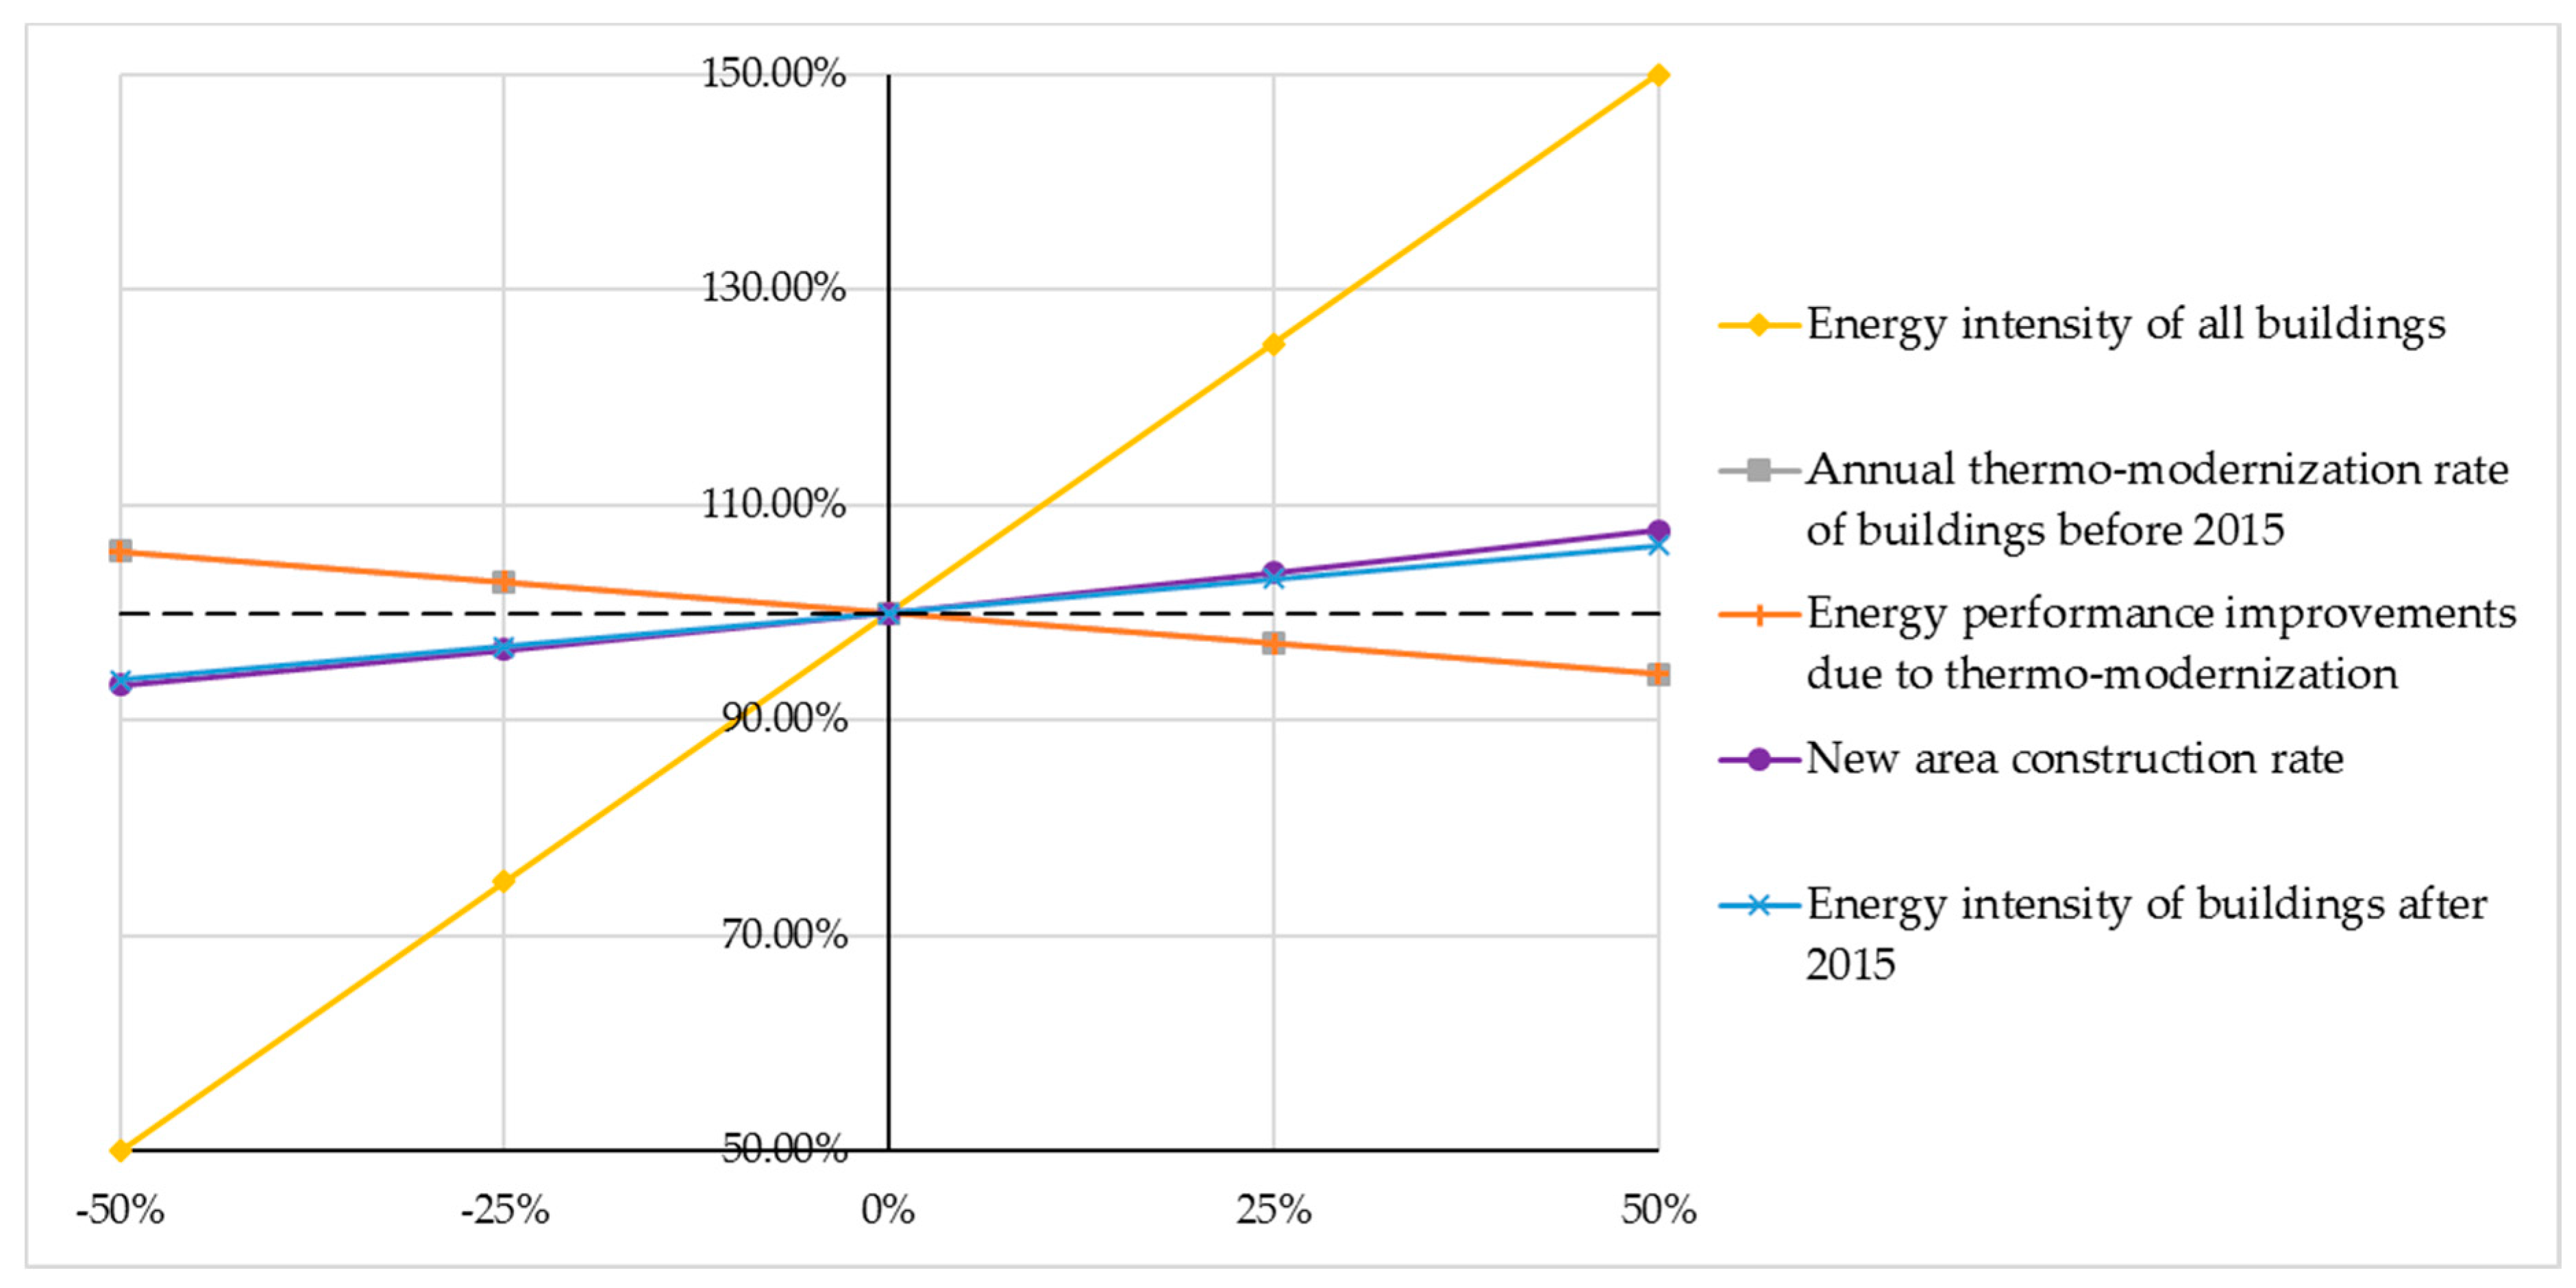
A sensitivity analysis of the heat demand for 2030 compares the impact of different factors (Figure 9). The x-axis shows the change of reference case parameters described in Section 2.6.2 (e.g., 50% increase in new are construction rate would mean increasing the value of this parameter from 2% to 3%). Only the change in specific heat demand coefficients for all existing OFH buildings would affect the results significantly. Therefore, the necessity of further work on the improvement of their accuracy should be emphasized. A 50% increase in energy performance improvements due to thermo-modernization or in thermo-modernization rate contributes to only around a 5% decrease in heat demand in 15 years. Similarly, a 50% increase in new area construction rate or in energy intensity of new buildings leads to less than 8% growth heat demand in 2030.
The projection results are important for planning the expansion of heat generation capacity. In 2015, the major district heating suppliers were CHP EDF Krakow (thermal power capacity of 978 MW), followed by power plant Skawina (thermal power capacity of 511 MW) and power plant of ArcelorMittal Poland (thermal power capacity of 538 MW) [32]. In addition, the waste incineration plant (ZTPO) with thermal capacity approximately 35 MW was launched to join the suppliers. As existing generation assets get old, the approach presented in this study can be used to support the strategies for new investments and/or modernizations of existing assets.
3.4. Validation of the Results
The validation processes have been performed in two ways. First, the overall final consumption of DH for space heating in all the buildings estimated in the study was compared with the values reported by the local DH system operator (Table 4). In this process, the information on efficiencies of heating technologies presented in Table 2 was taken into account.
One can see that the result obtained in the study overestimated the final heat consumption as compared to the reported value. One possible reason is the inaccuracy of the data sources. For example, some buildings noted as DH-equipped might have disconnected from the networks or old networks might have fallen into disuse. Another possibility is that the energy intensity coefficients applied were too high without considering potential thermal modernization or that the building utility types in reality were different from those indicated in the database. Further investigations on the causes for differences observed should be done.
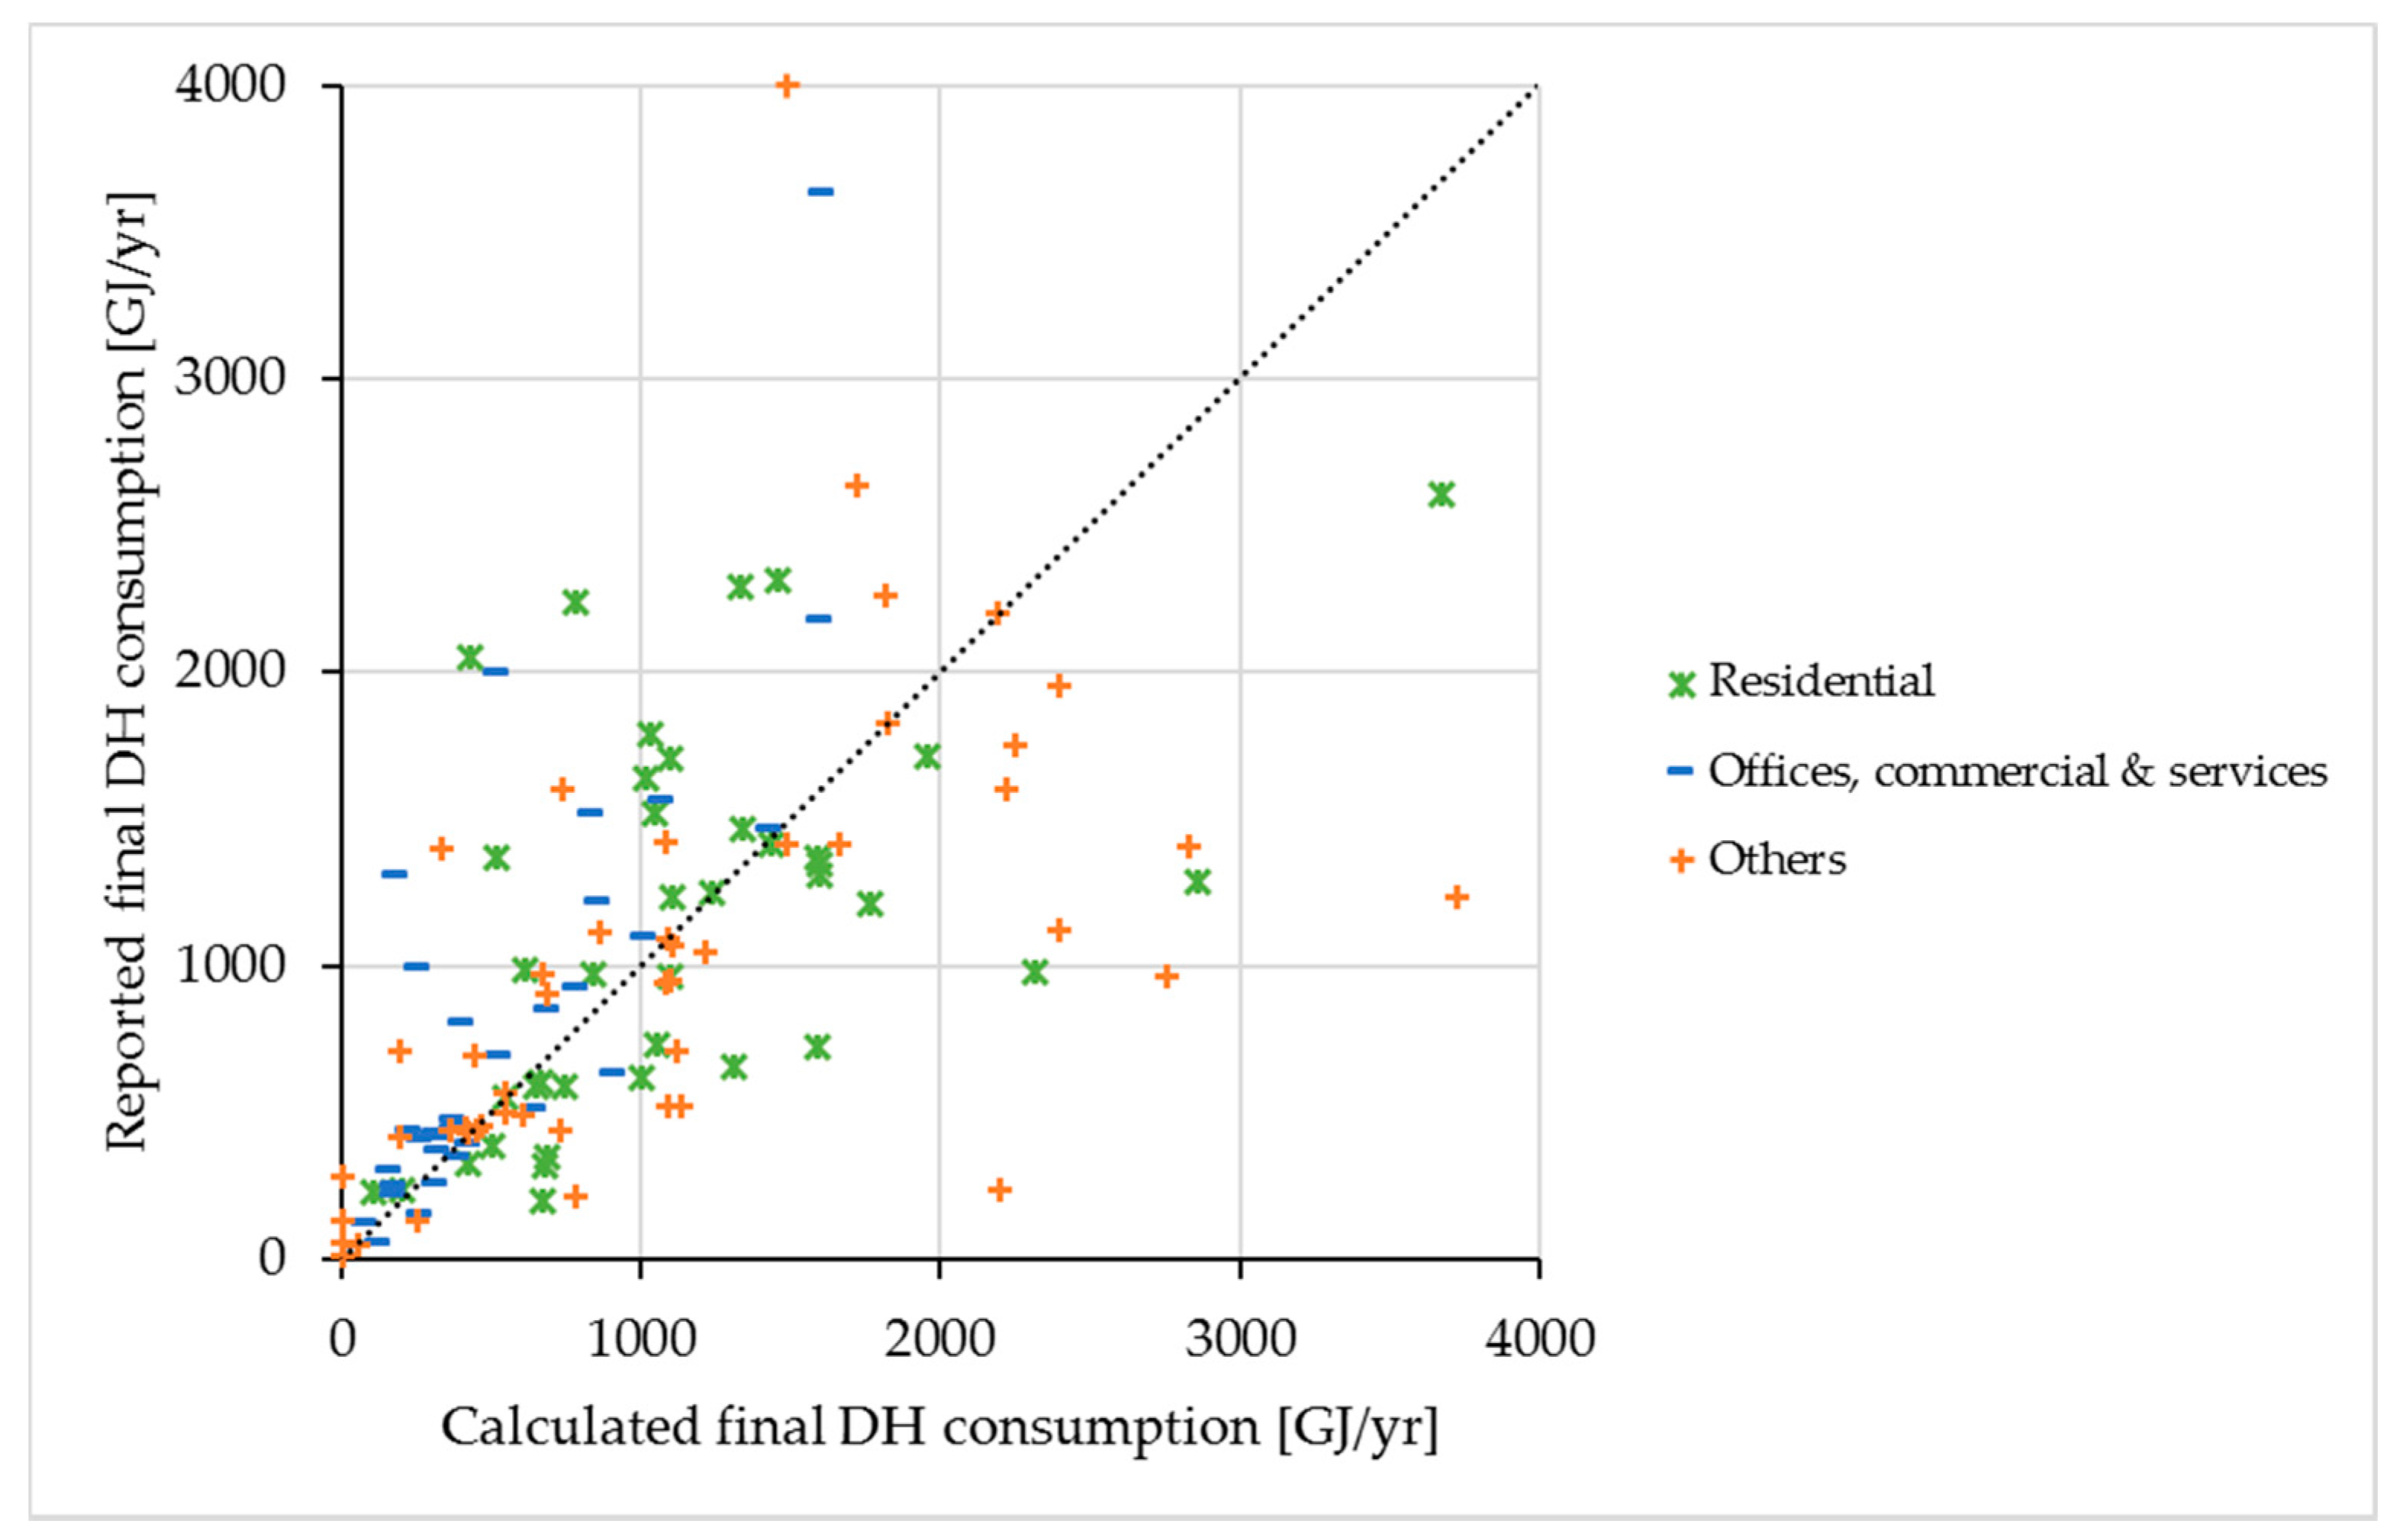
Second, for a limited set of buildings, it was possible to compare the predicted values (results of calculations) with the values observed at the building level (Figure 10). The data on these buildings included information of the consumption of natural gas, electricity, and DH. As natural gas and electricity can be used for purposes other than heating, only the buildings that clearly indicated DH as the only heating source were considered. The total number of buildings taken for statistical analysis equaled to 131.
In each building category, some outliers could be found. Several statistical performance measures were calculated for statistical evaluation (Table 5), including the mean percentage error (MPE), the correlation coefficient (R), the fraction of predictions within a factor of two of observations (FAC2), and the normalized mean square error (NMSE). A perfect model would have MPE equals to 0, R equals to 1, FAC2 equals to 1 and NMSE equals to 0 and the acceptance criteria of a model were assumed as [33]:
- (i)
- NMSE < 1.5
- (ii)
- FAC2 > 0.5.
In the case of all buildings, the calculated values were overestimated. The same applied to the residential building type. For buildings classified as offices, commercial & services, the heat consumption was underestimated. Despite the differences the statistical analysis shows that the calculations carried out have met the acceptance criteria.
4. Conclusions
This study demonstrated the use of geospatial building data to map heat demand in a city. Krakow was used as an example, given that the city has been putting emphasis on improving air quality previously deteriorated by burning solid fuels for space heating. Starting at the building level, a bottom-up approach was applied. Regardless of the absence of detailed information of each building, a geo-referenced dataset for buildings with their utility functions and numbers of floors were essential. Each building was assigned its own energy intensity by building type. Furthermore, the energy intensities of multi-family buildings were considered at the level of balancing zones i.e., the areas of the city with relative homogeneity of buildings due to the historical development of the city. Finally, the maps presented annual heat demand for various building types and energy services in 100 m × 100 m spatial resolution.
The results show that residential buildings, in particular multi-family and one-family buildings, have the highest share in the overall useful heat demand. The spatially distributed heat demand was useful to identify the prospective directions for future development of the DH networks in the city. Future evolution in heat demand for space heating in OFH was evaluated with the use of a deterministic method based on the BSM approach. The novelty of the approach is that buildings of a given type were split into energy intensity classes, which made it possible to address the changes in thermo-modernization rates and its effectiveness, as well as demolishing rates for each class separately.
The results of district heat consumption were validated against the measurement showing that the estimated values are generally overestimated. The more detailed statistical analysis conducted for the limited number of buildings showed that despite the differences the calculations carried out have met the acceptance criteria. The sensitivity analysis showed the importance of energy intensity coefficients used for existing buildings. To increase the accuracy of the results these coefficients could be calibrated based on actual measurement data for final energy consumption. In order to maintain residents’ anonymity, the measured values were made available at the district heating substation or street level. The engagement of different stakeholders such as gas and district heat network operators is necessary, and the result of this paper can facilitate this process. Complementary to this, detailed modelling of energy performance of a selected number of buildings within the main utilization types can be conducted, as in [3,4,5], to determine the frequency distribution of heat demand across given building stock. The approach proposed in this paper was a tradeoff between accuracy and efficiency. The employed method could be used to assess the impacts of policy measures. For instance, the necessary thermo-modernization rates for different building types and intensity classes can be determined to reach certain energy efficiency targets. The use of district heat can be promoted in the areas that meet the minimum heat density criteria to help in transition towards achieving more energy sustainable city.
One should note forget that heat demand mapping is an initial step for local heat system planning. The current EU energy policy aimed at GHG emission reduction places emphasis on the development of renewable energy sources. These by nature are intermittent in energy supply, and it is therefore necessary to increase power system flexibility to fully exploit this supply. Smart CHP-based district heating systems equipped with power-to-heat technologies (e.g., electric heaters, heat pumps) to absorb excess electricity generation together with heat storage can contribute to this increase in flexibility.
The heat map elaborated in this study will hopefully raise the awareness of stakeholders related to energy utilization in urban areas. It was demonstrated that employment of novel approaches using GIS-based tools could support the energy planning process. The study lays a foundation for future work on planning the development of smart district heat systems at the city level.
Acknowledgments
This work has received funding from the European Union’s Horizon 2020 research and innovation programme under grant agreement No 691685 and the Krakow Government Office (no. W/I/3696/GK/18/2016). Part of the research leading to the results was supported by the statutory funding of AGH (no. 11.11.210.217). The authors would like to thank Maciej Surówka from NEUTRINO Company for the discussion and his support in the determination of specific heat demand coefficients, Andrzej Łazędzki and Marta Soluch from Krakow Government Office for supporting the study and their help in collection of the necessary data, and Jacek Strzelczyk from AGH for his help in pre-processing some datasets.
Author Contributions
Artur Wyrwa designed the study and developed the methods. Yi-kuang Chen processed the data and prepared the heat maps. Both authors contributed to analysis and validation of results and to writing the manuscript.
Conflicts of Interest
The authors declare no conflict of interest. The Krakow Government Office help in establishing contacts with public administration bodies for collection of the required datasets.
Nomenclature
| Af | total heated area of the building [m2] |
| Az | building area on the outer contour of the building [m2] |
| cf | heated area calibration ratio |
| d | annual demolishing rate of existing heated area [%] |
| eu | specific heat demand for energy service u in buildings per area [kWh/(m2⋅year)] |
| l | number of floors above ground level |
| Qu | useful heat demand for energy service u [kWh/year] |
| r | remaining building areas after modernization and demolishing [%] |
| y | number of years after the base year |
| annual thermo-modernization rate of the existing buildings area by classes [%] | |
| annual energy intensity improvement due to thermo-modernization [%] | |
| Superscript and Subscript | |
| b | building belonging to set B |
| cl | class of heat intensity within a building type belonging to set CL |
| k | grid cell belonging to set K |
| new | new construction after the base year 2015 |
| s | balance zone belonging to set S |
| t | building utility type belonging to set T |
| u | energy service including space heating (h), ventilation (ve) and domestic hot water preparation (w) |
References
- Wyrwa, A. An optimization platform for Poland’s power sector considering air pollution and health effects. Environ. Model. Softw. 2015, 74, 227–237. [Google Scholar] [CrossRef]
- Perera, D.W.U.; Winkler, D.; Skeie, N.-O. Multi-floor building heating models in MATLAB and Modelica environments. Appl. Energy 2016, 171, 46–57. [Google Scholar] [CrossRef]
- Evangelisti, L.; Guattari, C.; Gori, P. Energy retrofit strategies for residential building envelopes: An Italian case study of an early-50s building. Sustainability 2015, 7, 10445–10460. [Google Scholar] [CrossRef]
- Valdiserri, P.; Biserni, C.; Tosi, G.; Garai, M. Retrofit strategies applied to a tertiary building assisted by trnsys energy simulation tool. Energy Proced. 2015, 78, 765–770. [Google Scholar] [CrossRef]
- Valdiserri, P.; Biserni, C. Energy performance of an existing office building in the northern part of Italy: Retrofitting actions and economic assessment. Sustain. Cities Soc. 2016, 27, 65–72. [Google Scholar] [CrossRef]
- Gils, H.C.A. GIS-Based Assessment of the District Heating Potential in Europe; Deutsches Zentrum für Luft-und Raumfahrt (DLR): Graz, Austria, 2012. [Google Scholar]
- Persson, U.; Werner, S. Quantifying the heating and cooling demand in Europe. In STRATEGO Work Package 2; Halmstad University: Halmstad, Sweden, 2015. [Google Scholar]
- Bernd, M. Mapping the heating and cooling demand in Europe. In STRATEGO Work Package 2; University of Flensburg: Flensburg, Germany, 2015. [Google Scholar]
- Finney, K.N.; Sharifi, V.N.; Swithenbank, J.; Nolan, A.; White, S.; Ogden, S. Developments to an existing city-wide district energy network—Part I: Identification of potential expansions using heat mapping. Energy Convers. Manag. 2012, 62, 165–175. [Google Scholar] [CrossRef]
- IEE Project TABULA. Available online: http://episcope.eu/iee-project/tabula/ (accessed on 9 March 2017).
- Reiter, D.; Botzenhart, F.; Mühlich, P.; Hamacher, T.; Reuter, A. Developing a roadmap for the future energy infrastructure in Salzburg. In Proceedings of the 10th IAEE European Conference, Vienna, Austria, 7–10 September 2009. [Google Scholar]
- Törnros, T.; Resch, B.; Rupp, M.; Gündra, H. Geospatial analysis of the building heat demand and distribution losses in a district heating network. ISPRS Int. J. Geo-Inf. 2016, 5, 219. [Google Scholar] [CrossRef]
- Delmastro, C.; Mutani, G.; Schranz, L. The evaluation of buildings energy consumption and the optimization of district heating networks: A GIS-based model. Int. J. Energy Environ. Eng. 2016, 7, 343–351. [Google Scholar] [CrossRef]
- Mastrucci, A.; Baume, O.; Stazi, F.; Leopold, U. Estimating energy savings for the residential building stock of an entire city: A GIS-based statistical downscaling approach applied to Rotterdam. Energy Build. 2014, 75, 358–367. [Google Scholar] [CrossRef]
- Theodoridou, I.; Karteris, M.; Mallinis, G.; Papadopoulos, A.M.; Hegger, M. Assessment of retrofitting measures and solar systems’ potential in urban areas using geographical information systems: Application to a Mediterranean city. Renew. Sustain. Energy Rev. 2012, 16, 6239–6261. [Google Scholar] [CrossRef]
- Möller, B. A heat atlas for demand and supply management in Denmark. Manag. Environ. Qual. Int. J. 2008, 19, 467–479. [Google Scholar] [CrossRef]
- Petrovic, S.; Karlsson, K. Model for determining geographical distribution of heat saving potentials in Danish building stock. ISPRS Int. J. Geo-Inf. 2014, 3, 143–165. [Google Scholar] [CrossRef]
- Petrović, S.; Karlsson, K. Ringkøbing-Skjern energy atlas for analysis of heat saving potentials in building stock. Energy 2016, 110, 166–177. [Google Scholar] [CrossRef]
- Miejskie Przedsiębiorstwo Energetyki Cieplnej S.A. w Krakowie (MPEC). Annual Raport 2015; MPEC S.A.: Kraków, Poland, 2016. [Google Scholar]
- Guerreiro, C.; González, A.; de Leeuw, F.; Viana, M.; Horálek, J. Air Quality in Europe—2016 Report; European Environment Agency: Copenhagen, Denmark, 2016. [Google Scholar]
- REflex—Analysis of the European Energy System. Available online: http://reflex-project.eu/ (accessed on 16 March 2017).
- Wyrwa, A.; Strzelczyk, J.; Chen, Y.; Surówka, M. Mapa Ciepła dla Krakowa; Gmina Miejska Kraków: Krakow, Poland, 2016. (In Polish) [Google Scholar]
- Polish Ministry of Infrastructure and Development. Ordinance of 27 February 2015 on methodology for determining the energy performance of a building or part of a building and energy performance certificates. J. Laws 2015, 376, 1–62. [Google Scholar]
- McKenna, R.; Merkel, E.; Fehrenbach, D.; Mehne, S.; Fichtner, W. Energy efficiency in the German residential sector: A bottom-up building-stock-model-based analysis in the context of energy-political targets. Build. Environ. 2013, 62, 77–88. [Google Scholar] [CrossRef]
- Nägeli, C.; Jakob, M.; Sunarjo, B.; Catenazzi, G. A building specific economic building stock model to evaluate energy efficiency and renewable energy. In Proceedings of the CISBAT 2015, Lausanne, Switzerland, 9–11 September 2015. [Google Scholar]
- International Energy Agency (IEA); Organisation for Economic Co-operation and Development (OECD). Energy Technology Perspectives 2016: Towards Sustainable Urban Energy Systems; OECD/IEA: Paris, France, 2016. [Google Scholar]
- Local Data Bank. Available online: https://bdl.stat.gov.pl/BDL/dane/podgrup/temat (accessed on 20 April 2017).
- Recast, E.P.B.D. Directive 2010/31/EU of the European Parliament and of the Council of 19 May 2010 on the energy performance of buildings. Off. J. Eur. Union 2010, 18. [Google Scholar]
- Möller, B.; Werner, S. Quantifying the potential for district heating and cooling in EU member states. In STRATEGO Work Package 2; University of Flensburg: Flensburg, Germany, 2016. [Google Scholar]
- Łazęcki, A. Założenia do Planu Zaopatrzenia Gminy Miejskiej Kraków w Ciepło, Energię Elektryczną i Paliwa Gazowe; Gmina Miejska Kraków: Krakow, Poland, 2009. (In Polish) [Google Scholar]
- Łazęcki, A. Założenia do Planu Zaopatrzenia Gminy Miejskiej Kraków w Ciepło, Energię Elektryczną i Paliwa Gazowe; Gmina Miejska Kraków: Krakow, Poland, 2014. (In Polish) [Google Scholar]
- Mikołajuk, H.; Parciński, G.; Brasse, J.; Żarek, E.; Zaborska, D.; Wrońska, I.; Zatorska, M.; Bojanowska, H.; Stępniak, E. Katalog Elektrowni i Elektrociepłowni Zawodowych 2015 rok; Agencja Rynku Energii S.A.: Warszawa, Poland, 2016. (In Polish) [Google Scholar]
- Patryl, L.; Galeriu, D. Statistical Performances Measures—Models Comparison; CEA: Paris, France, 2011. [Google Scholar]
Figure 1.
(a) Heated area distribution into eight classes. (b) Average useful heat demand used in classes and thermo-modernization rate of existing buildings.
Figure 1.
(a) Heated area distribution into eight classes. (b) Average useful heat demand used in classes and thermo-modernization rate of existing buildings.
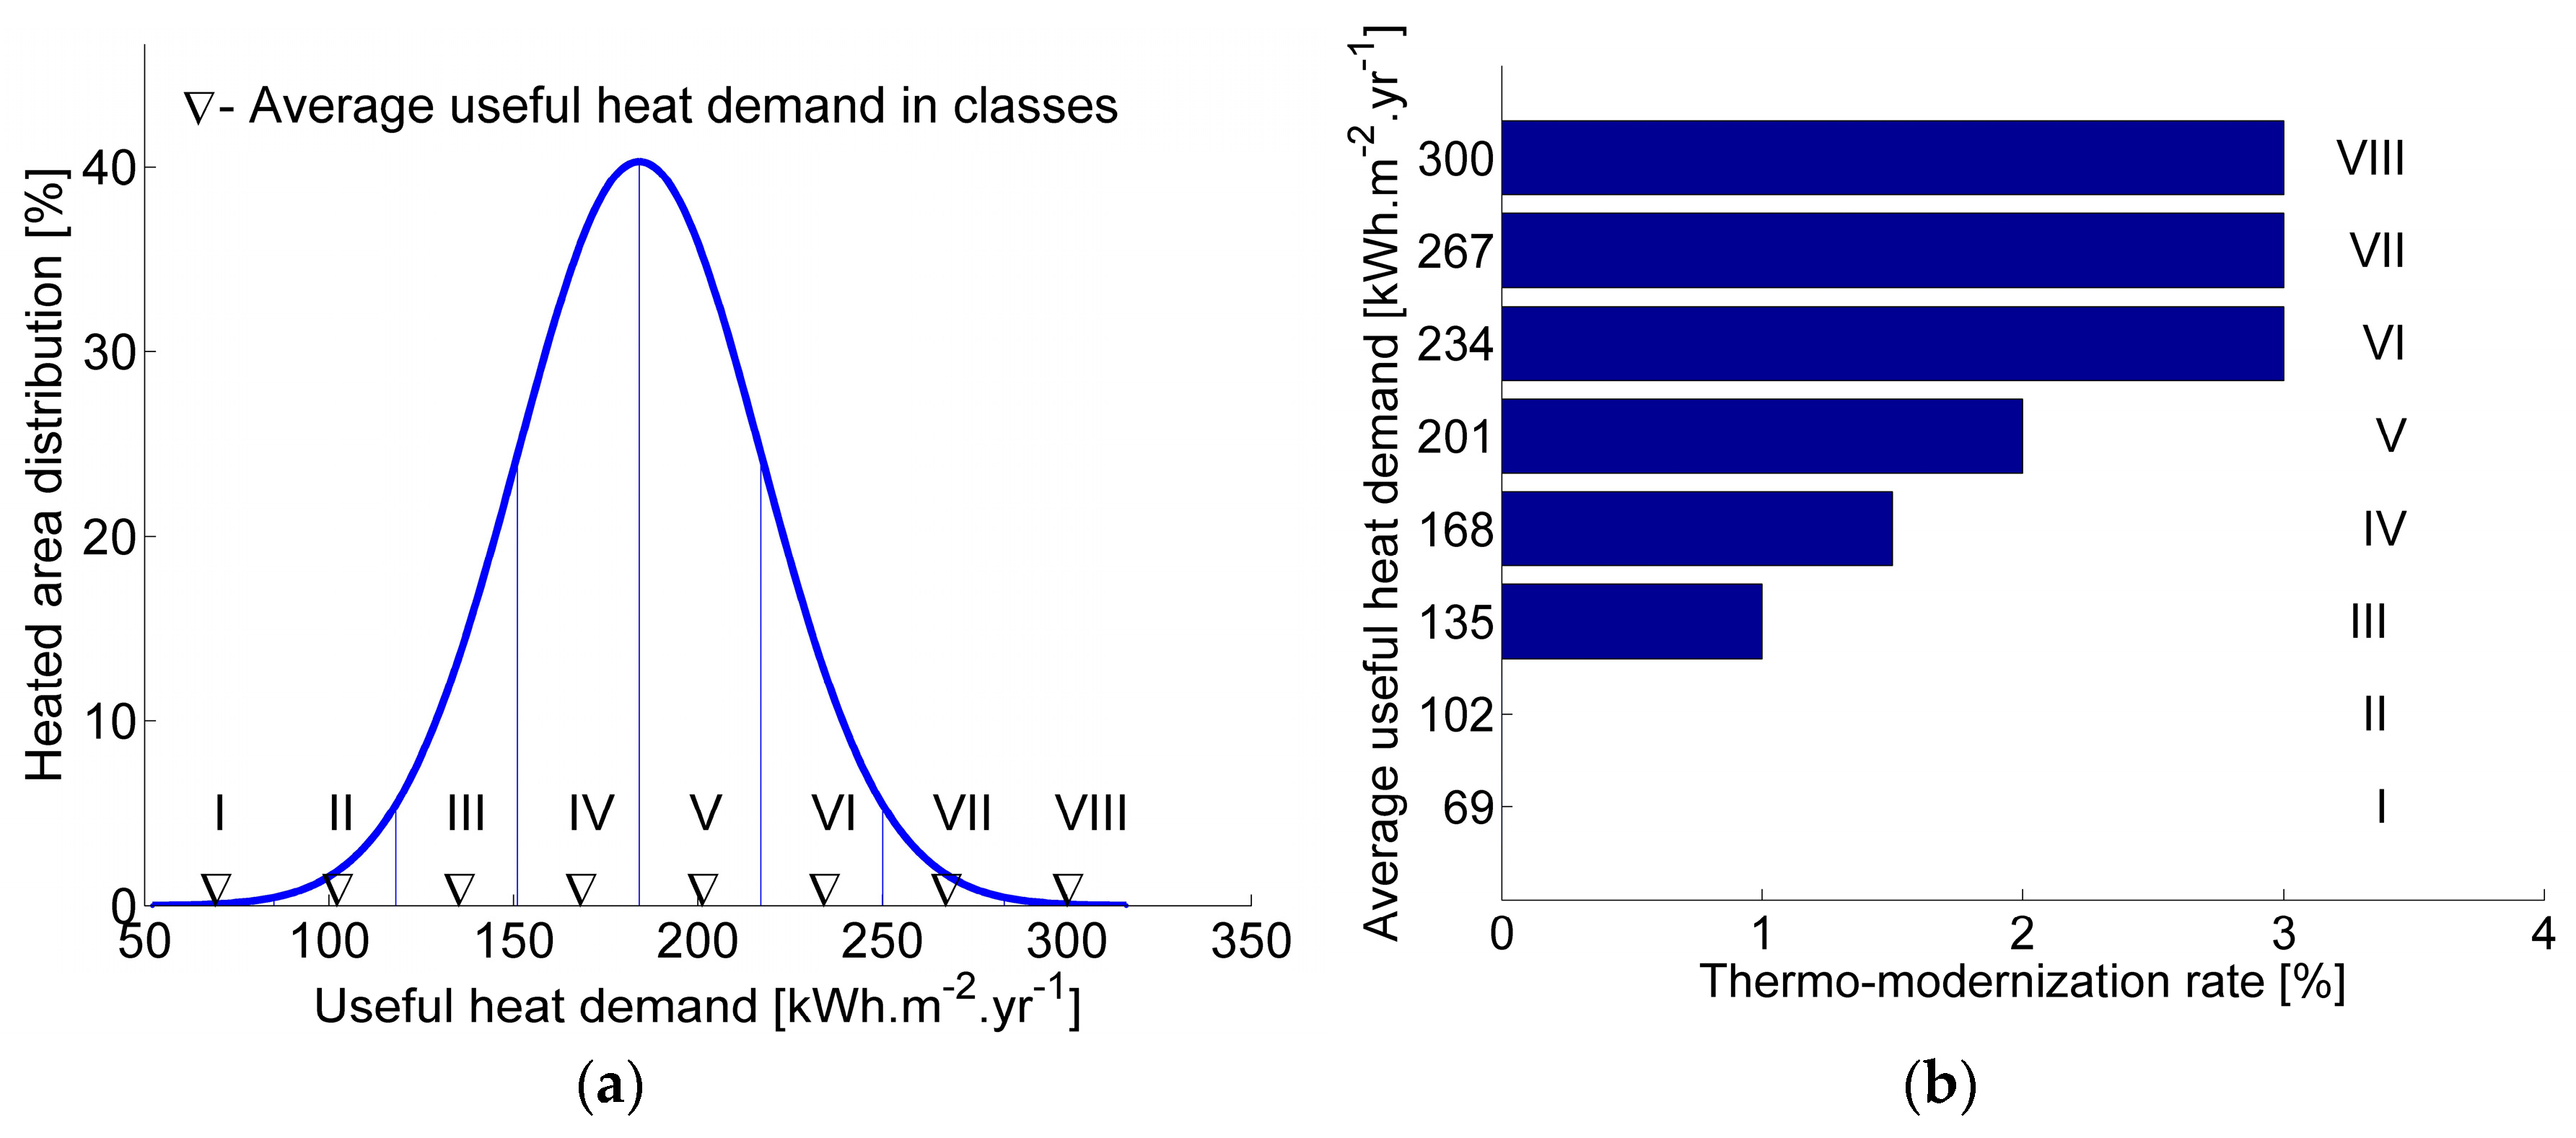
Figure 2.
Annual total useful heat demand in GWh per one hectare.

Figure 3.
Annual total useful heat demand in GWh in districts by types of building functions.

Figure 4.
Annual total useful heat demand of one-family houses in GWh.

Figure 5.
Annual total useful heat demand of multi-family houses in GWh.

Figure 6.
The spatial comparison of areas with minimum heat density criteria for DH development (1 TJ per hectare) and existing DH networks.
Figure 6.
The spatial comparison of areas with minimum heat density criteria for DH development (1 TJ per hectare) and existing DH networks.

Figure 7.
(a) The boundary for demonstrating short-term demand projection; (b) The additional heat demand from the expected buildings in this area.
Figure 7.
(a) The boundary for demonstrating short-term demand projection; (b) The additional heat demand from the expected buildings in this area.
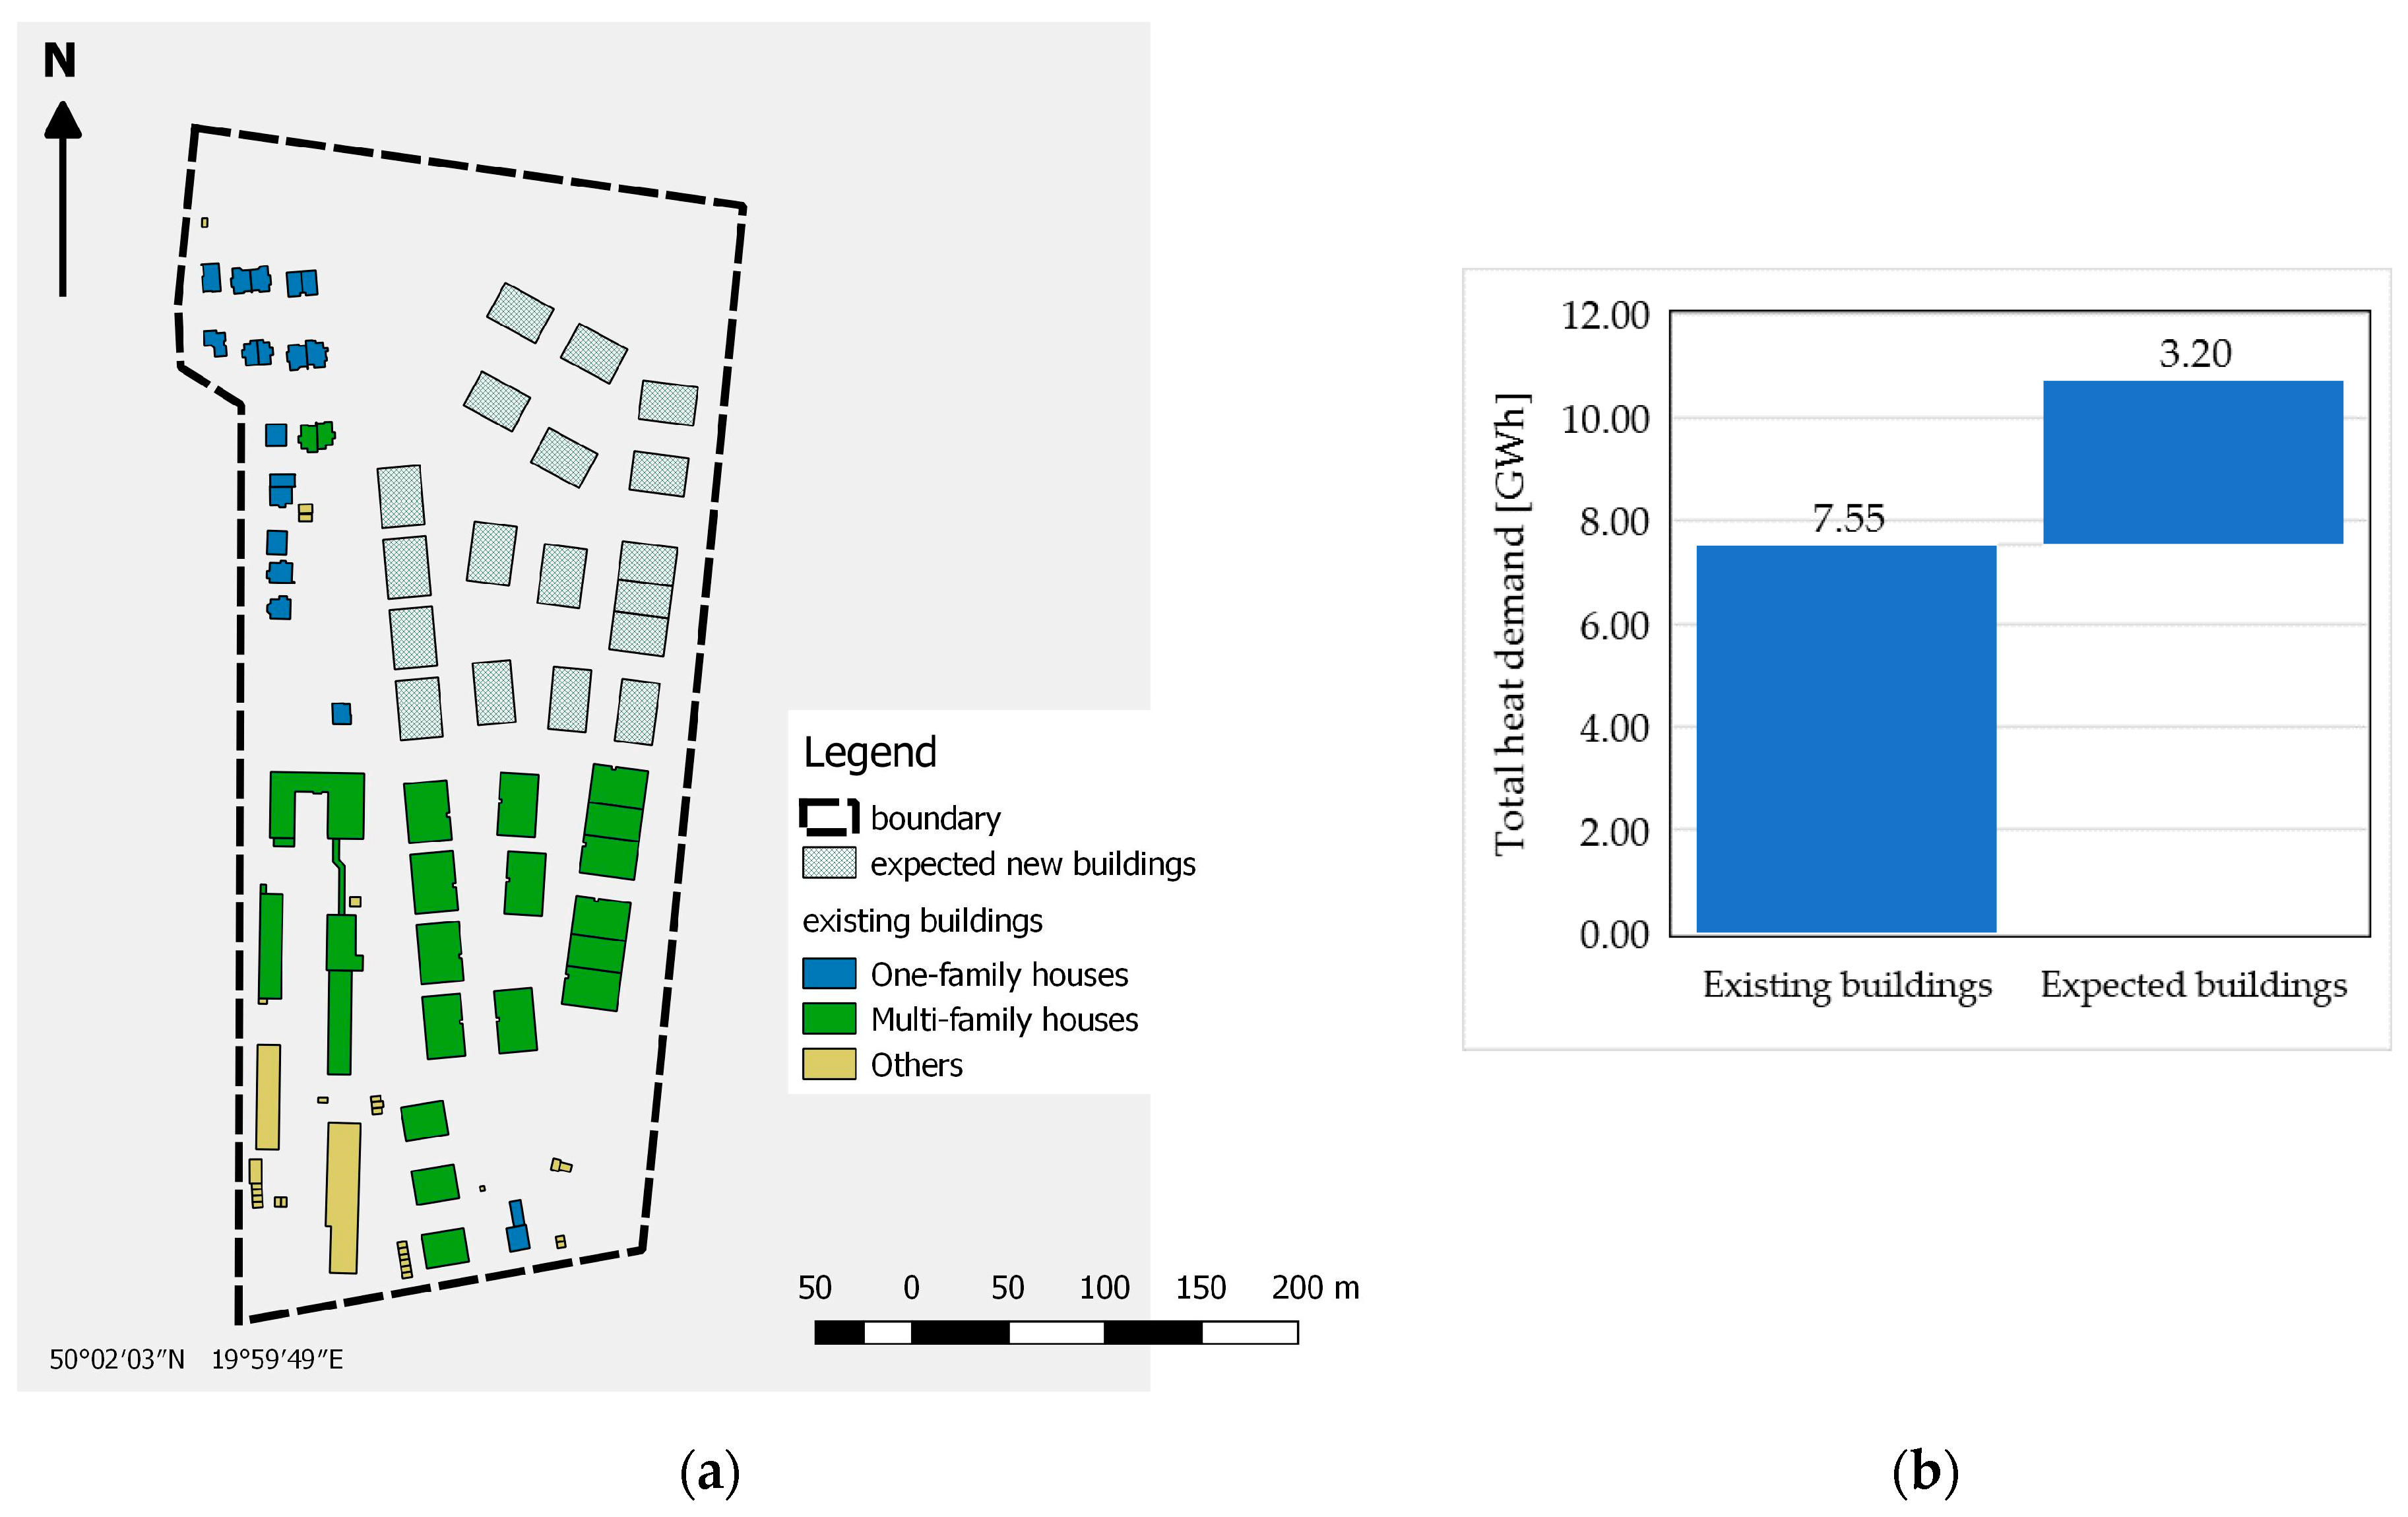
Figure 8.
Heat demand projection in 15 years of the existing and expected buildings as well as the growth of newly constructed areas.
Figure 8.
Heat demand projection in 15 years of the existing and expected buildings as well as the growth of newly constructed areas.

Figure 9.
Sensitivity analysis related to the heat demand in 2030.

Figure 10.
Comparison of the calculated and reported final district heat consumption.


Table 1.
Coefficients of residential buildings used in the case study.
| Building Type (Code) | cf [-] | Specific Heat Demand [kWh/(m2⋅year)] | |||
|---|---|---|---|---|---|
| Non-specified area | Residential blocks since the mid-60s | Post-war multi-family buildings | |||
| One-family houses (BUBD01) | 0.79 | eh 1 | 184.1 | - | - |
| eve | 57.07 | - | - | ||
| ew | 24.09 | - | |||
| Two-family houses (BUBD02) | 0.76 | eh 1 | 162.15 | - | - |
| eve | 62.38 | - | - | ||
| ew | 27.53 | - | - | ||
| Multi-family houses (BUBD03) | 0.79 | eh 1 | 274.15 | 104.15 | 154.25 |
| eve | 41.22 | 38.74 | 39.02 | ||
| ew | 27.53 | 27.53 | 27.53 | ||
| Collective buildings (BUBD04) | 0.80 | eh 1 | 88.45 | - | - |
| eve | 44.52 | - | - | ||
| ew | 43.01 | - | - | ||
1 Including specific heat demand for ventilation.
Table 2.
Coefficients of efficiencies of various heating systems.
| Heating System Type | Efficiency of the Source | Efficiencies of Transmission, Regulation and Accumulation Process | Overall Efficiency |
|---|---|---|---|
| Coal boiler | 0.82 | 0.84 | 0.69 |
| Gas boiler | 0.95 | 0.84 | 0.80 |
| Oil boiler | 0.95 | 0.84 | 0.80 |
| Biomass boiler | 0.70 | 0.84 | 0.59 |
| Electric heating | 0.99 | 0.90 | 0.89 |
| District heating | 0.98 | 0.84 | 0.82 |
| Energy Carriers | 2008 | 2009 | 2010 | 2011 | 2012 | |||||
|---|---|---|---|---|---|---|---|---|---|---|
| District heat | 2611.1 | (36.6%) | 2545.8 | (35.9%) | 2565 | (34.9%) | 2571.9 | (36.3%) | 2600.0 | (36.1%) |
| Solid fuels | 399 | (5.6%) | 357.75 | (5.0%) | 316.5 | (4.3%) | 275.25 | (3.9%) | 234.0 | (3.2%) |
| Oil | 21 | (0.3%) | 22.75 | (0.3%) | 24.5 | (0.3%) | 26.25 | (0.4%) | 28.0 | (0.4%) |
| Natural gas | 1755.6 | (24.6%) | 1826.5 | (25.8%) | 1945.3 | (26.4%) | 1707.3 | (24.1%) | 1783.0 | (24.7%) |
| Electricity | 2351.4 | (32.9%) | 2335.2 | (32.9%) | 2507.1 | (34.1%) | 2510.7 | (35.4%) | 2564.0 | (35.6%) |
Table 4.
District heat consumption in TJ per year.
| Services | Useful Heat Demand | Final Energy Consumption | Final Energy Consumption Reported by MPEC 1 |
|---|---|---|---|
| Space heating | 8956 | 10,922 | 7945 |
1 The values from [19] for 2015. The conversion from MWth to TJ based on capacity factor from 2012.
Table 5.
Statistical analysis of 131 buildings.
| Building Function Types | MPE | R | FAC2 | NMSE |
|---|---|---|---|---|
| All buildings | 22.96 | 0.56 | 0.98 | 0.73 |
| Residential buildings 1 | 16.04 | 0.68 | 1.00 | 0.34 |
| Offices, commercial & services buildings 1 | −19.44 | 0.80 | 1.00 | 0.69 |
| Others | 20.61 | 0.58 | 0.98 | 0.71 |
1 Buildings excluded two outliers.
© 2017 by the authors. Licensee MDPI, Basel, Switzerland. This article is an open access article distributed under the terms and conditions of the Creative Commons Attribution (CC BY) license (http://creativecommons.org/licenses/by/4.0/).
Share and Cite
MDPI and ACS Style
Wyrwa, A.; Chen, Y.-k. Mapping Urban Heat Demand with the Use of GIS-Based Tools. Energies 2017, 10, 720. https://doi.org/10.3390/en10050720
AMA Style
Wyrwa A, Chen Y-k. Mapping Urban Heat Demand with the Use of GIS-Based Tools. Energies. 2017; 10(5):720. https://doi.org/10.3390/en10050720
Chicago/Turabian StyleWyrwa, Artur, and Yi-kuang Chen. 2017. "Mapping Urban Heat Demand with the Use of GIS-Based Tools" Energies 10, no. 5: 720. https://doi.org/10.3390/en10050720
Note that from the first issue of 2016, this journal uses article numbers instead of page numbers. See further details here.