
Managing Traffic Flows for Cleaner Cities: The Role of Green Navigation Systems


Abstract
:1. Introduction
2. Climate Change and Air Pollution: Co-Benefits and Conflicts of Transport Emissions Reduction Strategies in Urban Areas
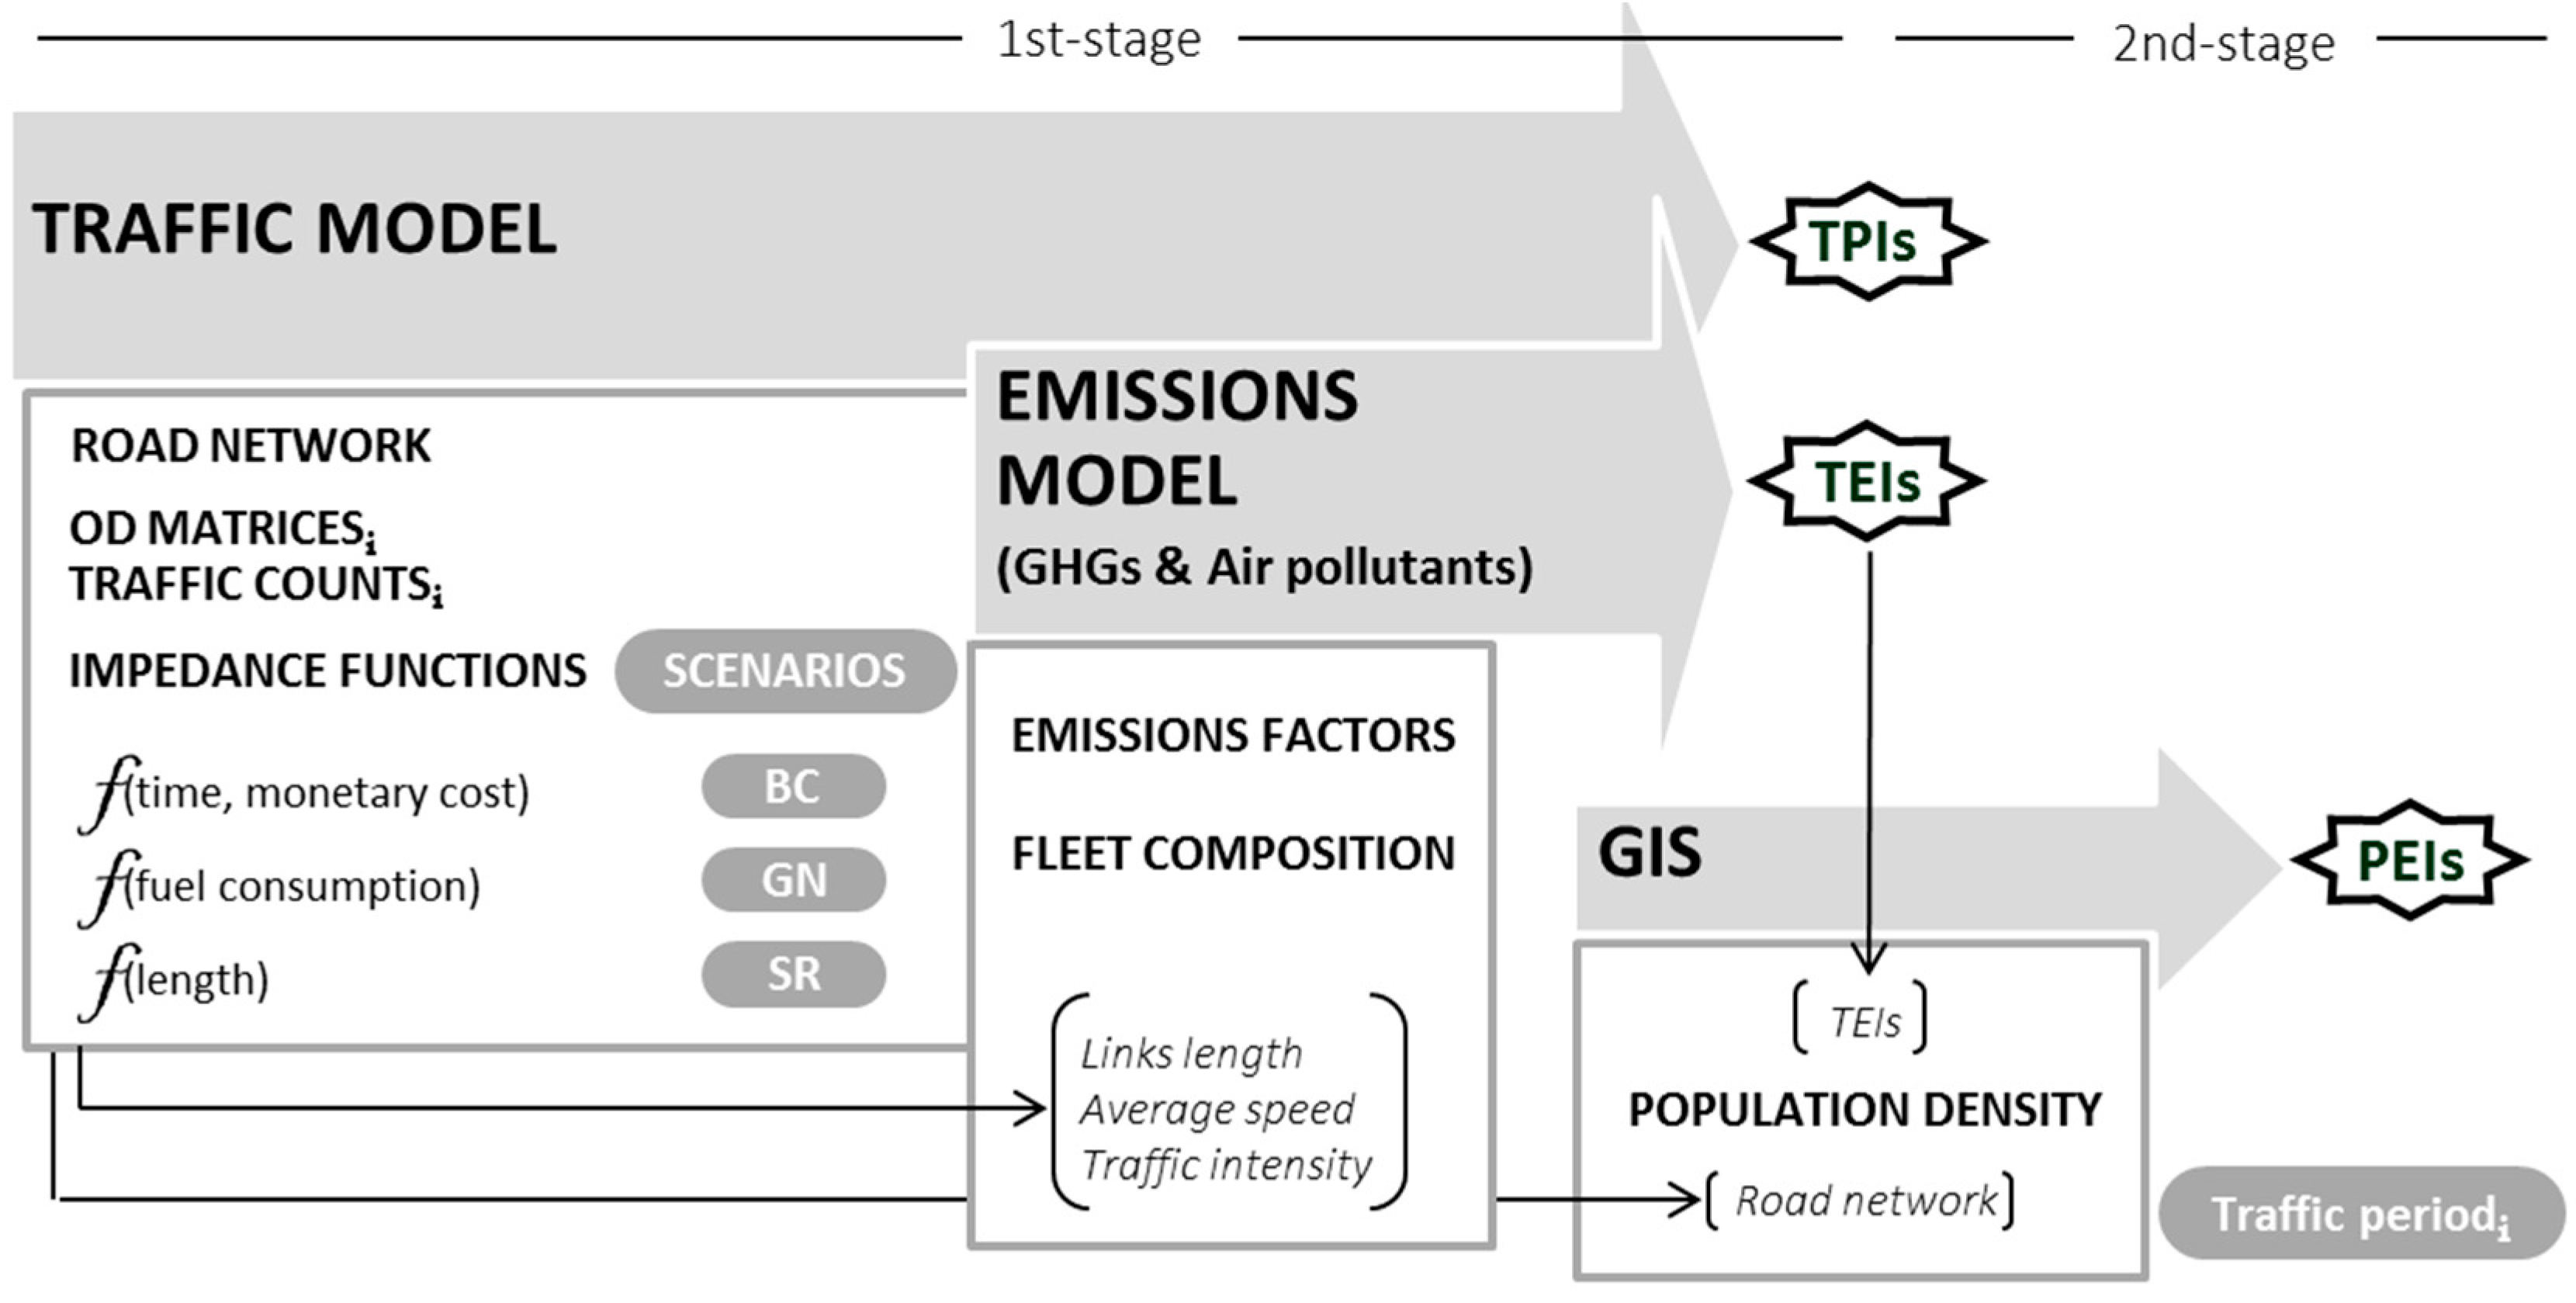
3. Method
3.1. Traffic Scenarios
- The BC represented the existing traffic situation. It will assign the typical impedance function for conventional drivers, which is based on time and cost.
- The GN scenario assigned an impedance function defined in terms of fuel consumption, which is directly related to CO2 emissions, i.e., the assignment will seek results that minimize fuel consumption, and therefore CO2 emissions, as well. The ICT-Emissions project tested five different fuel consumption functions from different studies, and the one that best performed under congested traffic conditions was selected, i.e., the default fuel consumption function of COPERT (g/km), expressed as a function of time (g/s) [1,7]:where: IGN is the GN impedance function expressed in seconds, FC is the COPERT default fuel consumption function expressed in g/s as:a = −3.29612 × 10⁻¹, b = 1.097 × 10⁻⁷, c = −1.1893 × 10⁻⁵, d = 5.30345 × 10⁻⁴, e = −1.56253 × 10⁻³, f = 0.256344, vCur is the link average speed calculated in the traffic model in km/h, and tCur is the link travel time calculated by the traffic model in seconds.
- A SR scenario has also been considered. This last scenario assigned an impedance function defined exclusively in terms of trip length.
3.2. Assessment Indicators
- VKM (Vehicle KiloMeters travelled) represents traffic volume as a product of traffic intensity (number of vehicles crossing a specific section in an hour) and section length. See Equation (1), where I is the traffic intensity (vehicles/hour) in a specific link of the network for an average hour in the time period considered; l is the length (km) of the link; i represents the links of the network; and p represents an hour under the traffic condition considered (congested and free-flow). N represents the different aggregation levels used to show the results, e.g., by road type (highways, urban roads, extra-urban). Traffic volume is often described as an indicator of traffic demand. It characterizes the traffic flow over a road link on an average hour in a day. Saturation (traffic intensity divided by section capacity) and traffic volume will be used as synonyms for traffic intensity when used in relative terms, since the measurement under study does not modify the length nor the capacity of the links.
- VEH (VEhicles per Hour) represents the total travel time of all vehicles on a link or segment of the road for an average hour of the three defined periods. It is calculated as a product of the traffic intensity and travel time. See Equation (2), where t is the travel time in hours on a specific link of the network for an average hour in the time period considered, and the rest of the terms are the same as those used in VKM.
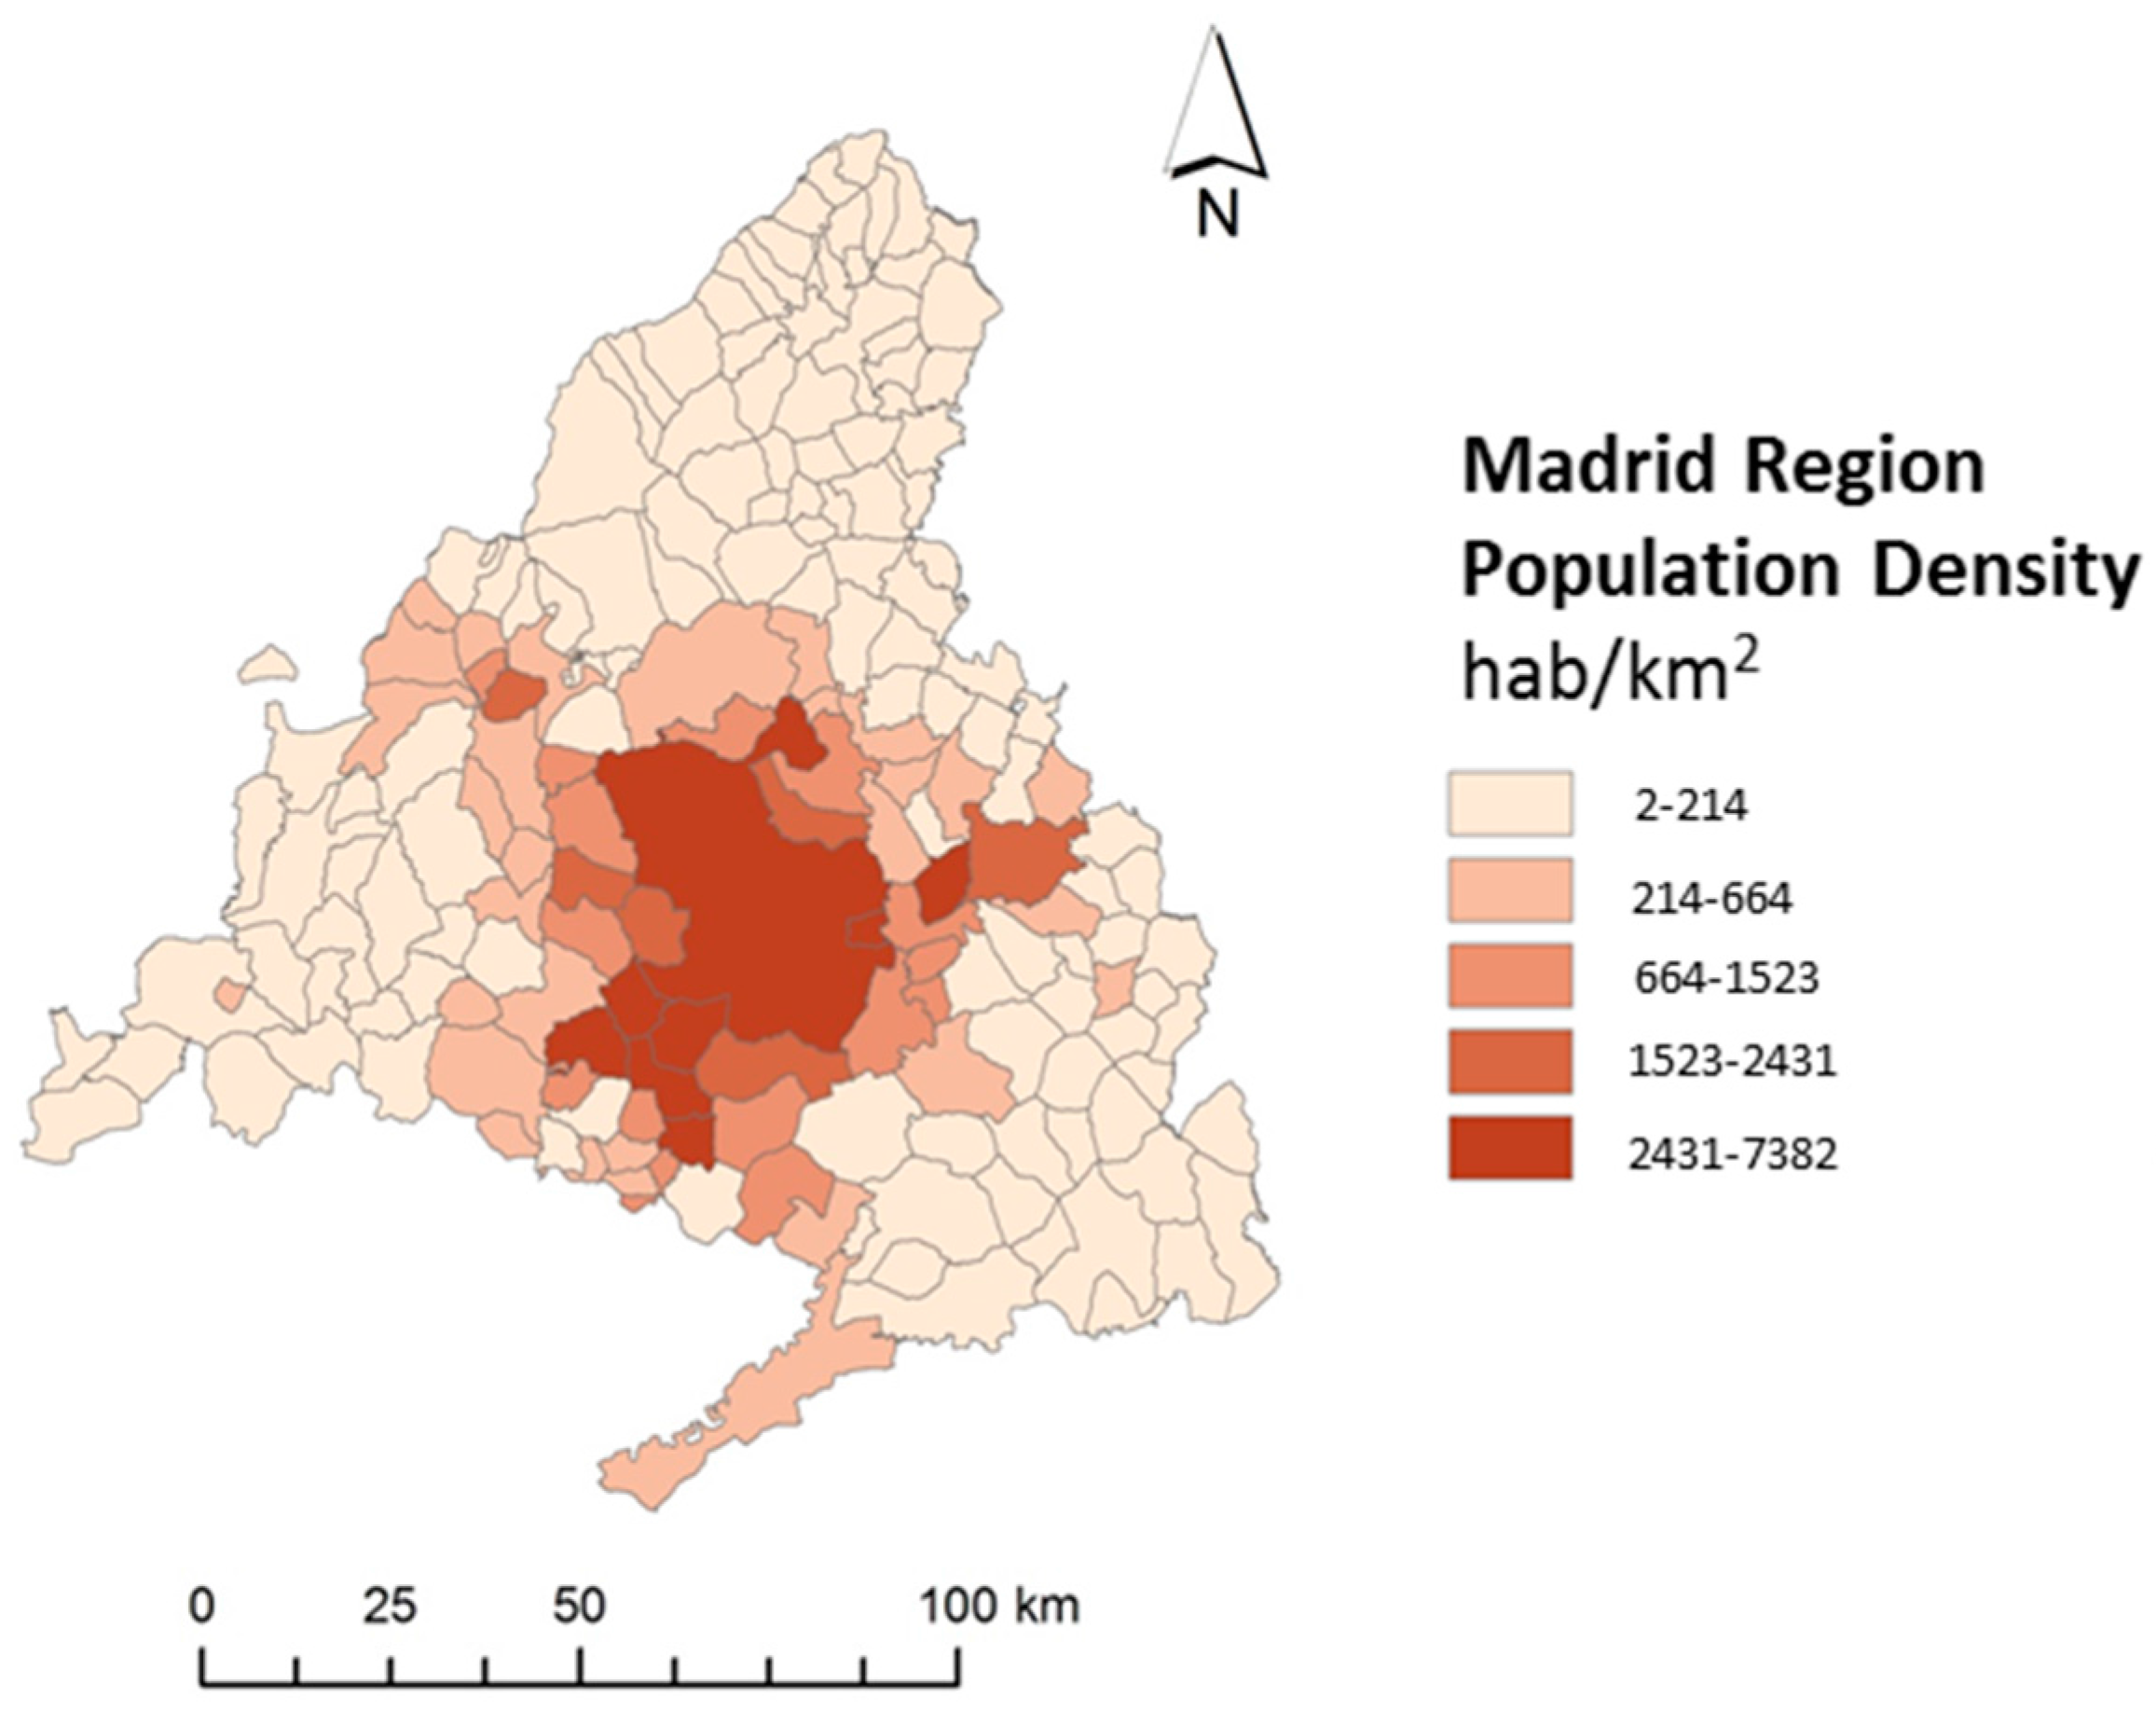
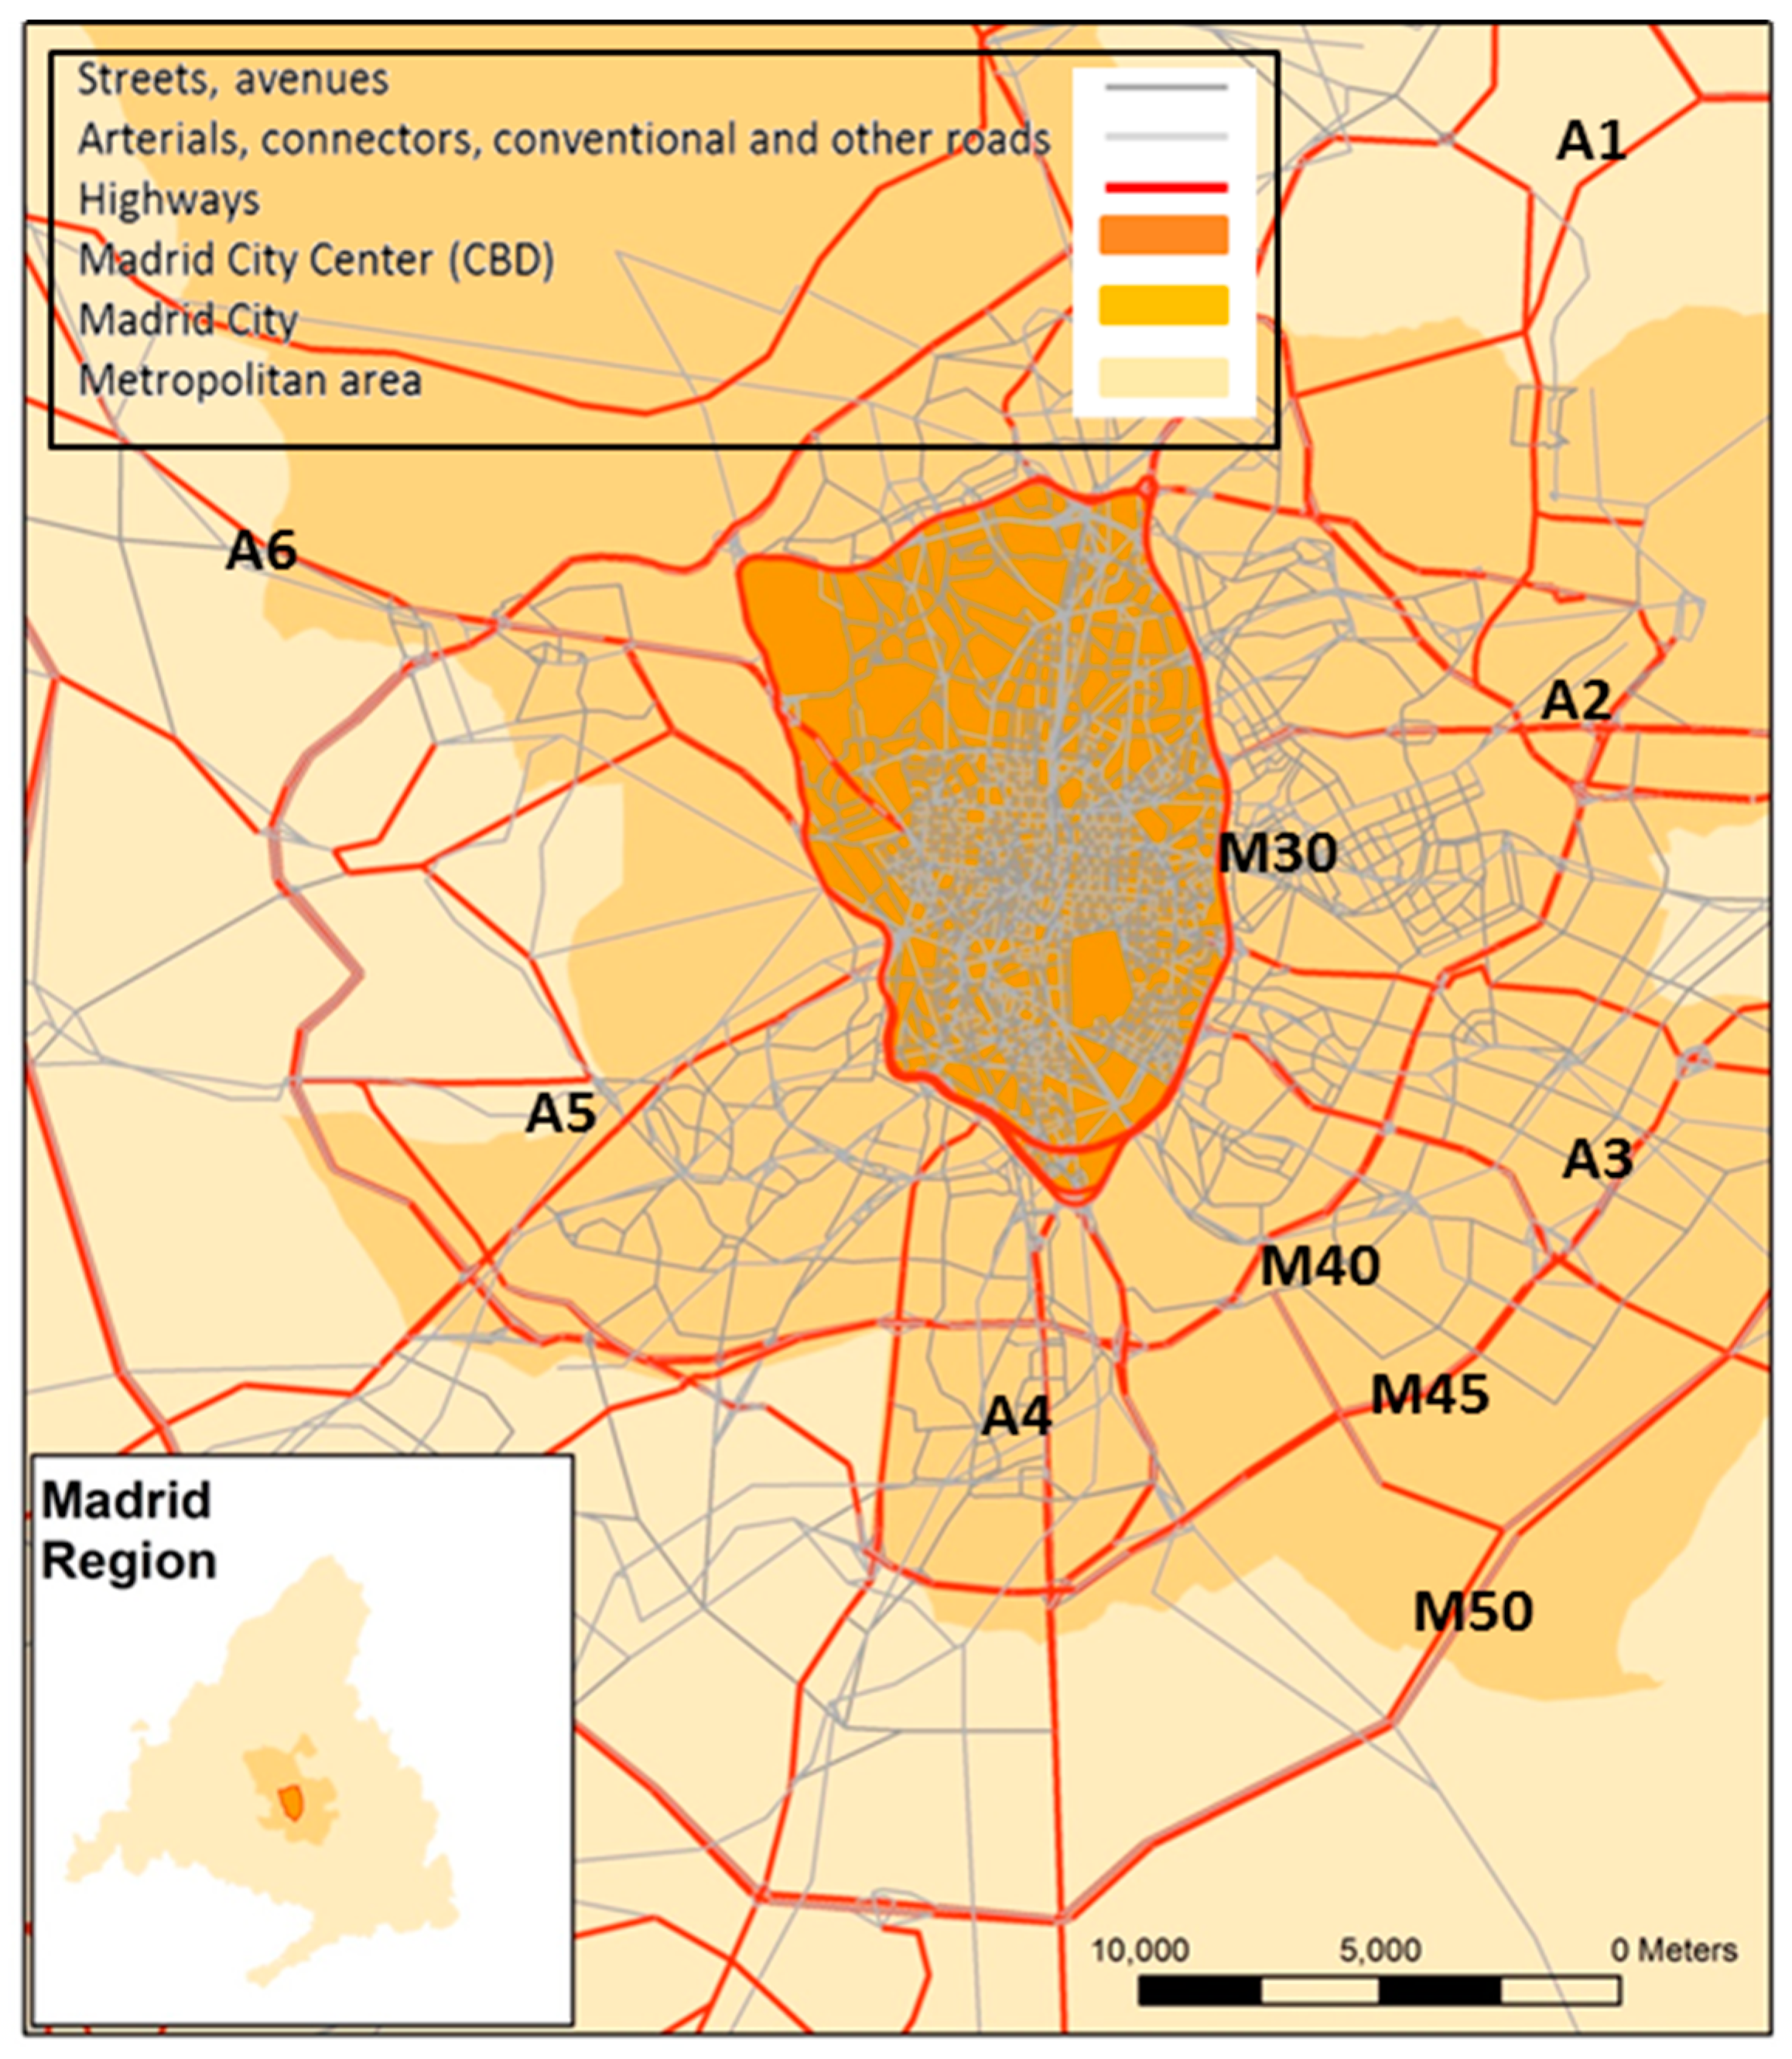
3.3. Attributes of Model Components in the Madrid Case Study
3.3.1. Traffic Model Attributes
- CBD NETWORK represents 1670 km of streets and avenues inside the M30 and accounts for 28% of the whole network.
- HIGHWAYS represent 1647 km of urban ring-roads, highways, and motorways and also account for 28% of the whole road network.
- OTHER ROADS aggregate 2560 km of conventional roads, junctions, and service lanes belonging to the peripheral, metropolitan, and regional areas, and account for 44% of the entire network.
3.3.2. Emissions Model Attributes
3.3.3. GIS Attributes
3.4. Model Assumptions and Limitations
4. Results and Discussion
4.1. Whole Region
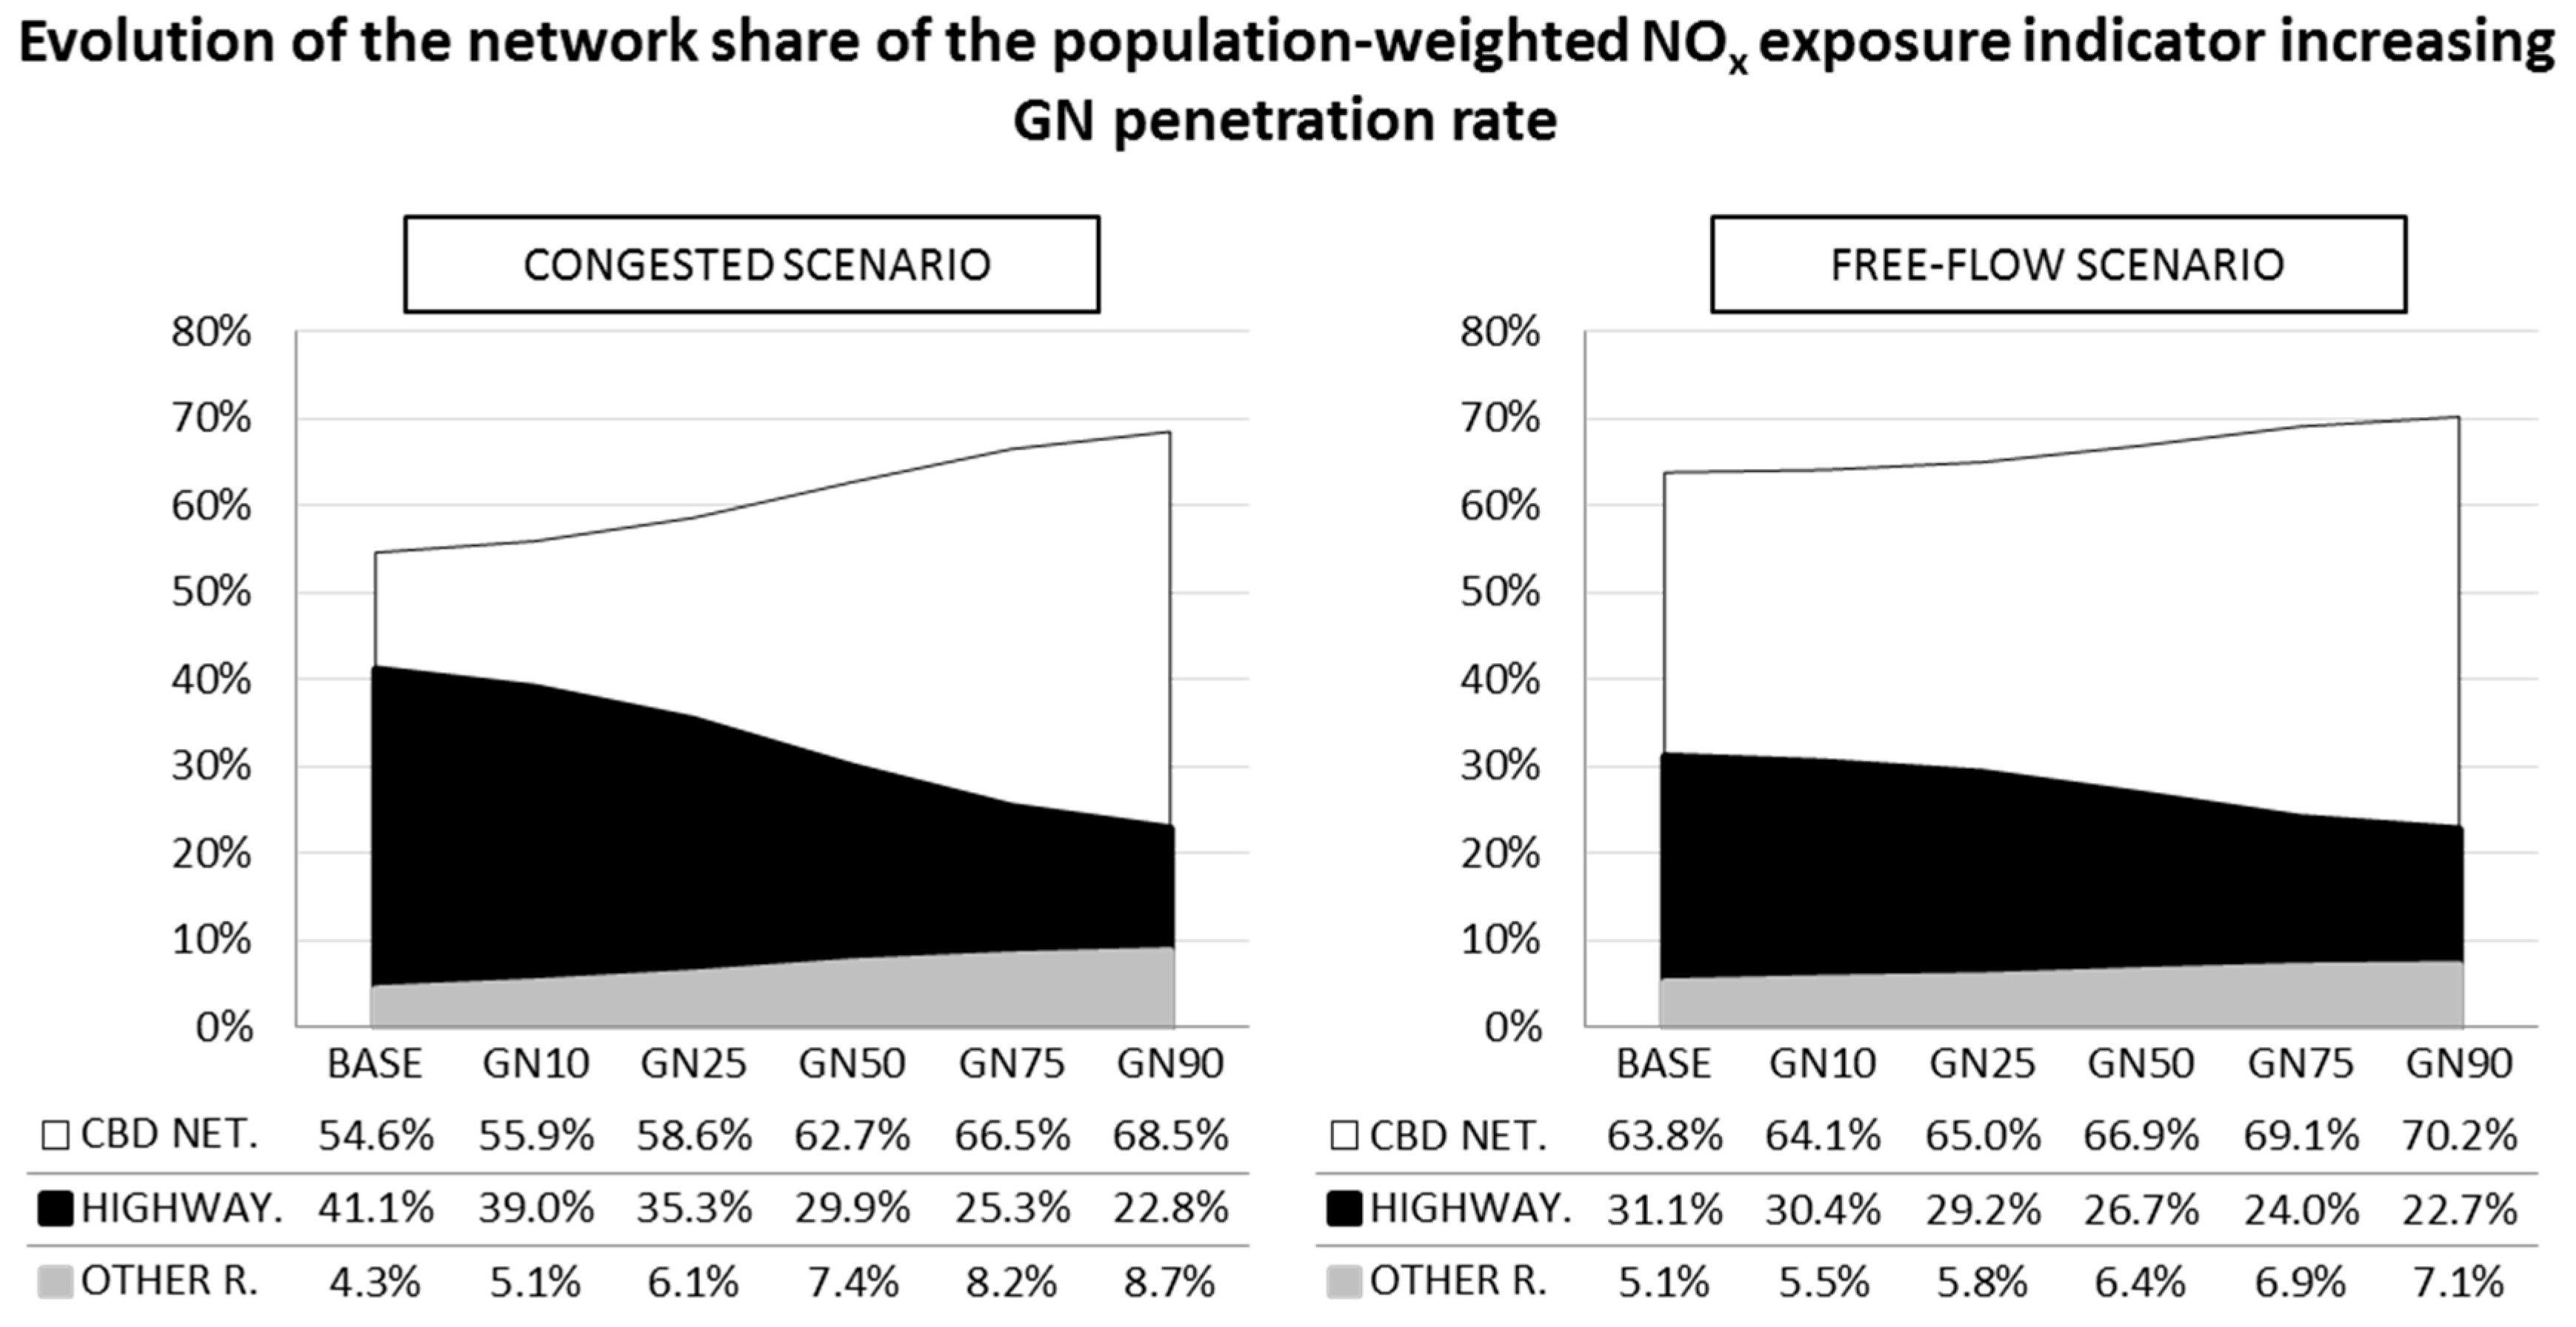
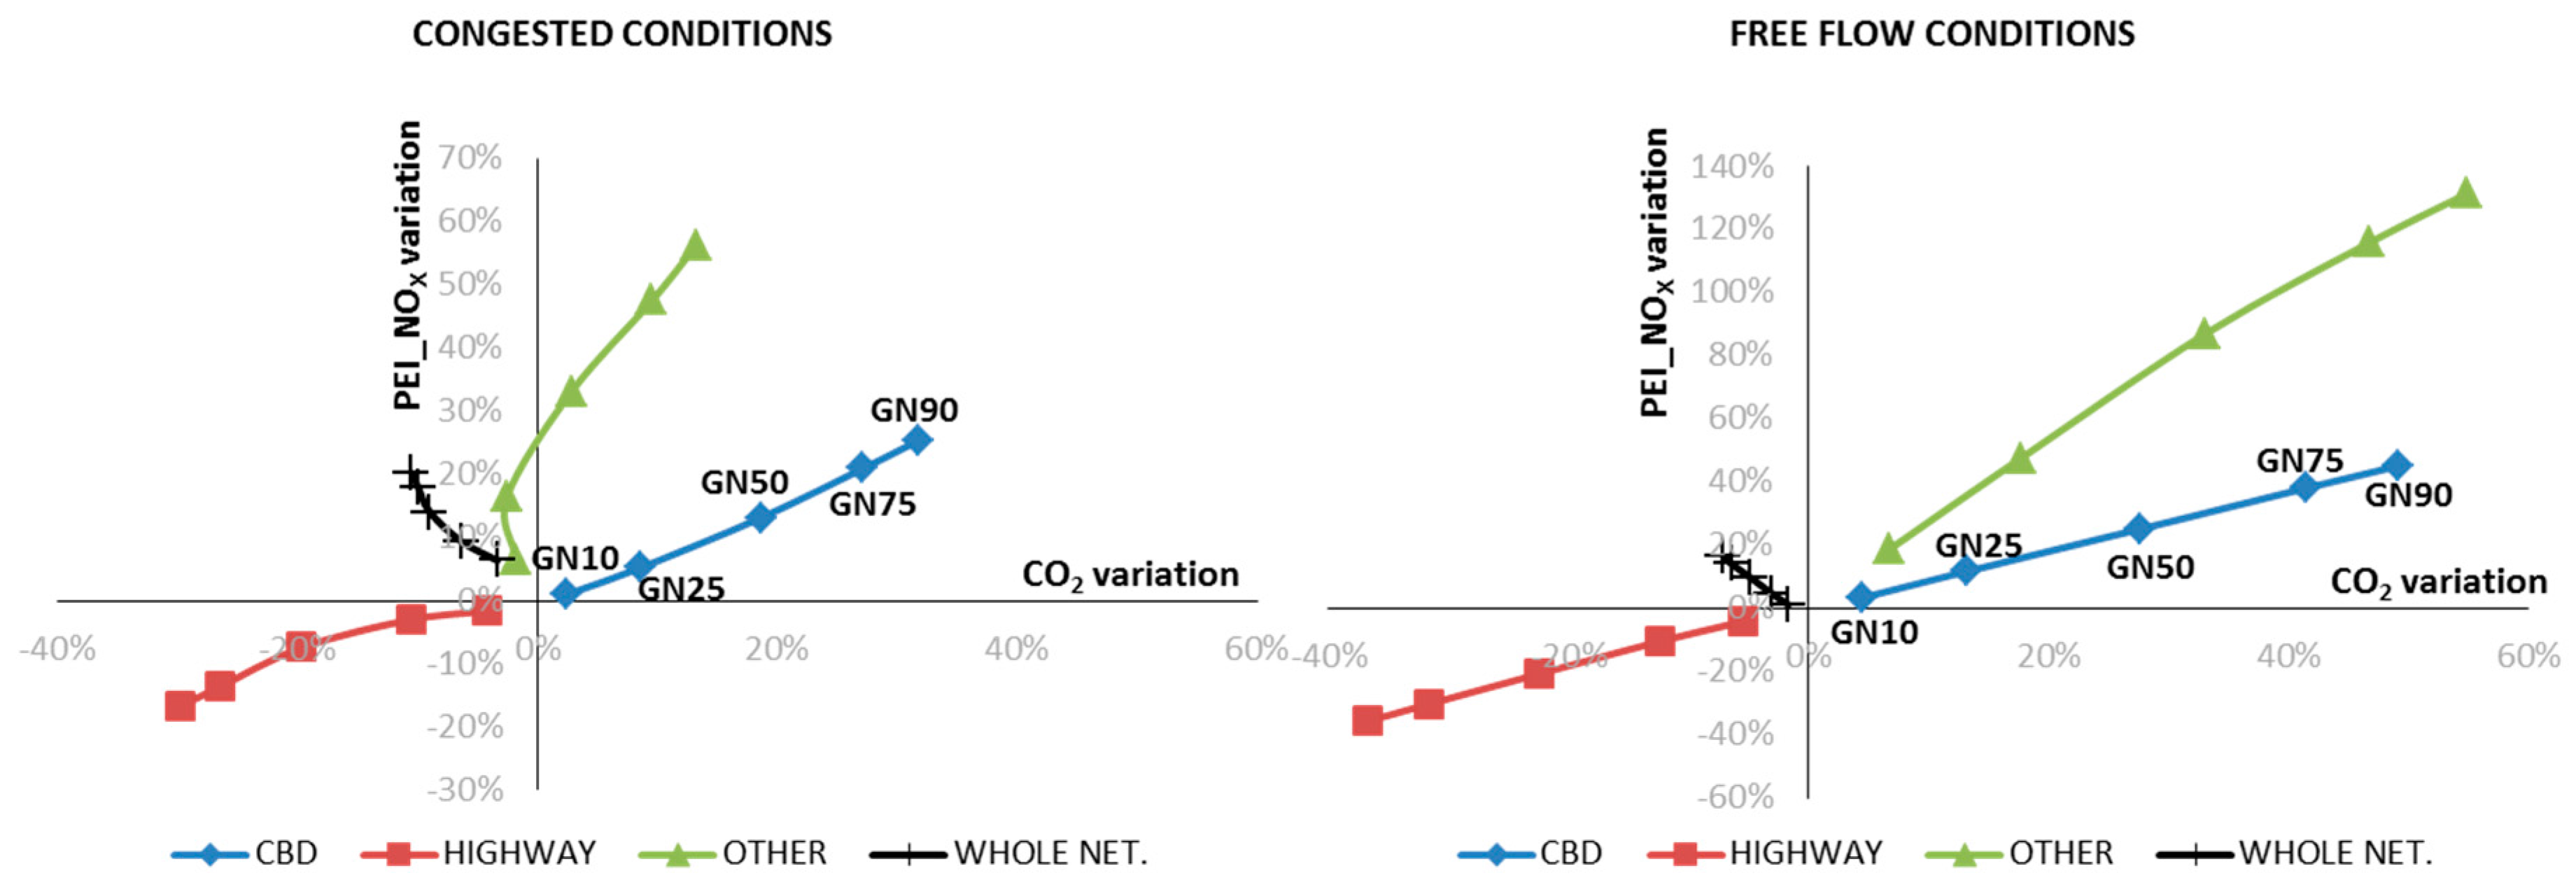
4.2. Results by Road Type
5. Conclusions
Acknowledgments
Author Contributions
Conflicts of Interest
References
- Samaras, Z.; Ntziachirstos, L.; Toffolo, S.; Magra, G.; Garcia-Castro, A.; Valdes, C.; Vock, C.; Maier, W. Quantification of the effect of ITS on CO2 emissions from road transportation. Transp. Res. Procedia 2016, 14, 3139–3148. [Google Scholar] [CrossRef]
- Garcia-Castro, A.; Monzon, A. Using floating car data to analyse the effects of ITS measures and eco-driving. Sensors 2014, 14, 21358–21374. [Google Scholar] [CrossRef] [PubMed]
- Baptista, P.C.; Azevedo, I.L.; Farias, T.L. ICT solutions in transportation systems: Estimating the benefits and environmental impacts in the Lisbon. Procedia-Soc. Behav. Sci. 2012, 54, 716–725. [Google Scholar] [CrossRef]
- Xia, H.; Boriboonsomsin, K.; Barth, M. Dynamic eco-driving for signalized arterial corridors and its indirect network-wide energy/emissions benefits. J. Intell. Transp. Syst. 2013, 17, 31–41. [Google Scholar] [CrossRef]
- Ericsson, E.; Larsson, H.; Brundell-Freij, K. Optimizing route choice for lowest fuel consumption—Potential effects of a new driver support tool. Transp. Res. Part C Emerg. Technol. 2016, 14, 369–383. [Google Scholar] [CrossRef]
- Ahn, K.; Rakha, H.A. Network-wide impacts of eco-routing strategies: A large-scale case study. Transp. Res. Part D Transp. Environ. 2013, 25, 119–130. [Google Scholar] [CrossRef]
- Valdes, C.; Perez-Prada, F.; Monzon, A. Eco-routing: More green drivers means more benefits? In Proceedings of the XII Conference on Transport Engineering, Valencia, Spain, 7–9 June 2016. [Google Scholar]
- Perez-Prada, F.; Monzon, A. Ex-post environmental and traffic assessment of a speed reduction strategy in Madrid’s inner ring-road. J. Transp. Geogr. 2017, 58, 256–268. [Google Scholar] [CrossRef]
- CO2 Emissions from Fuel Combustion 2014, IEA, Paris. Available online: http://dx.doi.org/10.1787/co2_fuel-2014-en (accessed on 8 June 2017).
- European Environment Agency. Air Quality in Europe—2012; EEA Report No. 4/2012; European Environment Agency: Copenhagen, Denmark, 2012. [Google Scholar]
- Global Report on Human Settlements 2011. Cities and Climate Change. (2011). Available online: https://unhabitat.org/books/cities-and-climate-change-global-report-on-human-settlements-2011/ (accessed on 8 June 2017).
- Hickman, R.; Hall, P.; Banister, D. Planning more for sustainable mobility. J. Transp. Geogr. 2013, 33, 210–219. [Google Scholar] [CrossRef]
- Hickman, R.; Ashiru, O.; Banister, D. Transport and climate change: Simulating the options for carbon reduction in London. Transp. Policy 2010, 17, 110–125. [Google Scholar] [CrossRef]
- Banister, D.; Stead, D.; Steen, P.; Akerman, J.; Dreborg, K.; Nijkamp, P.; Schleicher-Tappeser, R. European Transport Policy and Sustainable Mobility; Routledge (Taylor & Francis Group): Abingdon, UK, 2000. [Google Scholar]
- Schipper, L.J.; Fulton, L. Carbon Dioxide Emissions from Transportation: Trends, Driving Factors, and Forces for Change. In Handbook of Transport and the Environment; Hensher, D.A., Button, K.J., Eds.; Emerald Publishing: Bradford, UK, 2003; Volume 4, pp. 203–225. [Google Scholar]
- Wright, L.; Fulton, L. Climate Change Mitigation and Transport in Developing Nations. Transp. Rev. 2005, 25, 691–717. [Google Scholar] [CrossRef]
- Rodrigue, J.-P.; Comtois, C.; Slack, B. The Geography of Transport Systems; Routledge: Abingdon, UK, 2009. [Google Scholar]
- Health Effects Institute. Traffic-Related Air Pollution: A Critical Review of the Literature on Emissions, Exposure, and Health Effects; Special Report 17; Health Effects Institute: Boston, MA, USA, 2010. [Google Scholar]
- White, R.H.; Spengler, J.D.; Dilwali, K.M.; Barry, B.E.; Samet, J.M. Report of workshop on traffic, health, and infrastructure planning. Arch. Environ. Occup. Health 2005, 60, 70–76. [Google Scholar] [CrossRef] [PubMed]
- Perez-Prada, F.; Monzon, A. Identifying traffic emission hotspots for urban air quality interventions: The case of Madrid City. In Proceedings of the 96th Annual Meeting Transportation Research Meeting, Washington, DC, USA, 8–12 January 2017. [Google Scholar]
- Woodcock, J.; Edwards, P.; Armstrong, B.J.; Ashiru, O.; Banister, D.; Beevers, S.; Chalabi, Z.; Chowdhury, Z.; Cohen, A.; Franco, O.H.; et al. Public health benefits of strategies to reduce greenhouse-gas emissions: Urban land transport. Lancet 2009, 374, 1930–1943. [Google Scholar] [CrossRef]
- Thambiran, T.; Diab, R.D. The case for integrated air quality and climate change policies. Environ. Sci. Policy 2011, 14, 1008–1017. [Google Scholar] [CrossRef]
- Oxley, T.; Elshkaki, A.; Kwiatkowski, L.; Castillo, A.; Scarbrough, T.; ApSimon, H. Pollution abatement from road transport: Cross-sectoral implications, climate co-benefits and behavioural change. Environ. Sci. Policy 2012, 19–20, 16–32. [Google Scholar] [CrossRef]
- Mao, X.; Yang, S.; Liu, Q.; Tu, J.; Jaccard, M. Achieving CO2 emission reduction and the co-benefits of local air pollution abatement in the transportation sector of China. Environ. Sci. Policy 2012, 21, 1–13. [Google Scholar] [CrossRef]
- Geng, Y.; Ma, Z.X.; Xue, B.; Ren, W.X.; Liu, Z.; Fujita, T. Co-benefit evaluation for urban public transportation sector—a case of Shenyang, China. J. Clean. Prod. 2013, 58, 82–91. [Google Scholar] [CrossRef]
- Xue, X.Z.; Ren, Y.; Cui, S.H.; Lin, J.Y.; Huang, W.; Zhou, J. Integrated analysis of GHGs and public health damage mitigation for developing urban road transportation strategies. Transp. Res. Part D Transp. Environ. 2015, 35, 84–103. [Google Scholar] [CrossRef]
- Dhar, S.; Shukla, P.R. Low carbon scenarios for transport in India: Co-benefits analysis. Energy Policy 2015, 81, 186–198. [Google Scholar] [CrossRef]
- Pathak, M.; Shukla, P.R. Co-benefits of low carbon passenger transport actions in Indian cities: Case study of Ahmedabad. Transp. Res. Part D Transp. Environ. 2016, 44, 303–316. [Google Scholar] [CrossRef]
- Schipper, L.; Fulton, L. Disappointed by diesel? Impacts of shift to diesels in Europe through 2006. Transp. Res. Rec. J. Transp. Res. Board 2009, 2139, 1–10. [Google Scholar] [CrossRef]
- Schipper, L.; Fulton, L. Dazzled by diesel? The impact on carbon dioxide emissions of the shift to diesels in Europe through 2009. Energy Policy 2013, 54, 3–10. [Google Scholar] [CrossRef]
- Leinert, S.; Daly, H.; Hyde, B.; Gallachóir, B.Ó. Co-benefits? Not always: Quantifying the negative effect of a CO2-reducing car taxation policy on NOx emissions. Energy Policy 2013, 63, 1151–1159. [Google Scholar] [CrossRef]
- Panwar, N.L.; Shrirame, H.Y.; Rathore, N.S.; Jindal, S.; Kurchania, A.K. Performance Evaluation of a Diesel Engine Fueled with Methyl Ester of Castor Seed Oil. Appl. Therm. Eng. 2010, 30, 245–249. [Google Scholar] [CrossRef]
- Saravanan, S.; Nagarajan, G.; Rao, G.L.N.; Sampath, S. Combustion characteristics of a stationary diesel engine fuelled with a blend of crude rice bran oil methyl ester and diesel. Energy 2010, 35, 94–100. [Google Scholar] [CrossRef]
- Qi, D.H.; Chen, H.; Geng, L.M.; Bian, Y.Z.; Ren, X.C. Performance and combustion characteristics of biodiesel-diesel-methanol blend fuelled engine. Appl. Energy 2010, 87, 1679–1686. [Google Scholar] [CrossRef]
- Lin, C.-Y.; Huang, J.-C. An oxygenating additive for improving the performance and emission characteristics of marine diesel engines. Ocean Eng. 2003, 30, 1699–1715. [Google Scholar] [CrossRef]
- Godiganur, S.; Murthy, C.S.; Reddy, R.P. Performance and emission characteristics of a Kirloskar HA394 diesel engine operated on fish oil methyl esters. Renew. Energy 2010, 35, 355–359. [Google Scholar] [CrossRef]
- Hooftman, N.; Oliveira, L.; Messagie, M.; Coosemans, T.; Van Mierlo, J. Environmental Analysis of petrol, diesel and electric passenger cars in a Belgian urban setting. Energies 2016, 9, 84. [Google Scholar] [CrossRef]
- Sioshansi, R.; Fagiani, R.; Marano, V. Cost and emissions impacts of plug-in hybrid vehicles on the Ohio power system. Energy Policy 2010, 38, 6703–6712. [Google Scholar] [CrossRef]
- Lang, J.; Cheng, S.Y.; Zhou, Y.; Zhao, B.B.; Wang, H.Y.; Zhang, S.J. Energy and environmental implications of hybrid and electric vehicles in China. Energies 2013, 6, 2663–2685. [Google Scholar] [CrossRef]
- Ghafghazi, G.; Hatzopoulou, M. Simulating the air quality impacts of traffic calming schemes in a dense urban neighborhood. Transp. Res. Part D Transp. Environ. 2015, 35, 11–22. [Google Scholar] [CrossRef]
- Jazcilevich, A.; Mares Vázquez, J.M.; Ramírez, P.L.; Pérez, I.R. Economic-environmental analysis of traffic-calming devices. Transp. Res. Part D Transp. Environ. 2015, 36, 86–95. [Google Scholar] [CrossRef]
- Garcia-Castro, A.; Monzon, A.; Valdes, C.; Romana, M. Modelling different penetration rates of eco-driving in urban areas. Impacts on traffic flow and emissions. Int. J. Sustain. Transp. 2016, 11, 282–294. [Google Scholar] [CrossRef]
- Madireddy, M.; de Coense, B.; Can, A.; Degraeuwe, B.; Beusen, B.; de Vilieger, I.; Botteldooren, D. Assessment of the impact of speed limit reduction and traffic signal coordination on vehicle emissions using an integrated approach. Transp. Res. Part D Transp. Environ. 2011, 16, 504–508. [Google Scholar] [CrossRef]
- Cohen, S.; Christoforou, Z.; Seidowsky, R. Assessing the impact of speed limit changes on urban motorways: A simulation study in Lille, France. Transp. Res. Procedia 2014, 3, 915–924. [Google Scholar] [CrossRef]
- Monzon, A.; Pardillo, J.; Vega, L.; Bustinduy, J.; Vicente, A.; Perez, M. El programa de mejoras de la M-30 en el contexto de una estrategia de movilidad sostenible para Madrid. Rev. Obras Publicas. CICCP. 2005, N 3454, 7–26. [Google Scholar]
- Perez-Prada, F.; Monzon, A. Cuantificación y evaluación de los impactos económicos, sociales y ambientales de calle30, Horizonte 2010. In Proceedings of the Actas del X Congreso de Ingeniería del Transporte: Transporte Innovador y Sostenible de Cara al Siglo XXI, Granda, Spain, 20–22 June 2012. [Google Scholar]
- Gonzalez Diez, V.M.; Verner, D.; Corrales, M.E.; Puerta, J.M.; Mendieta Umaña, M.P.; Morales, C.; Suarez, D.; Linares, A.M.; Scholl, L.; Quintanilla, O.; et al. Building Resilience and Reducing Emissions. Climate Change and IDB; Inter-American Development Bank: Washington, DC, USA, 2014. [Google Scholar]
- Toffolo, S.; Morello, E.; Samaras, Z.; Ntziachristos, L.; Vock, C.; Maier, W.; Garcia-Castro, A. ICT-emissions methodology for assessing ITS and ICT solutions. In Proceedings of the Transport Research Arena, Paris, France, 14–17 April 2014. [Google Scholar]
- VISUM 14.0 Basics. Available online: http://vision-traffic.ptvgroup.com/en-us/products/ptv-visum/ (accessed on 8 June 2017).
- Han, X.; Naeher, L.P. A review of traffic-related air pollution exposure assessment studies in the developing world. Environ. Int. 2015, 32, 106–120. [Google Scholar] [CrossRef] [PubMed]
- Beckerman, B.; Jerrett, M.; Brook, J.R.; Verma, D.K.; Arain, M.A.; Finkelstein, M.M. Correlation of nitrogen dioxide with other traffic pollutants near a major expressway. Atmos. Environ. 2008, 42, 275–290. [Google Scholar] [CrossRef]
- Laña, I.; Del Ser, J.; Padró, A.; Vélez, M.; Casanova-Mateo, C. The role of local urban traffic and meteorological conditions in air pollution: A data-based case study in Madrid, Spain. Atmos. Environ. 2016, 145, 424–438. [Google Scholar] [CrossRef]
- Gorham, R. Air Pollution from Ground Transportation: An Assessment of Causes, Strategies and Tactics, and Proposed Actions for the International Community. Available online: http://www.un.org/esa/gite/csd/gorham.pdf (accessed on 8 June 2017).
- Brown, M.; Sarnat, S.; DeMuth, K.; Brown, L.; Whitlock, D.; Brown, S.; Tolbert, P.; Fitzpatrick, A. Residential proximity to a major roadway is associated with features of asthma control in children. PLoS ONE 2012, 7, e37044. [Google Scholar] [CrossRef] [PubMed]
- Porebski, G.; Woźniak, M.; Czarnobilska, E. Residential proximity to major roadways is associated with increased prevalence of allergic respiratory symptoms in children. Ann. Agric. Environ. Med. 2014, 21, 760–766. [Google Scholar] [CrossRef] [PubMed]
- Monzon, A.; Cascajo, R.; Díaz, M.; Barberán, A. Observatorio de la Movilidad Metropolitana; Informe 2014; Talleres del Centro de Publicaciones del MAGRAMA: Madrid, Spain, 2016. [Google Scholar]
- Valdes, C. Optimization of Urban Mobility Measures to Achieve WIN-WIN Strategies. Ph.D. Thesis, Universidad Politecnica de Madrid, Madrid, Spain, 2012. [Google Scholar]
- Valdes Serrano, C.; Garcia-Castro, A.; Perez-Prada, F.; Tuffanelli, G.; Cianfano, M.; Magra, G.; Toffollo, S.; Monzón, A. Deliverable 6.2: Field Trials and Simulation Comparison. 2015. Available online: http://www.ict-emissions.eu/wp-content/uploads/2012/05/D_6_2_-Field-trials-and-simulation-comparison_Final_opt.pdf (accessed on 8 June 2017).
- Direccion General de Sostenibilidad y Planificacion de la Movilidad Ayuntamiento de Madrid. Estudio del Parque Circulante de la Ciudad de Madrid Año 2013. Available online: http://www.madrid.es/UnidadesDescentralizadas/Sostenibilidad/EspeInf/EnergiayCC/03Energia/3bMovilidad/ParqueCirculante/Ficheros/EstudioPCMad2013.pdf (accessed on 8 June 2017).
- Secciones censales de la Comunidad de Madrid. Madrid Region Government. Available online: http://www.madrid.org/iestadis/fijas/clasificaciones/seccioncensal.htm (accessed on 8 June 2017).
- Panis, L.I.; Beckx, C.; Broekx, S.; De Vlieger, I.; Schrooten, L.; Degraeuwe, B.; Pelkmans, L. PM, NOx and CO2 emission reductions from speed management policies in Europe. Transp. Policy 2011, 18, 32–37. [Google Scholar] [CrossRef]
- Grote, M.; Williams, I.; Preston, J.; Kemp, S. Including congestion effects in urban road traffic CO2 emissions modelling: Do Local Government Authorities have the right options? Transp. Res. Part D Transp. Environ. 2016, 43, 95–106. [Google Scholar] [CrossRef]
- Toffolo, S.; Vock, C.; Ntziachirstos, L.; Samaras, Z.; Maier, M.; Valdes, C.; Garcia-Castro, A. Deliverable D.5.2: Manual of Procedures for Use of the Methodology. 2015. Available online: http://www.ict-emissions.eu/wp-content/uploads/2012/05/D-5_2_ManualProcedures_Final.pdf (accessed on 8 June 2017).
- Ahn, K.; Rakha, H. The effects of route choice decisions on vehicle energy consumption and emissions. Transp. Res. Part D Transp. Environ. 2008, 13, 151–167. [Google Scholar] [CrossRef]
- Minett, C.F.; Salomons, A.M.; Daamen, W.; Van Arem, B.; Kuijpers, S. Eco-routing comparing fuel consumption of different routes between origin and destination using field test speed profiles and synthetic speed profiles. In Proceedings of the Integrated and Sustainable Transportation Systems, Vienna, Austria, 29 June–1 July 2011. [Google Scholar]
- Valdes, C. Deliverable 6.3: Results of Application of ICT Measures in ICT-EMISSIONS Partner Cities. 2015. Available online: http://www.ict-emissions.eu/wp-content/uploads/2012/05/D_6_3_Results-of-application-of-ICT-measures_FINAL.pdf (accessed on 8 June 2017).
- Jiménez, F.; Cabrera-Montiel, W.; Tapia-Fernandz, S. System for road vehicle energy optimization using real time road and traffic information. Energies 2014, 7, 3576–3598. [Google Scholar] [CrossRef]


| Vehicle Category and Fuel | CBD Network | Ring-Roads | Other Roads and Rest of the Highways |
|---|---|---|---|
| Passenger Cars | 83.4% | 88.0% | 86.2% |
| Gasoline | 25.2% | 25.8% | 25.1% |
| Diesel | 55.8% | 61.4% | 60.1% |
| Others | 2.4% | 0.8% | 1.0% |
| LDV | 4.7% | 8.5% | 8.6% |
| Gasoline | 0.1% | 0.3% | 0.2% |
| Diesel | 4.6% | 8.2% | 8.4% |
| HDV | 1.0% | 2.0% | 1.8% |
| Bus | 2.0% | 1.0% | 1.6% |
| Diesel | 1.1% | 1.0% | 1.3% |
| Others | 0.8% | 0.0% | 0.3% |
| Mopeds and Motorcycles | 8.9% | 0.5% | 1.8% |
| Penetration Rates | VKM (veh × km) | VEH (veh × h) | TEI_CO2 (kg) | TEI_NOx (kg) | PEI_NOx (kg × hab./km2) |
|---|---|---|---|---|---|
| BC_cong | 5,884,915 | 96,541 | 904,802 | 3009 | 10,277,277 |
| GN10 | −3.7% | 6.8% | −3.3% | −3.3% | 6.4% |
| GN25 | −7.7% | 14.1% | −6.3% | −7.5% | 9.4% |
| GN50 | −11.3% | 21.3% | −8.9% | −11.2% | 14.0% |
| GN75 | −12.9% | 25.7% | −9.9% | −12.9% | 17.9% |
| GN90 | −13.5% | 28.7% | −10.4% | −13.8% | 20.2% |
| BC_free | 2,170,829 | 25,623 | 333,790 | 1164 | 3,779,809 |
| GN10 | −5.8% | −3.6% | −1.7% | −1.6% | 1.2% |
| GN25 | −6.8% | 0.2% | −3.0% | −3.8% | 4.5% |
| GN50 | −7.8% | 7.2% | −4.8% | −7.2% | 9.6% |
| GN75 | −8.9% | 13.2% | −6.4% | −10.2% | 14.0% |
| GN90 | −9.5% | 16.8% | −7.1% | −1.8% | 16.3% |
| Traffic Volume (veh × km) | Average Speed (veh × km/veh × hour) | ||||
|---|---|---|---|---|---|
| SR | GN | SR | GN | ||
| BC | 5,884,915 | 5,884,915 | 61.0 | 61.0 | |
| Penetration rate (%) | 10 | −6.9% | −3.7% | 7.40% | −9.8% |
| 25 | −17.7% | −7.7% | 6.80% | −19.1% | |
| 50 | −26.0% | −11.3% | −14.50% | −26.9% | |
| 75 | −22.8% | −12.9% | −43.40% | −30.7% | |
| 90 | −15.6% | −13.5% | −56.20% | −32.8% | |
| VKM (veh × km) | VEH (veh × h) | TEI_CO2 (kg) | TEI_NOx (kg) | PEI_NOx (kg × hab/km2) | ||||||
|---|---|---|---|---|---|---|---|---|---|---|
| CBD NET. | Cong. | Free | Cong. | Free | Cong. | Free | Cong. | Free | Cong. | Free |
| BC | 870,955 | 314,411 | 29,662 | 7016 | 141,633 | 44,528 | 405 | 125 | 6,553,843 | 2,064,349 |
| GN10 | 0.1% | 0.3% | 10.6% | 0.6% | 2.5% | 4.4% | 2.0% | 4.0% | 1.0% | 3.3% |
| GN25 | 2.8% | 7.8% | 25.9% | 10.6% | 8.7% | 13.2% | 7.8% | 13.1% | 5.3% | 11.7% |
| GN50 | 8.2% | 20.2% | 47.1% | 28.1% | 18.7% | 27.7% | 17.2% | 28.2% | 13.2% | 25.2% |
| GN75 | 13.5% | 31.6% | 62.2% | 44.9% | 27.2% | 41.5% | 25.3% | 42.4% | 21.0% | 38.1% |
| GN90 | 16.4% | 37.8% | 71.0% | 54.5% | 31.8% | 49.2% | 29.6% | 50.4% | 25.4% | 45.2% |
| HIGHWAY. | Cong. | Free | Cong. | Free | Cong. | Free | Cong. | Free | Cong. | Free |
| BC | 3,545,963 | 1,412,048 | 45,751 | 13,622 | 541,775 | 222,941 | 1891 | 819 | 3,192,085 | 1,552,678 |
| GN10 | −5.0% | −9.3% | 2.9% | −9.1% | −4.1% | −5.5% | −4.4% | −5.6% | −1.6% | −4.2% |
| GN25 | −11.8% | −15.7% | 3.4% | −14.9% | −10.5% | −12.3% | −11.5% | −12.7% | −3.0% | −10.4% |
| GN50 | −20.9% | −25.0% | −3.5% | −22.3% | −19.6% | −22.5% | −20.8% | −23.3% | −7.4% | −20.8% |
| GN75 | −27.4% | −33.4% | −11.1% | −29.6% | −26.4% | −31.6% | −27.4% | −32.8% | −13.6% | −30.3% |
| GN90 | −30.4% | −38.1% | −14.5% | −34.0% | −29.7% | −36.7% | −30.9% | −38.2% | −16.7% | −35.7% |
| OTHER R. | Cong. | Free | Cong. | Free | Cong. | Free | Cong. | Free | Cong. | Free |
| BC | 1,467,996 | 444,370 | 21,127 | 4985 | 221,394 | 66,321 | 751 | 230 | 531,349 | 162,782 |
| GN10 | −2.6% | 0.7% | 9.8% | 5.5% | −1.7% | 6.8% | −3.1% | 5.4% | 6.4% | 18.9% |
| GN25 | −4.1% | 11.4% | 20.6% | 26.9% | −2.5% | 17.7% | −5.4% | 14.6% | 16.4% | 47.6% |
| GN50 | 0.3% | 26.7% | 38.6% | 58.3% | 2.9% | 33.1% | −1.8% | 27.2% | 33.2% | 87.1% |
| GN75 | 6.2% | 40.1% | 53.9% | 85.3% | 9.6% | 46.7% | 3.7% | 38.1% | 47.6% | 115.8% |
| GN90 | 9.7% | 48.1% | 62.9% | 102.4% | 13.3% | 54.9% | 6.3% | 44.7% | 56.4% | 131.5% |
© 2017 by the authors. Licensee MDPI, Basel, Switzerland. This article is an open access article distributed under the terms and conditions of the Creative Commons Attribution (CC BY) license (http://creativecommons.org/licenses/by/4.0/).
Share and Cite
Perez-Prada, F.; Monzon, A.; Valdes, C. Managing Traffic Flows for Cleaner Cities: The Role of Green Navigation Systems. Energies 2017, 10, 791. https://doi.org/10.3390/en10060791
Perez-Prada F, Monzon A, Valdes C. Managing Traffic Flows for Cleaner Cities: The Role of Green Navigation Systems. Energies. 2017; 10(6):791. https://doi.org/10.3390/en10060791
Chicago/Turabian StylePerez-Prada, Fiamma, Andres Monzon, and Cristina Valdes. 2017. "Managing Traffic Flows for Cleaner Cities: The Role of Green Navigation Systems" Energies 10, no. 6: 791. https://doi.org/10.3390/en10060791
APA StylePerez-Prada, F., Monzon, A., & Valdes, C. (2017). Managing Traffic Flows for Cleaner Cities: The Role of Green Navigation Systems. Energies, 10(6), 791. https://doi.org/10.3390/en10060791