Abstract
Offshore wind turbines in seismic active areas suffer from earthquake impacts. In this study, seismic fragility analysis of a monopile offshore wind turbine considering different operational conditions was performed. A finite element model for a 5 MW monopile offshore wind turbine was developed using the OpenSees platform. The interaction between the monopile and the seabed soil was modeled as a beam-on-nonlinear-winkler-foundation (BNWF). A nonlinear time history truncated incremental dynamic analysis (TIDA) was conducted to obtain seismic responses and engineering demand parameters. Potential damage states (DSs) were defined as excessive displacement at the nacelle, rotation at the tower top, and the allowable and yield stresses at the transition piece. Fragility curves were plotted to assess the probability of exceeding different damage states. It was found that seismic responses of the wind turbine are considerably influenced by environmental wind and wave loads. Subject to earthquake motions, wind turbines in normal operation at the rated wind speed experience higher levels of probability of exceeding damage states than those in other operational conditions, i.e., in idling or operating at higher or lower wind speed conditions.
1. Introduction
The depletion of fossil fuel reserves, deterioration of the global environment, and the ever-increasing demand for energy force people to utilize renewable energy. As targeted renewable energy, offshore wind energy is attractive for its advantages of large reserves, no land occupation, and little influence on human beings [1]. However, the harsh offshore environment conditions, including loads and poor ground condition, raise the risk of failure of offshore wind turbines, and challenge the design of wind turbine supporting structures. Normally, wind and wave loads are the two most important environmental loads acting on offshore wind turbine supporting structures. It is well understood that earthquake motions in the continental shelf from the coastal land to offshore undersea do great harm to the safety of offshore wind turbines in areas of active seismicity [2,3]. Since earthquakes are unpredictable, offshore wind turbines can be operating under different operation conditions when an earthquake occurs [4,5], resulting in different combinations of seismic load and environmental wind and wave loads acting on the wind turbine supporting structures. These combinations of loads cause different nonlinear dynamic responses for offshore wind turbines, which may exceed limit states of the structure and cause failure in both the power generation system and the supporting foundations. Thus, investigations should be conducted to understand the responses of offshore wind turbines under seismic loads or the combination of seismic loads and environmental wind and wave loads, and to evaluate the fragility of wind turbine structures.
Many attempts to study the seismic dynamic responses [6,7,8,9], structural safety [4,5,10,11,12] and analytical methods [4,13] of wind turbines have been conducted. Most studies focused on onshore wind turbines, which are shorter in the cantilever length than their offshore counterparts. In addition, onshore wind turbines are grounded in relatively hard foundations while not subjected to water waves. Hong [6] studied the responses of wind turbine blades to seismic and turbulent wind excitations, and found that the effect of turbulence on moment responses of the blade was greater than that of an earthquake when the wind turbine generator had a constant revolutions per minute. However, the dynamic responses of the wind turbine supporting structures were not accounted in the study. Bazeos et al. [14] studied the static and seismic responses of a 450 kW wind turbine resting on a concrete square footing in a semi-rock soil using NASTRAN [15]. Results showed that a simplified multi-degree of freedom oscillator with concentrated mass model produced accurate results for seismic responses of the wind turbine. While focusing on the modelling of the wind turbine structure, the effect of wind loads on the seismic responses of the wind turbine was not considered in the study. Lavassas et al. [7] investigated the responses of a 1 MW wind turbine on a concrete circular footing in a rocky soil under combined wind and earthquake loadings and found that seismic loads became critical when the wind turbine tower was constructed in seismically hazardous areas and with the ground being a medium or soft soil. Stamatopolous [16] studied the responses of a 53.95 m high wind turbine resting on a circular footing subjected to near-fault excitation. Time-domain analyses and response-spectrum based analyses showed that shear and bending-moment demand at the tower base were significantly underestimated by the Greek Design Code when near fault ground motions were considered. However, the analysis did not take into account aerodynamic loads. Based on seismic performance analysis, Prowell [8] concluded that the consideration of aerodynamics and operational state became increasingly important as the size of the wind turbine increase. Prowell’s study also showed that soil-structure interaction was important, especially for large wind turbines. Witcher [17] studied the responses of a 2 MW wind turbine under load cases of parked, operational, and earthquake-induced emergency shutdown. Results showed that the situation of earthquakes combined with wind turbine in operational at rated wind speeds is the driving case. Díaz and Suárez [18] proposed an finite element model accounting for the flexibility of the blades in flapping direction and the flexibility of the tower in bending and twisting for seismic responses of operating wind turbines. By using the proposed model, they investigated the seismic responses of a 1.65 MW wind turbine with operational wind loads subjected to four ground motions. Results showed that the stress at the tower top section may exceed those from extreme winds. However, the soil-structure interaction was not considered in the model. Sapountzakis et al. [19] studied the dynamic responses of a 5 MW wind turbine on either a surface or monopile foundation system, and found that modelling of soil-structure interaction was of great importance in the analysis of seismic response of wind turbines. Asareh et al. [20,21,22] studied the seismic responses and fragility of a 5 MW wind turbine under different operational conditions. Results showed that the fragility of the wind turbine increased slightly as the wind intensity became close to the rated wind speed of the wind turbine. However, the pile-soil interaction was not considered in the study. Santangelo et al. [23] studied the implementation of uncoupled analysis for wind and seismic loads for a 5 MW wind turbines. Kjørlaug and Kaynia [24] conducted analyses of megawatt-sized wind turbine subjected to the vertical earthquake using SAP200 software. This study concluded that vertical ground motions have significant bearing on the design of the tower and its connection to the nacelle and performance of the turbine after the earthquake. Ma [25] studied the dynamic response of wind turbines subject to vertical and horizontal earthquakes. The investigation concluded that it was vital to consider earthquake loads for moment demand and vertical load in the tower of the 1.65 and 3.0 MW reference turbines in seismically active regions.
As more wind farms are constructed in offshore seismically active regions, seismic assessment of offshore wind turbines has become the attention of many studies. Kim et al. [26] performed seismic fragility analysis of a 5 MW offshore wind turbine considering soil-pile interaction. Yu et al. [27] conducted a group of earthquake centrifuge tests to investigate the seismic performance of offshore wind turbines of different types of foundations and found that a tripod foundation offered a better solution for mitigating lateral rotation than a monopile foundation. However, in these two studies, the environmental wave and aerodynamic loads were not considered. Kourkoulis et al. [28] investigated the seismic responses of suction caisson foundations for offshore wind turbines using non-linear three-dimensional finite element method, but static wind and wave forces were applied instead of time history loads. Through underwater shaking table tests, Zheng et al. [29] showed that combined earthquake and wave actions were critical for the dynamic responses of a monopile 5 MW offshore wind turbine. However, the soil-structure interaction and wind loads were not considered in this study. Anastasopoulos and Theofilou [30] studied the performance of a hybrid foundation for offshore wind turbines under environmental loads and seismic loading. Results showed that the addition of the footing to the monopile led to a pronounced increase in the moment capacity.
As reviewed, previous studies of seismic safety of wind turbines mainly focus on onshore turbines, which, as noted previously, are to a large extent, different from offshore wind turbines. On the other hand, recent research on the seismic safety of offshore wind turbines is still ongoing. Further research is needed to better understand the seismic responses of offshore wind turbines in different operational and environmental conditions, and assess the safety of the wind turbine structures. The purpose of this study was to investigate the influence of environmental loads on the seismic responses and the fragility of offshore wind turbines. The studied case was a 5 MW monopile offshore wind turbine to be installed in a wind farm in the East China Sea. The dynamic responses of the wind turbine assemble were analyzed under the scope of the finite element method using the OpenSees platform [31]. The pile-seabed soil interaction was modeled as beam on nonlinear Winkle Foundation using the p-y spring method. The finite element model was calibrated and verified using published results in terms of the modal modes and natural frequencies of the turbine structure. A suite of 24 earthquake ground motions were selected and scaled for simulation in the finite element model. Different sea states and turbine operating wind speeds were considered and applied as wave force and aerodynamic loads on the pile foundation, the nacelle and the tower of the model in each time step. Based on the obtained structural dynamic responses, fragility analysis was performed using different earthquake motion intensity measures (IM), engineering demand parameters and damage states (DSs) to obtain the vulnerability of the wind turbine.
The remainder of this paper is organized as follows: the analytical fragility methodology is introduced in Section 2; the nonlinear finite element model of the monopile offshore wind turbine is developed and calibrated in Section 3; the seismic dynamic analyses of the wind turbine are performed in Section 4; In Section 5, the fragility curves of the wind turbine are obtained; Finally, conclusions are made in Section 6.
2. Analytical Seismic Fragility Methodology
Seismic fragility is defined as the conditional probability that the seismic demand on a structure meets or exceeds its capacity for a given level of ground motion intensity [32,33,34]. It indicates the vulnerability of a structure to earthquakes. Some methods of fragility analysis have been discussed in literature [34,35,36]. Rather than proposing a new fragility analysis method, this paper focuses on the vulnerability of the offshore wind turbine. The truncated incremental dynamic analysis (TIDA) method [37], which performs incremental dynamic analysis up to a preset max ground motion intensity level, IMmax, is used for fitting the fragility functions. A brief description of the TIDA method is as follows:
Assuming that both the demand and the capacity of an offshore wind turbine follow a lognormal distribution [32], the fragility of the wind turbine structure can be mathematically expressed as:
where Pf(a) is the probability that an earthquake ground motion with an intensity of IM = a will exceed a damage state; a value closes to 0 indicates that there is almost no exceeding probability, while a value closes to 1.0 corresponding to high risks of exceeding; D is the seismic demand; D0 denotes the capacity; Ф(·) is the normal cumulative distribution function; θ and β are the median and log standard deviation of ground motion intensity a, respectively.
Considering an incremental dynamic analysis of n ground motions, if there are m ground motions that cause structure damage at IM levels lower than IMmax, and n-m ground motions that do not cause structure damage prior to the analysis being stopped, the likelihood of the entire data set being observed can be expressed by assuming that the IMi value for each ground motion is independent as:
where φ(·) is the normal distribution probability density function; П is the product over i values form 1 to m. The estimators of two fragility parameters θ and β are obtained by maximizing the likelihood function as:
Thus, the procedure of calculating the fragility curves for a set of performance levels of an offshore wind turbine is summarized as:
- (1)
- Finite element model development and calibration.
- (2)
- Selecting a suite of ground motion records.
- (3)
- Conducting truncated incremental dynamic simulation to obtain demands of the structure.
- (4)
- Defining DSs and solve Equation (3) for the likelihood realization of and .
- (5)
- Finally, calculating fragility curves for different DSs using Equation (1).
3. Model Development and Calibration
3.1. Parameters of the Reference Monopile Offshore Wind Turbine
The NREL 5 MW baseline wind turbine [38] was used as a reference turbine in this study. This turbine is a conceptual turbine developed based on Senvion 5 MW prototype wind turbines. A detailed description of the turbine can be found in [38]. The main parameters of the turbine are listed in Table 1.

Table 1.
NREL 5-MW baseline wind turbine [38].
The wind turbine is to be installed with a monopile foundation in a wind farm in the East China Sea. The average seabed level and water level at the location of the wind farm are −18.45 and 0.06 m, respectively, on the base of 1985 National Elevation Datum. The underwater terrain is flat with quaternary sediments of Holocene deposition and late Pleistocene deposition. The soil profile at the site of the planned wind farm is represented in Table 2. The dimensions of the monopile wind turbine are illustrated in Figure 1. The monopile is 6.0 m in diameter and 45~80 mm in thickness, and has a penetration length of 57.5 m. Soil layer acts as a bearing stratum for the monopile. The base flange is 10 m above the mean sea level (MSL). The tower is 80 m long, resulting in the hub height being 90 m above the MSL. The monopile and the turbine tower are made from Q345 steel material [39], and the corresponding mechanical properties are listed in Table 3.

Table 2.
Layered soil profile.
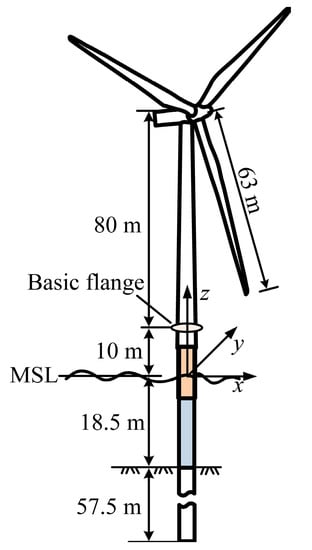
Figure 1.
Dimensions of the monopile offshore wind turbine.

Table 3.
Q345 steel properties [39].
3.2. Numerical Model Development
An integrated finite element model of the monopile offshore wind turbine was created using the OpenSees software (Version 2.5.0) package [31]. The monopile and the turbine tower were both modeled using nonlinear beam columns. The nacelle was modeled as a beam-column with rather large stiffness to behave as a rigid element to transfer aerodynamic loads of the wind turbine to the tower. The three-blade assembly and the hub were simplified as a lumped mass at their gravity center. The steel02 material model [40], which is based on the Giuffré-Menegotto-Pinto Model, was used to model the elastic and plastic of the steel material of the monopile and the turbine tower. The mesh size of the monopile in the section embed into the seabed was 1 m; and 1.5 m in other sections and at the tower. The monopile and the turbine tower consisted of 140 beam elements. For all elements, the mass was lumped at element nodes.
When the monopile moved through sea water, water around the monopile and in the hollow moved along. The interaction between the pile foundation and the sea water was modeled as hydraulic added mass in the hollow and outside of the pile [41,42,43].
The pile-soil interaction of the foundation was modeled using a beam-on-nonlinear-winkler foundation (BNWF) concept, as illustrated in Figure 2. The BNWF model was constituted by two arrays of lateral springs named p-y and p-x springs, intended to capture the horizontal and rotational resistance of the monopile in the two orthogonal horizontal directions. The model also had an array of t-z springs and a q-z spring, intending to capture the axial sliding resistance and bearing resistance, respectively. Individual springs were modeled with zero Length elements. p-y, p-x and t-z springs were distributed along the monopile below the mud line with an interval of 1 m, while a q-z spring was used at the pile tip. The constitutive behavior of the p-y, p-x, t-z and q-z springs were represented by nonlinear backbone curves developed by Boulanger et al. [44] and modeled using uniaxial material PySimple1, PySimple1, TzSimple1 and QzSimple1, respectively, in the Opensees. Equations defining the material model for PySimple1, TzSimple1 and QzSimple1 can be referred to in Boulanger et al. [44] and Boulanger [45]. The ultimate capacities of the three types of uniaxial materials were calculated according to DNVGL-ST-0126 design standard [2].
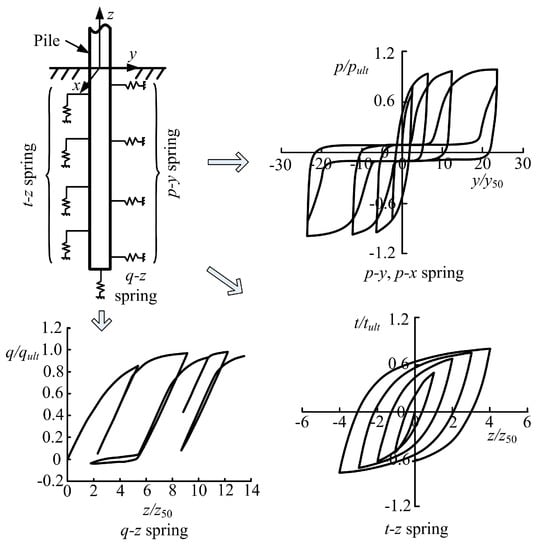
Figure 2.
Pile-soil interaction modelling.
It should be noted that the p-y curve method was derived for flexible piles with small diameters. It could be stiff for large diameter piles [46,47]. For this reason, researchers have advised the use of caution when applying p-y curves to large diameter monopile offshore wind turbines [2,48,49]. Nevertheless, p-y curves are the recommended method for lateral soil-pile resistance by the design standard DNVGL-ST-0126 [2], hence they were used herein to study the effect of environmental loads on seismic response of wind turbines.
3.3. Validation of Numerical Model
In order to calibrate the finite element model and validate the mass and stiffness distribution of different components, modal analysis of the turbine tower assembly was performed. The obtained natural frequencies and mode shapes were compared with the results of [38] in Table 4. It can be seen from Table 4 that eigen frequencies of the turbine tower assembly of the present model agreed well with that of [38], which were derived using different analysis tools.

Table 4.
Natural frequencies of the turbine with tower (Hz).
To obtain the vibration mode characteristics of the whole turbine assembly, modal analysis of the monopile wind turbine with soil springs was conducted. In eigen analysis, the stiffness of the nonlinear soil spring was assumed linear and equal to the initial stiffness. The frequencies of the integral wind turbine assembly are listed in Table 5. It was shown that the eigen frequencies of the whole turbine assembly dropped from those in Table 4 of the tower and blade mass assembly. This is caused by the inclusion of the supporting monopile foundation and the flexibility of soil springs.

Table 5.
Frequencies of the monopile offshore wind turbine.
4. Nonlinear Dynamic Analysis
4.1. Selection and Scaling of Ground Motions
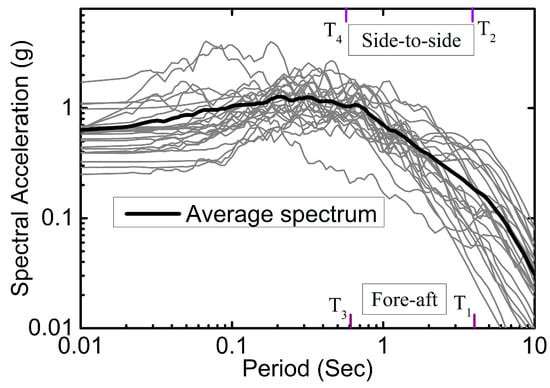
A suite of 24 broadband earthquake motion records, including a set of 15 near-field and a set of 9 far-field ground motion records [50] availed from Pacific Earthquake Engineering Research (PEER) database [51], were considered as input ground motions for the nonlinear dynamic simulation. These earthquake motion records were from site class C or D, and were chosen because they featured different peak ground motion acceleration (PGA). As listed in Table 6, PGA ranged from 0.24 to 1.18 g with the average being 0.49 g. The square root of sum of the squares (SRSS) of 5% damped response spectrum acceleration (Sa, 5%) of the individual record and the average of all the records are shown in Figure 3. Each ground motion record was linearly scaled to have different PGAs from 0.1 to 1.0 g with an interval of 0.1 g for the TIDA analysis.

Table 6.
Earthquake records.
4.2. Environmental Loads
(1) Aerodynamic Loads
Wind conditions with mean velocities of 0.0, 6.0, 8.0, 12.0, 16.0 and 24.0 m/s were considered. The time series of aerodynamic loads of the wind turbine were calculated using the NREL’s FAST program [52]. Three-dimensional wind fields with 600 s duration were generated using the stochastic, full-field, turbulent wind simulation program Turbsim [53]. The IEC 64100-3 Kaimal spectrum was used as the turbulence model. Normal turbulence model Class C [54] and specific hub-height wind speed were used to generate wind fields.
The airfoil properties of the blades of the turbine were given to FAST along with 600 s wind fields. FAST makes use of the modified blade element momentum theory by considering wake effects to compute the aerodynamic loads on the hub [55]. Forces from 200 to 600 s were derived for the structural dynamic analysis.
(2) Wave Loads
Ocean waves were characterized by their inherent irregularity [56]. In the current study, the irregular waves were modeled using the JONSWAP spectrum [57]. The JONSWAP spectrum was derived based on the observations obtained along a profile extending 160 km into the North Sea westward from the Sylt Island (Westerland, Germany). It is valid for the limited fetch conditions and is extensively used in offshore industry. The monopile supporting foundation was considered as a hydrodynamic slender structure [58]. Wave forces on the pile were calculated using FAST, for which Morison equation was adopted [59]. The influence of structure dynamics on the wind and wave forces was considered by coupling waves and winds for the FAST program. Four measured sea states representing waves with a five-year return period of different directions at the planed wind farm, as listed in Table 7, were chosen as the wave loads.

Table 7.
Sea states for the seismic analysis of monopile offshore wind turbines.
4.3. Combination and Coupling of the Loads
(1) Load Combination
Six turbine operational conditions (labeled as TOC1~TOC6), as listed in Table 8, were considered. They ranged from idling without wind loads to normal power operation at high wind speed combined with different sea state conditions and a reference condition. The reference condition did not account for wind or wave loading, and was labeled as TOC0. It should be noted that in the real oceanic environment, the wave height and period usually are related to wind climate. However, wind and waves were assumed to be independent in this study to investigate the effects of waves on the seismic responses and the fragility of the wind turbine. Figure 4 illustrates load combinations for different turbine operational conditions. As listed in Table 8, each turbine operational condition was associated with one wind speed, four sea states, 24 earthquake ground motion records, and 10 ground motion intensity factors. The same earthquake ground motion records and intensity factors were used in the analysis of the reference condition.

Table 8.
Wind turbine operational conditions for nonlinear analyses.
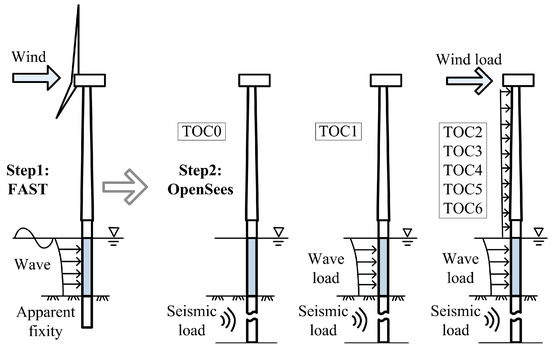
Figure 4.
Load combination for dynamic analysis of the offshore wind turbine for different operational conditions.
The wave loads on the monopile foundations derived from irregular wave elevation are random. On the other hand, the turbulence intensity also causes randomness in wind speeds and thereby the wind loads on the turbine and the tower. These random loads will cause uncertainty in the prediction of structure performance. Previous studies by Abhinav and Saha [60] showed that a 25 Monte Carlo simulations for each combination of wind and wave condition can obtain a stable result for dynamic response of a jacket supported offshore wind turbine. However, this Monte Carlo simulation will result in unaffordable numerical simulations in earthquake fragility analysis, in which different earthquake motion records combined with environmental wind and wave loads need to be simulated. In this investigation, a 5 Monte Carlo simulation for each combination of sea state and wind speed was performed as a compromise between the computational efforts and reduction of uncertainty. This resulted in a 4800 simulations (four sea states × five Monte Carlo × 24 earthquake records × 10 PGA scaled) for each wind speed (turbine operational condition TOC1~TOC6), and a total of 29,040 simulations (six wind speeds × 4800 per wind speed + 24 earthquake records × 10 PGA scaled for TOC0) for the realization of seismic responses of the monopile offshore wind turbine in different operational conditions.
(2) Coupling of Loads
The program FAST is capable of conducting coupled aerodynamic-hydrodynamic analyses, but lacks geotechnical capabilities. On the other hand, OpenSees can simulate response arising from loads-geotechnical coupling. The present work made use of a coupling approach for wind, wave and seismic loads, which involved a two-step procedure shown in Figure 4, as follows:
- Step1:
- Derivation of the fully coupled time-series of wind and wave loads of the wind turbine and the monopile foundation using FAST. The wind and waves are assumed to be collinear, i.e., no effect of directionality is considered.
- Step2:
- Wind and wave loads from FAST and the two horizontal components of earthquake motion records are inputted into the OpenSees model for structure dynamic analyses. Wind loads on the wind turbine are applied as concentrated loads at the hub, while wind loads on the tower and wave loads on the monopile are applied as distributed loads at the tower and the monopile. Earthquake motions are applied as time series acceleration. The Uniform Excitation scheme, which imposes the ground motion accelerations to the constrained end of different types of pile-soil interaction springs, is used. The influence of layer subgrade is not considered.
Nonlinear time history dynamic analyses were performed in a 150 s duration. The earthquake ground motions were applied at the start of the 80th second to eliminate the initial transient behavior of the structure, and responses of the wind turbine from the start of earthquake motion to the end of earthquake excitation were investigated. It should be noted that wind force of the wind turbine and wave force on the monopile foundation are influenced by seismic response of the structures when an earthquake strikes. However, this was out of the scope of this study. Focusing on the fragility of the wind turbine, the seismic dynamic responses of the wind turbine structures were estimated by neglecting the interaction effect of wind and wave loads and seismic response of the structures.
(3) Damping
The over all damping ηtot of an offshore wind turbine consists of aerodynamic damping ηareo, hydrodynamic damping ηhydro, soil damping ηsoil, and structural damping (includes material damping and control damping) ηstruc [61,62,63].
Aerodynamic damping of wind turbines varies according to the operational condictions. In standstill conditions when the blades are pitched to the maximum pitch angle the aerodynamic damping is very small and can be neglected [62]. On the other hand, in the power generation condition the aerodynamic damping can be rather high [63]. Liu et al. [64] showed that the aerodynamic damping of a 5 MW wind turbine in production states varies from 2% to 5.7% according to the wind speed. In this study, the areodynamic damping values of 2.71%, 3.70%, 3.42%, 3.62% and 3.45% extracted from Liu et al. [64] for wind velocities of 6 m/s, 8 m/s, 12 m/s, 16 m/s and 24 m/s, respectively, were used.
Hydrodynamic damping of the monopile foundation consists of radiation damping ηrad and viscous damping ηvis,hydro. An upper value of 0.22% and 0.15% for radiation damping and viscous damping suggested by Germanischer Lloyd [61] was used in the dynamic analyses.
The soil damping acts as foundation damping in offshore wind turbines. Values from 0.25% to 1.5% were estimated in the reported literature [65,66]. In this study, soil damping was introduced by using the Rayleigh type of damping, and a value of 0.8% recommended by Germanischer Lloyd [61] for high structural deflection was used.
Structural damping consists of material damping and damping from control systems. The material damping of steel varies from 0.2% to 0.3% [61], and the upper value of 0.3% is used in the simulation. In large scale offshore wind turbines, shock absorption and vibration-control systems, which increase the damping of the wind turbine assemble, are usually adopted to reduce structural vibration [63,67,68]. However, these vibration-control systems are normally specially designed, and out of the scope of this study, and therefore were not considered.
Thus, the damping for dynamic analysis of the monopile offshore wind turbine in different operational conditions in the present study are summarized and listed in Table 9. Damping was modeled by Rayleigh damping with coefficients calculated at the first and second tower fore-aft natural frequencies of 0.252 and 1.575 Hz.

Table 9.
Damping of monopile offshore wind turbine for dynamic analysis (%).
4.4. Dynamic Responses of the Monopile Offshore Wind Turbine
For a high rise monopile offshore wind turbine, the displacement at the nacelle, rotation at the tower top and stress at the transition piece are crucial for the safety of the wind turbine and the supporting structures. In this study, these structural response parameters were chosen to compare the dynamic responses of the wind turbine under effects of earthquake and environmental loads.
For illustration purposes, the monopile offshore wind turbine excited by earthquake motion record No. 1 (El Centro Array #6 earthquake motion record) were simulated, with PGA ranging from 0.2 to 1.8 g and the joint actions of the earthquake motion and environmental wind and wave loads at a wind velocity of 12 m/s and sea state SS2. The dynamic responses of the wind turbine in terms of displacement at the nacelle, rotation at the tower top, and stress at the transition piece are shown in Figure 5. As observed in Figure 5, the dynamic responses of the wind turbine were governed by the first mode of the structure. When PGA of the earthquake motion was smaller than 0.6 g, the motion of the wind turbine excited by the earthquake decayed to the original static equilibrium position, and the motion of the wind turbine excited by the joint action of earthquake and environmental loads decayed to the dynamic response of the environmental loads due to the damping of the structures. This means the dynamic responses of the wind turbine were elastic. This elastic response of the wind turbine was also indicated in the stress curves of the transition piece for the maximum stress less than 305 MPa of the yield of the steel material, as shown in Figure 5c. When the input earthquake motion had a PGA greater or equal to 1.0 g, residual displacement at the nacelle and residual rotation at tower top were observed in both scenarios of earthquake excitation and the joint action of earthquake and environmental loads. This was because the plastic dynamic of the structure, which could be explicitly observed in the stress curves of the transition piece for the maximum stress reaching the yield stress of steel material, as marked by red solid circle points. The comparison of dynamic responses of the wind turbine under the two loading conditions showed that seismic responses of the wind turbine were considerably influenced by the environmental wind and wave loads. In cases of joint earthquake motion and environmental wave and wind loads acting on the wind turbine, the environmental loads acted like a basic load on the wind turbine structures.
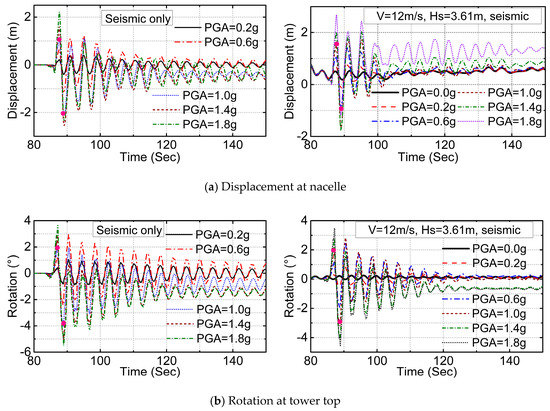
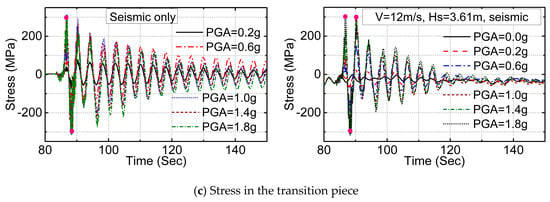
Figure 5.
Dynamic response of the monopile offshore wind turbine under earthquake loading and joint loading of earthquake and environmental loads, earthquake record No. 1 and combine with 3.61 m wave height and 12.0 m/s wind speed.
After dynamic analyses, the response parameters of the monopile offshore wind turbine were obtained. Selection of responses of the wind turbine in operational conditions of TOC0, TOC2, TOC4 and TOC6 excited by the selected earthquake ground motions are plotted in Figure 6 and Figure 7. The peak response parameters of the wind turbine were plotted against PGA with the four sea states SS1-4 for analyzing the effect of wave loads on the response of the wind turbine in Figure 6b–d and Figure 7b–d. Each mark in the two figures represented a simulation conducted on the finite element model. Lines with symbols in each subfigure denote the average values of the parameters of the twenty four selected earthquake motions. As observed in Figure 6a and Figure 7a, the dynamic responses of the wind turbine subjected to ground motions with the same PGA could be very different. This was caused by the difference in frequency components and duration of different earthquake ground motions which significantly influenced the dynamic responses of the wind turbine structures. Earthquake record No. 12 (Kocaeli, Turkey, Yarimca record) was found to result in a maximum response in the wind turbine. It was observed from the Monte Carlo simulation of each load combinations, that the relative phase angle of the wave, wind, and earthquake loads had a great influence on the dynamic responses of the monopile wind turbine.
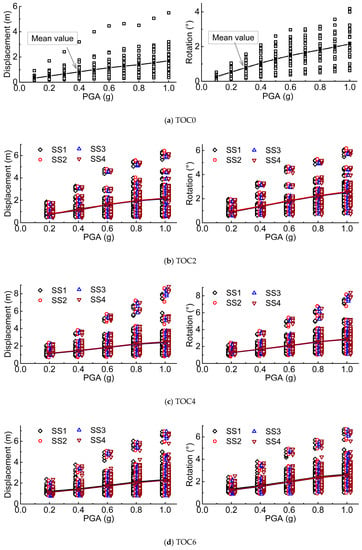
Figure 6.
Maximum displacement at nacelle and rotation at tower top.
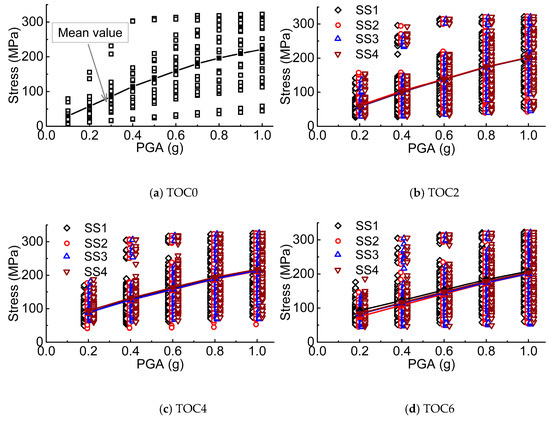
Figure 7.
Maximum stress at transition piece of the monopile supported structure.
As plotted in Figure 6, the peak displacement at the nacelle and the peak rotation at tower top followed a linear increase with earthquake motion intensity when PGA was not greater than 0.6 g. However, as PGA of different ground motions further increase, a nonlinear change of the peak displacement at the nacelle and the peak rotation at the tower top of the wind turbine excited by some of selected earthquake ground motion records was observed due to plastic response of the structures. Peak stress at the transition piece, shown in Figure 7, followed a linear increase up to the yield strength of the steel material. A further observation into the responses of the wind turbine at different sea states, as shown in Figure 6b–d and Figure 7b–d, revealed that the increase in wave height (i.e., increases from SS1 to SS4) did not necessarily result in a significant growth in the dynamic response of the wind turbine. However, a comparison of responses of the wind turbine in different operational conditions shows that earthquake struck in TOC4, i.e., normal operation at the rated wind speed, shown in Figure 6c and Figure 7c, was more likely to result in larger displacement at the nacelle and rotation at the tower top than other operational conditions. In the worst case scenario when the sea state was SS4, the wind speed was 12 m/s and the earthquake ground motion records was Kocaeli, Yarimca with a PGA of 1 g, the resulting max displacement at the nacelle and rotation at the tower top reached 8.84 m and 8.4°, respectively.
5. Fragility Curves and Discussion
5.1. Pushover Analysis
A static pushover analysis was conducted to observe inelastic deformation characteristics and to find the critical displacement of the wind turbine. For this purpose, a horizontal displacement load, which increased incrementally, was applied in the fore-aft direction to the reference point of the rigid nacelle. Figure 8 shows the variation of the nacelle reaction force and the maximum stress at the transition piece with respect to the displacement. It can be seen that the relation between nacelle displacement and reaction force was nonlinear when the displacement proceeded beyond 3.82 m. This was caused by the plasticity of the steel material of the wind turbine supporting structures and the non-linearity of the ground soil resistance. No collapse was observed, even at a large deflection of 8 m.
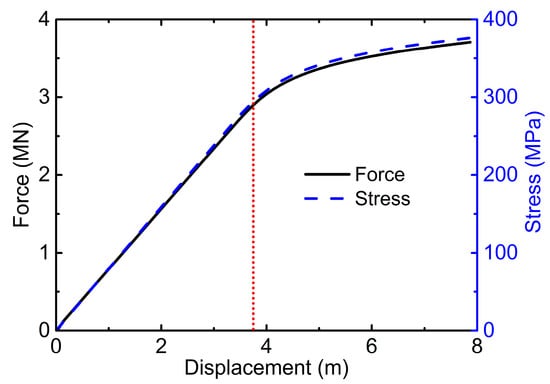
Figure 8.
Relation between force/stress and displacement from push-over analysis.
5.2. Obtained Fragility Curves and Discussions
Offshore wind turbines are high-rise structures with long cantilever blades rotating at the top of the tower. Excessive displacement at the nacelle and rotation at the tower top can lead to loss of efficiency in power generation, and also may cause collision between the blades and the tower [21]. On the other hand, the large stress in the supporting structures may lead to yield or buckling of the tower and may finally lead to collapse. To estimate the fragility of the wind turbine, four damage states defined depending on different demand parameters of the wind turbine, as shown in Table 10, are considered. The first and second damage states (DS1 and DS2) were defined as any excessive displacement at the nacelle and rotation at the tower top that could cause loss of efficiency in power generation. A threshold value of 1.25% the height of the structure in the nacelle displacement proposed by Asareh et al. [21] was considered for DS1, and a rotation value equal to the precone of the rotor of 2.5° [38] at the tower top was employed for DS2. The third damage state (DS3) was defined as the stress at the transition piece exceeds the allowable stress of 250 MPa [39] of the steel material, while the fourth damage state (DS4) was defined as yield stress of 305 MPa of the transition piece.

Table 10.
Damage states considered for fragility analyses.
Based on the obtained dynamic responses and the defined damage states, fragility curves of the wind turbine in different operational conditions were calculated using the previously described TIDA method. The estimated fragility curves for DS1 of the wind turbine in operational conditions TOC1 to TOC6 with the four sea states are shown in Figure 9. It can be seen from the figure that the probability of damage state DS1 was very low when PGA was smaller than 0.2 g, which means an earthquake motion with the PGA smaller than 0.2 g was less likely to result in an excessive displacement at the nacelle. However, the fragility of the wind turbine increased quickly as PGA proceeded beyond 0.2 g. Examination of the fragility curves of the wind turbine in different sea states showed that the influence of sea states on the seismic fragility of the wind turbine was not obvious.
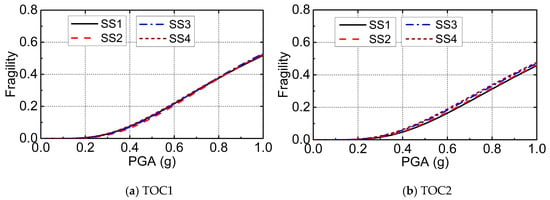
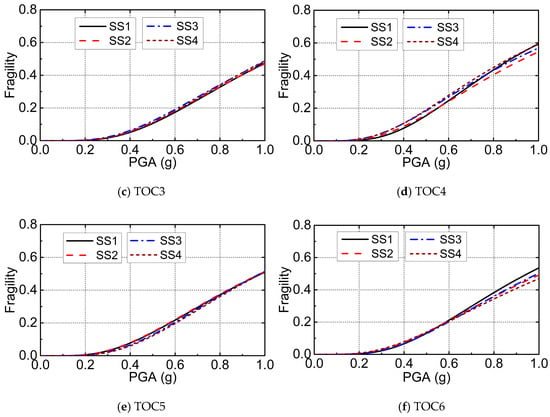
Figure 9.
Seismic fragility curves of the monopile offshore wind turbine under different sea states for DS1.
To investigate the effects of the joint action of environmental wind and wave loads on the seismic fragility of the wind turbine, an average over different sea states of damage states were made for the fragility of the wind turbine and shown in Figure 10. The corresponding median and dispersion values of the fragility curves are listed in Table 11. An observation in the fragility of the wind turbine for damage sate DS1, plotted in Figure 10a, showed that the wind turbine suffered from the highest probability of damage at the rated wind speed (TOC4). This was also indicated in Table 11 for a relative lower value of θ (i.e., the median of fragility) in operational condition TOC4. It was interesting to find that the fragility of the wind turbine in operational conditions TOC2 and TOC3 were slightly smaller than that of the reference condition TOC0. This was because the aerodynamic damping of the wind turbine under operational conditions TOC2 and TOC3 was much higher than the aerodynamic damping used in TOC0, while the addition wind and wave loads were small. The probability of exceeding the damage state of the wind turbine in operational condition TOC6 was close to that of TOC5, which was smaller than the results from TOC4 while the wind speed was higher. This is due to the fact that the pitch control mechanism in the blades is initiated when the wind speed is higher than the rated wind speed. This manipulation makes the blades rotate with a pitch angle causing the rotor to rotate in a slower rate, which results in a lower wind forces and moments acting on the wind turbine [22]. It is also because of lower aerodynamic damping at the operational condition TOC4 compared to that of the operational conditions TOC5 and TOC6. The comparison of the fragility of the wind turbine under the operational conditions TOC4–6 and in the reference condition TOC0 showed that the seismic fragilities of the wind turbine in operational conditions TOC4–6 were slightly increased by the joint action of environmental wind and wave loads.
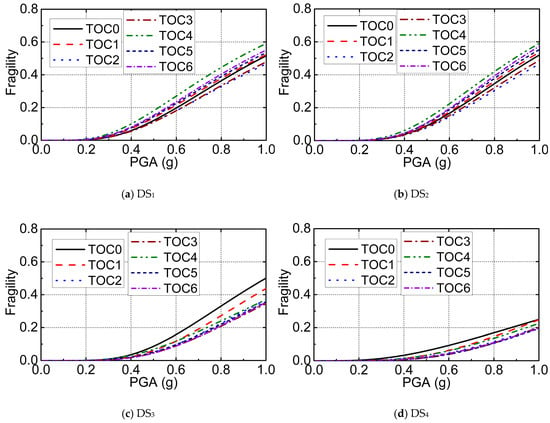
Figure 10.
Seismic fragility curves for different damage states of the monopile offshore wind turbine in different operational conditions.

Table 11.
Median and dispersion value of fragilities for different damage states of the monopile offshore wind turbine in different operational conditions.
Fragility curves for damage state DS2, as plotted in Figure 10b, showed a similar trend concerning environmental load effects as that of the damage state DS1. However, the fragility curves for the damage states DS3 and DS4, as drawn in Figure 10c,d, showed a different trend concerning environmental load effects as that of the damage states DS1 and DS2. The probability of exceeding the allowable and the yield stresses at the transition piece in TOC0 was slightly higher than the results in operational conditions TOC1–6. This was due to the fact that the stress measuring point of the transition piece was at the MSL, which was close to the constraint end of the cantilever wind turbine and also close to the earthquake motion input nodes of the numerical model. The measured stresses at the transition piece experienced a short duration of vibration dominated by the input seismic waves at the beginning of earthquake excitation, as seen in Figure 5c depicting the time history stress curves at the transition piece. The environmental loads and the aerodynamic damping of the wind turbine reduced the fluctuation of stress of the transition piece.
6. Conclusions
Seismic fragility analysis of a 5 MW monopile offshore wind turbine considering the combined action of environmental wave and wind loads in different operational conditions was performed in this study. A nonlinear finite element model of the wind turbine, accounting for the nonlinearity of pile-soil interaction, was developed in the OpenSees platform. The model was calibrated and verified through a modal analysis and compared with published results. The highlight of this study was that the aerodynamic and wave loads generated from wind fields with different mean wind speeds and random sea states were applied to the finite element model along with earthquake motions. Dynamic responses of the offshore wind turbine were then obtained by solving the finite element model. Different damage states were defined based on the demands of the wind turbine, and TIDA analysis was applied to calculate the fragility of the wind turbine. It has been found that the seismic response of the monopile wind turbine was highly affected by the frequency component of the input ground motion record. The environmental wind and wave loads and the aerodynamic damping of the wind turbine had a considerable influence on the seismic dynamic responses of the wind turbine structure, and also on the seismic fragility. Wind turbines in normal operation at the rated wind speed condition suffering from earthquake motion are subject to a higher probability of excessive displacement at the nacelle and excessive rotation at the tower top than wind turbines in other operational conditions, e.g., turbine in idling and normal operation at lower or higher wind speeds. In rated power production scenarios, assessment neglecting the effects of environmental wind and wave loads in seismic fragility analysis of offshore wind turbines results in an underestimation of the seismic fragility of the wind turbine.
Acknowledgments
The research program is financially supported by the National Natural Science Foundation of China (Grant Nos. 51379037, 41206075 and 51504233).
Author Contributions
Renjie Mo and Haigui Kang jointly conceived the study. Renjie Mo carried out the finite element analysis. Renjie Mo and Xuanlie Zhao collected and analyzed data with the help of Miao Li. Renjie Mo wrote the main paper. Miao Li and Haigui Kang supervised the study and edited the manuscript.
Conflicts of Interest
The authors declare no conflict of interest.
References
- The European Wind Energy Association. The European Offshore Wind Industry-Key Trends and Statistics 2015; European Wind Energy Association: Brussels, Belgium, 2015. [Google Scholar]
- DNVGL. Support Structures for Wind Turbines; DNVGL Standard DNVGL-ST-0126; DNVGL: Oslo, Norway, 2016. [Google Scholar]
- Det Norske Veritas. Design of Offshore Wind Turbine Structures; Offshore standard DNV-OS-J101; Det Norske Veritas: Høvik, Norway, 2014. [Google Scholar]
- Vanessa, S.; Hussam, M. Multihazard assessment of wind turbine towers under simultaneous application of wind, operation, and seismic loads. J. Perform. Constr. Facil. 2016, 30, 04016043. [Google Scholar]
- Katsanos, E.I.; Thöns, S.; Georgakis, C.Τ. Wind turbines and seismic hazard: A state-of-the-art review. Wind Energy 2016, 19, 2113–2133. [Google Scholar] [CrossRef]
- Hong, R.C.Y. Response of a Wind Turbine Blade to Seismic and Turbulent Wind Excitations. Ph.D. Thesis, University of Illinois Urbana-Champaign, Champaign, IL, USA, 1984. [Google Scholar]
- Lavassas, I.; Nikolaidis, G.; Zervas, P.; Efthimiou, E.; Doudoumis, I.N.; Baniotopoulos, C.C. Analysis and design of the prototype of a steel 1-MW wind turbine tower. Eng. Struct. 2003, 25, 1097–1106. [Google Scholar] [CrossRef]
- Prowell, I. An Experimental and Numerical Study of Wind Turbine Seismic Behaviour. Ph.D. Thesis, University of California, Oakland, CA, USA, 2011. [Google Scholar]
- Ku, C.Y.; Chien, L.K. Modeling of load bearing characteristics of jacket foundation piles for offshore wind turbines in taiwan. Energies 2016, 9, 625. [Google Scholar] [CrossRef]
- Prowell, I.; Veers, P. Assessment of Wind Turbine Seismic Risk: Existing Literature and Simple Study of Tower Moment Demand; Sandia Report SAND2009–1100; Sandia National Laboratories: Albuquerque, NM, USA, 2009.
- Prowell, I.; Elgamal, A.; Uang, C.M.; Enrique Luco, J.; Romanowitz, H.; Duggan, E. Shake table testing and numerical simulation of a utility-scale wind turbine including operational effects. Wind Energy 2014, 17, 997–1016. [Google Scholar] [CrossRef]
- Wang, Y.K.; Chai, J.F.; Chang, Y.W.; Huang, T.Y.; Kuo, Y.S. Development of seismic demand for chang-bin offshore wind farm in taiwan strait. Energies 2016, 9, 1036. [Google Scholar] [CrossRef]
- Kandil, K.S.A.; Saudi, G.N.; Eltaly, B.A.A.; El-khier, M.M.A. Seismic response of a full-scale wind turbine tower using experimental and numerical modal analysis. Int. J. Adv. Struct. Eng. 2016, 8, 337–349. [Google Scholar]
- Bazeos, N.; Hatzigeorgiou, G.D.; Hondros, I.D.; Karamaneas, H.; Karabalis, D.L.; Beskos, D.E. Static, seismic and stability analyses of a prototype wind turbine steel tower. Eng. Struct. 2002, 24, 1015–1025. [Google Scholar] [CrossRef]
- Moore, G.J. MSC/Nastran Design Sensitivity and Optimization: User's Guide, version 67; The MacNeal-Schwendler Corporation: Los Angeles, CA, USA, 1992. [Google Scholar]
- Stamatopoulos, G.N. Response of a wind turbine subjected to near-fault excitation and comparison with the greek aseismic code provisions. Soil Dyn. Earthq. Eng. 2013, 46, 77–84. [Google Scholar] [CrossRef]
- Witcher, D. Seismic analysis of wind turbines in the time domain. Wind Energy 2005, 8, 81–91. [Google Scholar] [CrossRef]
- Díaz, O.; Suárez, L.E. Seismic analysis of wind turbines. Earthq. Spectra 2014, 30, 743–765. [Google Scholar] [CrossRef]
- Sapountzakis, E.J.; Dikaros, I.C.; Kampitsis, A.E.; Koroneou, A.D. Nonlinear response of wind turbines under wind and seismic excitations with soil–structure interaction. J. Comput. Nonlin. Dyn. 2015, 10. [Google Scholar] [CrossRef]
- Asareh, M.A.; Prowell, I. A Simplified Approach for Implicitly Considering Aerodynamics in the Seismic Response of Utility Scale Wind Turbines. In Proceedings of the 53rd AIAA/ASME/ASCE/AHS/ASC Structures, Structural Dynamics and Materials Conference, Honolulu, HI, USA, 23–26 April 2012; pp. 23–26. [Google Scholar]
- Asareh, M.A.; Schonberg, W.; Volz, J. Fragility analysis of a 5-MW nrel wind turbine considering aero-elastic and seismic interaction using finite element method. Finite Elements Anal. Des. 2016, 120, 57–67. [Google Scholar] [CrossRef]
- Asareh, M.A.; Schonberg, W.; Volz, J. Effects of seismic and aerodynamic load interaction on structural dynamic response of multi-megawatt utility scale horizontal axis wind turbines. Renew. Energy 2016, 86, 49–58. [Google Scholar] [CrossRef]
- Santangelo, F.; Failla, G.; Santini, A.; Arena, F. Time-domain uncoupled analyses for seismic assessment of land-based wind turbines. Eng. Struct. 2016, 123, 275–299. [Google Scholar] [CrossRef]
- Kjørlaug, R.A.; Kaynia, A.M. Vertical earthquake response of megawatt-sized wind turbine with soil-structure interaction effects. Earthq. Eng. Struct. Dyn. 2015, 44, 2341–2358. [Google Scholar] [CrossRef]
- Ma, H. Seismic analysis for wind turbines including soil-structure interaction combining vertical and horizontal earthquake. In Proceedings of the 15th World Conference on Earthquake Engineering, Lisbon, Portugal, 24–28 September 2012. [Google Scholar]
- Kim, D.H.; Lee, S.G.; Lee, I.K. Seismic fragility analysis of 5 mw offshore wind turbine. Renew. Energy 2014, 65, 250–256. [Google Scholar] [CrossRef]
- Yu, H.; Zeng, X.; Li, B.; Lian, J. Centrifuge modeling of offshore wind foundations under earthquake loading. Soil Dyn. Earthq. Eng. 2015, 77, 402–415. [Google Scholar] [CrossRef]
- Kourkoulis, R.S.; Lekkakis, P.C.; Gelagoti, F.M.; Kaynia, A.M. Suction caisson foundations for offshore wind turbines subjected to wave and earthquake loading: Effect of soil–foundation interface. Géotechnique 2014, 64, 171–185. [Google Scholar] [CrossRef]
- Zheng, X.Y.; Li, H.; Rong, W.; Li, W. Joint earthquake and wave action on the monopile wind turbine foundation: An experimental study. Mar. Struct. 2015, 44, 125–141. [Google Scholar] [CrossRef]
- Anastasopoulos, I.; Theofilou, M. Hybrid foundation for offshore wind turbines: Environmental and seismic loading. Soil Dyn. Earthq. Eng. 2016, 80, 192–209. [Google Scholar]
- McKenna, F.; Fenves, G.L.; H, S.M. Open System for Earthquake Engineering Simulation (Opensees); Pacific Earthquake Engineering Research Center: Berkeley, CA, USA, 2006. [Google Scholar]
- Masanobu, S.; Feng, M.Q.; Jongheon, L.; Toshihiko, N. Statistical analysis of fragility curves. J. Eng. Mech. 2000, 126, 1224–1231. [Google Scholar]
- Baker, J.W.; Cornell, C.A. Vector-Valued Ground Motion Intensity Measures for Probabilistic Seismic Demand Analysis; PEER Report 2006/08; University of Stanford: Stanford, CA, USA, 2006. [Google Scholar]
- Vamvatsikos, D.; Cornell, C.A. Incremental dynamic analysis. Earthq. Eng. Struct. Dyn. 2002, 31, 491–514. [Google Scholar]
- Nielson, B.G.; DesRoches, R. Seismic fragility methodology for highway bridges using a component level approach. Earthq. Eng. Struct. Dyn. 2007, 36, 823–839. [Google Scholar]
- Padgett, J.E.; DesRoches, R. Methodology for the development of analytical fragility curves for retrofitted bridges. Earthq. Eng. Struct. Dyn. 2008, 37, 1157–1174. [Google Scholar]
- Baker, J.W. Efficient analytical fragility function fitting using dynamic structural analysis. Earthq. Spectra 2014, 31, 579–599. [Google Scholar]
- Jonkman, J.M.; Butterfield, S.; Musial, W.; Scott, G. Definition of a 5-MW Reference Wind Turbine for Offshore System Development; Technical Report NREL/TP-500–38060; National Renewable Energy Laboratory: Golden, CO, USA, 2009.
- Zhang, Q.W.; Xia, Z.B.; Huang, Y.M.; Chen, S.Z. Code for Design of Steel Structures; China Building Industry Press: BeiJing, China, 2003. [Google Scholar]
- Filippou, F. Steel02 Material—Giuffré-Menegotto-Pinto Model with Isotropic Strain Hardening. Available online: http://opensees.berkeley.edu/wiki/index.php/Steel02_Material_—_Giuffré-Menegotto-Pinto_Model_with_Isotropic_Strain_Hardening (accessed on 2 May 2017).
- Newman, J. Marine Hydrodynamics; MIT Press: Cambridge, MA, USA, 1977. [Google Scholar]
- Feyzollahzadeh, M.; Mahmoodi, M.J.; Yadavar-Nikravesh, S.M.; Jamali, J. Wind load response of offshore wind turbine towers with fixed monopile platform. J. Wind Eng. Ind. Aerodyn. 2016, 158, 122–138. [Google Scholar]
- Maniaci, D.C.; Li, Y. Investigating the influence of the added mass effect to marine hydrokinetic horizontal-axis turbines using a general dynamic wake wind turbine code. Mar. Technol. Soc. J. 2012, 46, 71–78. [Google Scholar]
- Boulanger, R.W.; Curras, C.J.; Kutter, B.L.; Wilson, D.W.; Abghari, A. Seismic soil-pile-structure interaction experiments and analyses. J. Geotech. Geoenviron. 1999, 125, 750–759. [Google Scholar]
- Boulanger, R. The Pysimple1, Azsimple1 and Tzsimple1 Material Documentation. Available online: http://opensees.berkeley.edu/wiki/index.php/PySimple1_Material (accessed on 26 December 2016).
- Achmus, M.; Abdel-Rahman, K.; Kuo, Y.S. Design of monopile foundations for offshore wind energy converters. In Proceedings of the 11th Baltic Sea Geotechnical Conference, Gdansk, Poland, 15–18 September 2008; Volume 1, pp. 463–470. [Google Scholar]
- Achmus, M.; Abdel-Rahman, K.; Kuo, Y.S. Numerical modelling of large diameter steel piles under monotonic and cyclic horizontal loading. In Proceedings of the Twelfth International Conference on Civil, Structural and Environmental Engineering Computing, Stirlingshire, UK, 24–25 September 2013. [Google Scholar]
- Lesny, K.; Paikowsky, S.G.; Gurbuz, A. Scale Effects in Lateral Load Response of Large Diameter Monopiles. In Proceedings of the Contemporary Issues in Deep Foundations, Denver, CO, USA, 18–21 February 2007. [Google Scholar]
- Sørensen, S.P.H.; Møller, M.; Brødbæk, K.T.; Augustesen, A.H.; Ibsen, L.B. Numerical Evaluation of Load-Displacement Relationships for Non-Slender Monopiles in Sand; DCE Technical Report No. 80; Department of Civil Engineering, Aalborg University: Aalborg, Denmark, 2009. [Google Scholar]
- Applied Technology Council. Quantification of Building Seismic Performance Factors; Report FEMA-P695; Applied Technology Council: Redwood City, CA, USA, 2009. [Google Scholar]
- PEER. Peer Ground Motion Database. Available online: http://ngawest2.berkeley.edu/site (accessed on 26 December 2016).
- Jonkman, J.M.; Buhl, M.L., Jr. Fast User's Guide; National Renewable Energy Laboratory: Golden, CO, USA, 2005. [Google Scholar]
- Jonkman, B.J.; Kilcher, L. Turbsim User's Guide; version 1.06.00; National Renewable Energy Laboratory: Golden, CO, USA, 2012.
- International Electrotechnical Commission. IEC 61400–1: Wind Turbines Part 1: Design Requirements; International Electrotechnical Commission: Geneva, Switzerland, 2005. [Google Scholar]
- Moriarty, P.J.; Hansen, A.C. Aerodyn Theory Manual; National Renewable Energy Laboratory: Golden, CO, USA, 2005.
- Goda, Y. Random Seas and Design of Maritime Structures; World Scientific: Singapore, 2010. [Google Scholar]
- Hasselmann, K. Measurements of Wind-Wave Growth and Swell Decay during the Joint North Sea Wave Project (Jonswap); Technical Report; Deutches Hydrographisches Institut: Hamburg, Germany, 1973. [Google Scholar]
- Morison, J.R.; Johnson, J.W.; Schaaf, S.A. The force exerted by surface waves on piles. J. Petrol. Technol. 1950, 2, 149–154. [Google Scholar]
- Jonkman, J.M.; Robertson, A.N.; Hayman, G.J. Hydrodyn User’s Guide and Theory Manual; Technical Report (Arial 11 pt Bold); National Renewable Energy Laboratory: Golden, CO, USA, 2014.
- Abhinav, K.A.; Saha, N. Stochastic response of jacket supported offshore wind turbines for varying soil parameters. Renew. Energy 2017, 101, 550–564. [Google Scholar] [CrossRef]
- Germanischer Lloyd Wind Energie. Overall Damping for Piled Offshore Support Structures, Guideline for the Certification of Offshore Wind Turbines; Germanischer Lloyd WindEnergie: Hamburg, Germany, 2005. [Google Scholar]
- Shirzadeh, R.; Devriendt, C.; Bidakhvidi, M.A.; Guillaume, P. Experimental and computational damping estimation of an offshore wind turbine on a monopile foundation. J. Wind Eng. Ind. Aerodyn. 2013, 120, 96–106. [Google Scholar] [CrossRef]
- Koukoura, C.; Natarajan, A.; Vesth, A. Identification of support structure damping of a full scale offshore wind turbine in normal operation. Renew. Energy 2015, 81, 882–895. [Google Scholar] [CrossRef]
- Liu, X.; Lu, C.; Li, G.; Godbole, A.; Chen, Y. Effects of aerodynamic damping on the tower load of offshore horizontal axis wind turbines. Appl. Energy 2017, in press. [Google Scholar] [CrossRef]
- Carswell, W.; Johansson, J.; Løvholt, F.; Arwade, S.R.; Madshus, C.; DeGroot, D.J.; Myers, A.T. Foundation damping and the dynamics of offshore wind turbine monopiles. Renew. Energy 2015, 80, 724–736. [Google Scholar] [CrossRef]
- Valamanesh, V.; Myers, A.T. Aerodynamic damping and seismic response of horizontal axis wind turbine towers. J. Struct. Eng. 2014, 140, 04014090. [Google Scholar] [CrossRef]
- Stewart, G.M.; Lackner, M.A. The impact of passive tuned mass dampers and wind–wave misalignment on offshore wind turbine loads. Eng. Struct. 2014, 73, 54–61. [Google Scholar] [CrossRef]
- Zuo, H.; Bi, K.; Hao, H. Using multiple tuned mass dampers to control offshore wind turbine vibrations under multiple hazards. Eng. Struct. 2017, 141, 303–315. [Google Scholar] [CrossRef]
© 2017 by the authors. Licensee MDPI, Basel, Switzerland. This article is an open access article distributed under the terms and conditions of the Creative Commons Attribution (CC BY) license (http://creativecommons.org/licenses/by/4.0/).
