
Production of Torrefied Solid Bio-Fuel from Pulp Industry Waste


Abstract
:1. Introduction
2. Results and Discussion
2.1. Basic Properties of WPS
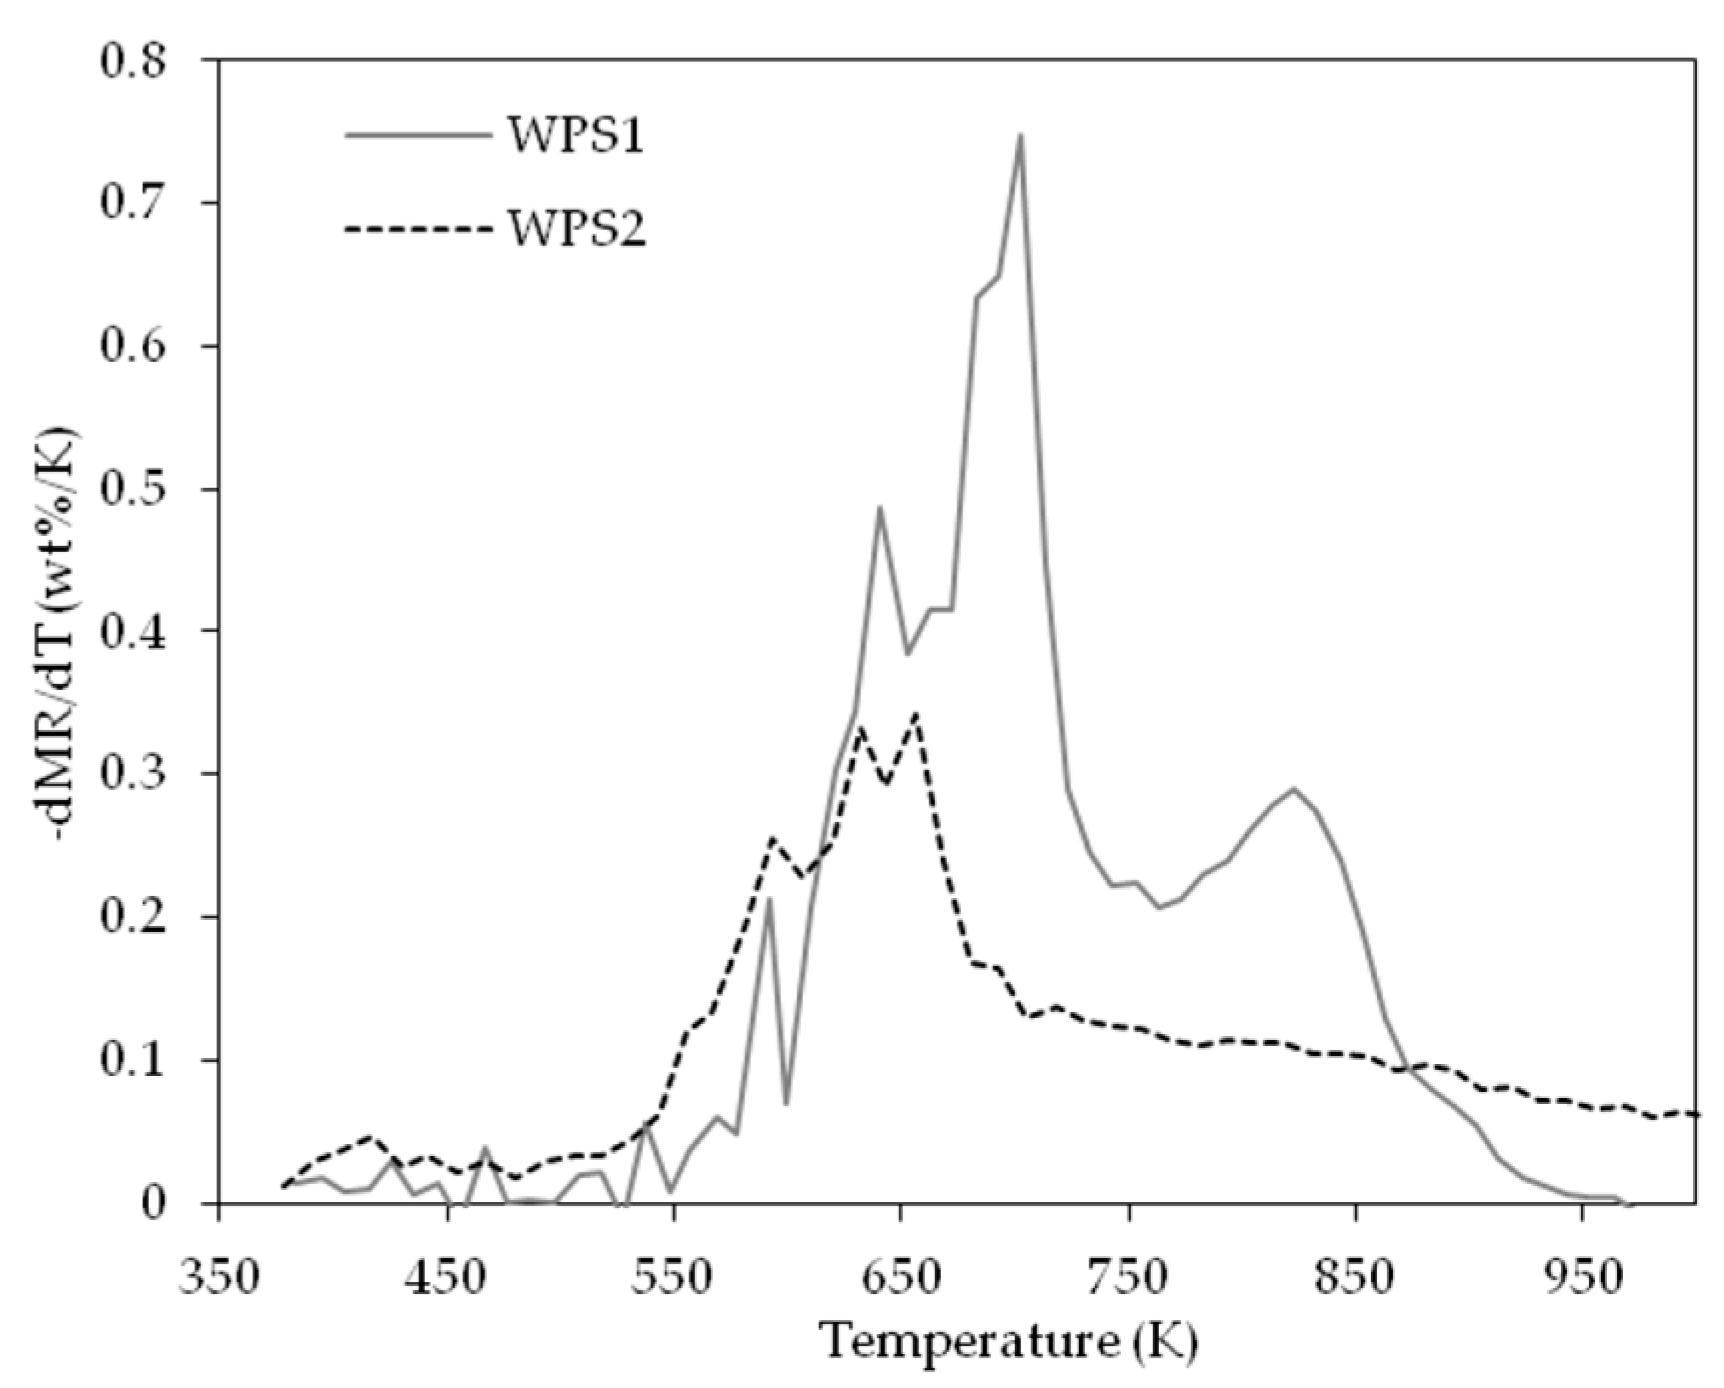
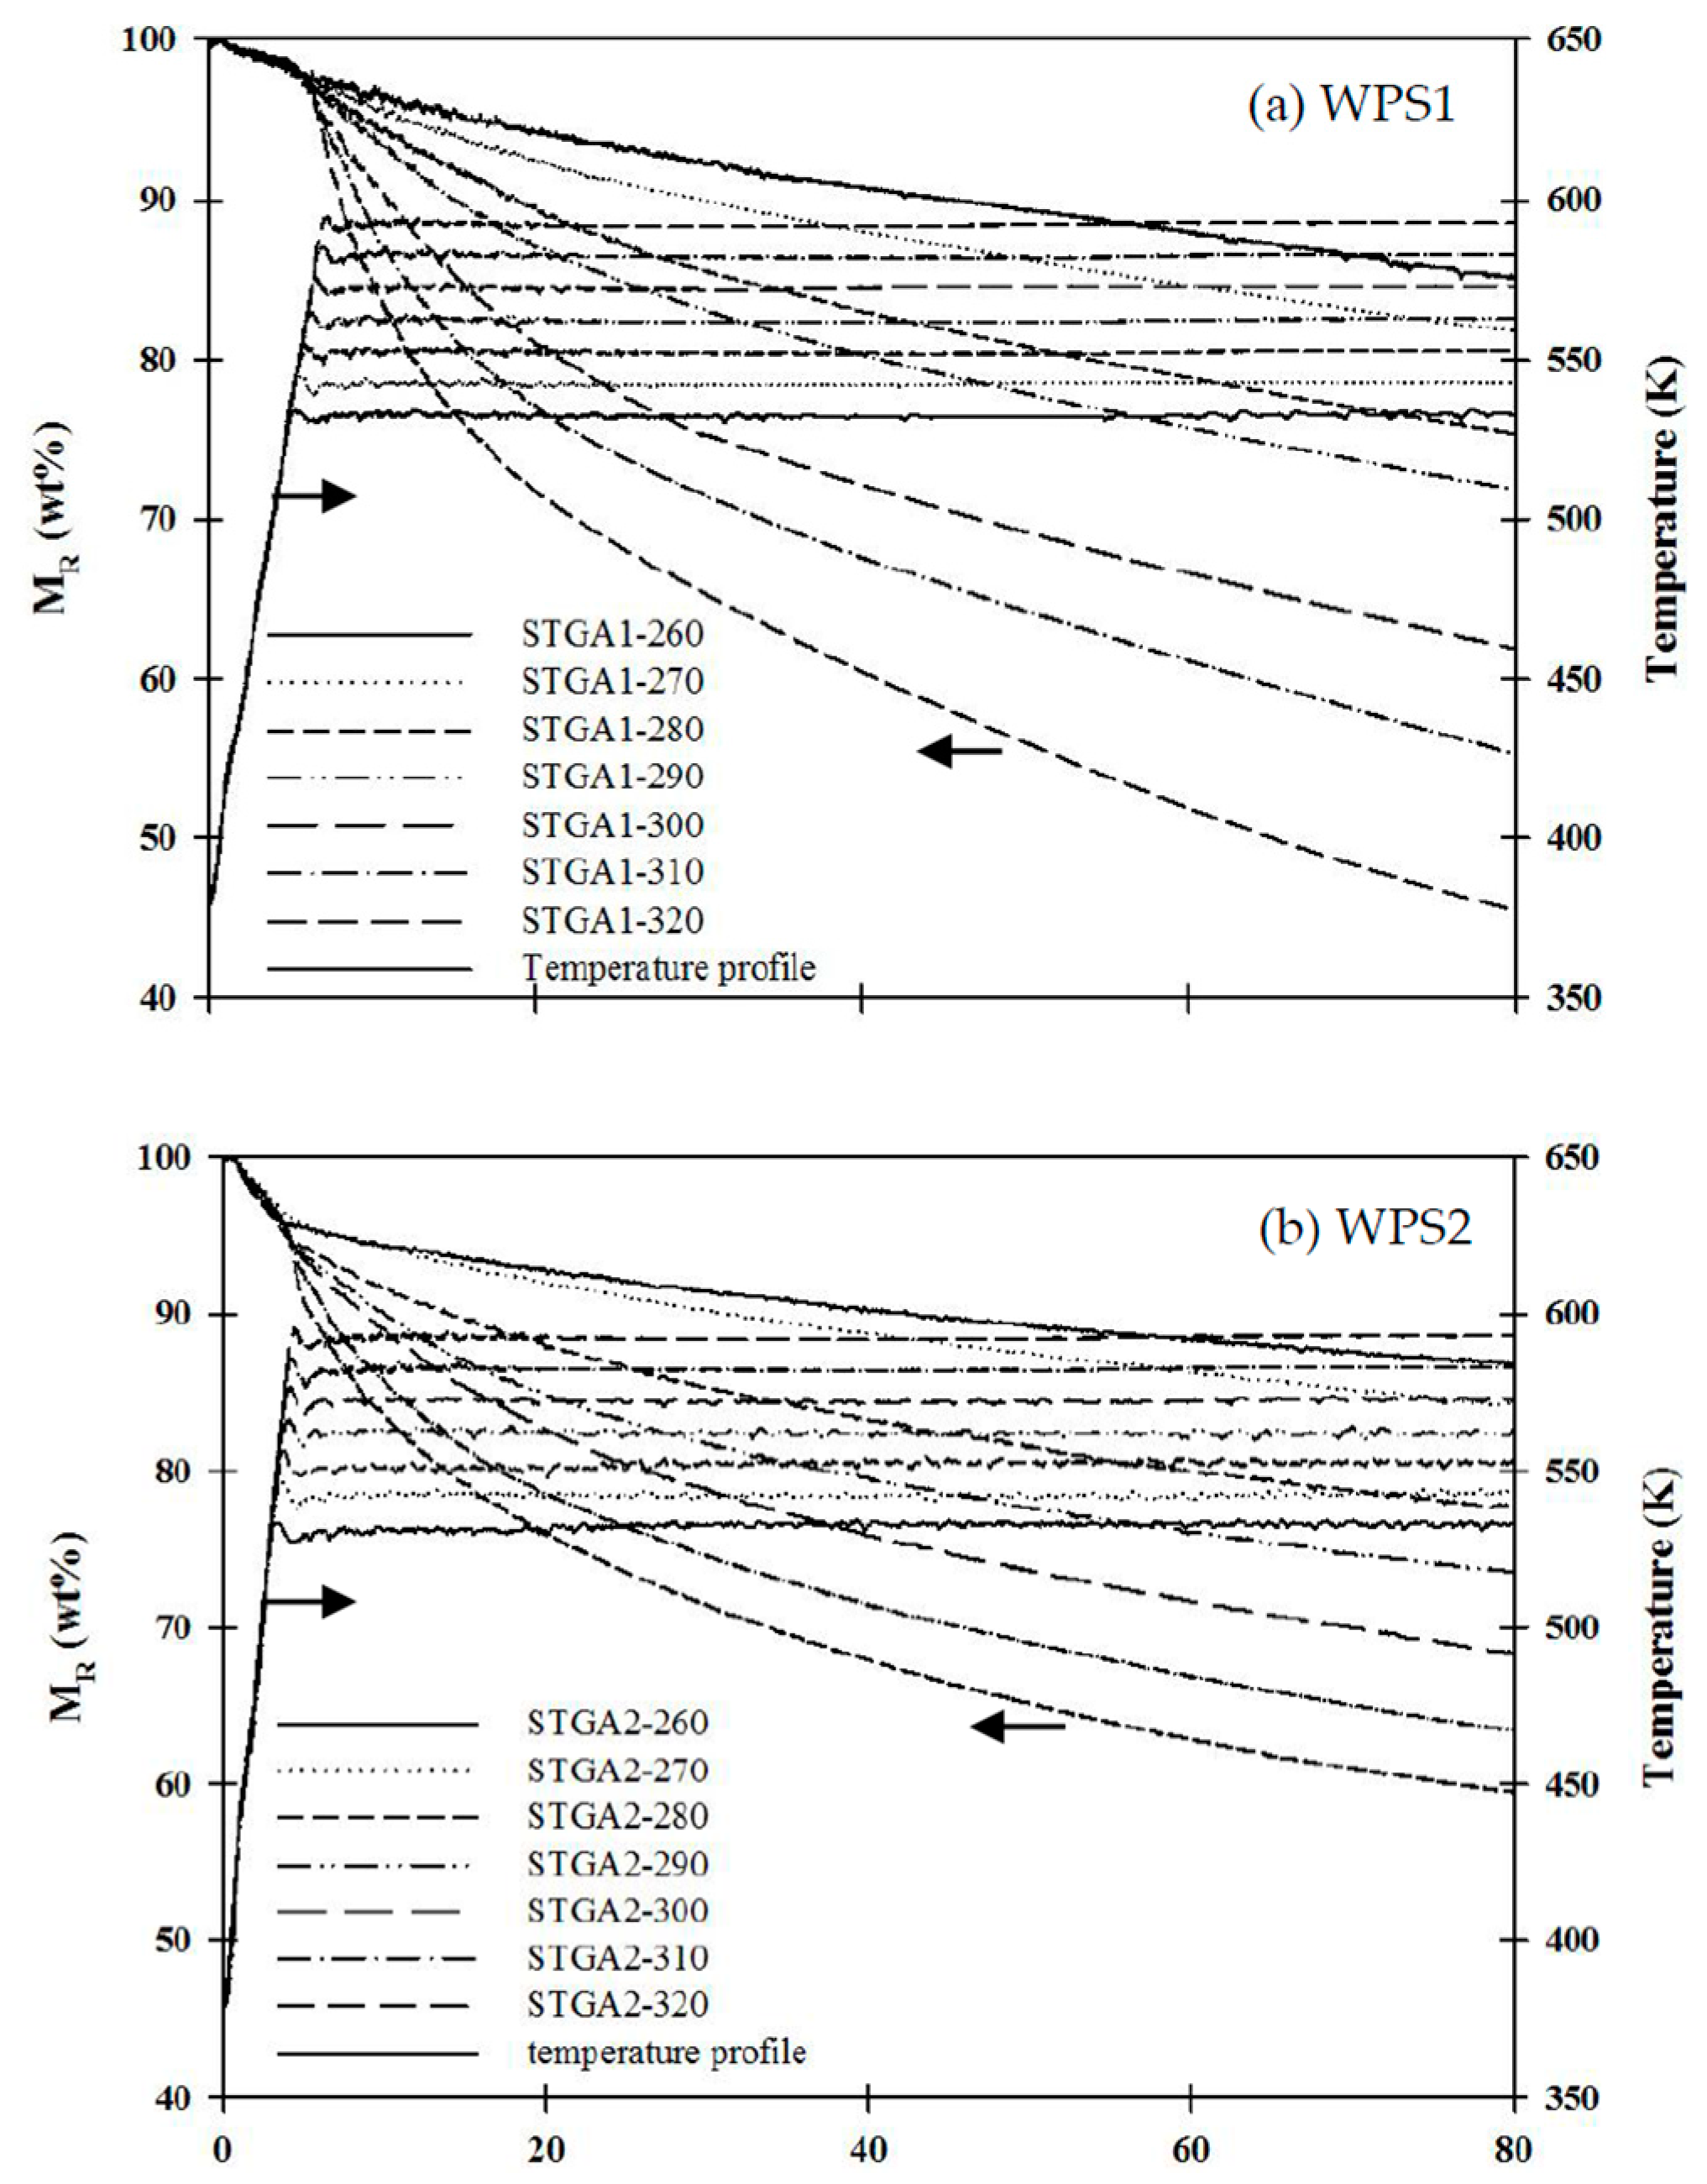
2.2. TGA Characteristics of Pyrolysis and Torrefaction
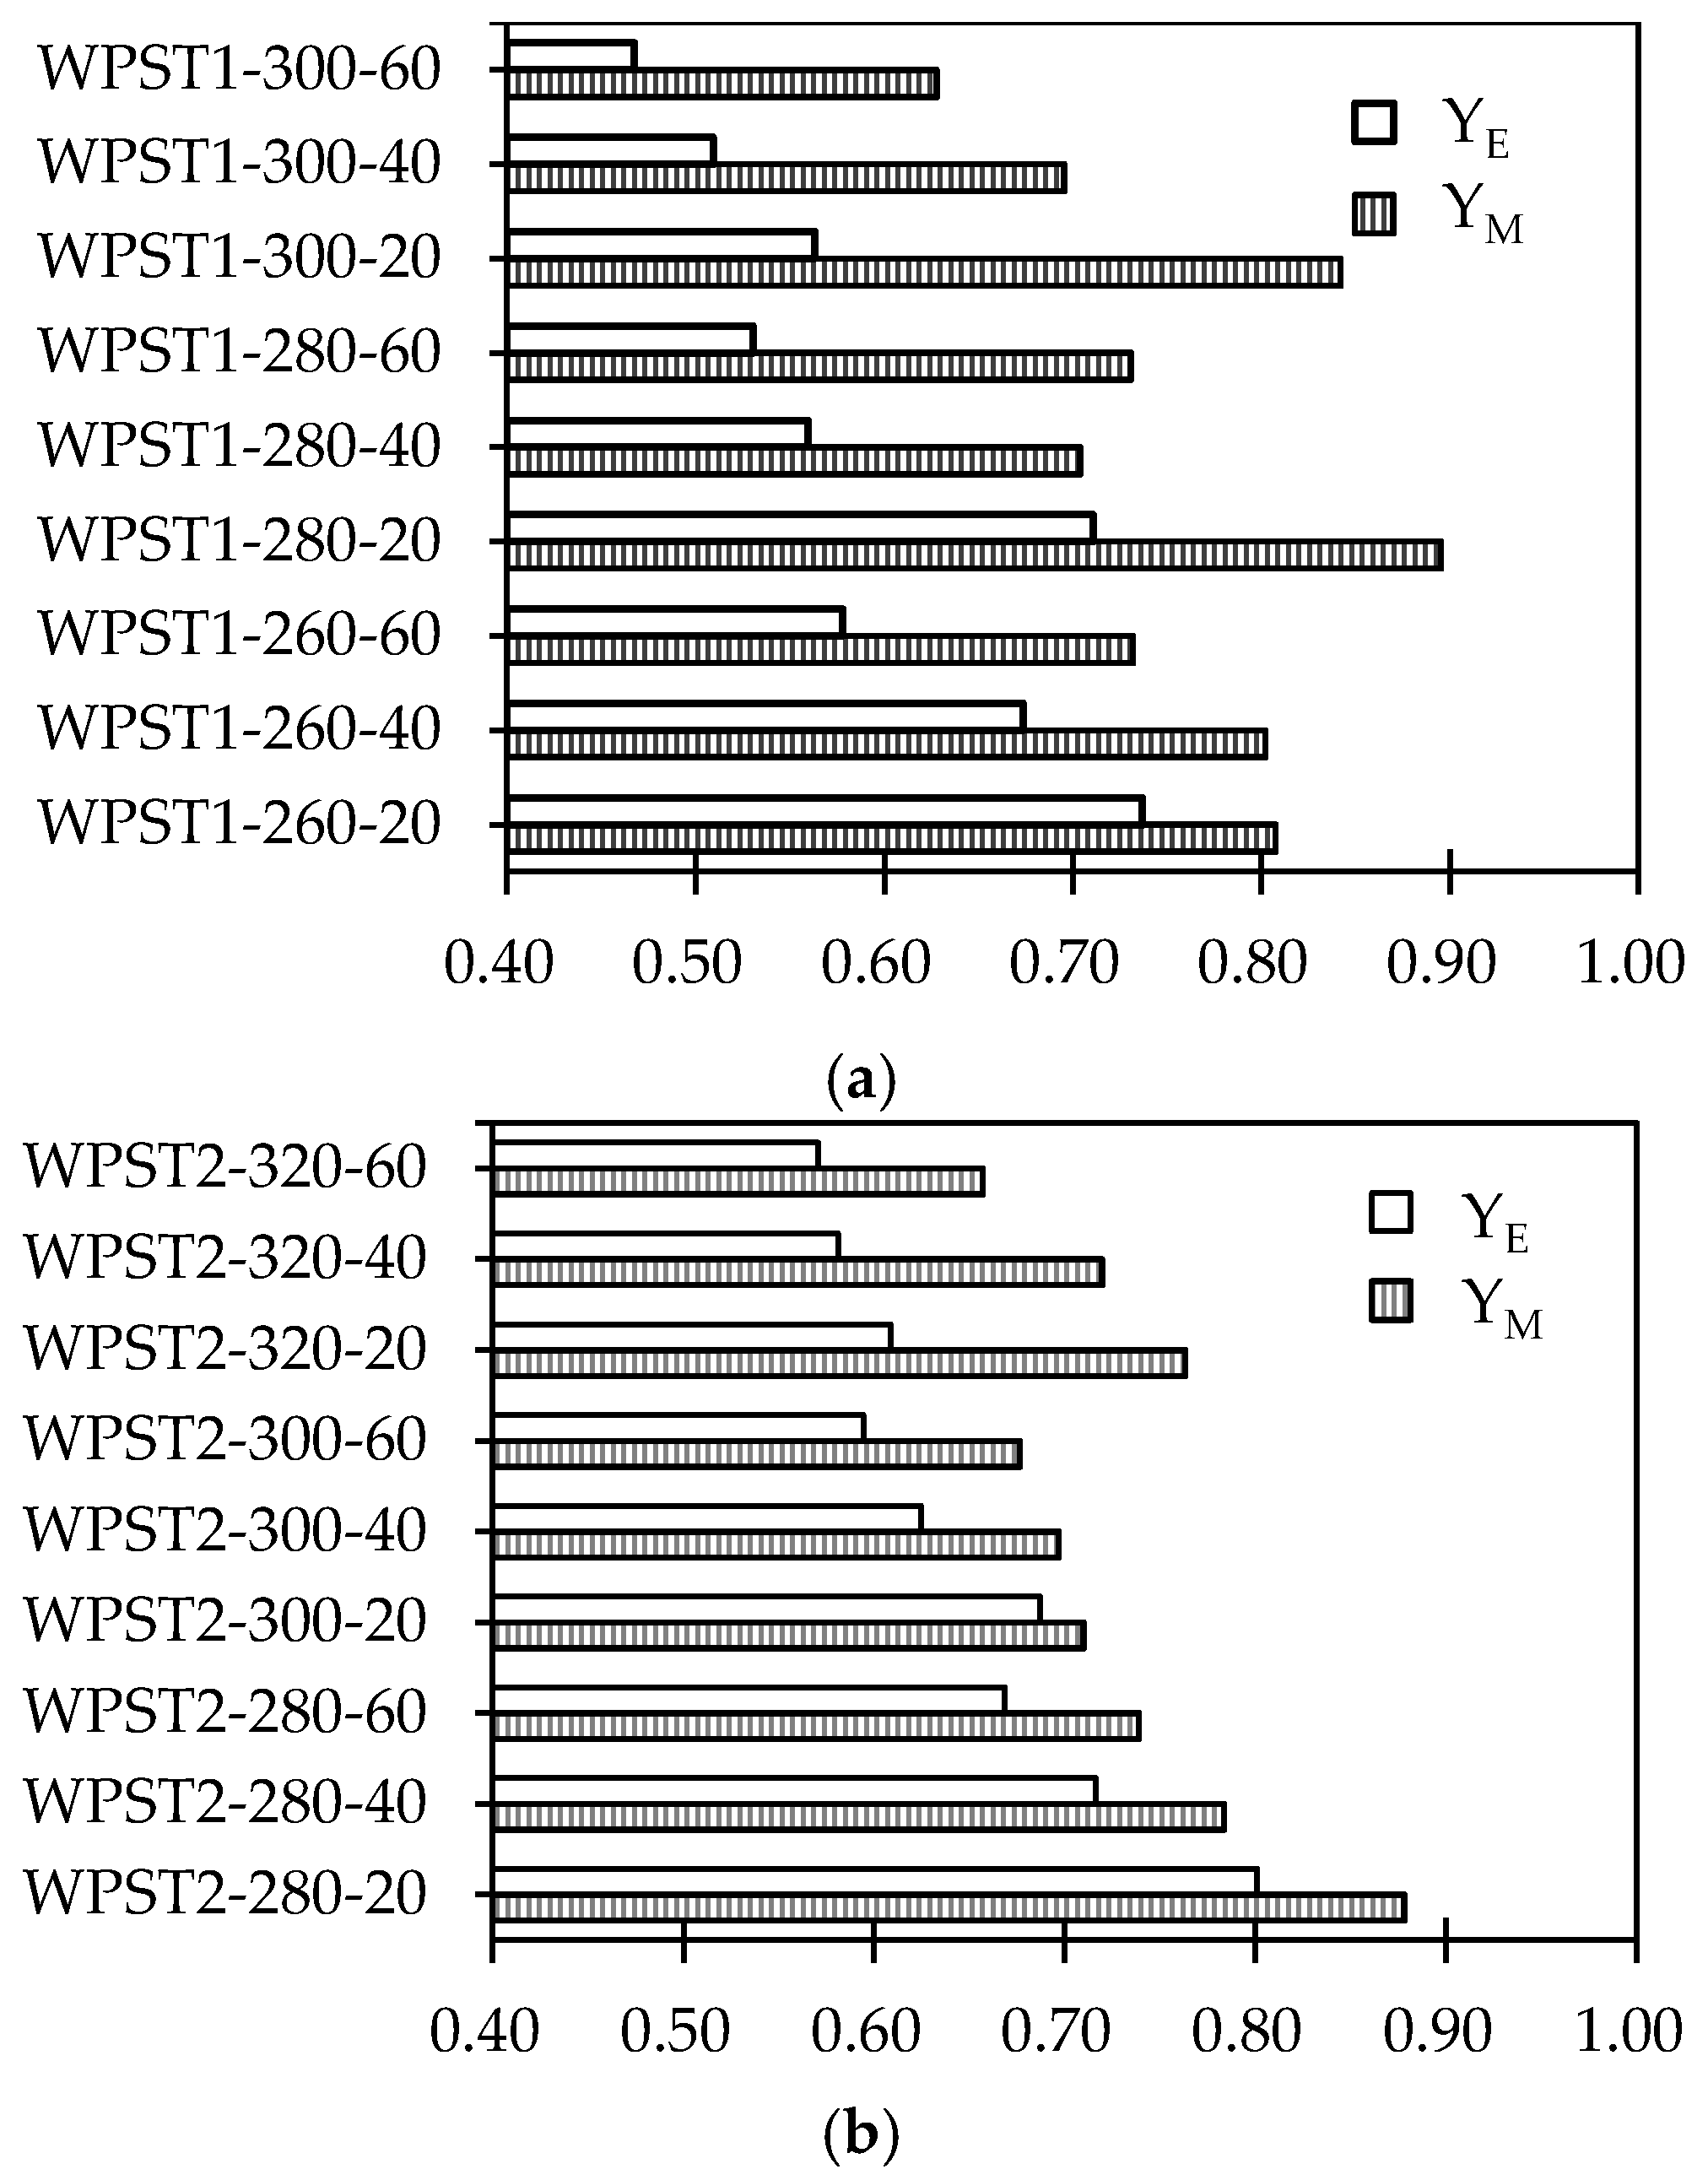
2.3. Energy Densification
- HHD = dry-basis high heating value,
- HHDRD, HHDTD = HHD of dried raw and torrefied samples,
- mRD, mTD = mass of dried raw and torrefied samples.
2.4. Comparison of Results with Those of Others
3. Experimental Methods
3.1. Property Analysis
3.2. Thermal Gravimetric Analysis
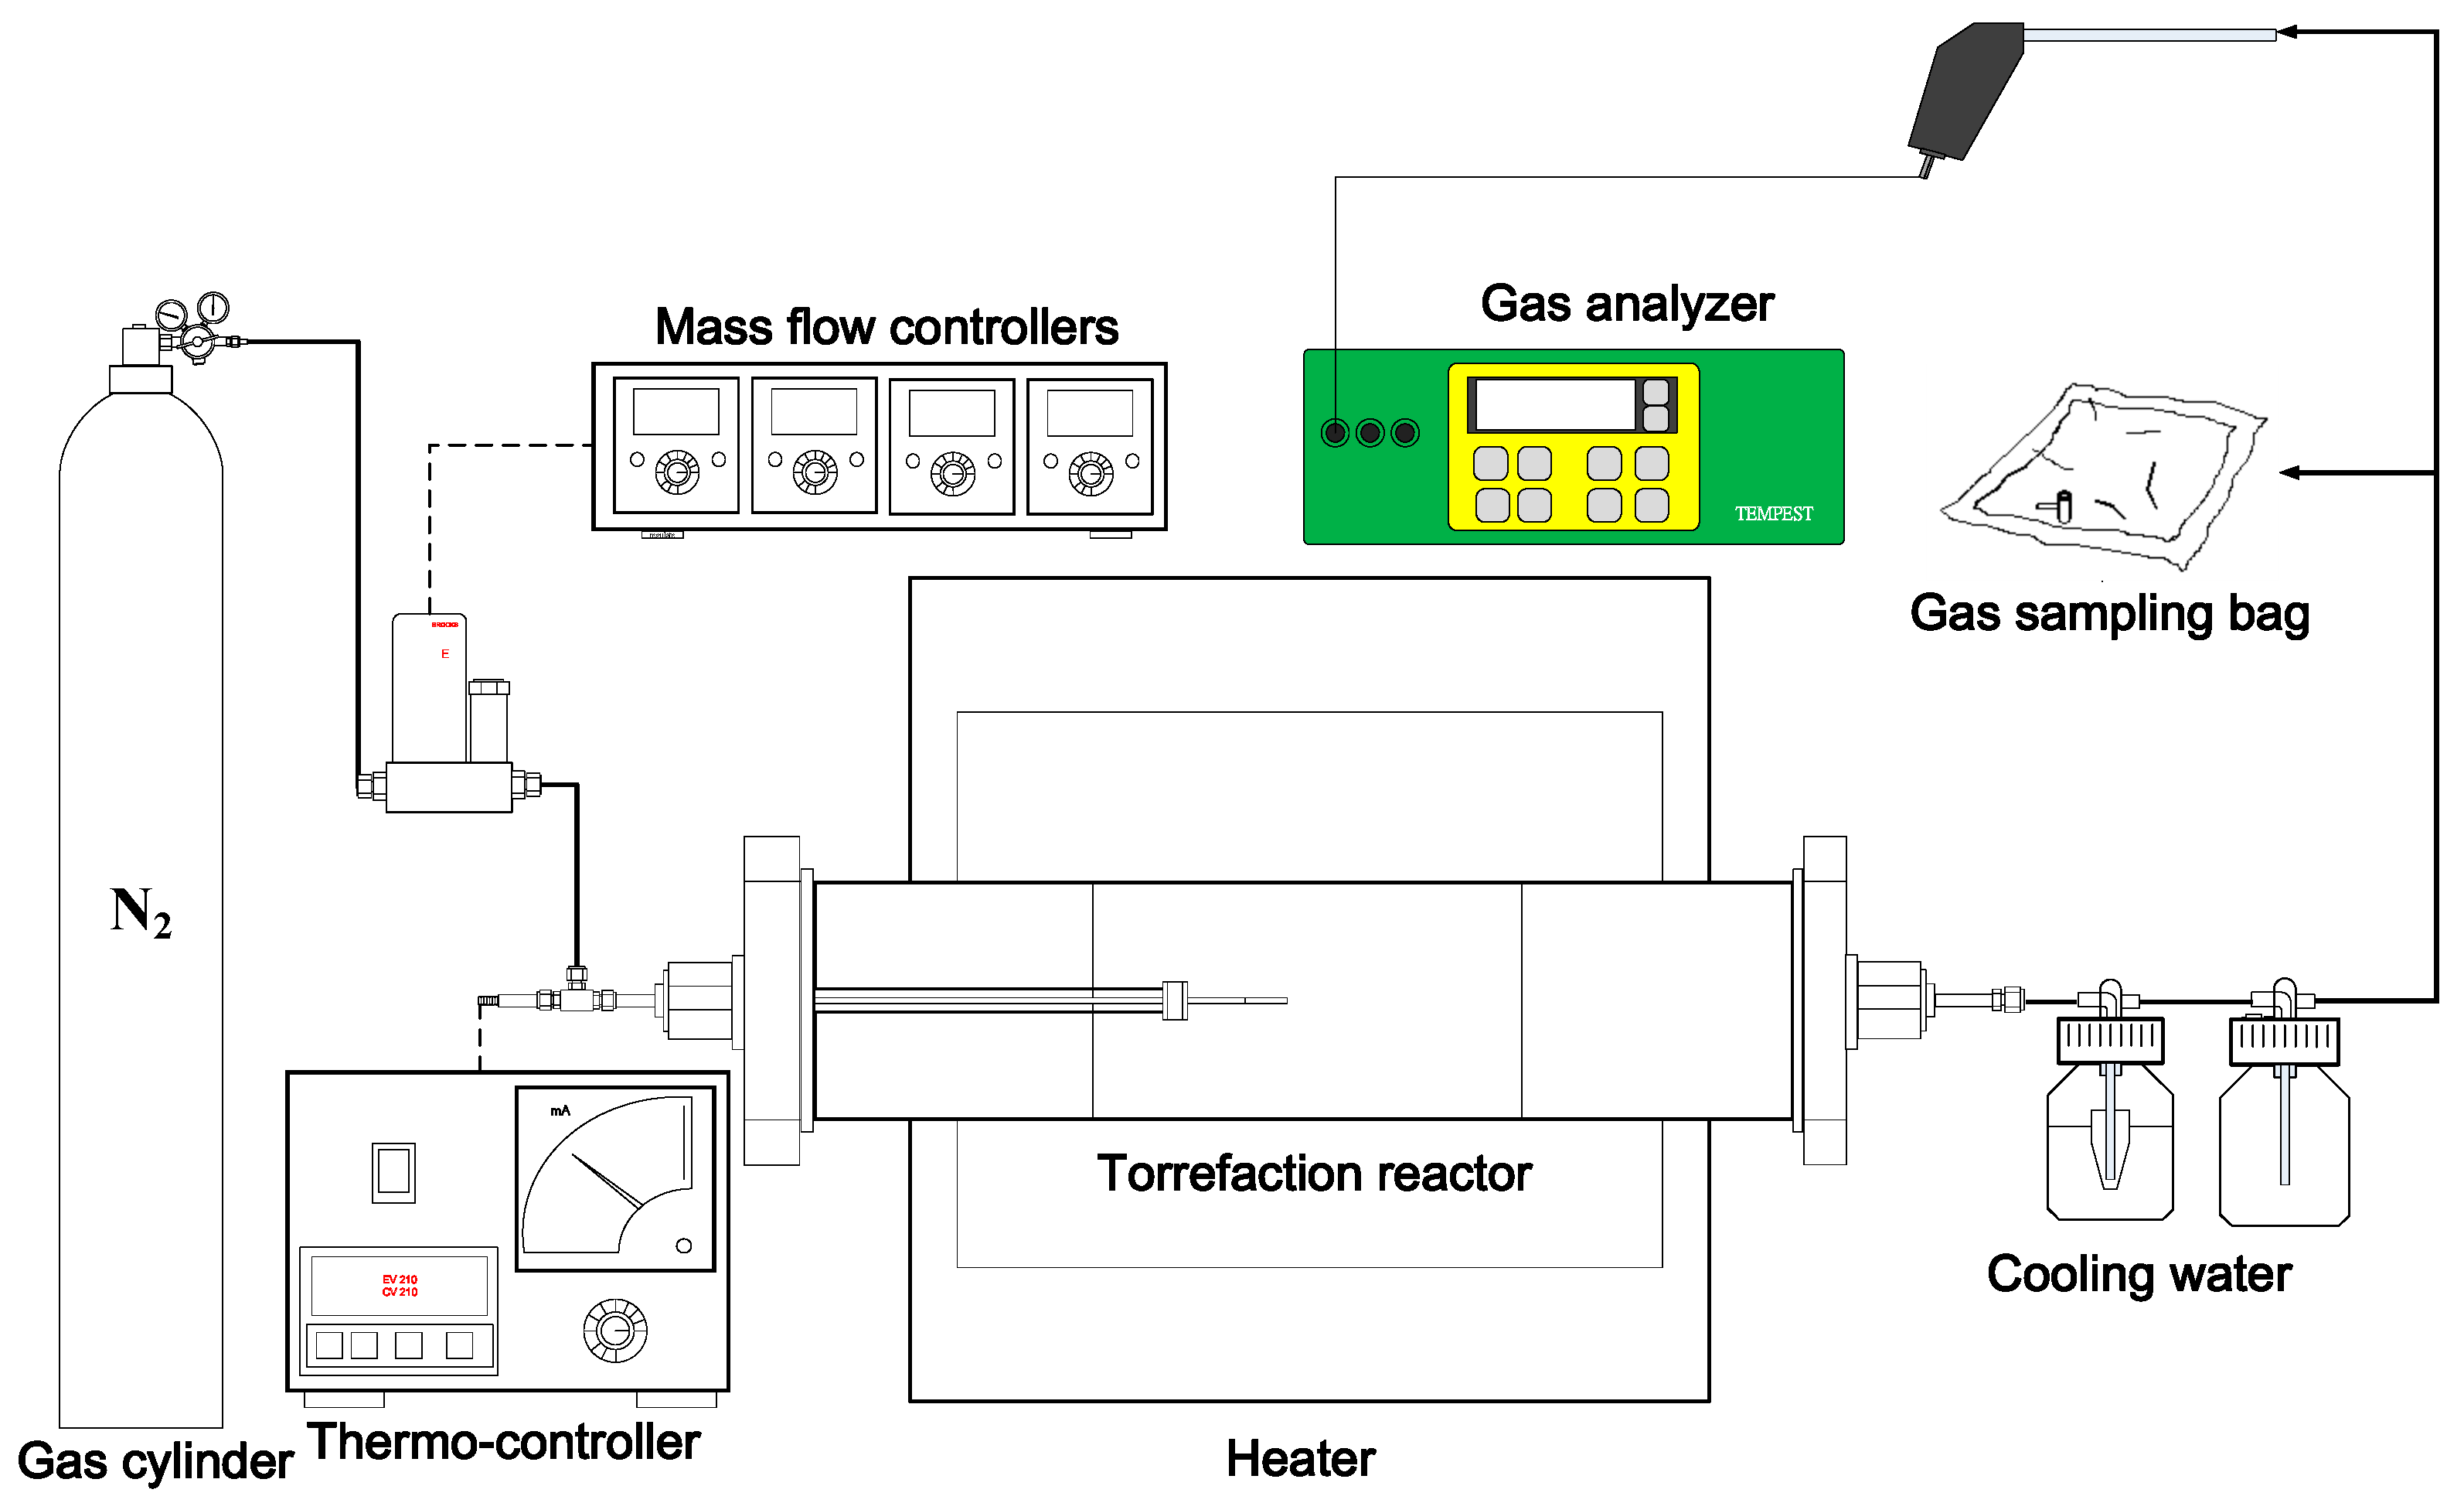
3.3. Torrefaction System
4. Conclusions
Acknowledgments
Author Contributions
Conflicts of Interest
Nomenclature
| dMR/dT | Differential temperature variation of MR (wt %/K or wt %/°C) |
| dMR/dt | Instantaneous reaction rate, =HR (dMR/dT) (wt %/min) |
| ED | Energy densification ratio (-) |
| HHD or HHVD | Dry-basis HHV (MJ/kg or kcal/kg, 1 kcal = 4.184 × 10⁻³ MJ) |
| HHDRD, HHDTD | HHD of dried raw and torrefied samples (MJ/kg or kcal/kg) |
| HHV | High heating value (MJ/kg or kcal/kg) |
| HHVWE | Wet-basis HHV of sample with equilibrium moisture (MJ/kg or kcal/kg) |
| HR | Heating rate (K/min or °C/min) |
| LHVWE | Wet-basis low heating value of sample with equilibrium moisture (MJ/kg or kcal/kg) |
| MA, MAD | Ash contents of sample by proximate analyses in wet and dry bases (wt %) |
| MC, MCD | Combustibles contents of sample by proximate analyses in wet and dry bases (wt %) |
| MFC, MFCD | Fixed carbon contents of sample by proximate analyses wet and dry bases (wt %) |
| MR | Residual mass fraction (wt %) |
| MVM, MVMD | Volatile matters contents of sample by proximate analysis wet and dry bases (wt %) |
| MW | Moisture content of sample as received by proximate analysis (wt %) |
| MWE | Equilibrium moisture content of sample in air by proximate analysis (wt %) |
| mRD, mTD | m of dried raw and torrefied samples(g) |
| T | Temperature (K or °C) |
| TT | Torrefaction temperature (K or °C) |
| t | Time (min) |
| tT | Time of torrefaction (min) |
| WPS-T-t (e.g., WPST1-300-20) | T and t denote temperature (°C) and time (min), respectively |
| YE | Energy yield (-) |
| YM | Mass yield (-) |
Abbreviations
| DTG | Differential thermogravimetric |
| NA | Not applicable |
| ND | Not detected |
| TGA | Thermal gravimetric analysis |
| TPC | Taiwan Power Co. |
| WPS | Wood waste with pulp sludge |
| WPST | Torrefied WPS |
References
- Intergovernmental Panel on Climate Change (IPCC). Fifth Assessment Report: Synthesis Report; IPCC: Geneva, Switzerland, 2014. [Google Scholar]
- Betts, R.A.; Jones, C.D.; Knight, J.R.; Keeling, R.F.; Kennedy, J.J. El Niño and a record CO2 rise. Nat. Clim. Chang. 2017, 6, 806–810. [Google Scholar] [CrossRef]
- Boyle, G. Renewable Energy-Power for a Sustainable Future, 2nd ed.; Oxford University Express: Glasgow, UK, 2004. [Google Scholar]
- International Energy Agency (IEA). World Energy Outlook 2016; IEA: Paris, France, 2016. [Google Scholar]
- Huang, Y.F.; Chiueh, P.T.; Lo, S.L. A review on microwave pyrolysis of lignocellulosic biomass. Sustain. Environ. Res. 2016, 26, 103–109. [Google Scholar] [CrossRef]
- Wang, Y.Y.; Chang, C.C.; Chang, C.Y.; Chen, Y.H.; Shie, J.L.; Yuan, M.H.; Chen, Y.H.; Huang, L.X.; Andrade-Tacca, C.; Manh, D.V.; et al. Thermal cracking of jatropha oil with hydrogen to produce bio-fuel oil. Energies 2016, 9, 910. [Google Scholar] [CrossRef]
- Chang, C.C.; Chen, C.P.; Yang, C.S.; Chen, Y.H.; Huang, M.; Chang, C.Y.; Shie, J.L.; Yuan, M.H.; Chen, Y.H.; Ho, C.F.; et al. Conversion of waste bamboo chopsticks to bio-oil via catalytic hydrothermal liquefaction using K2CO3. Sustain. Environ. Res. 2016, 26, 262–267. [Google Scholar] [CrossRef]
- Şensöz, S. Slow pyrolysis of wood barks from Pinus brutia Ten. and product compositions. Bioresour. Technol. 2003, 89, 307–311. [Google Scholar] [CrossRef]
- Thi, N.B.D.; Lin, C.Y.; Kumar, G. Electricity generation comparison of food waste-based bioenergy with wind and solar powers: A mini review. Sustain. Environ. Res. 2016, 26, 197–202. [Google Scholar] [CrossRef]
- Hernandez-Atonal, F.D.; Ryu, C.; Sharifi, V.N.; Swithenbank, J. Combustion of refuse-derived fuel in a fluidised bed. Chem. Eng. Sci. 2007, 62, 627–635. [Google Scholar] [CrossRef]
- Zhao, L.; Giannis, A.; Lam, W.Y.; Lin, S.X.; Yin, K.; Yuan, G.A.; Wang, J.Y. Characterization of Singapore RDF resources and analysis of their heating value. Sustain. Environ. Res. 2016, 26, 51–54. [Google Scholar] [CrossRef]
- Robinson, T.; Bronson, B.; Gogolek, P.; Mehrani, P. Sample preparation for thermo-gravimetric determination and thermo-gravimetric characterization of refuse derived fuel. Waste Manag. 2016, 48, 265–274. [Google Scholar] [CrossRef] [PubMed]
- Sadaka, S.; Negi, S. Improvements of biomass physical and thermochemical characteristics via torrefaction process. Environ. Prog. Sustain. Energy 2009, 28, 427–434. [Google Scholar] [CrossRef]
- Tumuluru, J.S.; Sokhansanj, S.; Hess, J.R.; Wright, C.T.; Boardman, R.D. A review on biomass torrefaction process and product properties for energy applications. Ind. Biotechnol. 2011, 7, 384–401. [Google Scholar] [CrossRef]
- Van der Stelt, M.; Gerhauser, H.; Kiel, J.; Ptasinski, K. Biomass upgrading by torrefaction for the production of biofuels: A review. Biomass Bioenergy 2011, 35, 3748–3762. [Google Scholar] [CrossRef]
- Azhakesan, M.; Bartle, K.D.; Murdoch, P.L.; Taylor, J.M.; Williams, A. Rapid pyrolysis as a method of characterizing coals for combustion. Fuel 1990, 70, 322–328. [Google Scholar] [CrossRef]
- Balat, M.; Balat, M.; Kırtay, E.; Balat, H. Main routes for the thermo-conversion of biomass into fuels and chemicals. Part 1: Pyrolysis systems. Energy Convers. Manag. 2009, 50, 3147–3157. [Google Scholar] [CrossRef]
- Sáiz-Jiménez, C.; De Leeuw, J. Lignin pyrolysis products: Their structures and their significance as biomarkers. Org. Geochem. 1986, 10, 869–876. [Google Scholar] [CrossRef]
- Wanzl, W. Chemical reactions in thermal decomposition of coal. Fuel Process. Technol. 1988, 20, 317–336. [Google Scholar] [CrossRef]
- Bergman, P.C.A.; Boersma, A.R.; Zwart, R.W.R.; Kiel, J.H.A. Torrefaction for Biomass Co-Firing in Existing Coal-Fired Power Stations; ECN-C-05-013, BIOCOAL; Energy Research Centre of The Netherlands: Utrecht, The Netherlands, 2005. [Google Scholar]
- Chen, W.H.; Wu, J.S. An evaluation on rice husks and pulverized coal blends using a drop tube furnace and a thermogravimetric analyzer for application to a blast furnace. Energy 2009, 34, 1458–1466. [Google Scholar] [CrossRef]
- Deng, J.; Wang, G.J.; Kuang, J.H.; Zhang, Y.L.; Luo, Y.H. Pretreatment of agricultural residues for co-gasification via torrefaction. J. Anal. Appl. Pyrolysis 2009, 86, 331–337. [Google Scholar] [CrossRef]
- Mohan, D.; Pittman, C.U.; Steele, P.H. Pyrolysis of wood/biomass for bio-oil: A critical review. Energy Fuel 2006, 20, 848–889. [Google Scholar] [CrossRef]
- Bourgois, J.; Guyonnet, R. Characterization and analysis of torrefied wood. Wood Sci. Technol. 1988, 22, 143–155. [Google Scholar] [CrossRef]
- Antal, M.J.; Grønli, M. The art, science, and technology of charcoal production. Ind. Eng. Chem. Res. 2003, 42, 1619–1640. [Google Scholar] [CrossRef]
- Arias, B.; Pevida, C.; Fermoso, J.; Plaza, M.G.; Rubiera, F.; Pis, J.J. Influence of torrefaction on the grindability and reactivity of woody biomass. Fuel Process. Technol. 2008, 89, 169–175. [Google Scholar] [CrossRef]
- Chen, W.H.; Hsu, H.C.; Lu, K.M.; Lee, W.J.; Lin, T.C. Thermal pretreatment of wood (Lauan) block by torrefaction and its influence on the properties of the biomass. Energy 2011, 36, 3012–3021. [Google Scholar] [CrossRef]
- Bridgeman, T.; Jones, J.; Williams, A.; Waldron, D. An investigation of the grindability of two torrefied energy crops. Fuel 2010, 89, 3911–3918. [Google Scholar] [CrossRef]
- Phanphanich, M.; Mani, S. Impact of torrefaction on the grindability and fuel characteristics of forest biomass. Bioresour. Technol. 2011, 102, 1246–1253. [Google Scholar] [CrossRef] [PubMed]
- Williams, A.; Pourkashanian, M.; Jones, J.M. Combustion of pulverised coal and biomass. Prog. Energy Combust. Sci. 2001, 27, 587–610. [Google Scholar] [CrossRef]
- Baxter, L. Biomass-coal co-combustion: Opportunity for affordable renewable energy. Fuel 2005, 84, 1295–1302. [Google Scholar] [CrossRef]
- Pentananunt, R.; Rahman, A.N.M.M.; Bhattacharya, S.C. Upgrading of biomass by means of torrefaction. Energy 1990, 15, 1175–1179. [Google Scholar] [CrossRef]
- Pimchuai, A.; Dutta, A.; Basu, P. Torrefaction of agriculture residue to enhance combustible properties. Energy Fuel 2010, 24, 4638–4645. [Google Scholar] [CrossRef]
- Sondreal, E.A.; Benson, S.A.; Hurley, J.P.; Mann, M.D.; Pavlish, J.H.; Swanson, M.L.; Weber, G.F.; Zygarlicke, C.J. Review of advances in combustion technology and biomass cofiring. Fuel Process. Technol. 2001, 71, 7–38. [Google Scholar] [CrossRef]
- Yang, T.Y. Torrefaction of Rice Straw and Biofiber. Master's Thesis, Graduate Institute of Environment Engineering, National Taiwan University, Taipei, Taiwan, 2012. (In Chinese). [Google Scholar]
- Yang, H.; Yan, R.; Chen, H.; Lee, D.H.; Zheng, C. Characteristics of hemicellulose, cellulose and lignin pyrolysis. Fuel 2007, 86, 1781–1788. [Google Scholar] [CrossRef]
- Coimbra, R.N.; Paniagua, S.; Escapa, C.; Calvo, L.F.; Otero, M. Combustion of primary and secondary pulp mill sludge and their respective blends with coal: A thermogravimetric assessment. Renew. Energy 2015, 83, 1050–1058. [Google Scholar] [CrossRef]
- McKendry, P. Energy production from biomass (Part 1): Overview of biomass. Bioresour. Technol. 2002, 81, 37–46. [Google Scholar] [CrossRef]
- Taiwan Power Co. (TPC). Coal Standard of Taiwan Power Co.; TPC: Taipei, Taiwan, 2010. (In Chinese) [Google Scholar]
- Kurose, R.; Ikeda, M.; Makino, H.; Kimoto, M.; Miyazaki, T. Pulverized coal combustion characteristics of high-fuel-ratio coals. Fuel 2004, 83, 1777–1785. [Google Scholar] [CrossRef]


| Properties or Compositions | WPS1 | WPST1-300-20 | WPS2 | WPST2-320-20 | Rice Straw [35] | Torrefied Rice Straw-280-50 [35] |
|---|---|---|---|---|---|---|
| Heating Value (MJ/kg) a | ||||||
| HHD | 18.30 ± 0.07 | 27.49 | 15.72 ± 0.01 | 19.74 | 16.64 | 21.63 |
| Proximate Analyses (wt %) a | ||||||
| Combustibles, MCD | 95.19 ± 0.05 | 91.41 d | 80.30 ± 3.09 | 74.61 ± 2.56 | 88.7 | 78.8 |
| Fixed carbons, MFCD | 20.79 ± 0.09 | 42.74 | 18.75 ± 2.16 | 20.86 ± 2.46 | 16.7 | 45.5 |
| Volatile matter, MVMD | 74.41 ± 0.12 | 48.67 | 61.55 ± 1.27 | 53.75 ± 0.10 | 72.0 | 33.4 |
| Ash, MAD | 4.81 ± 0.09 | 8.59 e | 19.70 ± 3.04 | 25.39 ± 2.56 | 11.3 | 21.2 |
| Equilibrium Moisture (wt %) b | ||||||
| MWE | 12.75 ± 0.13 | 5.91 ± 0.01 | 3.77 ± 0.49 | 2.15 ± 0.01 | 9.6 | 2.8 |
| Ultimate Analyses (wt %) c | ||||||
| C | 49.07 ± 0.05 | 54.35 ± 0.87 | 44.53 ± 0.33 | 50.46 ± 1.27 | 38.96 | 50.89 |
| H | 6.10 ± 0.00 | 5.32 ± 0.14 | 5.82 ± 0.09 | 5.12 ± 0.24 | 6.05 | 4.40 |
| O | 43.56 ± 3.29 | 39.00 ± 0.33 | 45.23 ± 0.05 | 40.28 ± 0.32 | 43.33 | 23.74 |
| N | 1.06 ± 0.06 | 1.16 ± 0.05 | 2.44 ± 0.021 | 2.74 ± 0.035 | 0.55 | 0.89 |
| S | 0.18 ± 0.01 | 0.17 ± 0.09 | 1.84 ± 0.75 | 1.30 ± 0.40 | 0.79 | 0.15 |
| Cl | 0.02 ± 1.12 | 0.00 ± 4.06 | 0.14 ± 2.66 | 0.11 ± 1.12 | 0.12 | 0.31 |
| Atomic H/C | 1.49 | 1.18 | 1.57 | 1.22 | 1.86 | 1.04 |
| Atomic O/C | 0.67 | 0.54 | 0.76 | 0.60 | 0.83 | 0.35 |
| Sample | HHD (MJ/kg) | HHVWE (MJ/kg) | LHVWE (MJ/kg) |
|---|---|---|---|
| WPS1 | 18.30 ± 0.07 | 15.97 | 14.60 |
| WPST1-260-20 | 19.99 | 18.81 | - |
| WPST1-260-40 | 21.79 | 20.50 | - |
| WPST1-260-60 | 23.20 | 21.83 | - |
| WPST1-280-20 | 23.05 | 21.69 | - |
| WPST1-280-40 | 22.96±0.07 | 21.67 | - |
| WPST1-280-60 | 25.19 | 23.75 | - |
| WPST1-300-20 (optimal) | 27.49 | 25.87 | - |
| WPST1-300-40 | 24.98 | 23.51 | - |
| WPST1-300-60 | 24.58 | 23.13 | - |
| WPS2 | 15.72 ± 0.01 | 15.13 | 14.19 |
| WPST2-280-20 | 17.03 ± 0.03 | 16.87 | - |
| WPST2-280-40 | 17.30 ± 0.12 | 16.82 | - |
| WPST2-280-60 | 17.48 ± 0.10 | 17.00 | - |
| WPST2-300-20 | 17.52 | 17.14 | - |
| WPST2-300-40 | 17.55 ± 0.01 | 17/17 | - |
| WPST2-300-60 | 17.89 | 17.50 | - |
| WPST2-320-20 (optimal) | 19.74 | 19.31 | 18.57 |
| WPST2-320-40 | 19.46 | 19.05 | - |
| WPST2-320-60 | 18.10 | 17.71 | - |
| tT (min) | 533 K | 553 K | 573 K | 593 K | ||||
|---|---|---|---|---|---|---|---|---|
| WPST1-260 | WPST2-260 | WPST1-280 | WPST2-280 | WPST1-300 | WPST2-300 | WPST1-320 | WPST2-320 | |
| 20 | 1.10 | - | 1.26 | 1.10 | 1.50 | 1.03 | - | 1.26 |
| 40 | 1.19 | - | 1.26 | 1.09 | 1.36 | 1.12 | - | 1.24 |
| 60 | 1.27 | - | 1.38 | 1.11 | 1.34 | 1.14 | - | 1.15 |
| Process | TGA | Simulated Torrefaction |
|---|---|---|
| 1. Drying from 303 to 378 K | ||
| Heating rate, HR (K/min) | 30 | 30 |
| 2. Drying at 378 K | ||
| Constant drying time (min) | 20 | 20 |
| 3. Pyrolysis from 378 to 1073 K | ||
| HR (K/min) | 10 | NA |
| 4. Pyrolysis from 378 K to TT | ||
| Torrefaction temperature, TT (K) | NA | 533, 543, 553, 563, 573, 583, 593 |
| HR (K/min) | NA | 10 |
| Time of torrefaction, tT (min) | NA | 80 |
© 2017 by the authors. Licensee MDPI, Basel, Switzerland. This article is an open access article distributed under the terms and conditions of the Creative Commons Attribution (CC BY) license (http://creativecommons.org/licenses/by/4.0/).
Share and Cite
Huang, M.; Chang, C.-C.; Yuan, M.-H.; Chang, C.-Y.; Wu, C.-H.; Shie, J.-L.; Chen, Y.-H.; Chen, Y.-H.; Ho, C.; Chang, W.-R.; et al. Production of Torrefied Solid Bio-Fuel from Pulp Industry Waste. Energies 2017, 10, 910. https://doi.org/10.3390/en10070910
Huang M, Chang C-C, Yuan M-H, Chang C-Y, Wu C-H, Shie J-L, Chen Y-H, Chen Y-H, Ho C, Chang W-R, et al. Production of Torrefied Solid Bio-Fuel from Pulp Industry Waste. Energies. 2017; 10(7):910. https://doi.org/10.3390/en10070910
Chicago/Turabian StyleHuang, Michael, Chia-Chi Chang, Min-Hao Yuan, Ching-Yuan Chang, Chao-Hsiung Wu, Je-Lueng Shie, Yen-Hau Chen, Yi-Hung Chen, Chungfang Ho, Wei-Ren Chang, and et al. 2017. "Production of Torrefied Solid Bio-Fuel from Pulp Industry Waste" Energies 10, no. 7: 910. https://doi.org/10.3390/en10070910
APA StyleHuang, M., Chang, C.-C., Yuan, M.-H., Chang, C.-Y., Wu, C.-H., Shie, J.-L., Chen, Y.-H., Chen, Y.-H., Ho, C., Chang, W.-R., Yang, T.-Y., & Lin, F.-C. (2017). Production of Torrefied Solid Bio-Fuel from Pulp Industry Waste. Energies, 10(7), 910. https://doi.org/10.3390/en10070910