1. Introduction
The main decision reached at the December 2015 United Nations 21st conference of parties (COP-21) meeting holds that the world’s countries reduce CO
2 emissions to prevent global temperature from exceeding 2 °C above pre-industrial levels. Models of population growth, energy demand, and climate change are integral components in defining how to meet the goals of such policy decisions. For example, McGlade and Ekins [
1] demonstrated that >50% of all known fossil fuel reserves need to remain unused, and Jones and Warner [
2] demonstrated that renewable energy needs to comprise >50% of all energy use by 2028 in order to achieve the <2 °C goal of COP-21. However, the integration of renewable energy into the future global energy mix has thus far been inadequate [
3].
While climate change concerns are an important motivation for the transition to a renewable energy infrastructure (e.g., wind, solar, biofuels), energy projections beyond 2050 [
2,
4,
5,
6] suggest another pressing issue: increasing energy demand and fossil fuel depletion. There is a gap in the literature that combines the pressing issues of climate change and fossil fuel depletion. There is a need to approach global-scale interactions between the natural sciences and the social sciences using a systems approach [
7]. The primary question we explore in this paper is whether or not uncertainty in fossil fuel reserve estimates and international development either negate or exacerbate the climate-based need to transition to a global renewable energy infrastructure. To investigate that question, here we examine six scenarios of global renewable energy expansion over the 21st century, including two per capita energy consumption, or PCC tracks, and three estimates of fossil fuel reserves.
In our study, we use global per capita energy consumption as a proxy for development/industrialisation. This proxy is supported by Lambert et al. [
8], who determined that societal quality of life indices greatly improve in countries that consume 100–150 GJ/person. The first track in our study (projected consumption growth to 106 GJ/person by 2100) was tested in Jones and Warner [
2]. That study used the average annual energy consumption [
9] and population growth [
10] trends from 2000–2014 to determine the rate at which PCC might increase with the UN population projections from Gerland et al. [
10], finding that by 2100 the projected 11.2 billion global population [
10] would require 994 EJ of non-hydropower renewable energy sources (RES), equivalent to the combined energy production of 12.6 million 5 MW wind turbines, 600,000 square kilometres of photovoltaic solar panels and 1.9 million square kilometres of open-pond algae biofuels production. This track forms the upper bound of per capita energy consumption in our study.
The second track assumes that there will be no growth in per capita energy consumption and that the global PCC will only change as a function of population growth. Though some individual societies, nations, and regions of the world exhibit declining PCC, the world average per capita has more than quintupled since 1900 and more than doubled since 1950 [
2]. Wolfram et al. [
11] argue that the largest growth in energy consumption will come from the least developed nations. As much as 20% of the world’s current population live with no access to modern energy [
12]. The vast majority of the 2100 population projected by Gerland et al. [
10] is expected to occur within the nations currently designated as least developed (i.e., 55% of the world population is projected in Sub-Saharan Africa and South Asia vs. 37% in 2017 [
13]). Warner and Jones [
4] calculated that, based on a constant PCC within each of the nine world regions, global PCC would decline from 75 GJ/person in 2014 to 58 GJ/person by 2100 as the population in the lower consuming regions of the world is projected to grow to a larger per cent of total global population. This track is similar to the 2000 Watt (63 GJ/person) society evaluated by Kesselring and Winter [
14] and subsequently used in several studies [
15,
16,
17,
18,
19]. This track differs from previous studies in that the lowered global average consumption in our track is achieved without changes in consumption, only by (projected) population growth in low-consuming countries. This track forms the lower bound of per capita energy consumption in our study.
In addition to the two per capita energy consumption tracks, this study examines three models of non-renewable energy sources (NRES) based on published reserve estimates. We have previously used the British Petroleum (BP) Statistical Review of World Energy 2015 [
9] because the dataset is widely available, widely cited, and contains nearly 50 years of detailed data in one source. In addition to the BP [
9] proven NRES reserves, the International Energy Agency (IEA) published Resources to Reserves in 2013 [
20]. The report includes both proven and remaining recoverable resource estimates for oil and gas (both conventional and unconventional). The IEA proven reserve estimates are in close agreement with BP [
9]. We will use the remaining recoverable resource estimates to create the “IEA model”. McGlade and Ekins [
1] provide an estimate of the remaining fossil fuel reserves that must remain in the ground in order to prevent the average global temperature from exceeding 2 °C above the pre-industrial level. Though unlikely, we use these low-end fossil fuel reserve estimates to create the “2C model” to estimate the RES infrastructure timeline necessary to prevent potential negative effects of global climate change.
Our six scenarios represent a theoretical range of global energy production and consumption throughout the 21st century. The PCC tracks take into account both so-called “Malthusian” and ‘”cornucopian” visions for the future of development around the world [
21]. The energy models are bounded by the highest end potential NRES potential and the lower end proven reserves. The 2C energy model serves the role of benchmark for our research question: whether or not uncertainty in fossil fuel reserve estimates and international development either negate or exacerbate the climate-based need to transition to a global renewable energy infrastructure. While it is certain that the RES requirements of the 2C model will be greater than either the Global or the IEA model, the magnitude of that difference will highlight the climate-independent need for 21st century renewable energy.
2. Results
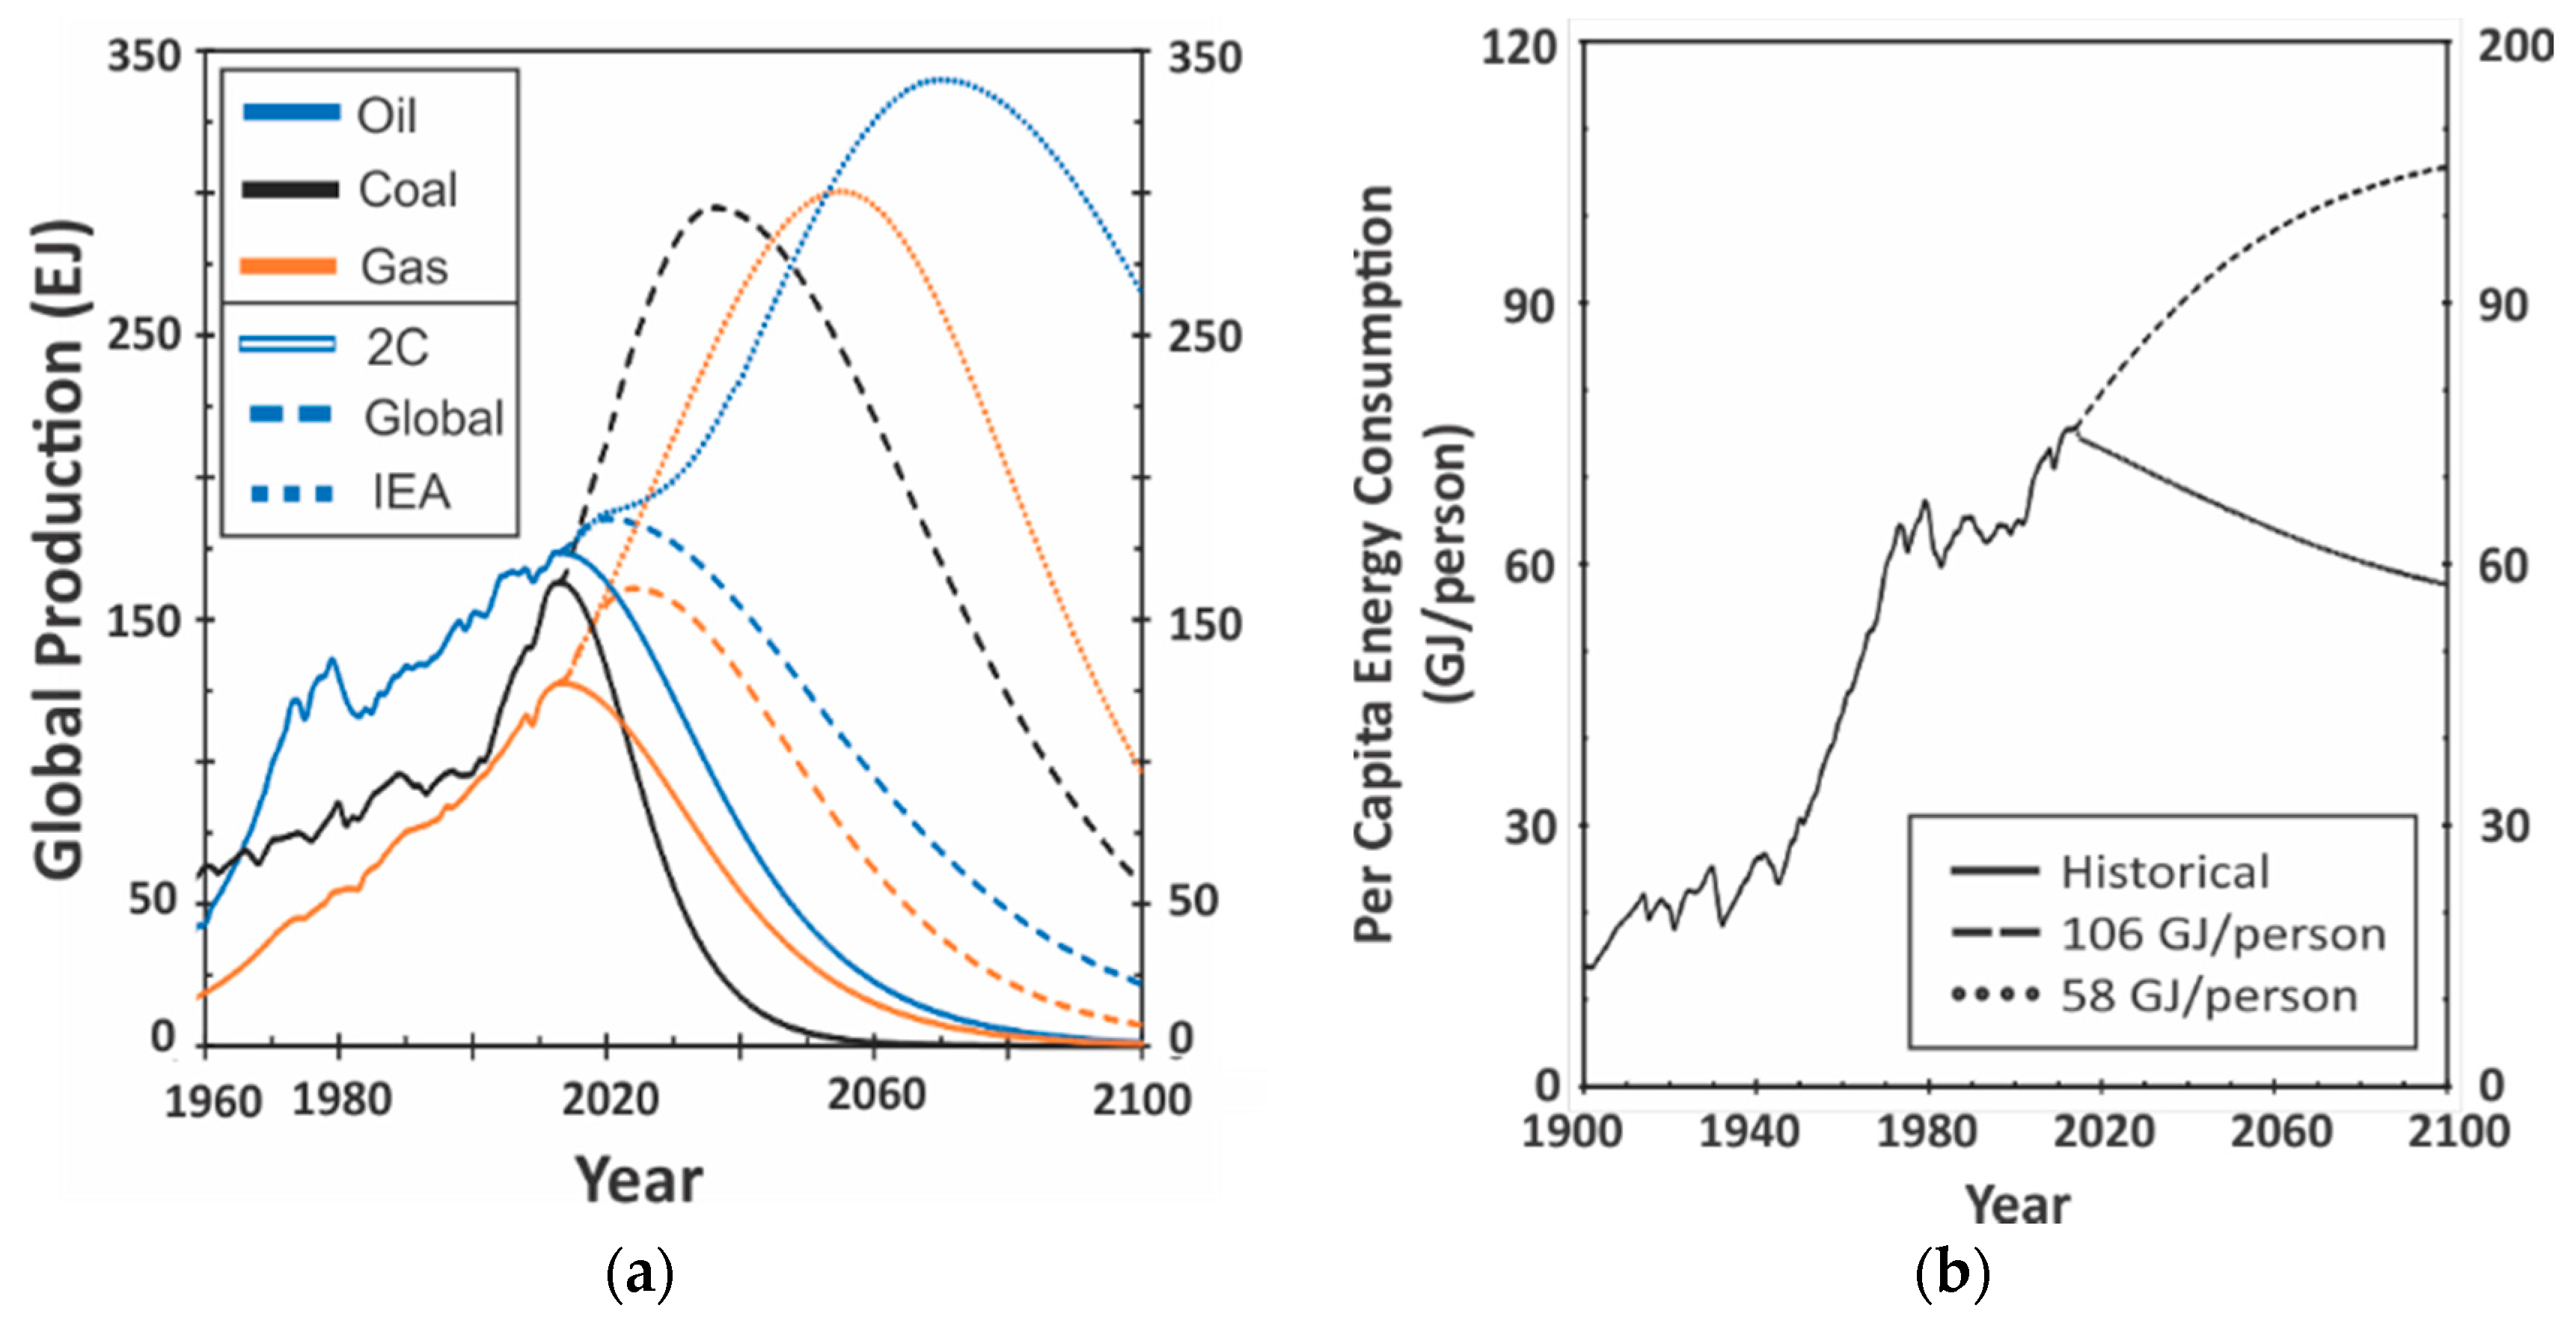
The six scenarios in the model are resultant of the energy models (
Figure 1a) and the PCC tracks (
Figure 1b). The total NRES usable reserves range from 12,700 exajoules (EJ, 10
18 Joules) in the 2C model, to 37,000 EJ in the Global model, and to 74,000 EJ in the IEA model. All fossil fuel energy production peaks in 2014 in the 2C model. Oil, natural gas, and coal peak in 2020, 2024, and 2047 respectively in the Global model (106 GJ/person). Including the additional reserves, the IEA model delays those peaks until 2072, 2055, and 2047 (coal is unchanged from the Global model). In the IEA model, under the median population projection and accompanying 106 GJ/person PCC by 2100, significant expansion of RES production (greater than 20 EJ) is not needed until 2041. This need presents itself in the year 2027 in the Global model and immediately in the 2C model. The doubling of oil and natural gas reserves from the Global to the IEA model results in only fourteen years of significant renewable expansion delay.
Table 1 lists the differences between the models in terms of actual RES infrastructure (using the RES breakdown as presented in Jones and Warner [
2]). The 2C model RES demand is 9% higher than the Global model. The IEA model RES demand is 32% lower than the Global model demand. Despite the small difference in the year 2100, the 2C model requires approximately 2/3 of the 2100 RES infrastructure to be in place by the year 2050, whereas only 1/3 of the 2100 RES infrastructure is required by 2050 in the Global model. The 2C, global, and IEA models require 96, 89, and 59 times the current number of installed 5 MW equivalent wind turbines (~142,000 [
9]) in 2100, respectively. The same figures are 152, 140 and 93 times the current area in 2100 for solar panels (~4300 km
2 [
9]). The oil and natural gas reserves included in the IEA model each are roughly three times larger than those reported in the Global model. Tripling the coal reserves from the Global model would result in roughly the energy equivalent of RES demanded throughout the IEA model. Replacing the RES demand in the IEA model with coal would be equivalent to 663 gigatonnes of hard coal at the cost of emitting 1800 additional gigatonnes of carbon dioxide equivalent (GtCO
2) by 2100 in the 106 GJ/person PCC track and 38 tonnes of hard coal and 100 GtCO
2 by 2100 in the 58 GJ/person PCC track. Replacing RES production in the 106 GJ/person track with coal would drive global cumulative emissions to nearly 6500 GtCO
2 by 2100. This emissions scenario sets the world on track for 3.5 °C warming by 2100 [
22].
Table 2 is comprised of the year 2100 results of each of the six scenarios run independently. The independent analysis accounts for a shifting of NRES energy production from the base models as depicted in
Figure 1a to a demand-based projection. These analyses result in slightly different peak NRES plus hydropower dates (
Table 3). The 2C model does not require any adjustment from the base model in order to account for the change in per capita energy demand.
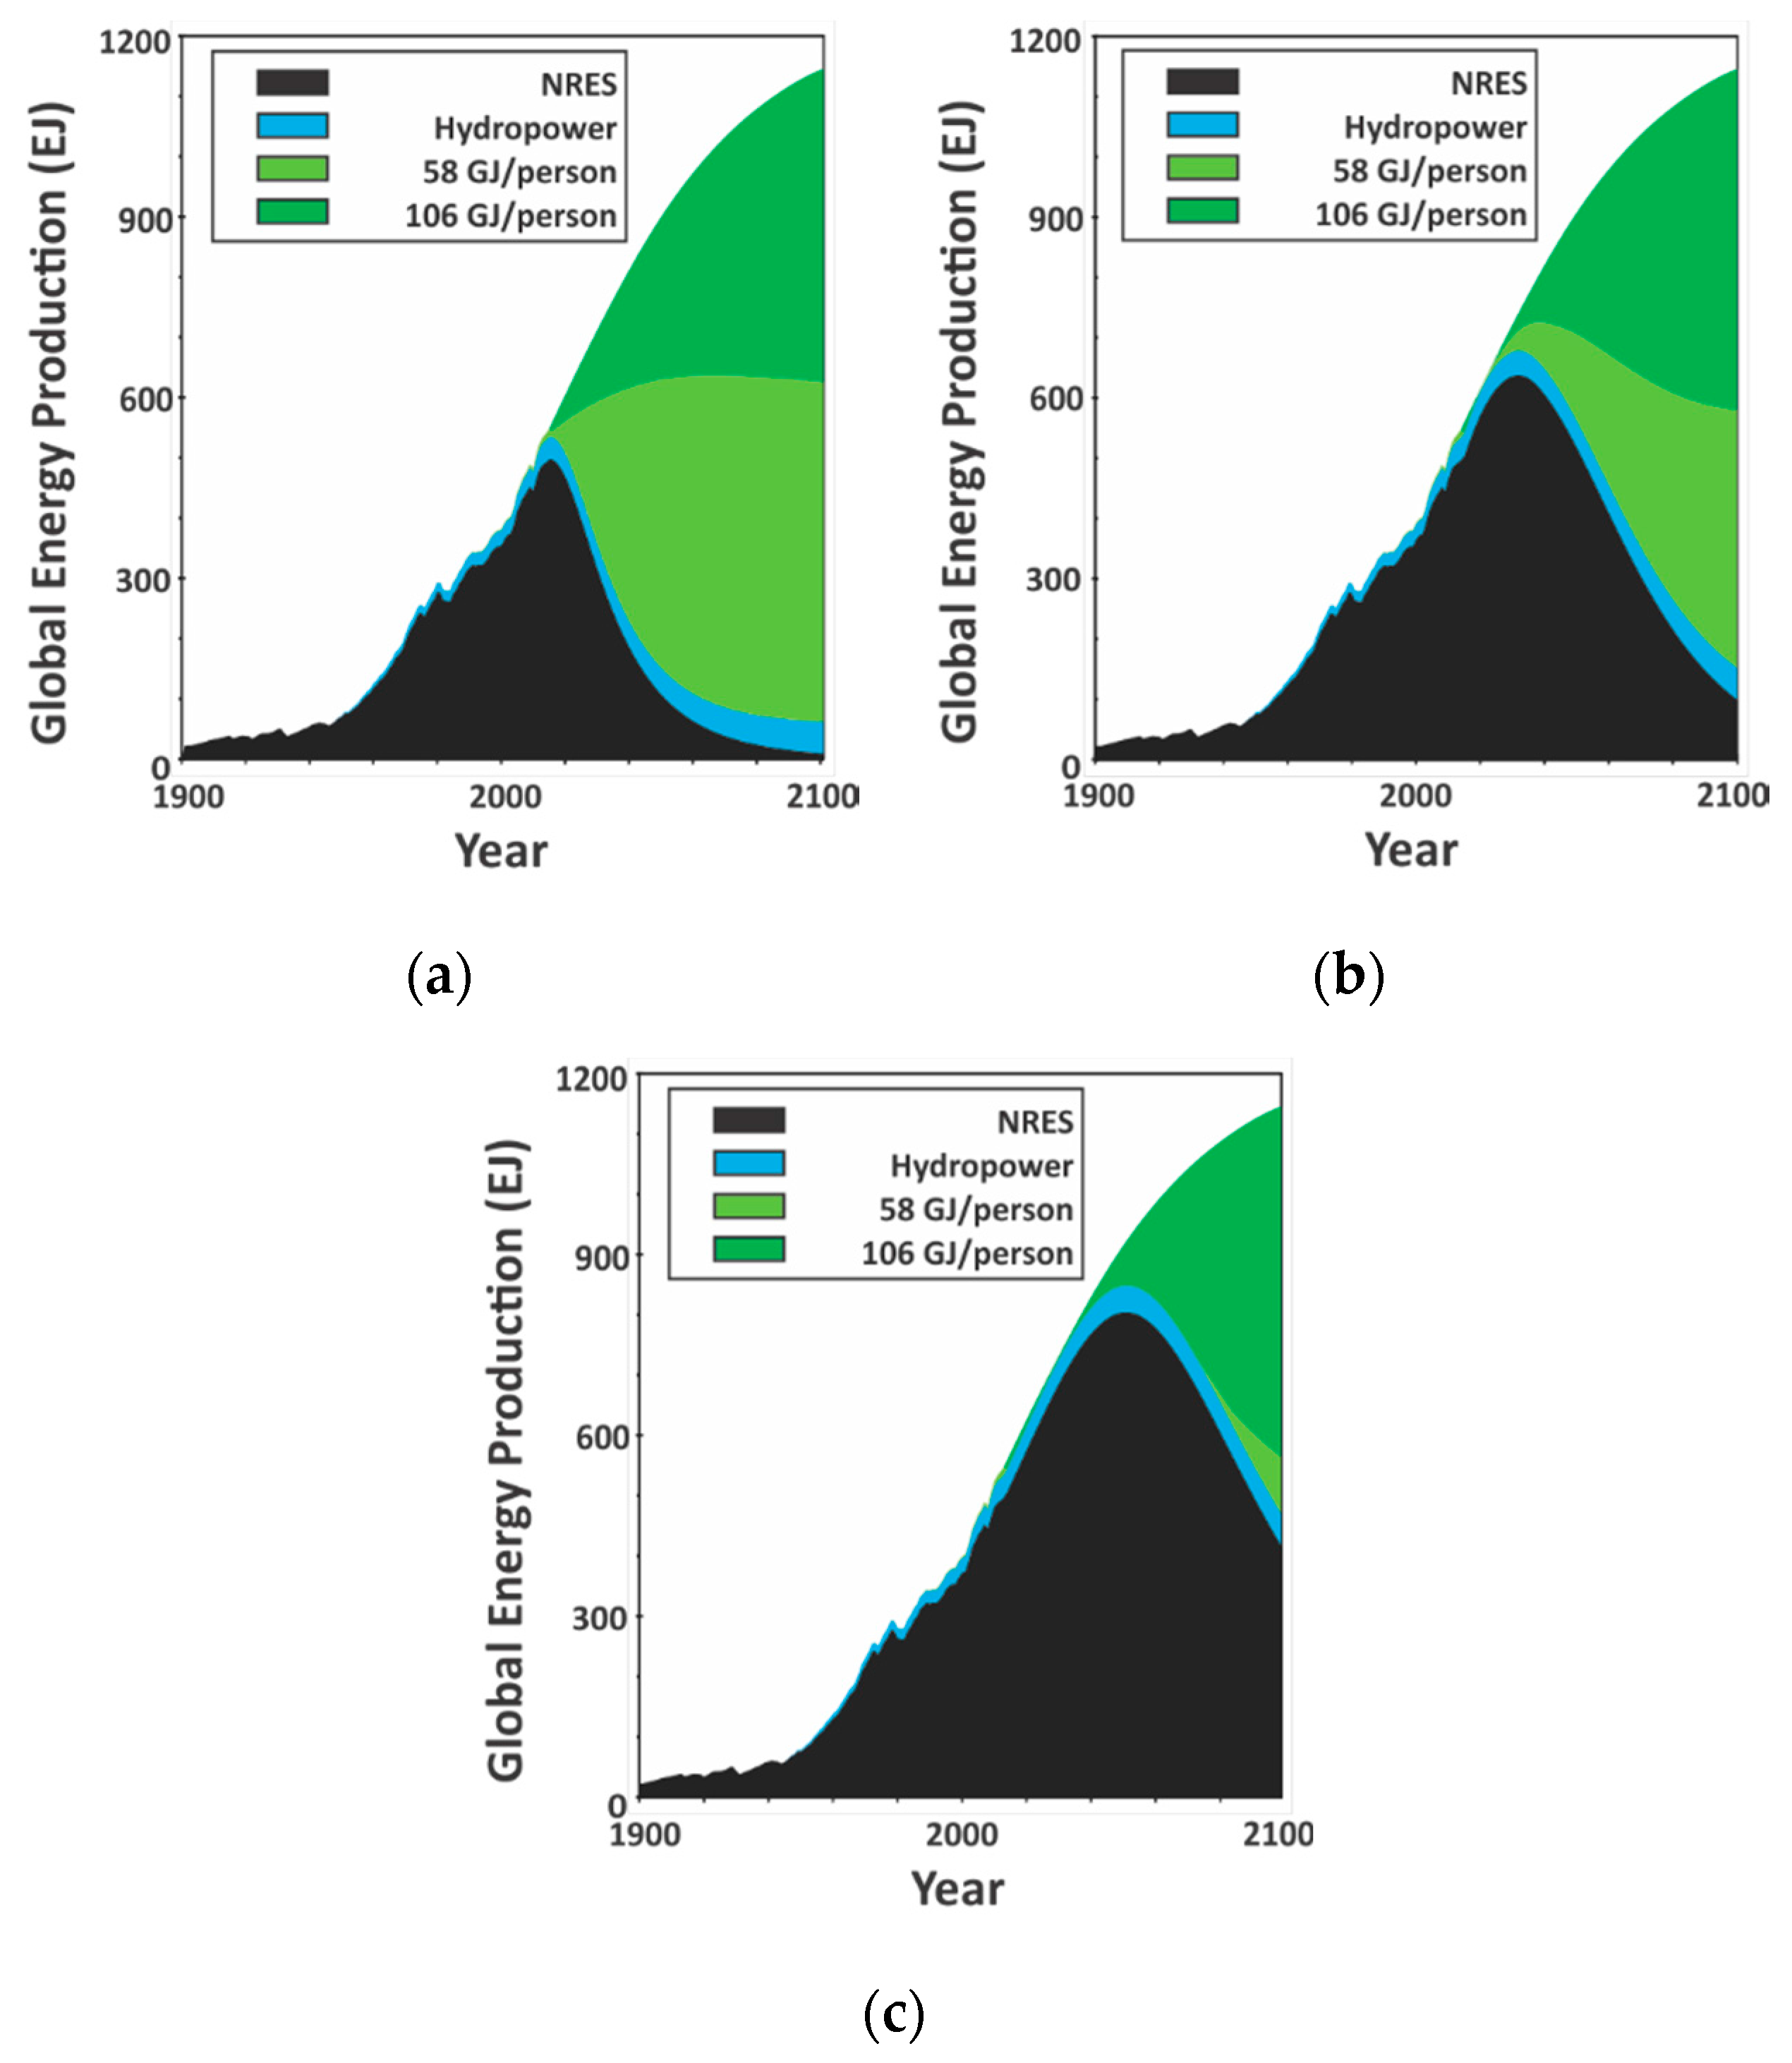
Figure 2 depicts the modelled global energy mix from 1900 to 2100. Though the NRES shapes are slightly different for each PCC track in order to prevent energy oversupply (see Materials and Methods in
Section 4), the 106 GJ/person growth track results are presented. Each of the three reserve models requires the same amount of energy within each track, as demand is not dependent on reserves or production. The growth of RES in the energy mix changes significantly based on both reserve model and PCC track. The 2014 global production of RES is ahead of schedule in the 58 GJ/person track in both the Global (
Figure 2a) and the IEA models (
Figure 2b). RES growth begins immediately in the 2C energy production model in both PCC tracks (
Figure 2c) as well as the 106 GJ/person track of both the Global and the IEA model.
3. Discussion
First and foremost, the results indicate that the doubling of fossil fuel reserves from the Global to the IEA model does not have as drastic an impact on the RES transition timeline as one might assume. Accounting for additional possible oil and natural gas reserves allows for a more optimistic estimation of 21st century energy production; however, the issues of population growth and energy scarcity are only delayed in the most optimistic scenarios, not solved. Throughout all three energy production scenarios, per capita energy consumption has more of an impact on total RES demand in 2100 than reserve estimates. The Global model and the 2C model both project the peak of oil and natural gas production before the year 2030, yet world population is projected to increase 18% in that time. It is important to note that though resources (included for oil and gas in the IEA model) have been assumed to be exploitable, questions surrounding energy return on investment [
26] may have a significant impact on the total recoverability of additional reserves. More likely, optimistic resource (rather than reserve) estimates are significantly overestimated [
27]. In any case, aggressive expansion of RES is not projected to be necessary before 2030; that said, aggressive RES expansion will be necessary by the end of the century in each scenario.
3.1. Consumption Tracks
Per capita energy consumption is the flow rate of energy from the supply model to the population projections. Even in the absence of a PCC increase, population growth is a serious strain on any global energy infrastructure, much less one in transition to RES. In a world of eleven billion people, a change of ±1 gigajoules (GJ)/person results in ±11 EJ of energy demand. The global total production of non-hydropower RES was 13.3 EJ in 2014. The difference between a global PCC of 106 GJ/person and 58 GJ/person in 2100 is 520 EJ of total global energy production. The total global energy production in 2014 was 547.6 EJ.
In the developed world, PCC is well above the global average. While environmental concerns limit the extent to which developed economies consume energy, economic development and increasing the wellbeing of the citizenry determines the energy consumption of underdeveloped economies [
15]. Initiatives such as the World Bank’s Sustainable Energy for All (SE4ALL) seek to provide universal access to modern electricity and cooking fuels by the year 2030 (World Bank, 2013). As such, we do not anticipate the global PCC declining at all, much less declining to 58 GJ/person by 2100.
As an economy grows, energy consumption grows as well [
28]. The causality of this correlation is the subject of no small scholarly debate (see [
29,
30,
31,
32,
33]). For a more detailed regional/national consideration of PCC and economic development see [
4,
8,
34]. Regardless of causality, the correlation suggests that PCC will continue to grow. Moriarty and Honnery [
24] projected that if everyone in the world consumed at the 2008 OECD average PCC, global energy production would need to be three times higher than the 2013 total. Differing trends in per capita energy consumption may have enabling or limiting effects on RES development. Varying the amount of energy available to the average global citizen has a drastic effect on not only the quality of one’s life, but on the RES stress of the world energy supply.
3.2. Reserve Estimates
Usable fossil fuels are referred to as resources. Recoverable resources are classified as one of three types of reserves: (1) Proven reserves are those that are confirmed to exist and have a 90% chance of being exploited (abbreviated as 1P); (2) probable reserves are those that have at least a 50% likelihood of production (abbreviated as 2P): (3) possible reserves are the remainder of the resource estimate that may or may not exist (abbreviated as 3P). These reserves are assigned a 10% chance of being exploited. The reserves used in the Global model are based on proven reserves [
9]. The IEA model is based on proven, probable, and possible reserves [
20].
Commonly, energy reserves are described in terms of, “we have x number of years of y energy left.” These statements reflect the reserves to production ratio (R:P). This is the total estimated remaining reserve divided by the previous year’s production. The problem with these ratios is that they do not factor in the increased or decreased use of the resource over time. At year-end 2014, the R:P for global coal was 110 years [
9]. We did not address coal in the IEA model because the additional reserves estimated within the IEA Resources to Reserves 2013 were so high that the model would not require RES in any scenario; however, several factors limit the extraction of coal, and therefore global peak coal will more than likely occur before the year 2100 [
35]. As an example, coal reserves are more than likely overestimated, and recovery of those estimates may be as low as 20% of the expected value in the United States [
27]. We note that the IEA reserves of oil and natural gas are roughly triple the respective reserves of the Global model (i.e., [
9]). The total cumulative RES demand within the IEA model (106 GJ/person) is roughly equivalent to twice the Global model coal reserves. However, including the coal resources estimated by the IEA more than eliminates the need for RES in either consumption track. Rather than model an IEA coal production, we can consider the RES requirements within the IEA model to represent a climate-based policy choice: The required energy may either be derived from RES or from the abundant coal reserves estimated by the IEA. Utilising coal in place of RES would however result in drastic changes in climate change mitigation and adaptation strategies. For example, in the 106 GJ/person track Global model, the world is on track for 2.5 °C warming (RCP 4.5–RCP 6.0) [
2]. If coal is used in the IEA model, the emissions from the additional coal alone drive cumulative totals to 3.5 °C warming (RCP 6.0–RCP 8.5).
In addition, unconventional sources of oil and gas contribute a considerable fraction of total production [
36]. US oil production had peaked at 11.3 million barrels per day in 1970 [
9]. The recent boom in US oil production has surpassed the 1970 peak as the US averaged 11.6 million barrels per day in 2014 [
9], but has since dropped to 10.7 million barrels per day as of 2016 [
37]. The resurgence has been attributed to tight production. Most of the tight production in the United States is from small sweet spots and exhibit sharp and predictable depletion rates [
38,
39]. Aided by the recent drop in oil prices worldwide, the boom has called into question the notion of peak oil. In fact, global conventional crude oil production has been relatively constant for nearly a decade [
40]. It seems likely that continued depletion of conventional resources will keep the market favourable for tight oil and gas [
41] and the oil inelastic price phase as suggested by Murray and King [
40] may have been a temporary anomaly. Tight oil and gas reserves are not likely as expansive as initially estimated [
42]. Despite the potential health and environmental risks [
43], tight gas production will be necessary towards smoothing the drop in conventional gas production that is projected by mid-century [
39,
44].
3.3. The Hubbert Model
Several curve-fitting models have been used to project future non-renewable resource extraction. Reynolds and Baek [
45] examined several variants and found the best method varied based on the level of production investigated, though the single-cycle Hubbert logistic model performed adequately at the largest aggregation levels. Brandt [
46] rigorously tested several aspects of the Hubbert model and found that Hubbert models were not likely to vary (by methodology) significantly in predicted peak date, though it was emphasised that no single methodology was universally applicable and a more broad application of Hubbert theory (developing a family of predictive curves) would best suit predictions of future production.
Similar studies have focused on coal, natural gas, uranium and total non-renewable energy sources. Hook et al. [
35] found that simple logistic model results of regional and global coal production were comparable to more complex, variable-laden models. Mohr et al. [
5], Maggio and Cacciola [
6], and Mediavilla et al. [
47] each modelled oil, coal, and natural gas production throughout the 21st century and beyond, finding in each case that fossil fuel production is likely to peak by 2100. Based on the results of this (and additional) literature, we feel confident in using the single-cycle Hubbert model in our analysis.
3.4. The Six Scenarios
Of the six scenarios developed in this study, five require over 30 EJ of RES production by the year 2050. The sixth scenario is the 58 GJ/person by 2100 track and the full exploitation of the IEA remaining oil and natural gas resources. The IEA estimates of remaining coal resources allow renewable energy to remain essentially unutilised. Policy makers must strike a balance between climate change, energy demands and development. The remaining NRES reserves remain the cheapest and easiest solution to the increasing energy demand. The infrastructure is in place and the technology is mature. As technology improves, the amount of these resources made available for exploitation will also increase.
Figure 1b illustrates that there were few declines and no sustained decreases in per capita energy consumption in the 20th century. It is almost a certainty that global energy consumption will continue to increase during the 21st century. The reserve-limitations in the 2C model are unrealistic and the proven reserves used in the Global model are all but certainly going to be consumed [
2].
3.5. Sustainable Development Goals
Prior to COP21, the General assembly of the United Nations identified seventeen sustainable development goals for the 21st century [
48]. Affordable and clean energy is goal number seven and climate action is goal number thirteen. However, the results of this work suggest deeper meaning to the United Nations claim that each of the goals is “integrated and indivisible”. Energy production and consumption goals are in many ways in conflict with climate actions plans. This is due to the current dominance of carbon-based energy production at the global level. Renewable energy and climate change concerns in the United States, the European Union, and the Russian Federation are vastly different than those in India, China, and Sub-Saharan Africa.
For example, the government structure of India creates a more complex geo-economic transition focused more on securing future energy supplies than on cooperating towards global goals [
49]. India’s contribution to the Paris Agreement stressed the difference between consumption and emission rates in India and the developed world, and noted the importance of energy consumption to improving a nation’s human development index. Additional studies are needed to build on policy implications for different economies. Our future work includes plans to bring this type of analysis to the regional and national level.
Additionally, who makes the decision as to who can and cannot burn these fuels: the developed nations, the highest emitting yet most capable of moving towards RES infrastructure, or the least developed, the lowest emitting but attempting to catch up to the developed nations? The social and political challenges to distributing the remaining allowable carbon emissions do not excuse the biophysical reality of the situation [
50]. In preventing a global climate change of 2 °C or greater, the peaking of carbon-intensive energy production must be made imminent. We do not believe the 2C model to be relevant for any purpose other than highlighting the climate change issue and providing a high-end estimate of RES demand throughout the century. This is due to the rate of growth required from renewable energy in order to satisfy the world’s energy demand see [
2,
3]. What is clear from these scenarios is that whether focus is placed on limiting anthropogenic global warming, increasing global quality of life, international development, or providing for energy security, RES infrastructure is the common route toward providing for future generations.
5. Conclusions
This study illustrates the importance of renewable energy in the future global energy supply, regardless of climate change or related policies. We have also expanded the range of estimates for future RES production calculated in Jones and Warner [
2]. NRES reserves are likely to be higher than those used in the Global model, but less than those used in the IEA model. Even in theory, the 2C model does not appear practical [
2]. A key insight in this study is that including the IEA additional reserves allows for a smoother transition towards a fully renewable energy infrastructure. At any rate, it seems likely that fossil fuel production will peak in the 21st century. There are two significant limitations to rapid renewable infrastructure growth: first, becoming the prime component of global energy consumption has historically taken over half a century of development [
3]; second, renewable energy remains in competition with pre-peak production of higher EROI fossil fuels.
We have modelled both energy reserves and PCC independently and combined the results. We do not take into account non-energy source scarcity projections such as copper [
60], lithium [
61], or phosphorus [
62]. If the ramifications of burning the fossil fuel reserves of the Global model exceed climate change goals, then the transition to RES must begin immediately. Otherwise, the world may be heading towards exploitation of fossil fuels on par with the IEA model. Again, developing RES infrastructure is a requirement of each scenario. There is need for more studies integrated into global, regional, and national plans for socio-economic development and climate/environmental resource conservation.
Increased per capita energy availability (especially for women) is associated with many shifts in demographic trends (most notably in fertility rates) [
8]. Economic development and energy access in these regions could drastically alter the population projections made by Gerland et al. [
10]. It is entirely possible that a large investment in projects such as the World Bank’s Sustainable Energy for All Initiative may serve to “bend” the population projections towards lower numbers by the end of the century. However, without drastic and rapid changes in fertility rates, the population issue will only become a greater ecological stress [
63]. The current population projections do not explicitly account for energy availability.
It is important to note that both NRES and RES will be required throughout the 21st century. Energy production and security are important foci for governments around the world; however, the implications of per capita energy consumption statistics cannot be ignored in 21st century policymaking. Consumption growth or decline of 1 GJ/person results in a corresponding 1 EJ change in energy consumption per billion people. If the 2014 global population had consumed 2 GJ/person more (+14.5 EJ), it would have negated the 2014 global total production of non-hydropower RES (13.3 EJ). As such, significant growth in renewable energy will be required throughout the 21st century, regardless of climate change considerations.
This study was conceived as an initial quantitative look at the importance of global fossil fuel reserve estimates and development goals to one another. By including gratuitous oil and natural gas reserve estimates, renewable energy investment is only delayed, not unnecessary. If the UN population projections are reliable, only in the case of fossil fuel reserves and declining global per capita energy consumption (combined with allowing for >3.5 °C warming above pre-industrial levels) may it be considered needless to invest in the RES transition. Though three nations remain holdouts from the 2015 Paris Agreement, it is our recommendation that the remaining nations work together to establish effective policies aimed at including in addition to the efforts to reduce carbon emissions. While this conclusion is hardly novel, we have provided numbers that illustrate the need for immediate action.


