1. Introduction
Development is linked to rising energy demand and increasing use of fossil energy sources and their associated emissions, which contribute to climate change. There is a need to reduce energy consumption, a process aided by more efficient buildings, since this sector represents 40% of the European Union’s final energy consumption [
1]. With this purpose, regulations that promote the improvement of the energy performance of buildings have been introduced [
2].
The building sector aims to reduce the environmental impact of materials and constructive elements and increase energy efficiency through the development of innovations [
3]. Precast concrete helps to achieve these objectives, since it is the most sustainable option in both building and infrastructure, by saving time, energy, and resources. The development of lightweight concrete reduces the necessary thickness and material consumption while maintaining the thermal capacity. This can be achieved by adding different compounds, such as phase change materials (PCMs), which decrease temperature fluctuations [
4,
5]. The material changes phase from solid to liquid via an endothermic reaction when heat is supplied during daytime and vice versa, turning from liquid to solid by an exothermic reaction as long as heat is released during the night, while maintaining a constant temperature throughout both processes [
6].
There are different techniques for PCM incorporation into building materials, such as direct addition, immersion, and macro- or micro-encapsulation [
7]. In the latter case, the PCM is included in the panels in microcapsules of another material, avoiding liquid leakage when the PCM melts [
8,
9] and improving heat transfer.
The additive selected for this study is Basf Micronal PCM (DS5007), which contains a special wax mixture microencapsulated (size approximately 5 μm). The main properties of this material are a melting point of 23 °C, an overall storage capacity of 55 kJ/kg, and a latent heat capacity of 41 kJ/kg [
10]. The material that changes phase is an aqueous solution of paraffin encapsulated in a film of acrylate polymer. The percentage determined (in this case less than 1%) of these small containers are mixed in the mortar with the other components (such as cement or aggregates) required to obtain concrete with PCM.
This work begins with the construction of two cubicles with prefabricated panels. The first cubicle (considered as a reference) is made of self-compacting concrete. The second cubicle has the same panels but with a phase change material added during their manufacture. The aim of this study is to verify the acquisition system installed in each cubicle based on Supervisory Control and Data Acquisition (SCADA). It consists of a 1-wire bus network with four temperature sensors per panel used to measure temperature ranges inside both cubicles and several additional sensors [
11]. This system offers an alternative to others used in different works [
12,
13], with some strengths that will be highlighted later.
The data collected by the system are analysed in order to confirm that the results agree with the real properties of the PCM. The data should show that the wall with the PCM has a lower temperature range and a lower heat flux than the one without the PCM because this material absorbs energy by changing its phase, inhibiting the rising temperature; therefore, the temperature range is lower [
8,
9,
14,
15]. As a result, the addition of the building material increases the wall’s thermal inertia [
11,
16,
17,
18,
19,
20]. The acquisition system should be accurate enough to detect this behaviour; otherwise, it would not be suitable for this application.
2. Principles of Acquisition System
The control of the acquisition system is based on SCADA, which allows interaction between the user and remote devices in real time, as communication is established through an Ethernet network [
21]. Therefore, the process is controlled automatically from the computer screen. The main difference between SCADA and other remote-control systems is that the others spread control variables to electronic controllers, hindering the control of the process.
The communication and acquisition system is based on 1-wire technology, a simple monitoring design. The network is called “bus” (1-wire bus network) and it connects all the sensors via one cable. The result is a low-noise and high-efficiency transmission data system. Communications begin with the same sequence of a reset pulse, followed by a presence pulse. The reset pulse starts the operation and synchronizes slave devices. The presence pulse is sent to devices to ready them for operation.
3. Materials and Methods
3.1. Manufacture of Prefabricated Panels
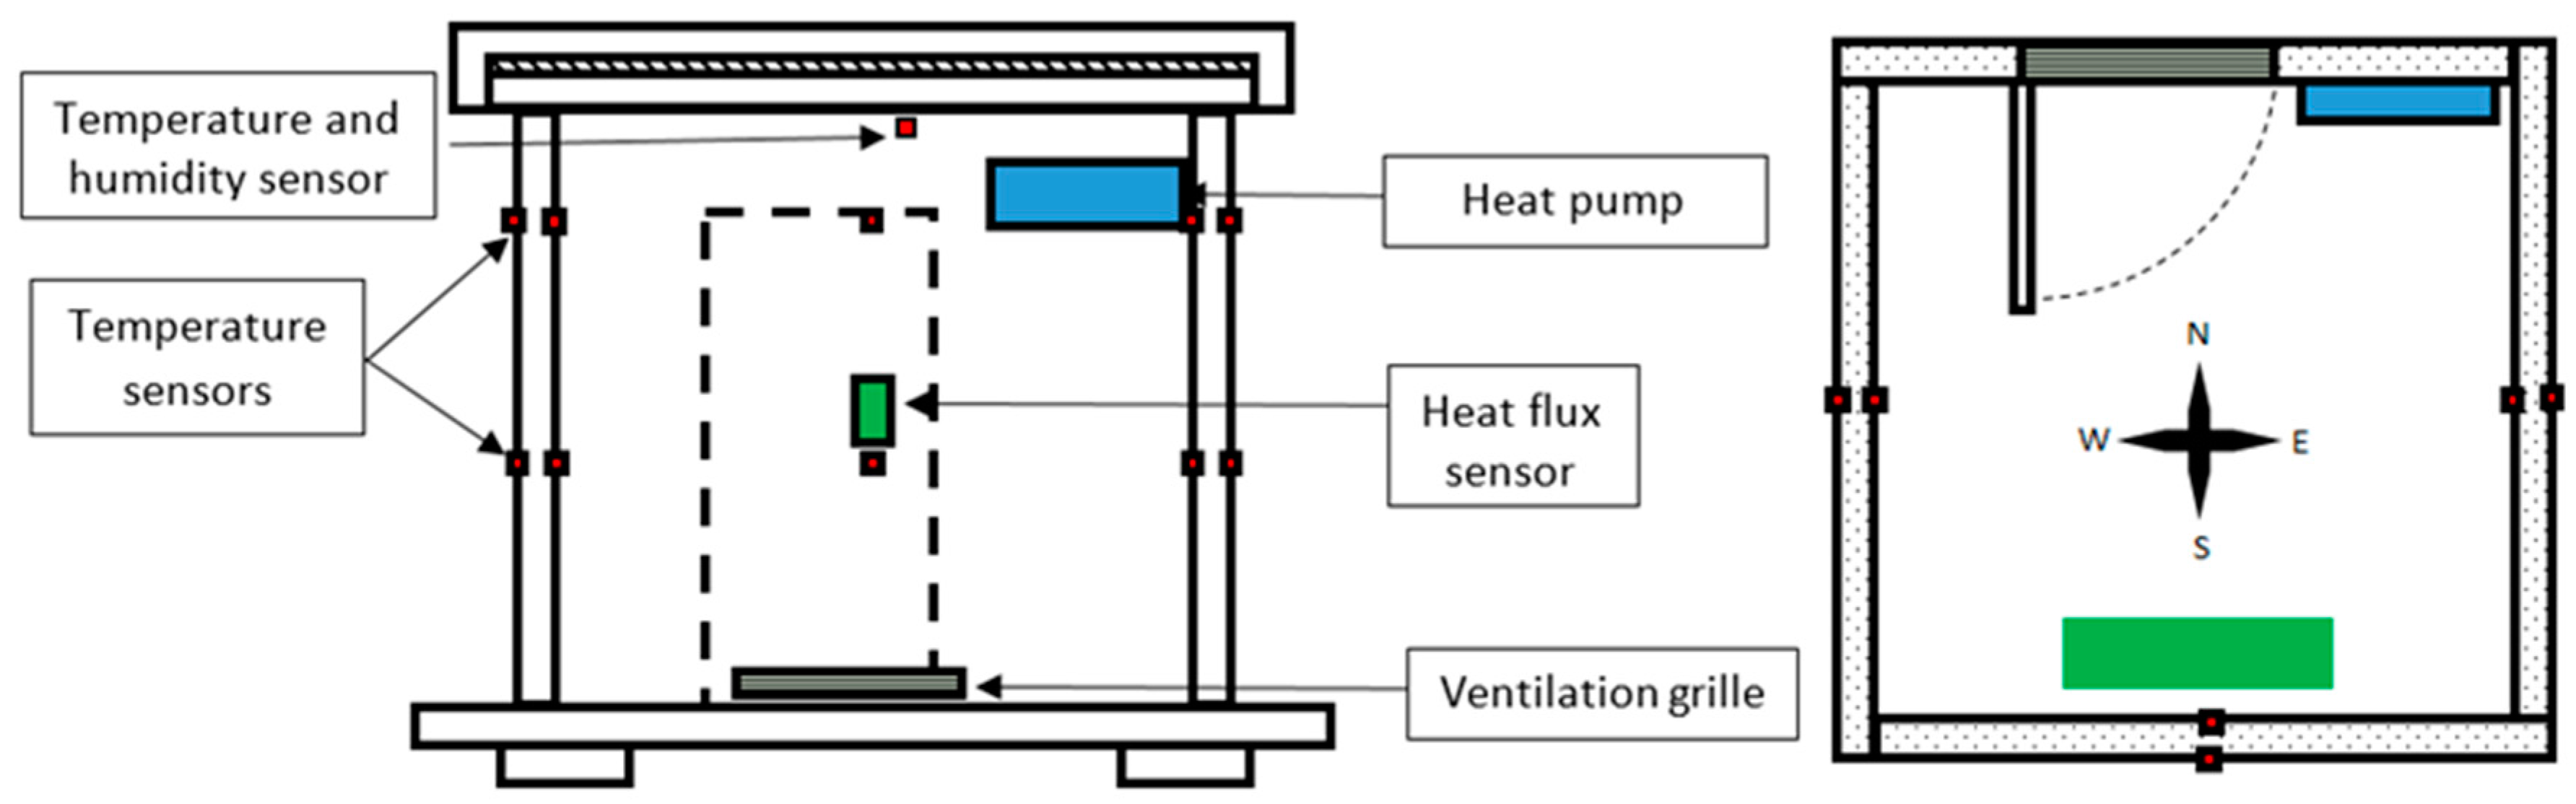
The solid concrete panels are cast in moulds on a surface (usually a smooth steel base) in quality-controlled factories far from the building site. The first step is to clean the mould and apply a release agent to the steel surface with a cloth. Then, reinforced steel and lifting elements are placed in the mould, followed by the temperature sensors, which are attached to the steel structure and embedded in the panel (2 mm under the surface). There are four temperature sensors per panel, placed as shown in
Figure 1. The north-facing panel also contains the gateway and none sensor. The mould is filled with self-compacting concrete and cured to the appropriate level of strength. Once cured, the panel is removed from mould, stored, and transported to the site when it is needed.
3.2. Installation
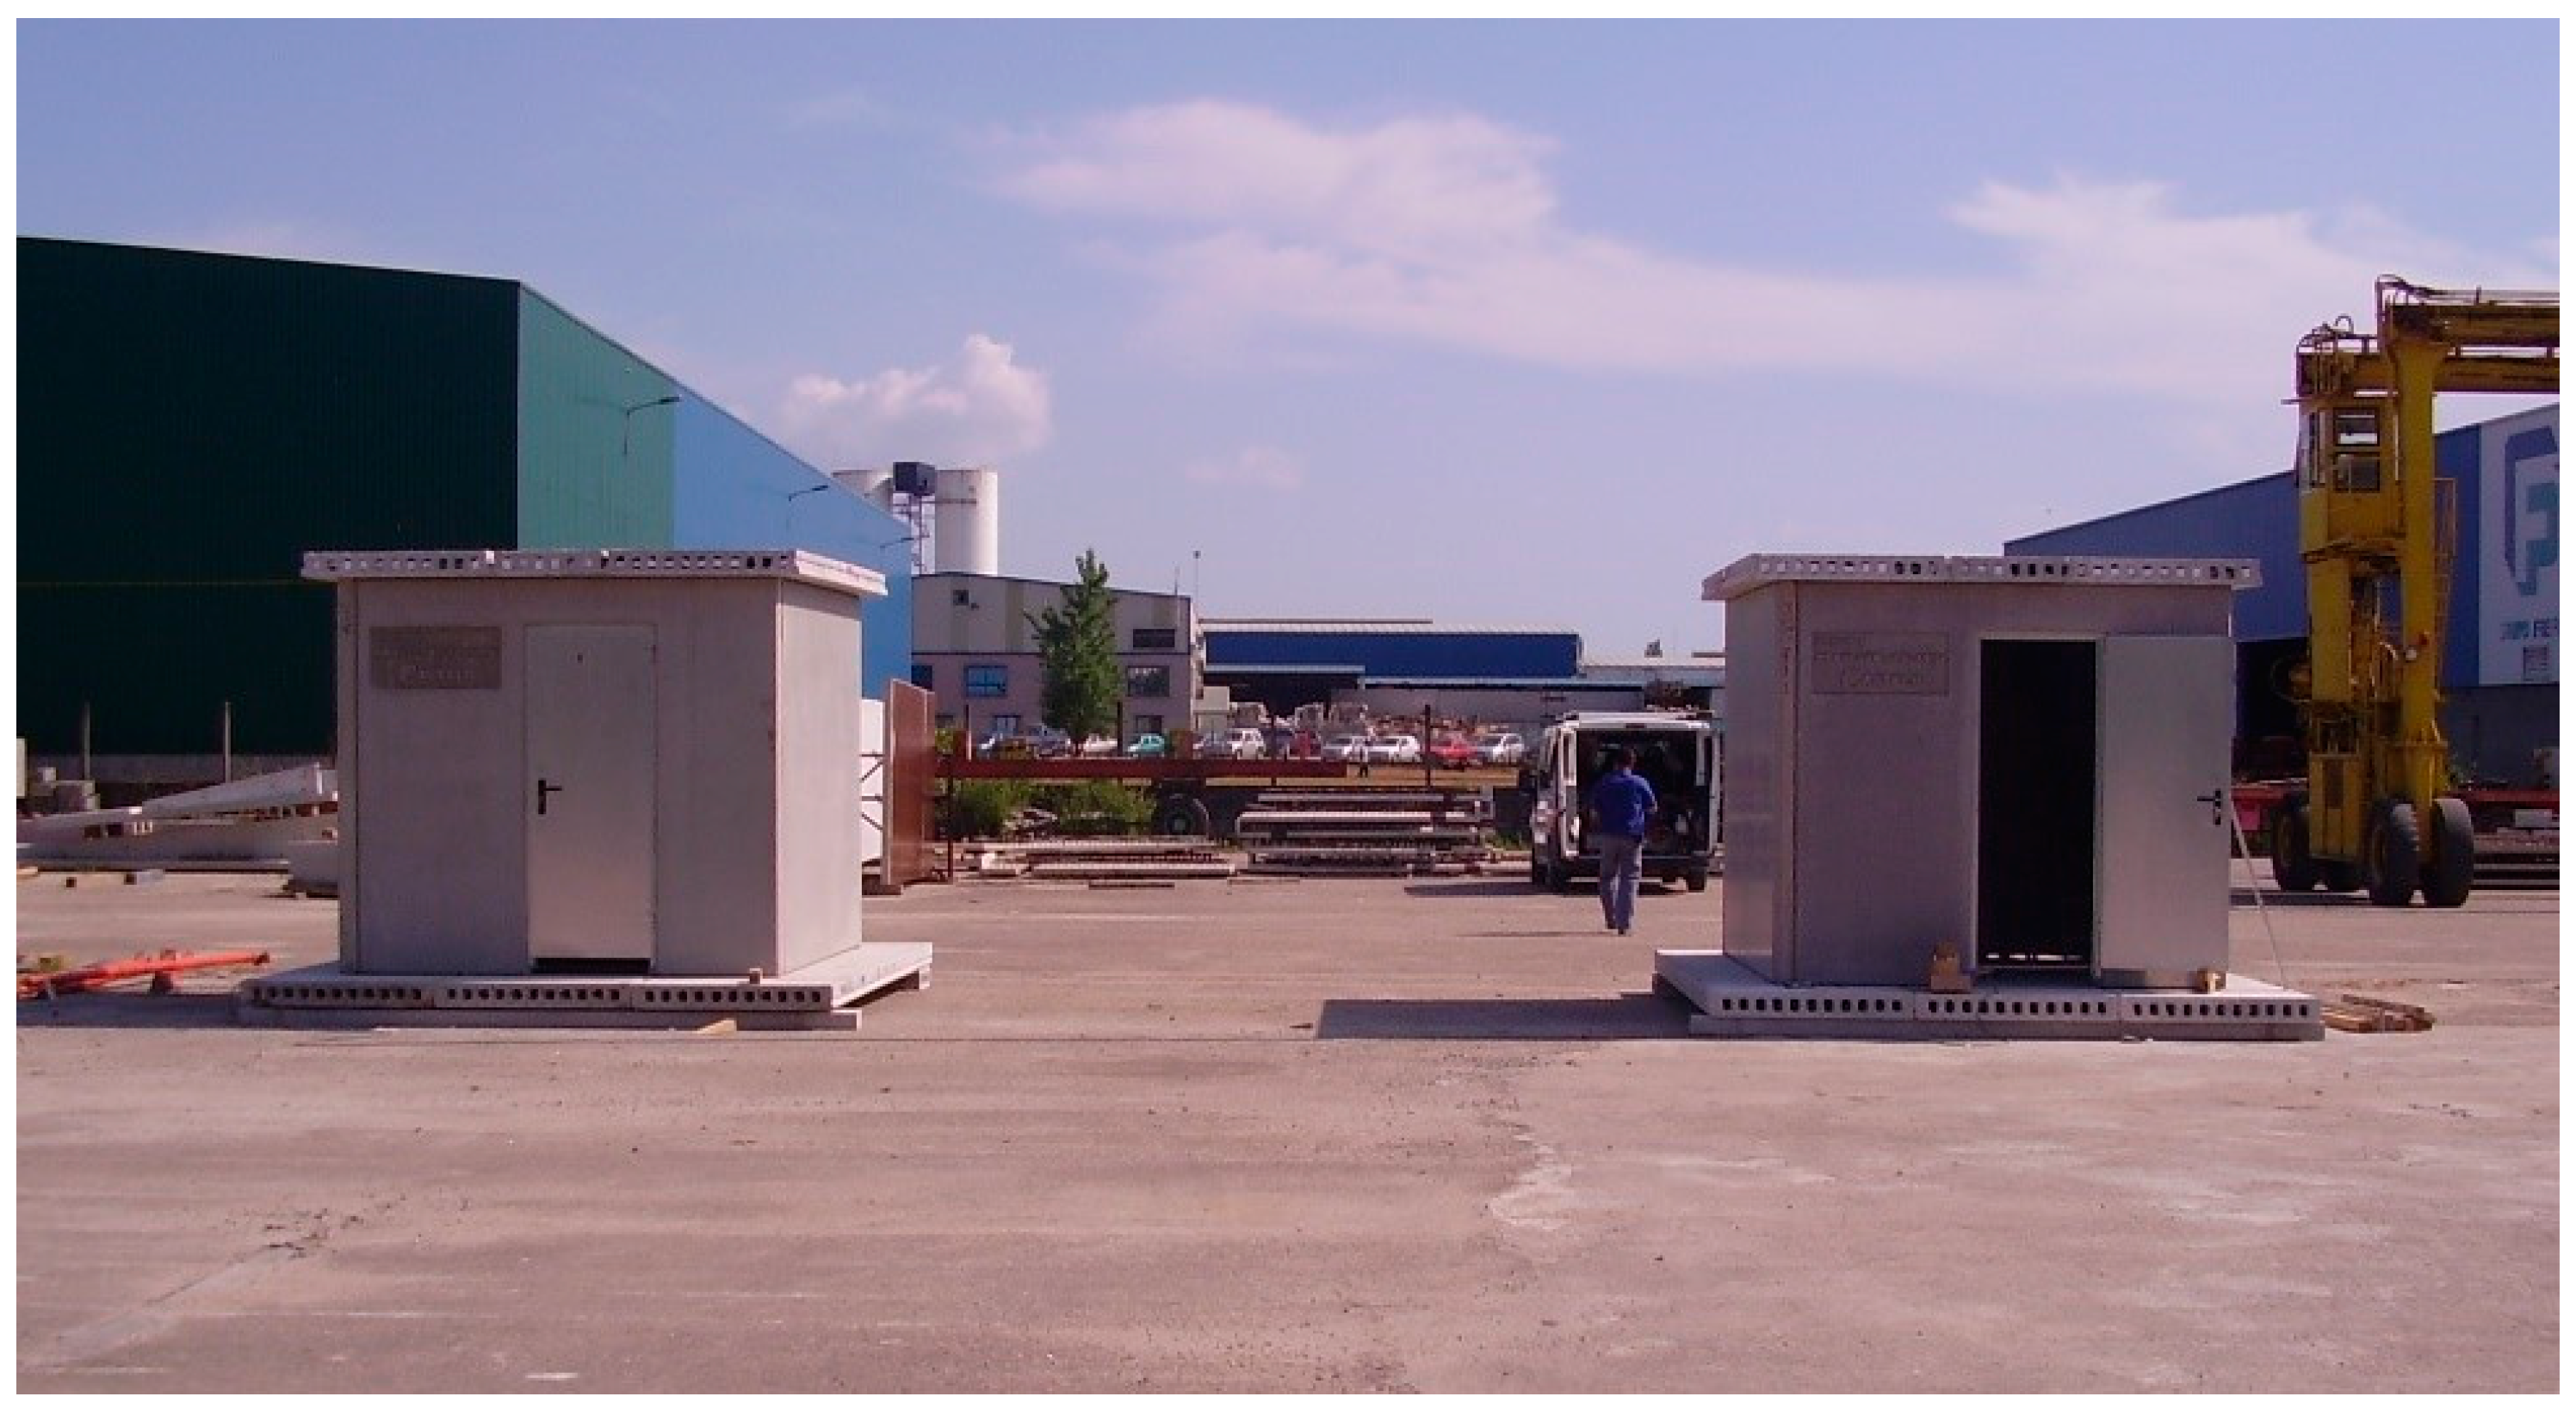
The panels are mounted on a foundation made of a hollow-core slab. The roof is a three-layer panel: hollow-core slab (12 cm), polyurethane foam (5 cm), and reinforced concrete (5–10 cm to achieve a certain inclination to the north wall). Both test rooms have the same dimensions and the same foundation and roof. The dimensions of the cubicles are 250 × 250 cm, and the walls (panels where temperature sensors are placed) are 262 × 239 × 12 cm. The final result can be seen in
Figure 2.
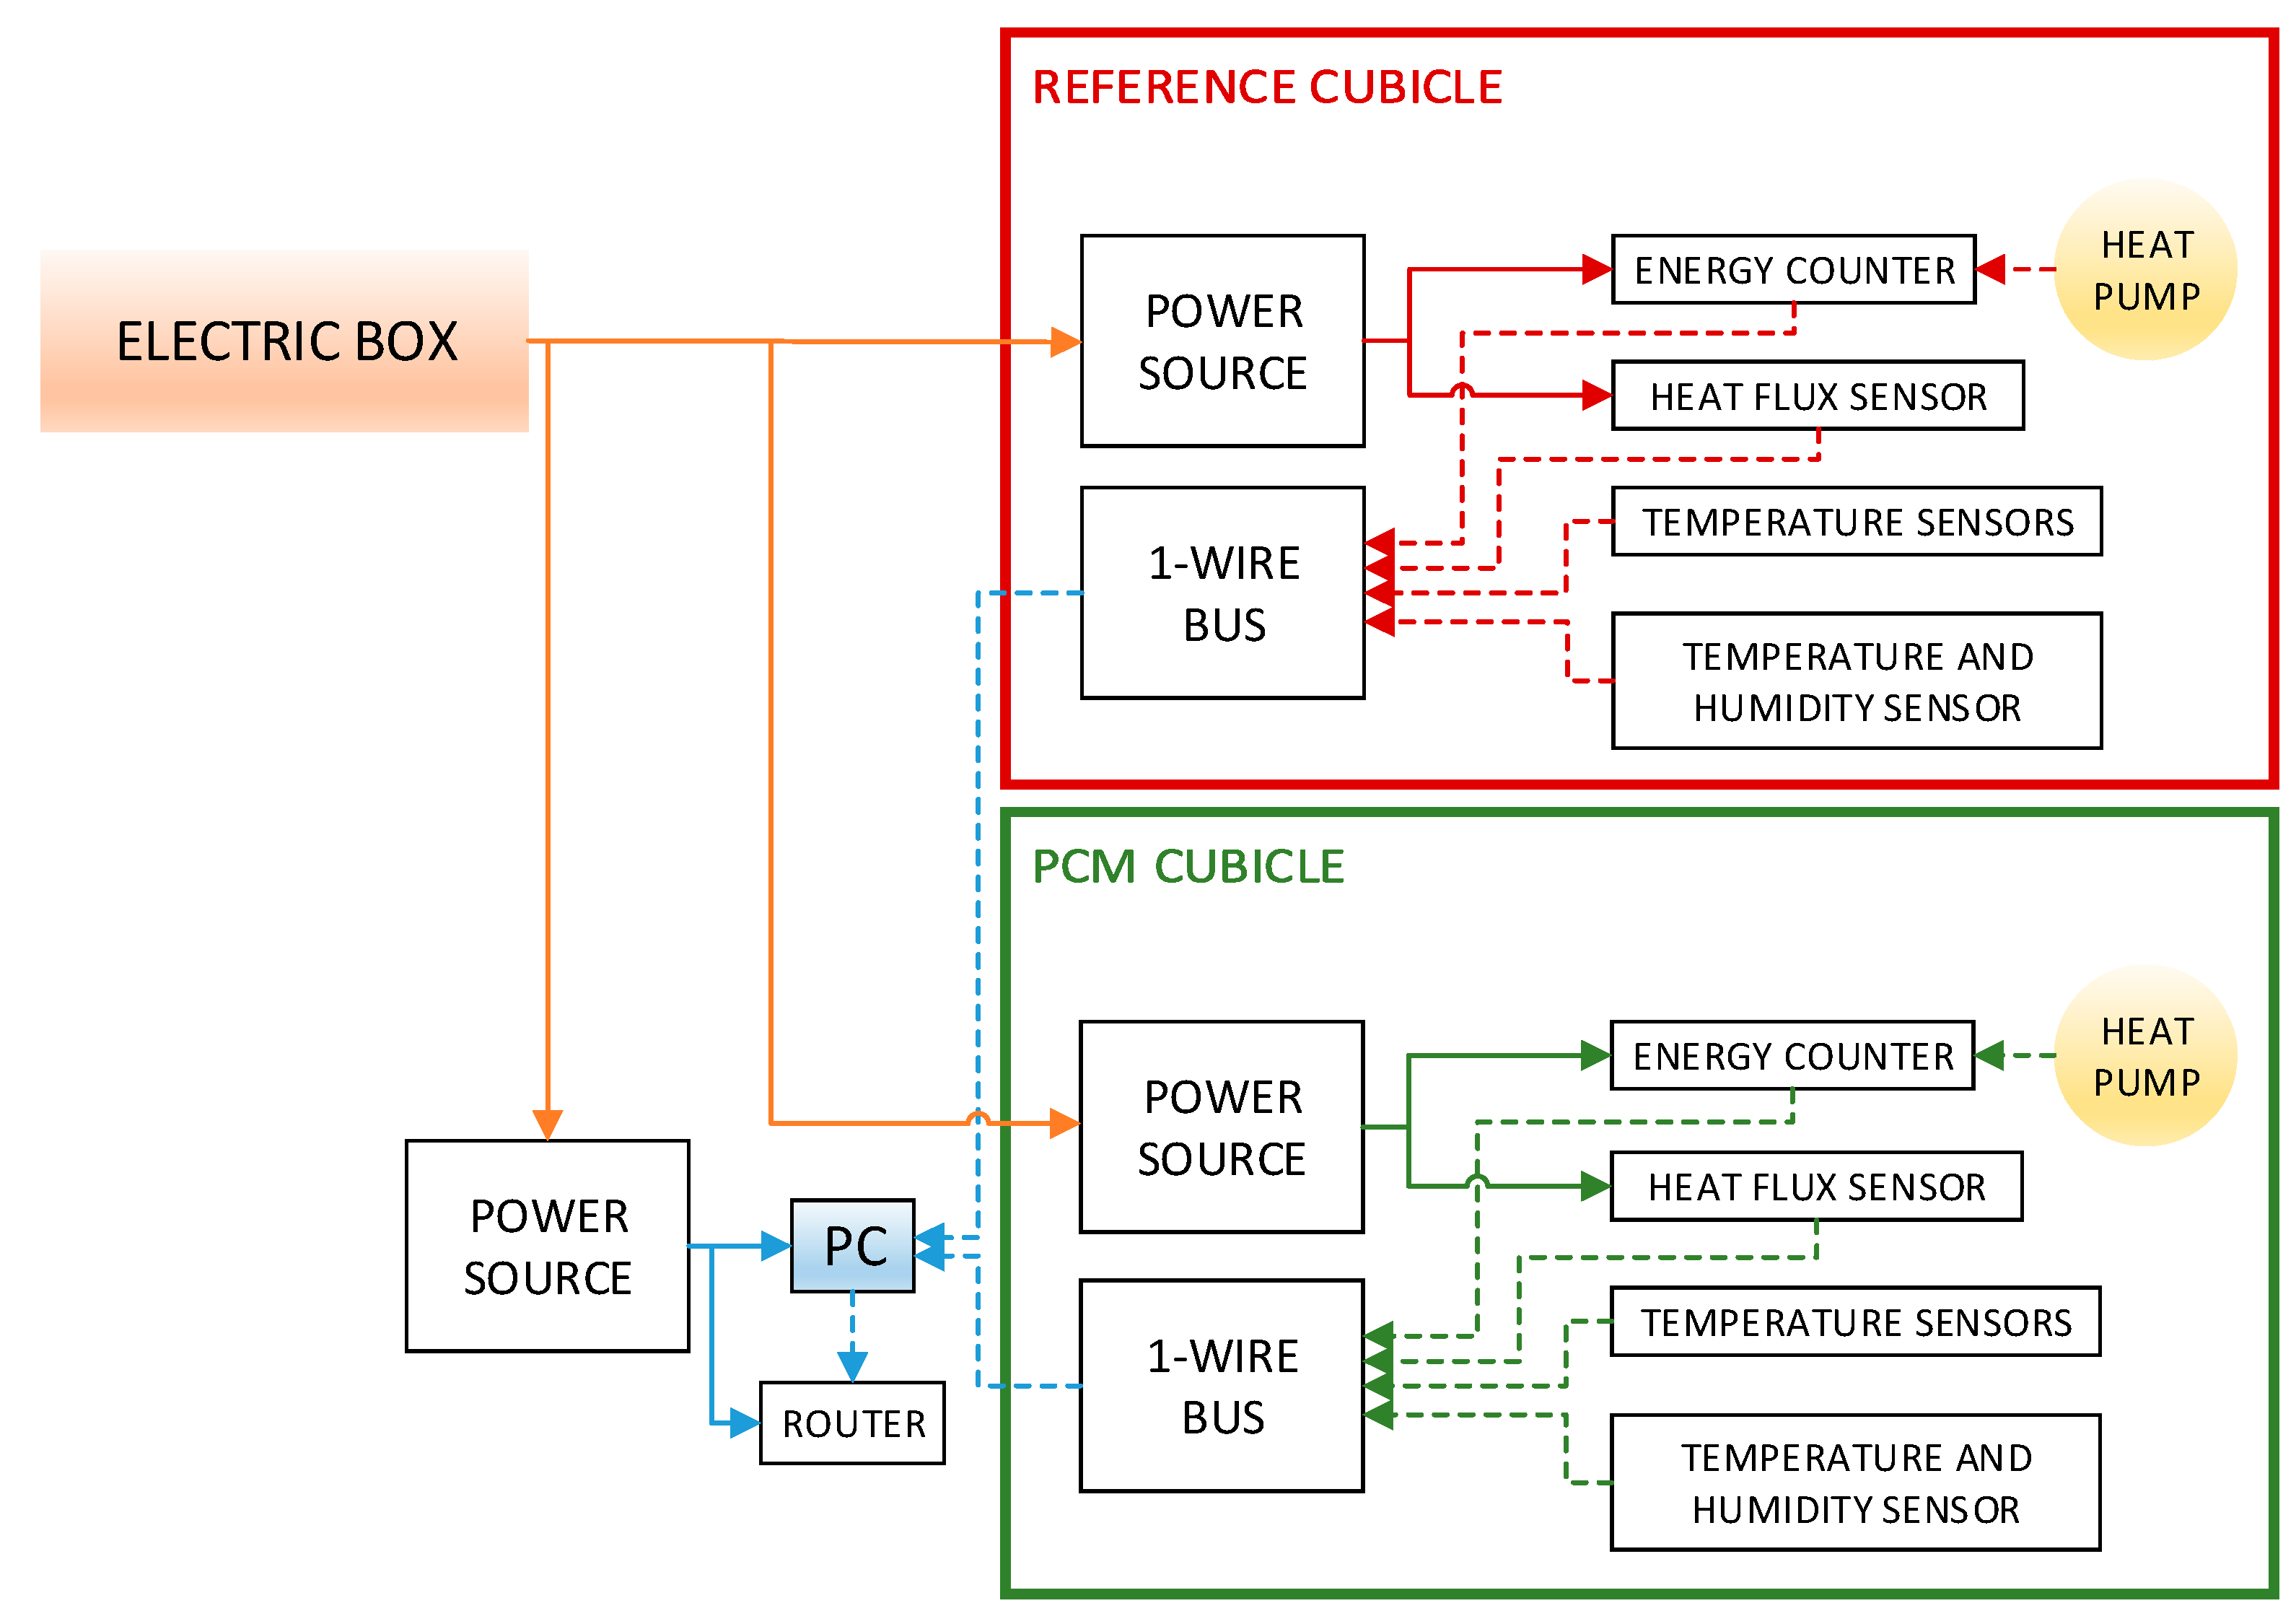
The sensors installed in each cubicle are listed herein: embedded temperature sensors, indoor temperature and humidity sensors, and a heat flux sensor in the south panel. The south panel serves as the reference panel, since it is the one with the biggest surface temperature range because it has the longest exposure to direct sunlight. To maintain the indoor temperature level, a heat pump is installed in each cubicle, which may supply heat to or release heat from the room.
3.3. Data Collection Equipment
3.3.1. Data Collected and Sensor Distribution
Table 1 compiles the data collected by the sensors and
Figure 3 shows how the sensor and units are distributed, as well as cubicle’s orientation.
3.3.2. Hardware
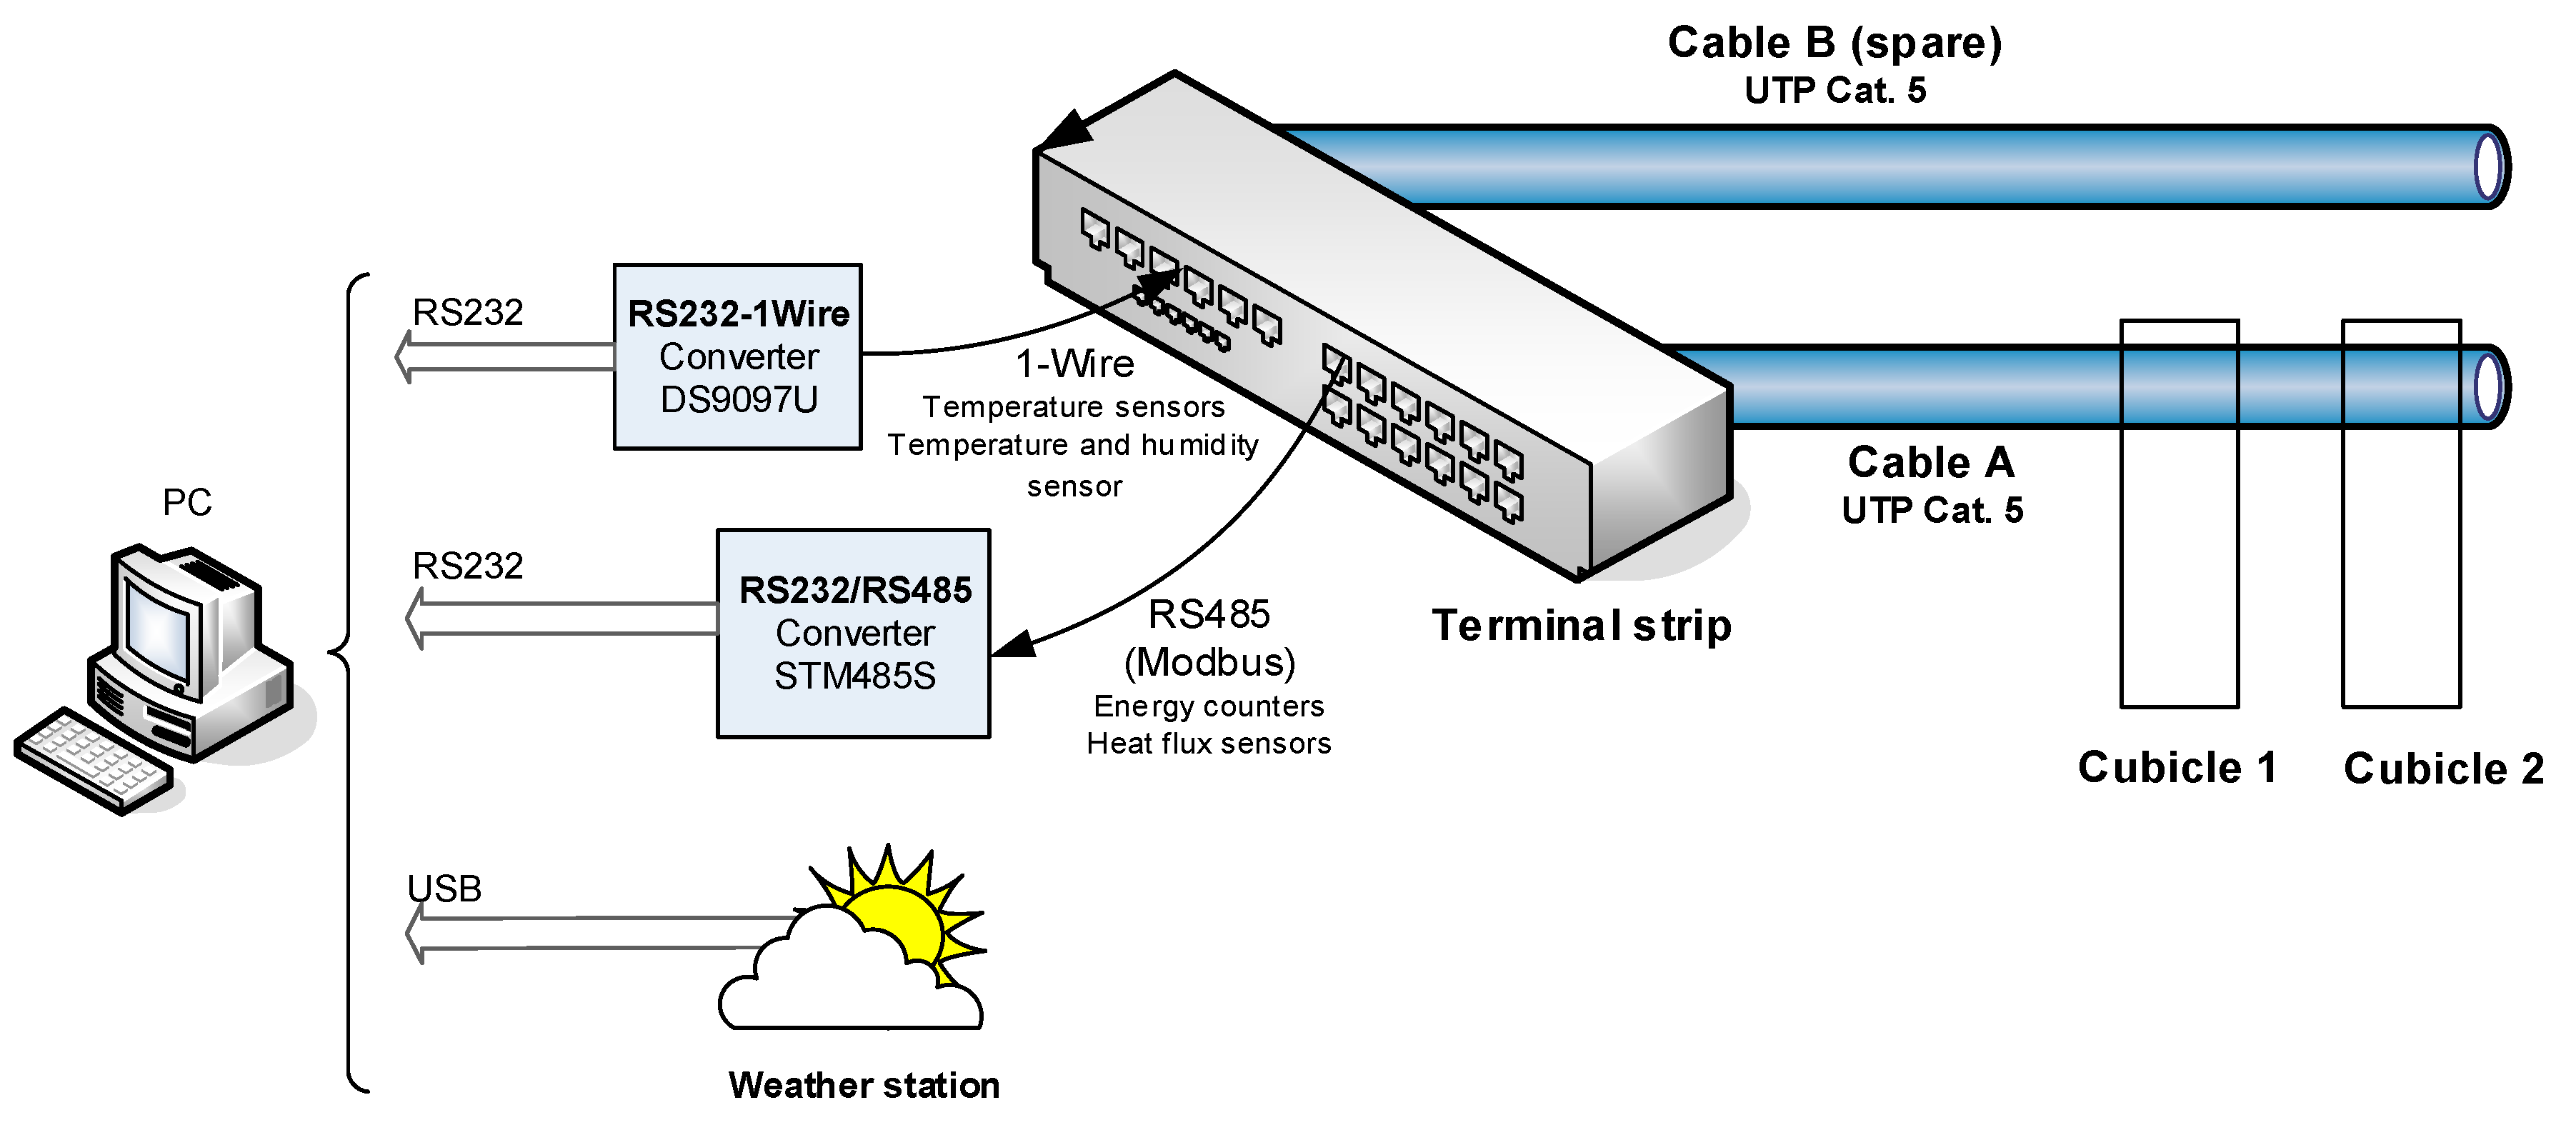
The acquisition system involves two separated Cat. 5 UTP cables (four pairs each); cable A is the one being used and cable B is a spare for future expansion (
Figure 4). Cable A joins each cubicle’s sensors with the following materials:
The 1-Wire bus, which includes temperature sensors (Maxim DS18B20 (Maxim Integrated, San Jose, CA, USA)) and humidity sensors (Maxim DS1923 Hygrochron (Maxim Integrated, San Jose, CA, USA));
The Modbus RTU, which includes energy counters (MK-30LCD-RS485 (Siemens, Nordborg, Denmark)) to measure each heat pump’s consumption and heat flux sensors (Ahlborn FQA-0801-H (Ahlborn, Holzkirchen, Deutschland)) connected to an analogue module with MODBUS connection (ADAM 4017 (B&B Electronics, Ottawa, IL, USA)).
The data collected by the sensors are stored on the hard disk of an industrial PC, which identifies each device with a 64-bit code. Since each device has a unique code, the number of allowable temperature sensors connected to this 1-wire bus is virtually unlimited.
There is also a weather station (SEN-08311) located on the roof of the reference cubicle connected to the industrial PC via USB.
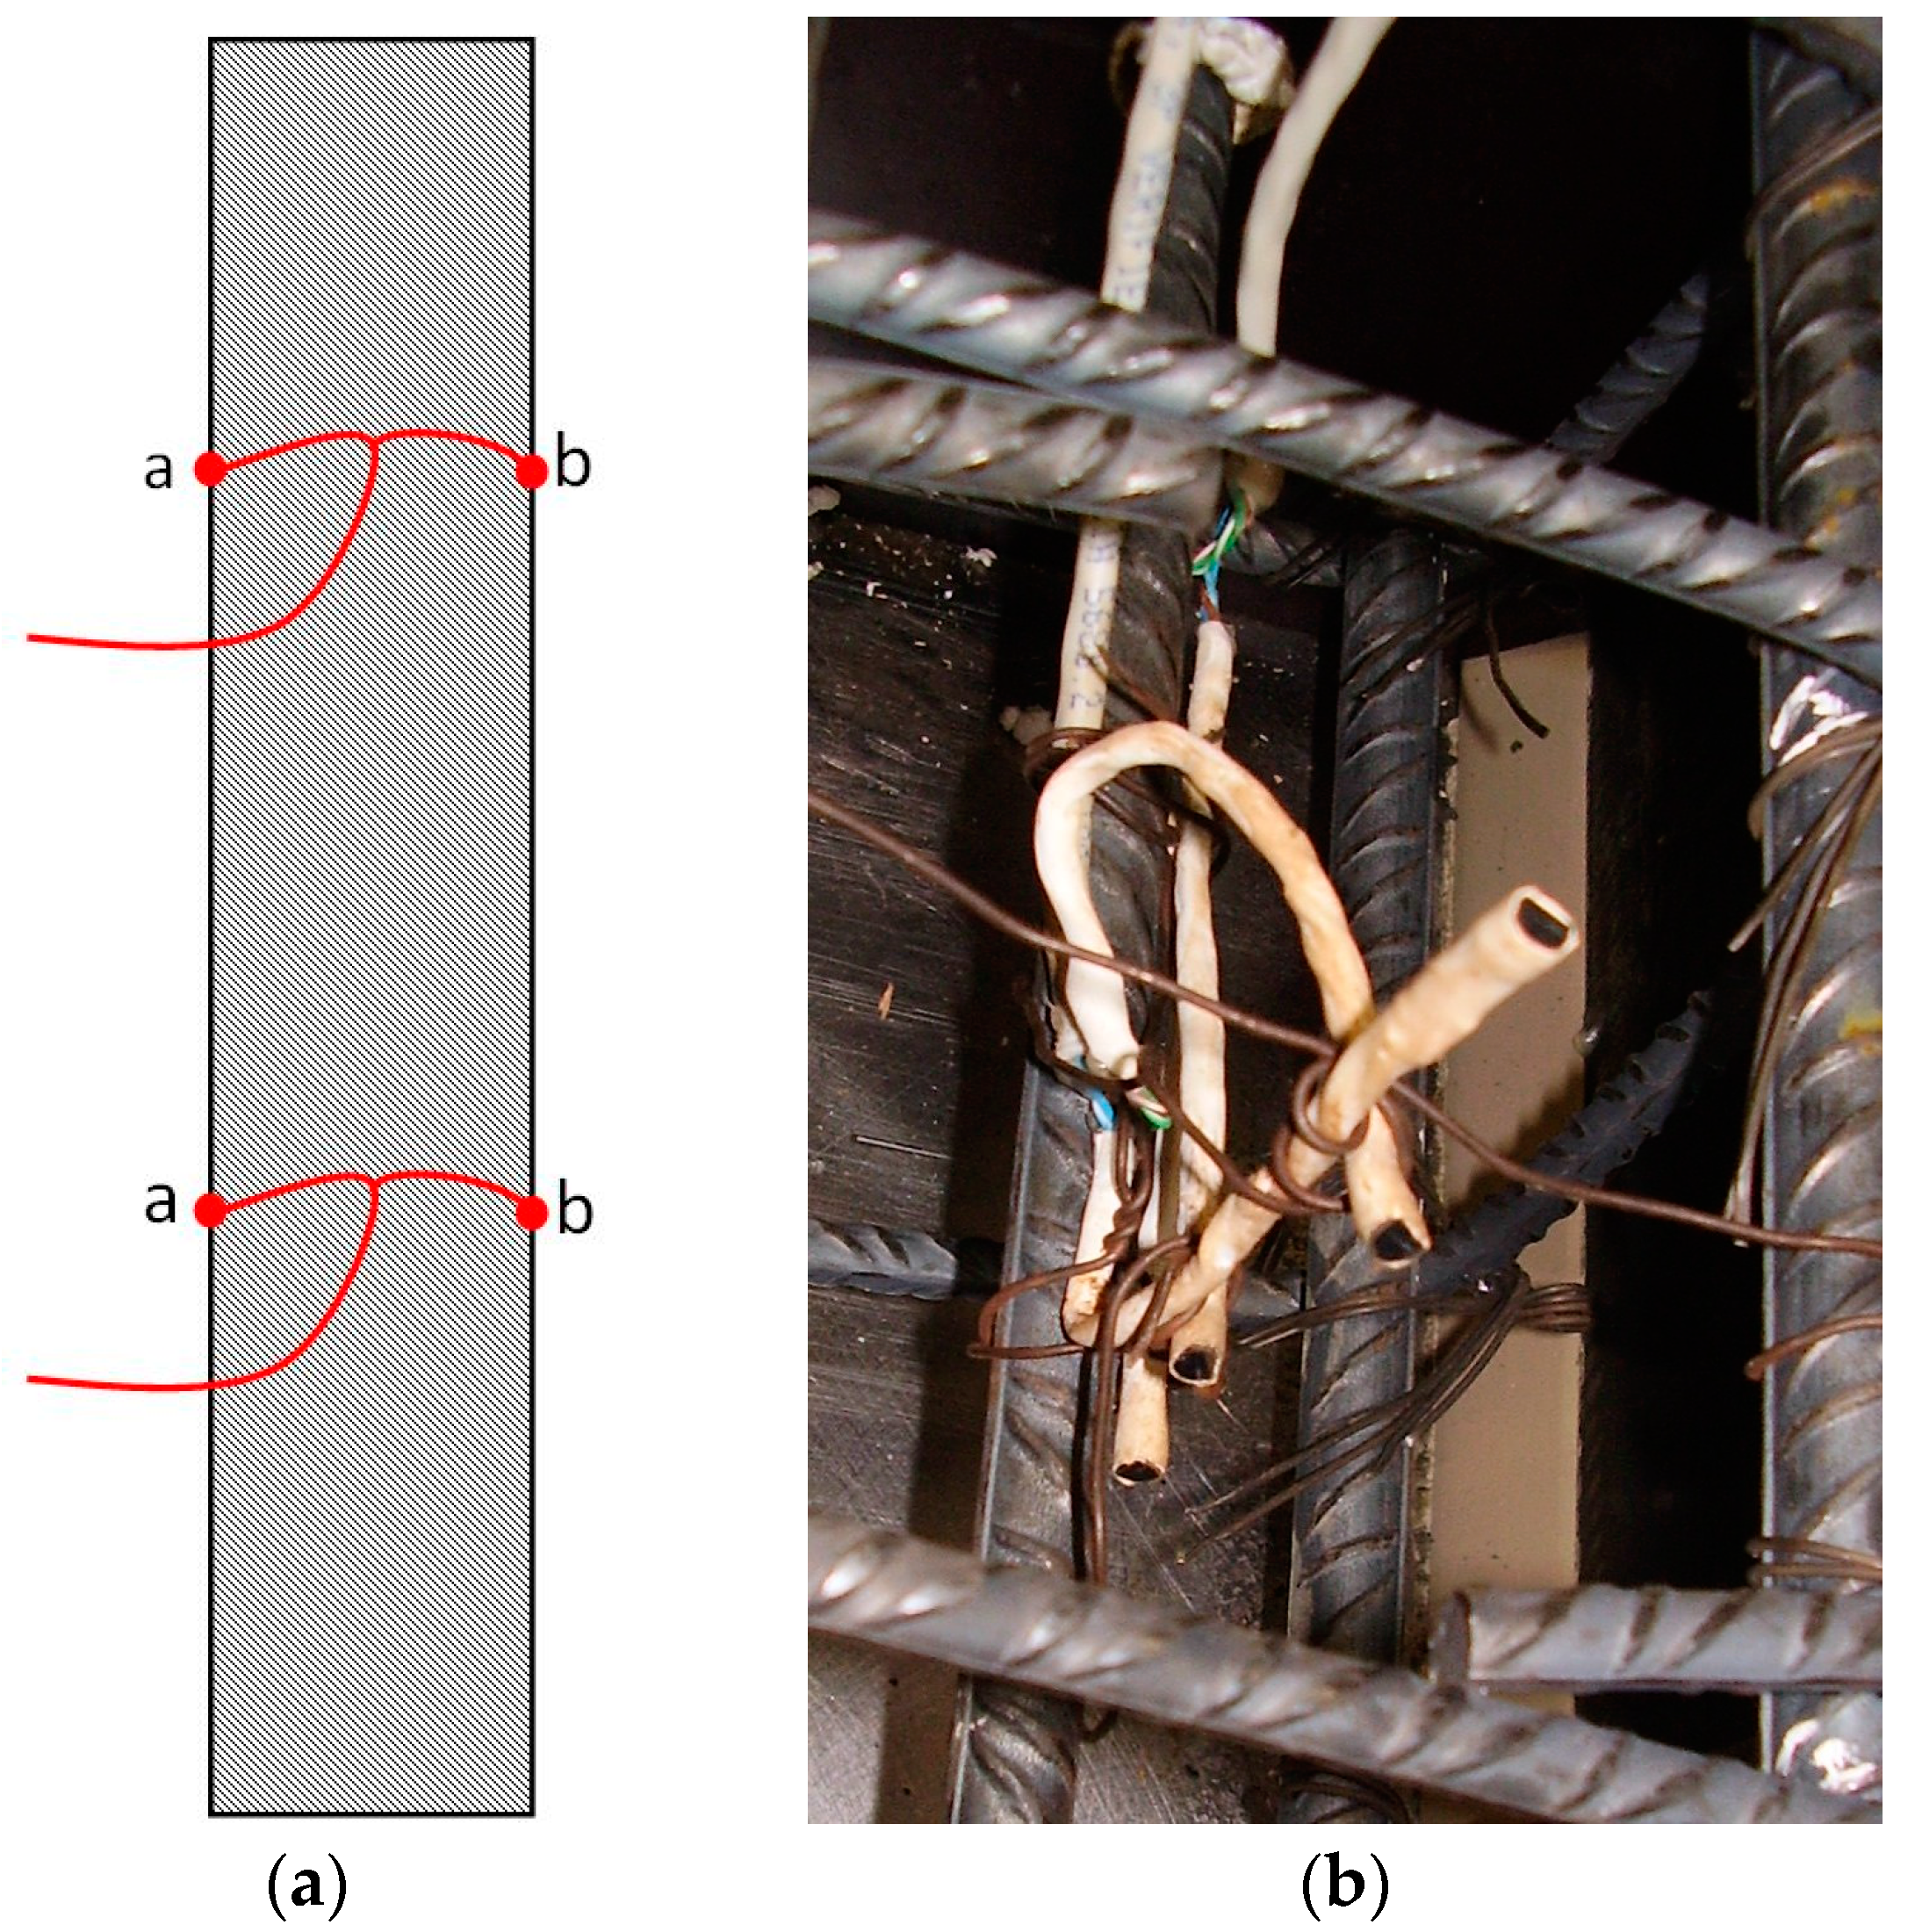
3.3.3. Wire Connections
Cable A has four pairs of wires. Their connections for signal transport are presented in
Table 2.
3.3.4. Power Supply
Regarding power supply, an electric breaker box is installed outside the cubicles in order to separate the cubicle wiring from the electricity grid. It consists of a three-phase thermal magnetic circuit breaker, an automatic differential switch, and a three-phase electricity consumption meter to collect data on the global energy that is consumed by a full installation (
Figure 5). This electric box gives electricity to the power sources placed in both cubicles and a third one outside, which is connected to the industrial PC and the router.
The power source placed in each cubicle supplies energy to the heat flux sensors and the energy counters. This way, the Modbus RTU does not need a power supply line (there is one spare power supply cable in case the power source is unavailable).
The temperature and humidity sensors do not need any power supply, although one is installed as a spare 1-wire line of 5 V, which provides power in case there is a failure and ensures continuous sensors operation of the sensors.
3.4. Testing Procedure
Once the cubicles are completely assembled and all the units and sensors are installed, the acquisition system can be tested. To prove this application, data are collected during July and December (summer and winter), because these months represent the temperature extremes during the year in the location selected. Heat pumps maintain the indoor temperature of 20 °C. They provide heat to or release heat from the rooms depending on the inside temperature of the rooms. Four rainless days were chosen for testing each month; therefore, the walls were dry during testing.
Since the percentage of additive in the PCM walls is quite low (<1%), the energy storage and the effect in thermal inertia should be limited. To characterise the building materials, the composition, density and thermal conductivity of both types of walls were determined (
Appendix A). The results from this analysis show small differences between the walls; therefore, the low addition of the PCM certainly triggers some effects in material behaviour. The effects should be reflected in each wall’s temperature and heat flux evolution. The acquisition system should be accurate enough to register this difference; otherwise, it would not be suitable for this application because small differences in temperature ranges may cause a remarkable difference in the necessary energy consumption for maintaining a comfortable indoor temperature.
4. Results
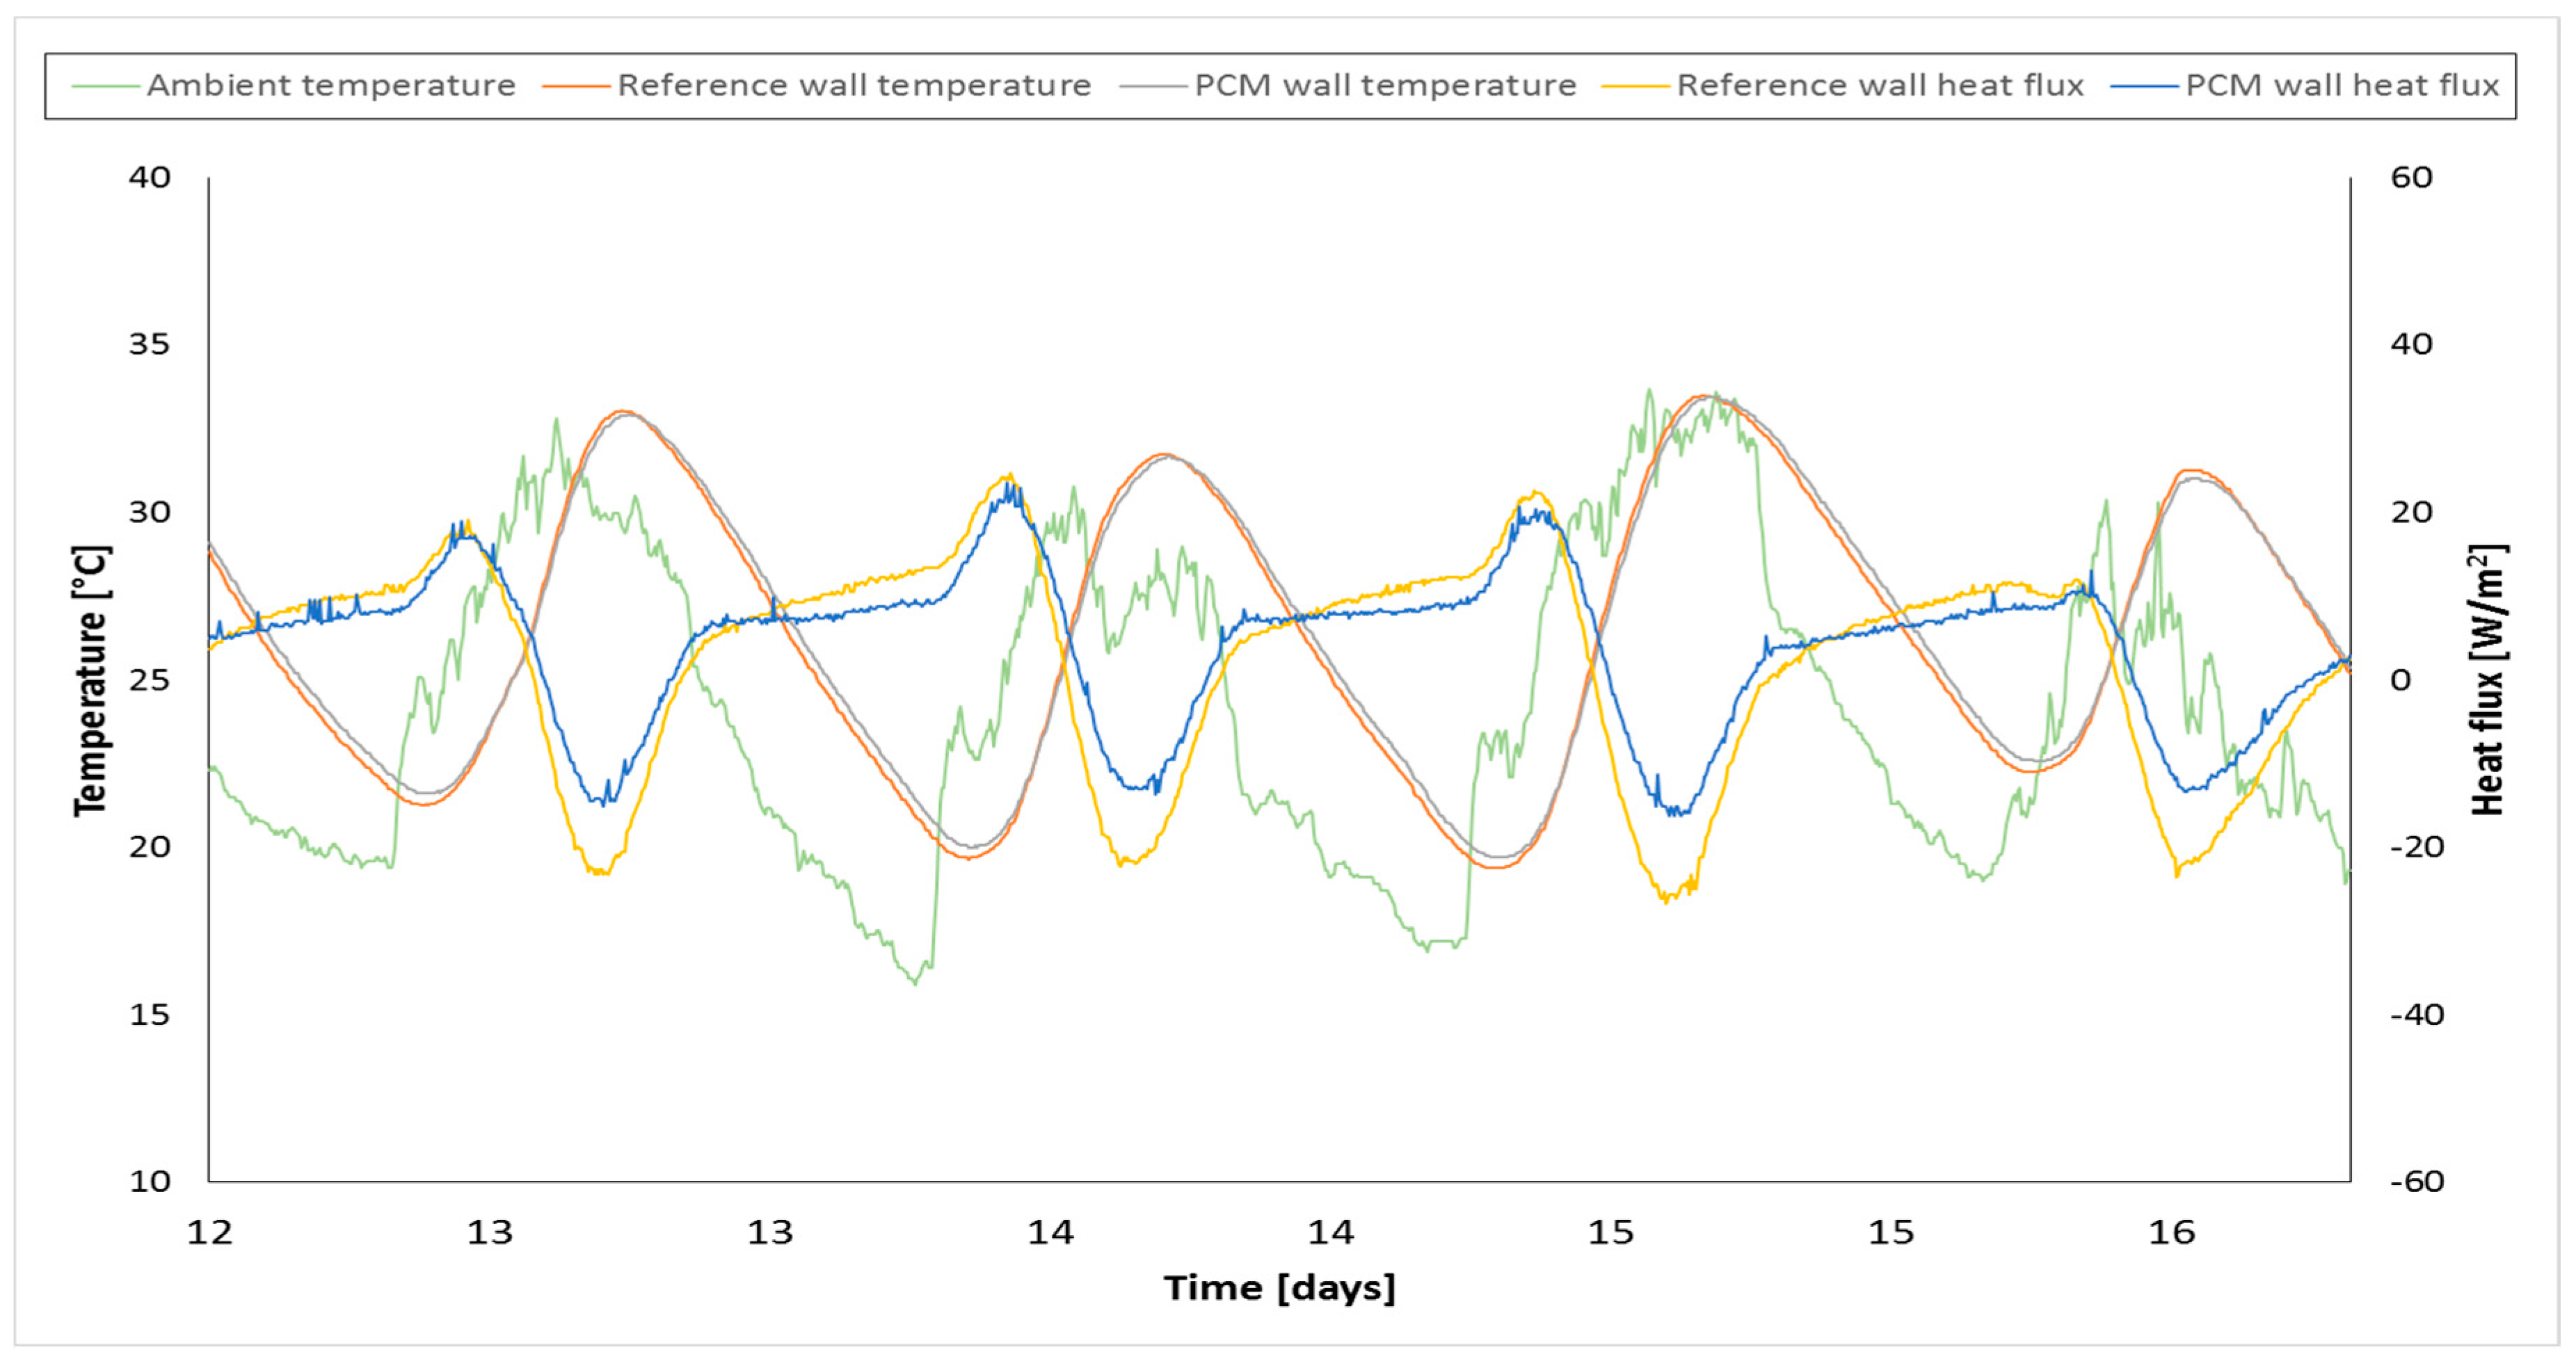
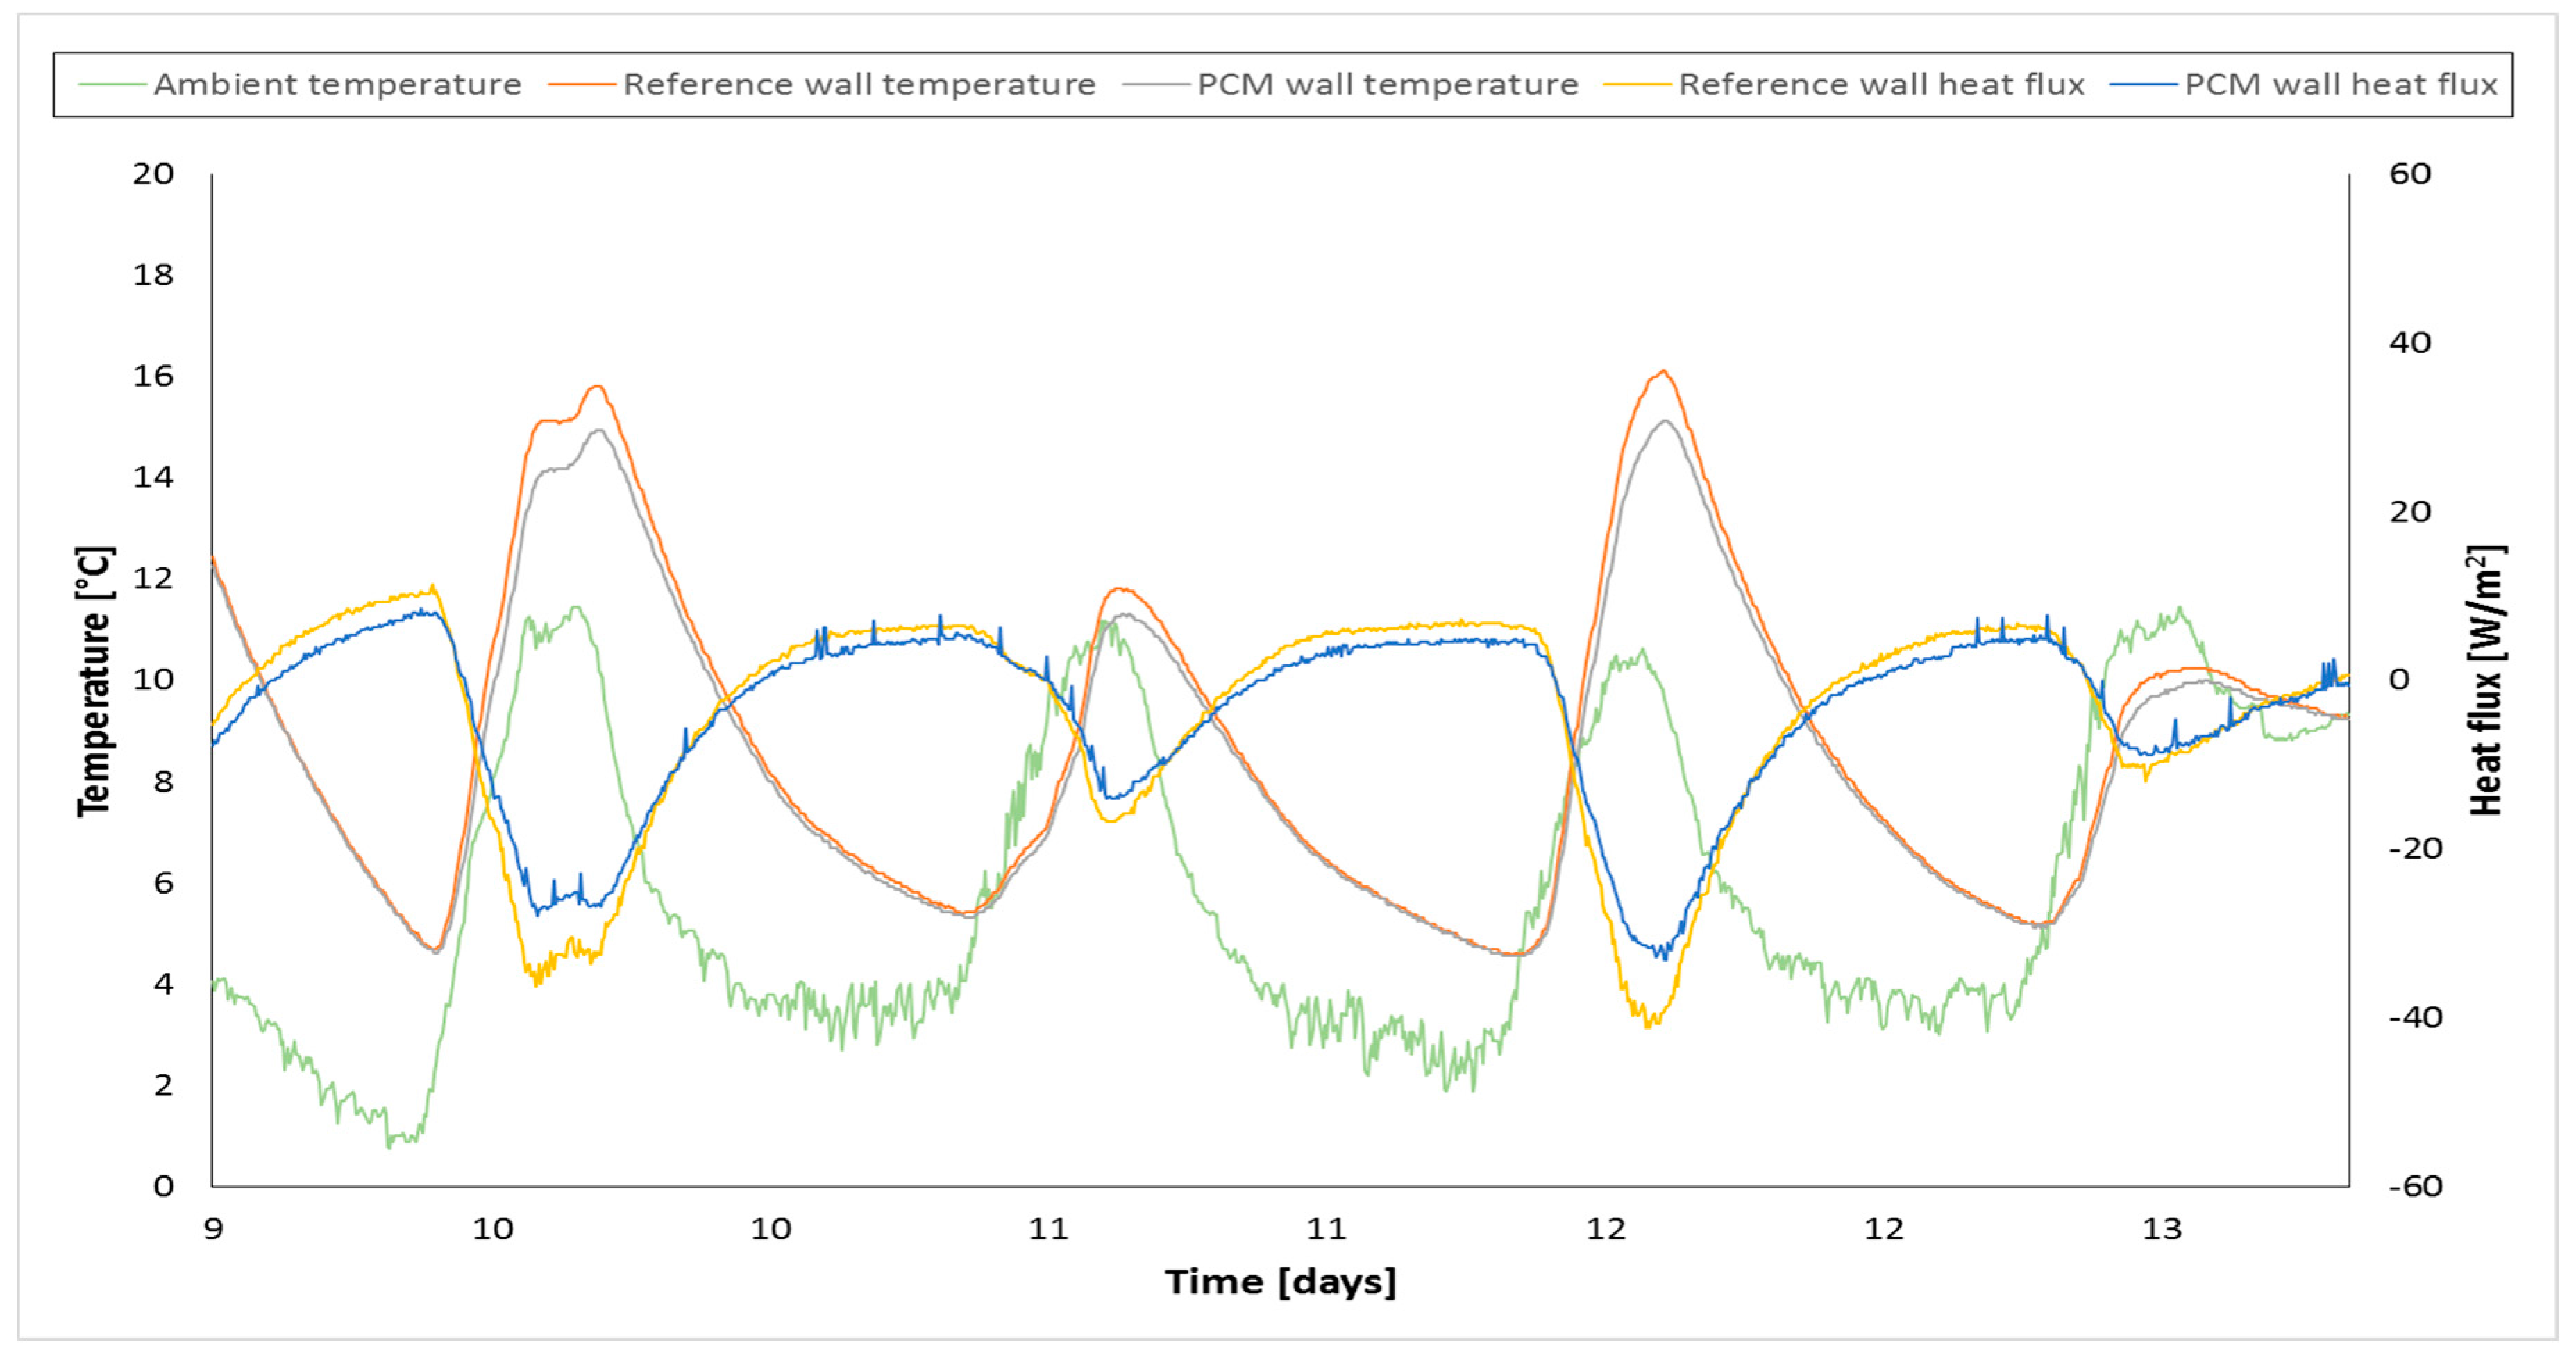
The following graphs depict the data collected from the heat flux sensors, the weather station, and the temperature sensors located on the vertical middle line of the south panels, 1 metre above the ground. The heat flux density was measured at the midpoint of the walls. The first figure shows results obtained from both the reference (without the PCM) and the PCM-added cubicles in July, and the second figure shows the results from December.
Data from both graphs were collected over four days; thus, the outdoor temperature rises and falls four times. All temperatures ascended during the daytime and descended during the night, although the changes in temperature did not occur at exactly the same time each day. With an increasing outdoor temperature, the PCM receives energy, and it changes phase from solid to liquid, thereby storing this energy. At night, the outdoor temperature decreases, and the material releases the stored energy, changing its phase from liquid to solid. A data analysis is presented below.
First, the effect of the PCM on the inner surface temperature is clearly different for each season. In the winter, there is a difference between the temperature ranges of the walls with and without the PCM. The wall without the PCM experiences a temperature range 1 °C wider than the wall with PCM due to the energy absorption from the PCM. Heat is supplied to this material, and its phase changes from solid to liquid at constant temperature; therefore, the energy absorbed in this process does not lead to a temperature increase. In the summer, the difference is less remarkable because of the season’s higher temperature. The PCM’s melting point is 23 °C, and the ambient temperature is over this value most of the time. For this reason, this PCM is nearly ineffective in these conditions. Nevertheless, the PCM’s wall temperature is below the reference at maximum and above the reference at minimum due to the aforementioned the phase change process.
As a result of the reduction of the temperature range triggered by the PCM, it is easier to keep a constant indoor temperature since the influence of outdoor conditions are limited. This means that lower energy consumption is required from heat pumps or other air conditioning systems for maintaining indoor comfort.
The maximum wall temperature difference in
Figure 6 is 1 °C. The wall with the PCM presents lower temperatures than the reference, and the gap between them is larger at peaks, when there is a maximum temperature.
In winter, the temperature peak is delayed approximately 1 h for the PCM wall due to its higher thermal inertia. In winter, the temperatures in the morning are quite similar (when they are rising), but the effect becomes significant during the rest of the day. This is appreciable in
Figure 6, particularly for the peaks. In the summer (
Figure 7), data follow the same pattern, but the temperature curves almost overlap. However, a delay can also be seen at the peaks and troughs. The delay with respect to ambient temperature for both cubicle temperatures is linked to concrete thermal inertia.
The graphs show the heat flux densities through the south walls. Positive values represent the heat moving from the outside to the inside of the cubicles through the south wall, and negative values represent the heat moving from the inside to the outside. When a panel with the PCM receives direct sunlight, the PCM melts, and the panel’s heat flux density is lower than that of a wall without the PCM in both cases (summer and winter) because of the energy stored inside the wall from the phase change process. This energy is released at night, when the material phase changes from liquid to solid, increasing the heat flux density. Once again, the effect is more visible in winter due to the relation between outdoor temperatures and the PCM’s melting point.
As a result, the energy consumption to maintain a comfortable temperature is reduced if a PCM is added to the building materials. When the ambient temperature rises, a percentage of the energy transferred to the wall is stored in it as phase change, reducing the heat flux and allowing an easier conditioning of the cabin. The energy stored is released when the ambient temperature drops, increasing the heat flux and allowing for easier climate conditioning since the indoor temperature does not vary as much as the ambient temperature.
As hypothesised, adding PCM to building materials is linked to a reduction of the energy consumed to achieve an indoor comfort temperature. It contributes to inhibiting the effect of the ambient temperature by storing energy in the wall.
5. Conclusions
This work presents and verifies an acquisition and monitoring system operation. The system was developed in order to obtain real-time data from buildings and to allow remote control of the system. Interest in this application is growing lately due to the need for energy efficient buildings, and the setup described excels with its simplicity, accuracy, and operator integration into the process.
The communication technology chosen was a 1-wire bus network. It creates a simple, fast, and economically feasible acquisition system from sensors; additionally, it allows for the adding, swapping, or removing of an element from the setup at any time. It presents a more simple and economical solution than other technologies that offer similar services, such as wireless communication systems, which require the calibration of the devices. Moreover, the system tested presents a low noise level, and the number of measuring devices that can be integrated into the bus is virtually unlimited. The data acquisition and monitoring system was SCADA, which grants real-time interaction with the user and remote supervision and control automatically.
Two cubicles were built with temperature sensors embedded in the walls, along with additional sensors, to prove that the data acquisition system works properly for this application. There is a reference cubicle made of self-compacting concrete closure panels and a second one made of self-compacting concrete with a microencapsulated phase change material (<1%). Currently, this kind of additive is widely used in building materials; the main purpose of these experimental tests was to prove that the acquisition system was able to register the enhancement provided by the PCM.
The results show what was expected relatively accurately. It should be taken into account that the amount of the PCM added to the panels is limited, so the difference between the cubicles is supposed to be narrow. Nevertheless, greater thermal inertia, a smaller temperature range, and different heat flux can be seen for the PCM walls in comparison to the reference walls, which agrees with the a priori assumptions and conclusions from other works [
11,
16,
17,
18,
19,
20].


