Experimental Investigation of the Condensation Heat Transfer Coefficient of R134a inside Horizontal Smooth and Micro-Fin Tubes

Abstract
:1. Introduction
2. Experimental Apparatus and Procedure
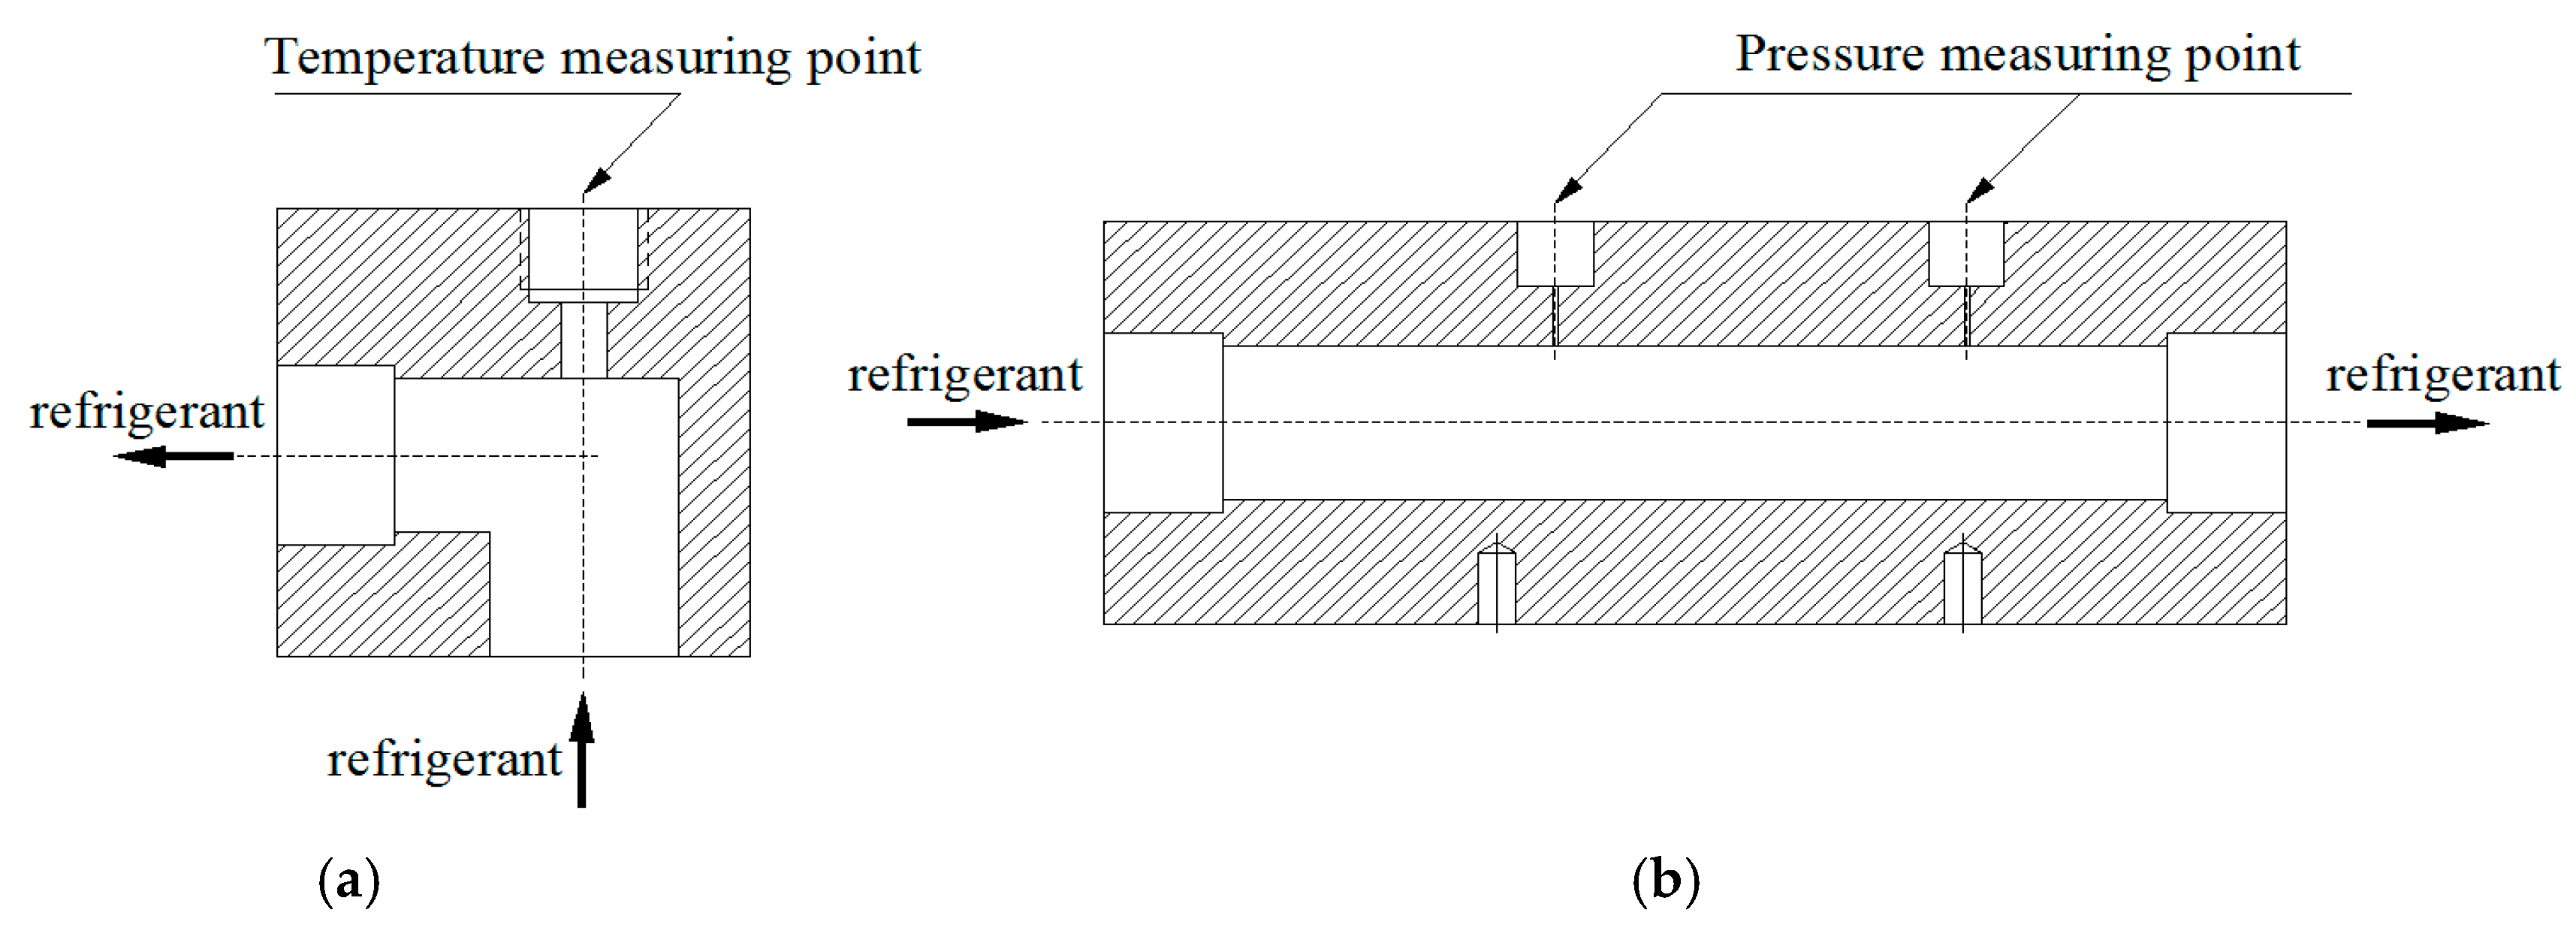
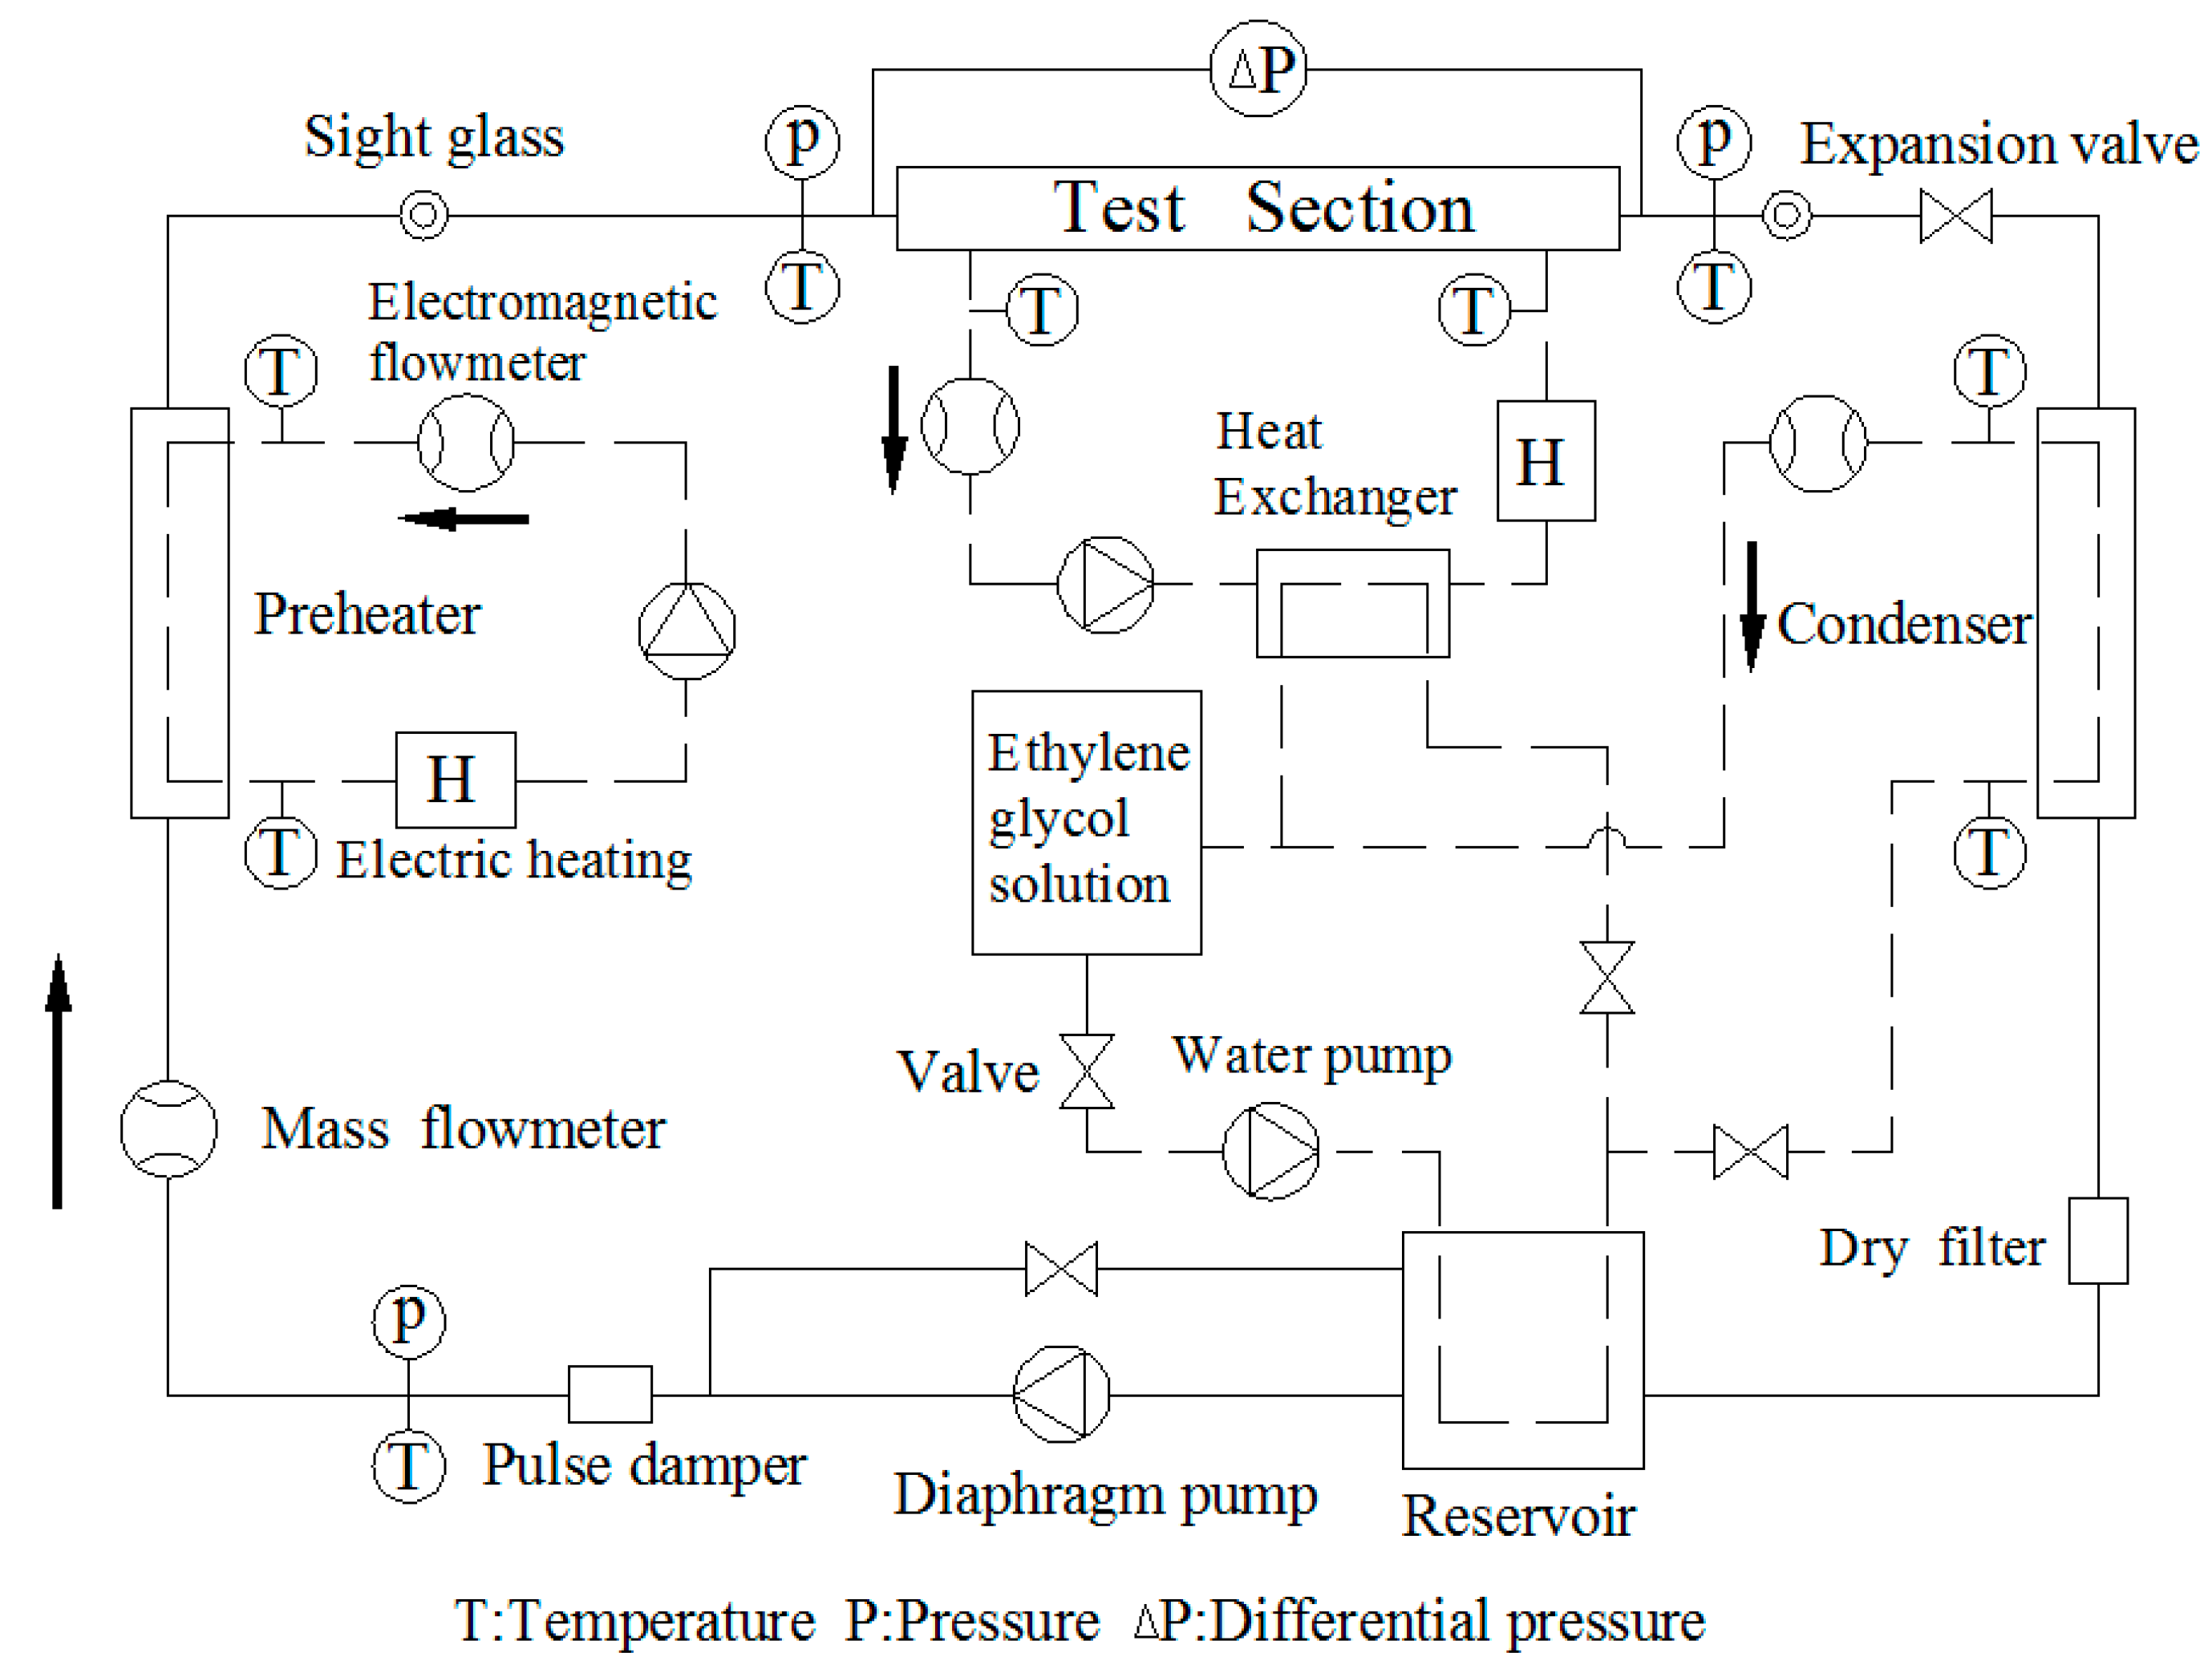
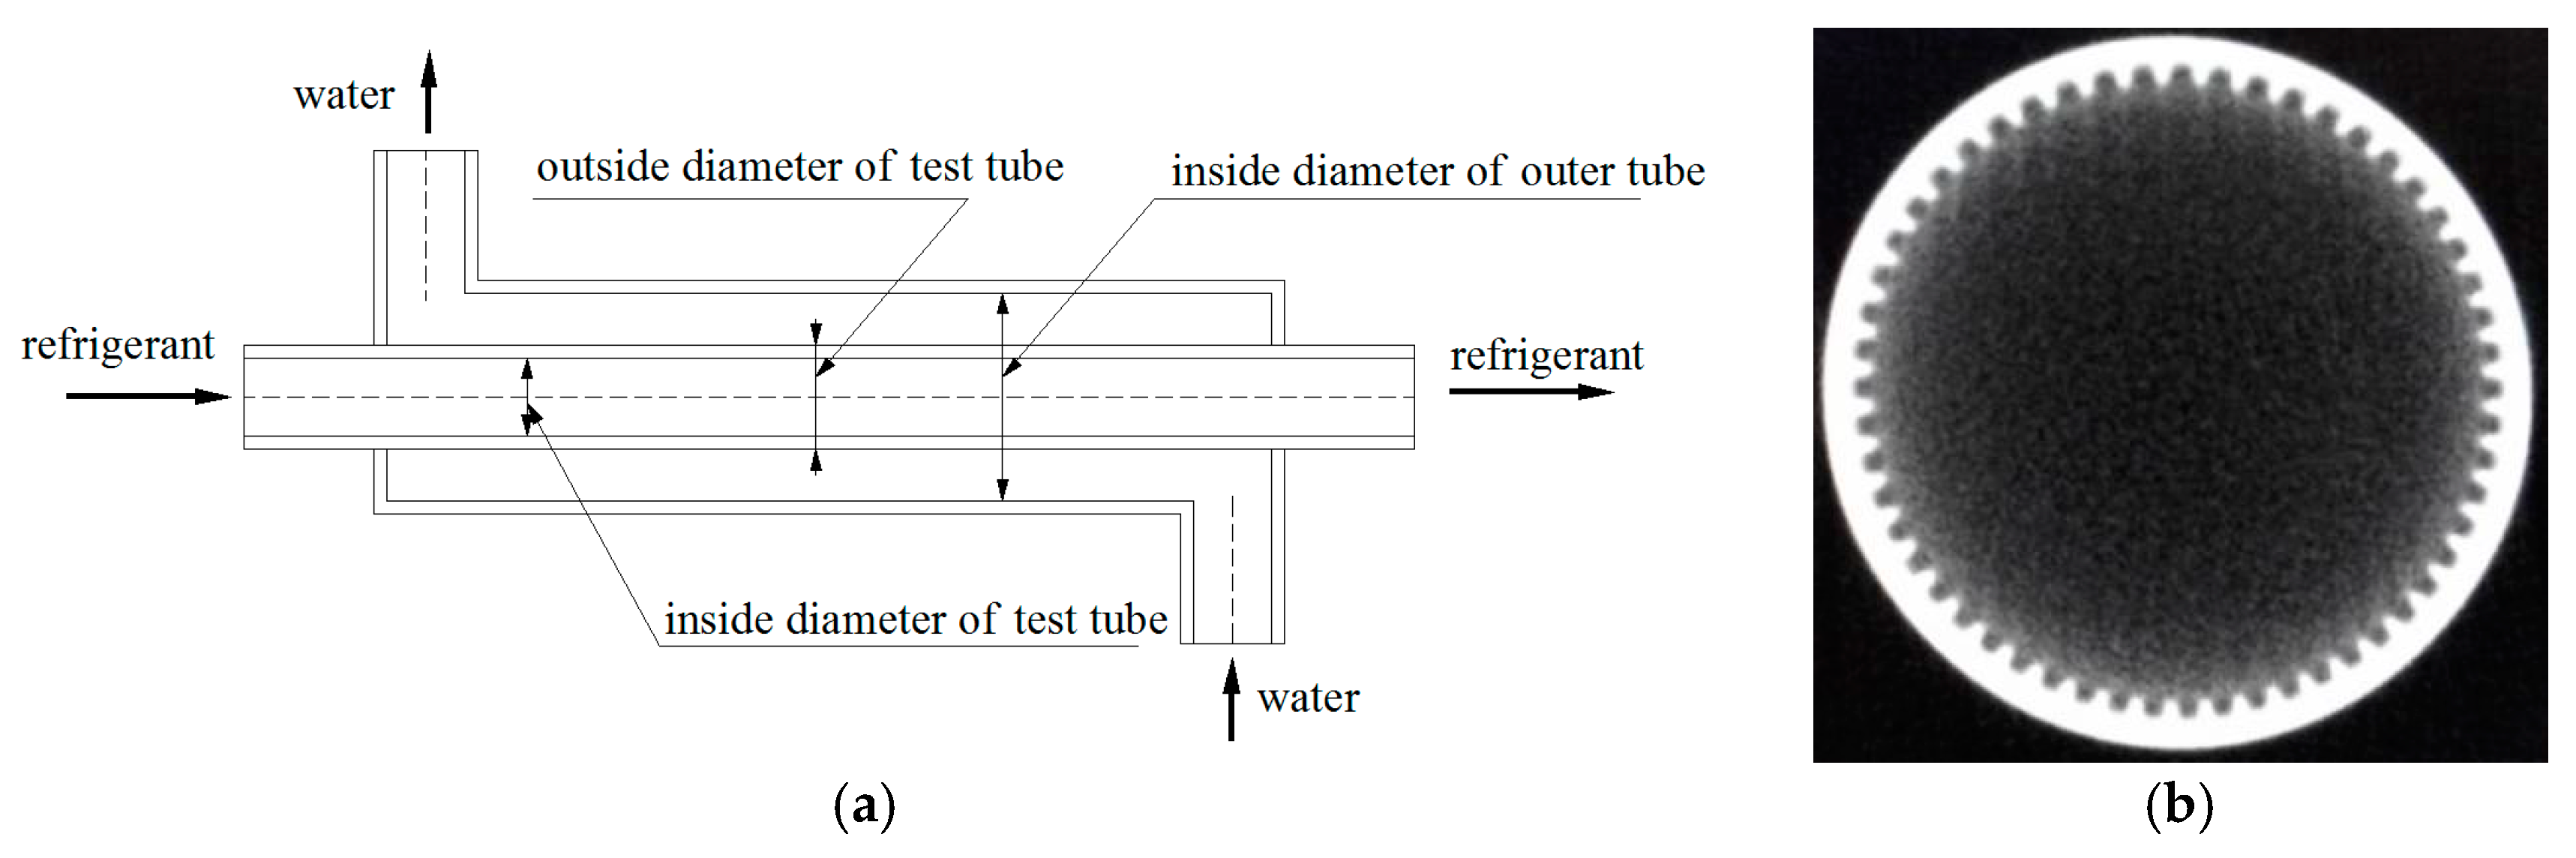
2.1. Experimental Setup
2.2. Data Reduction
3. Results and Analysis
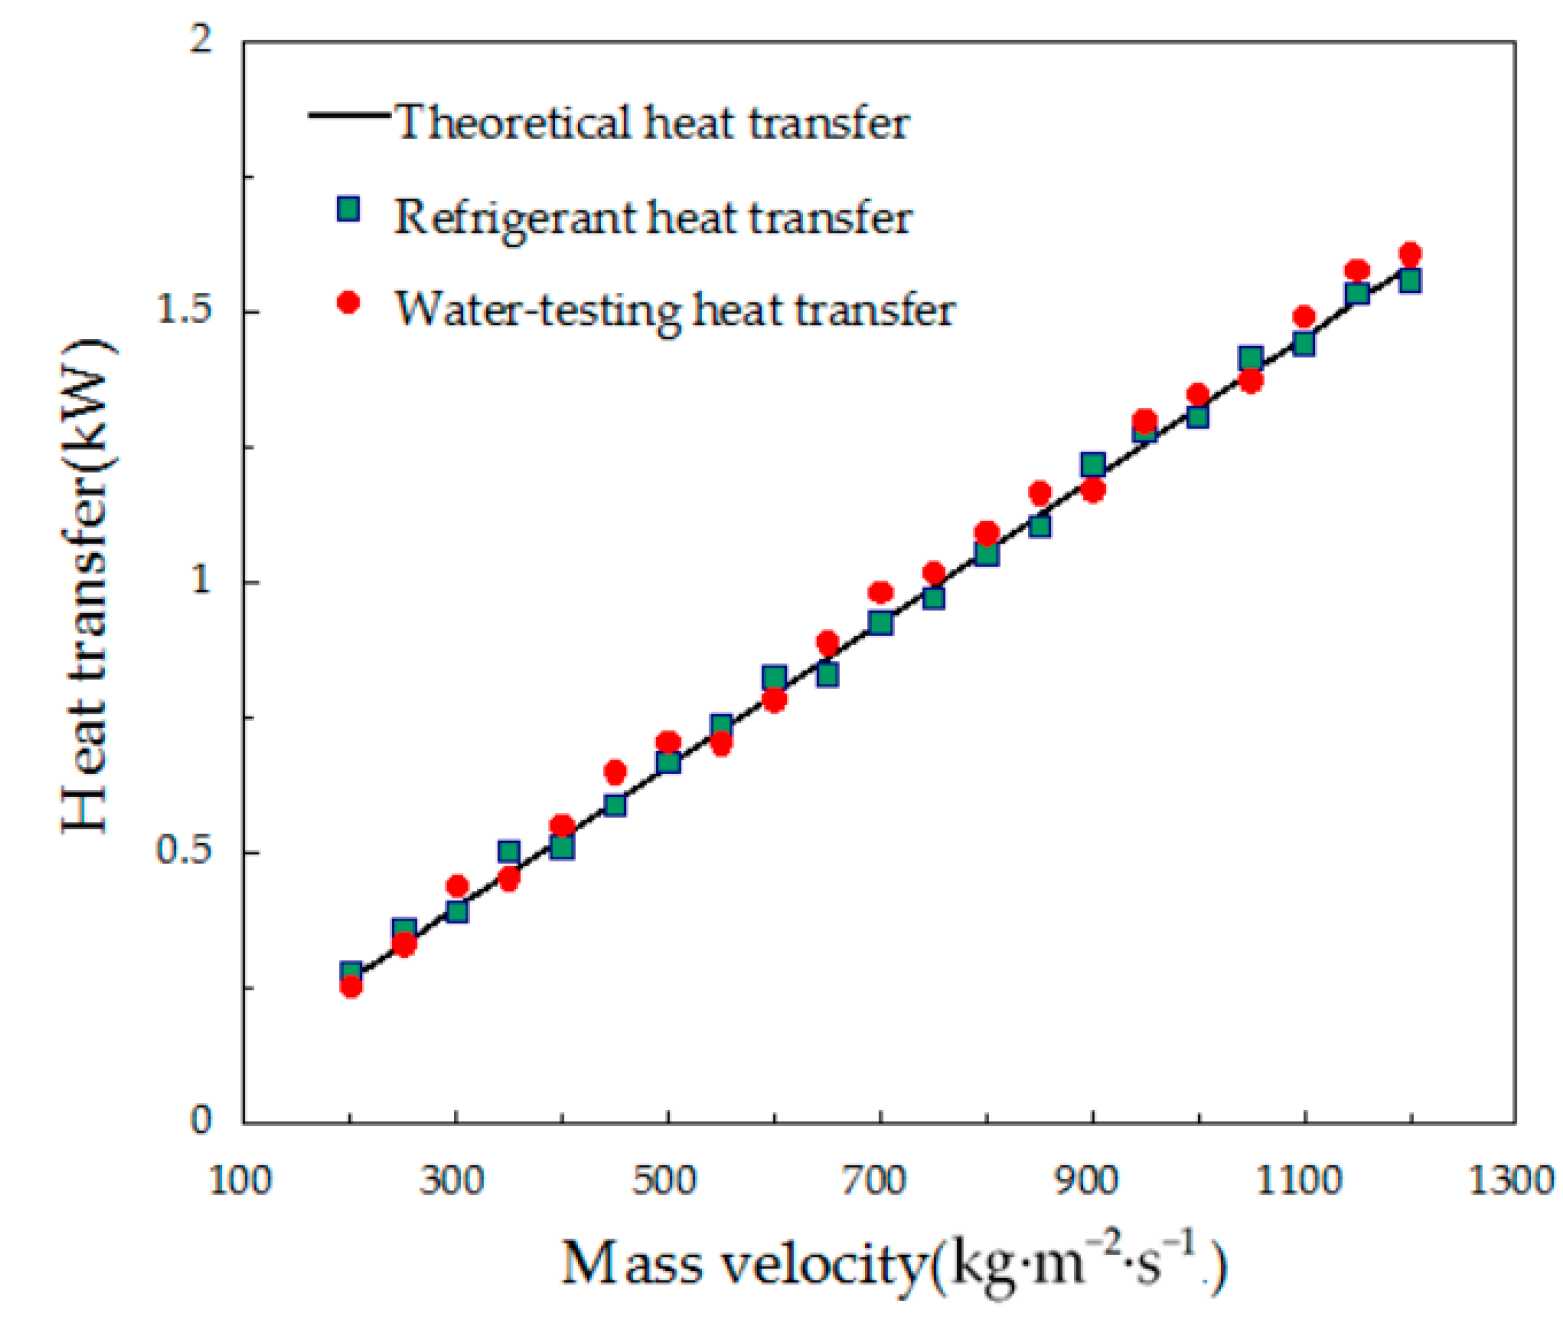
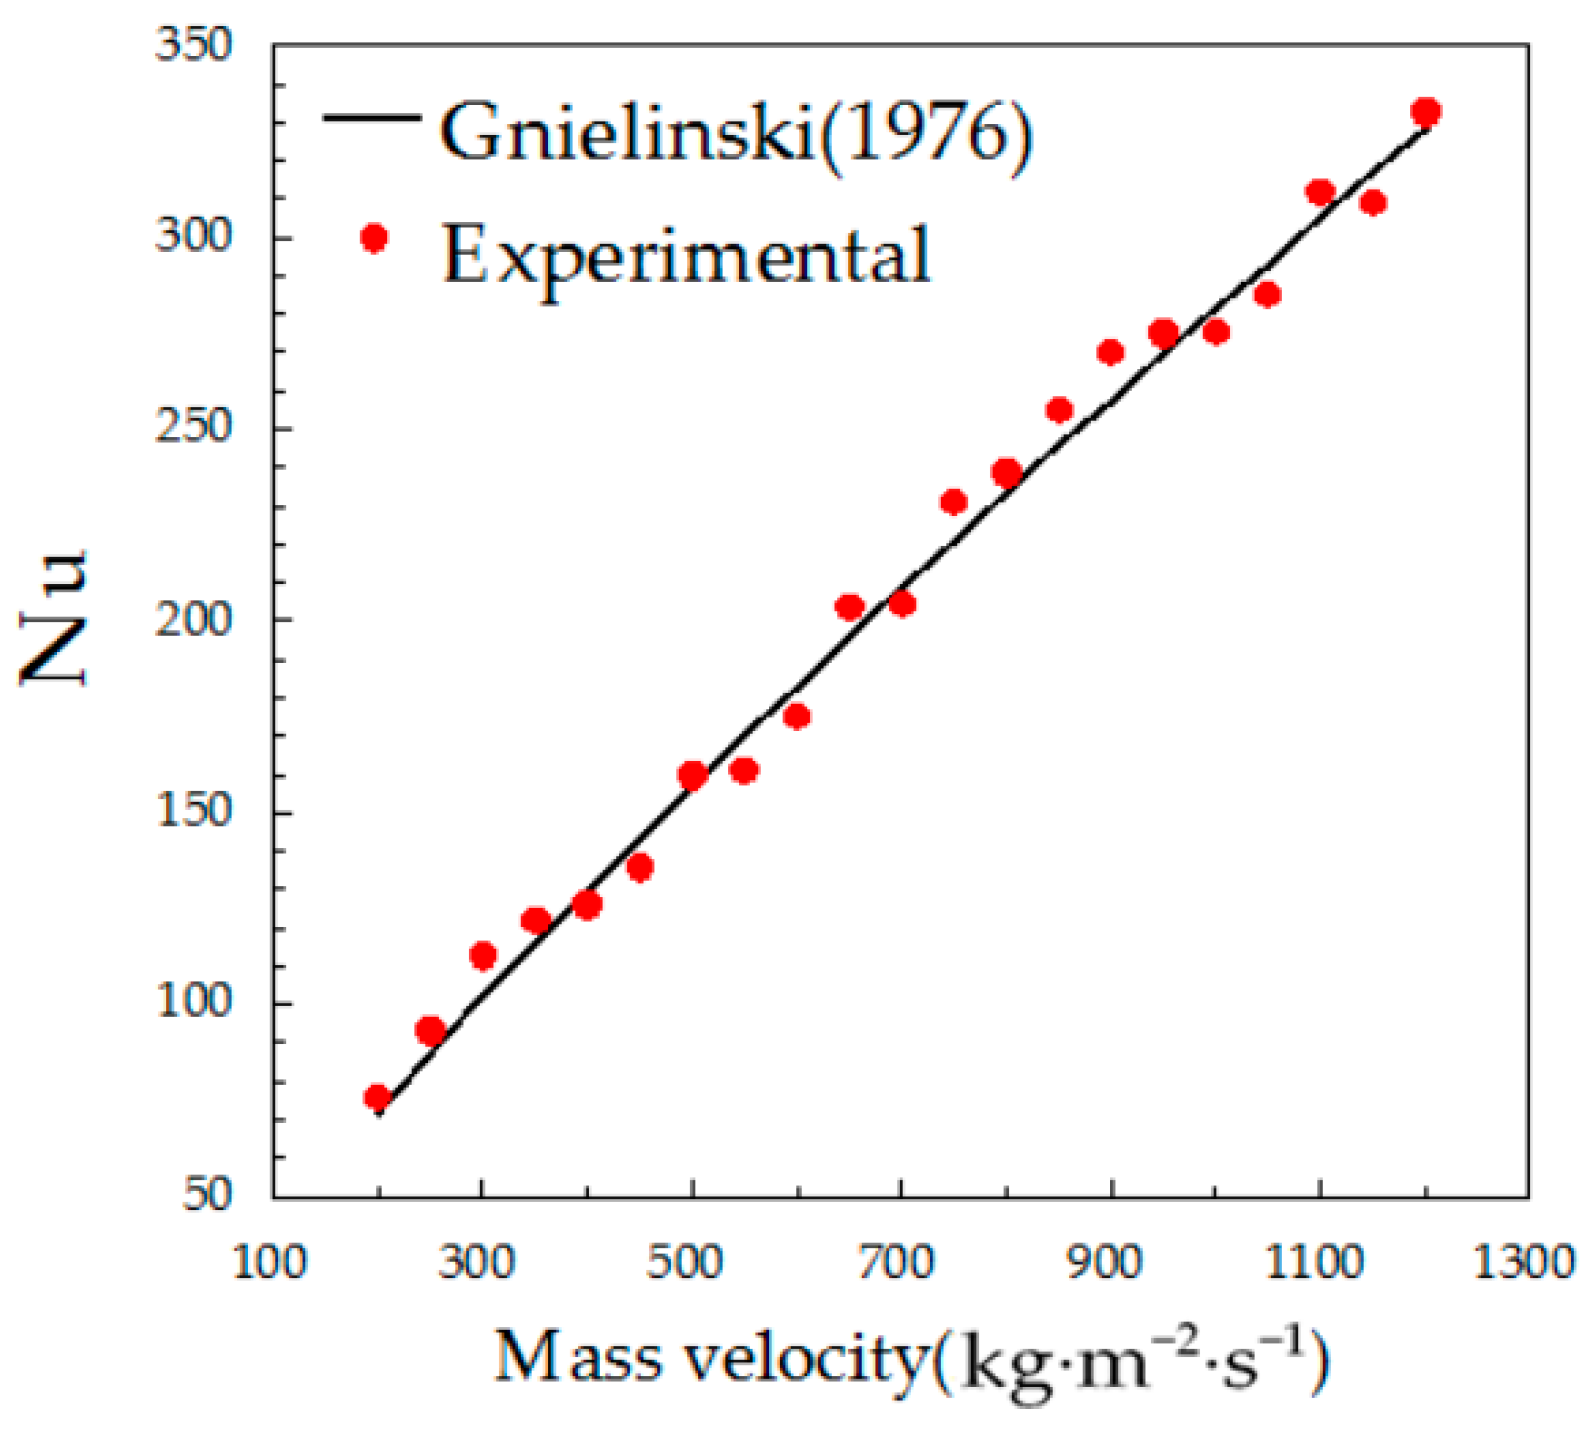
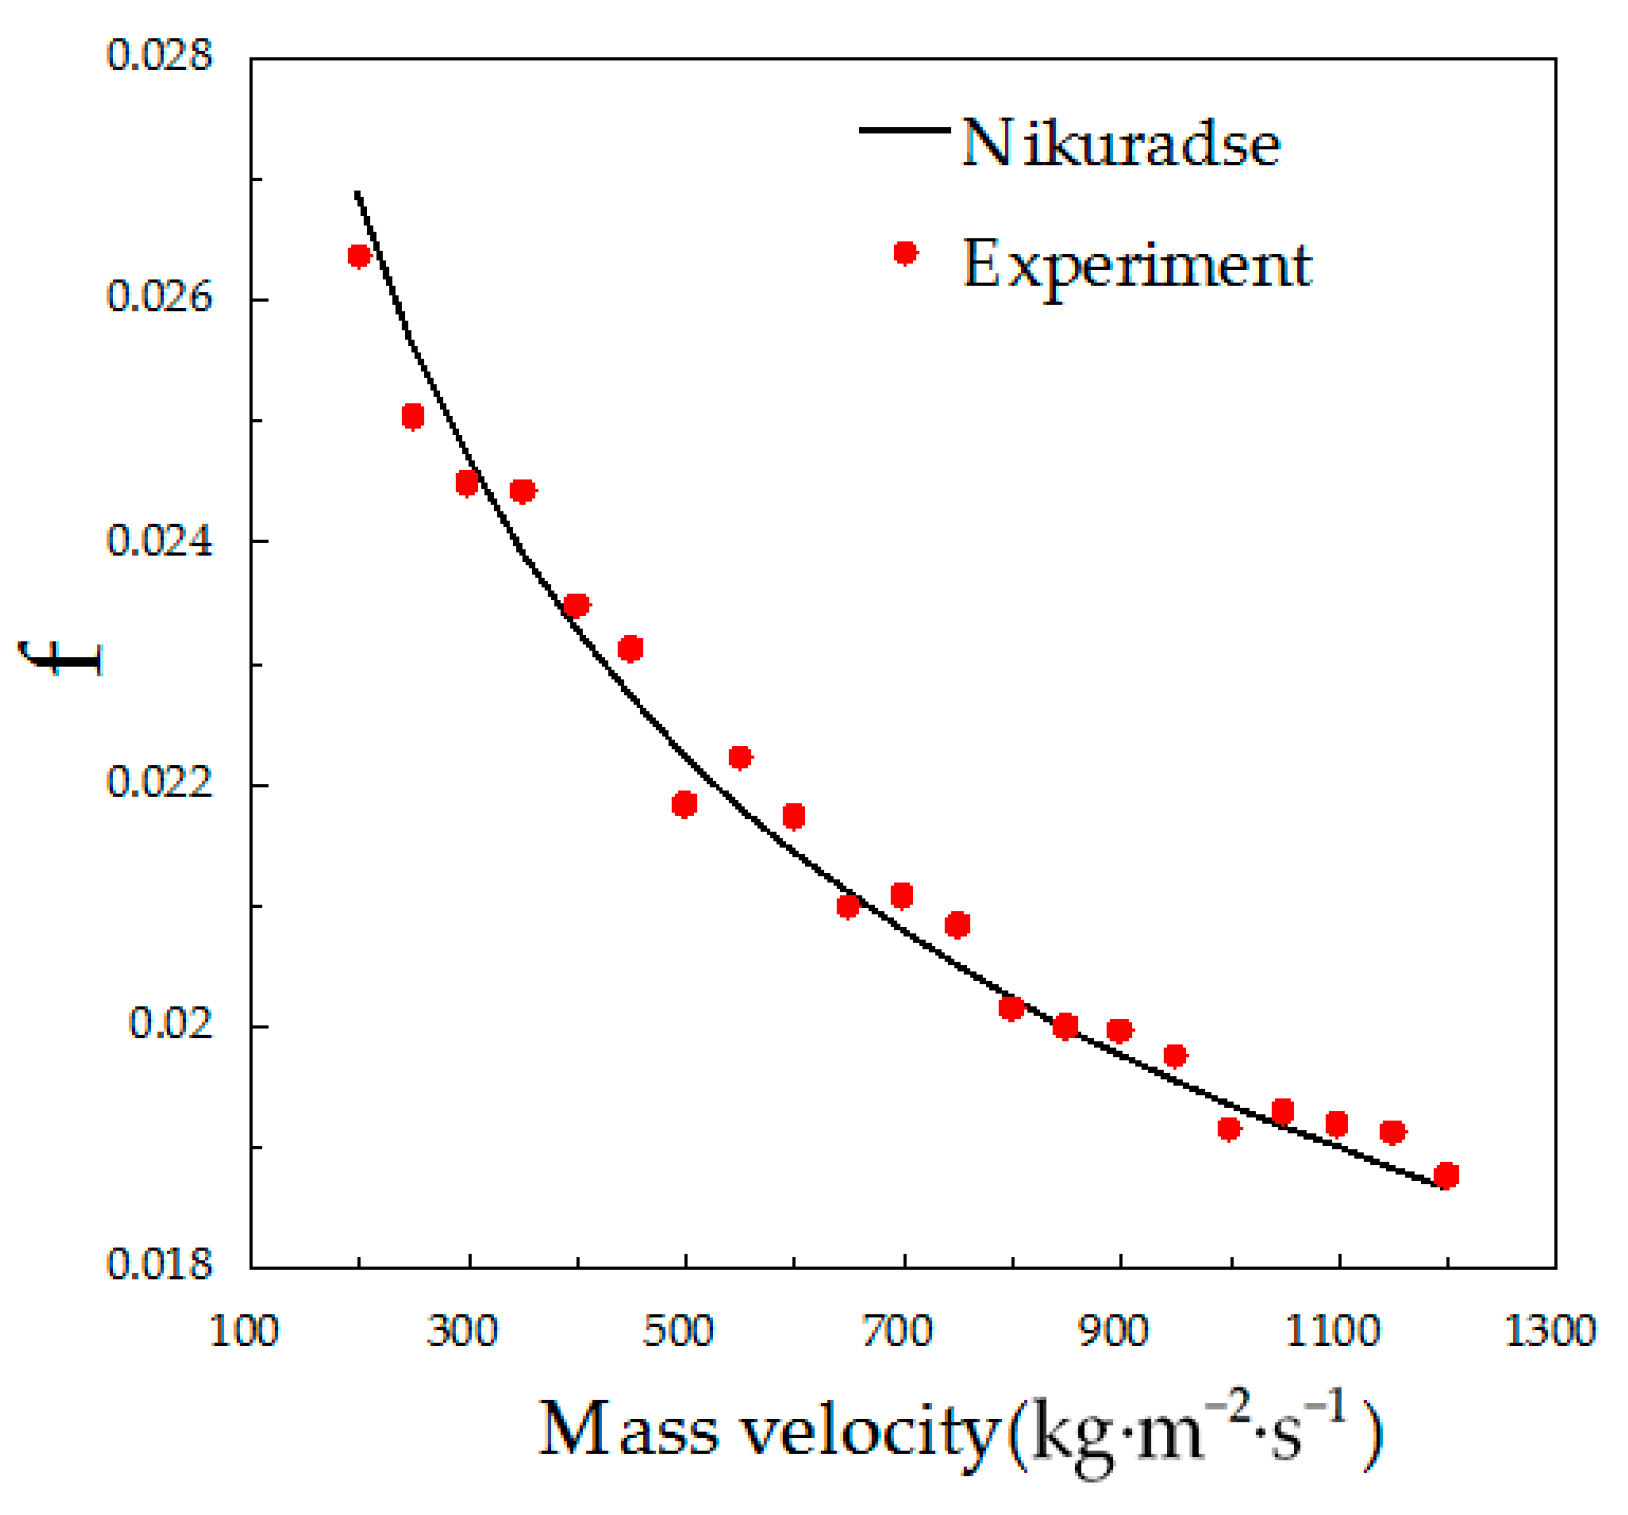
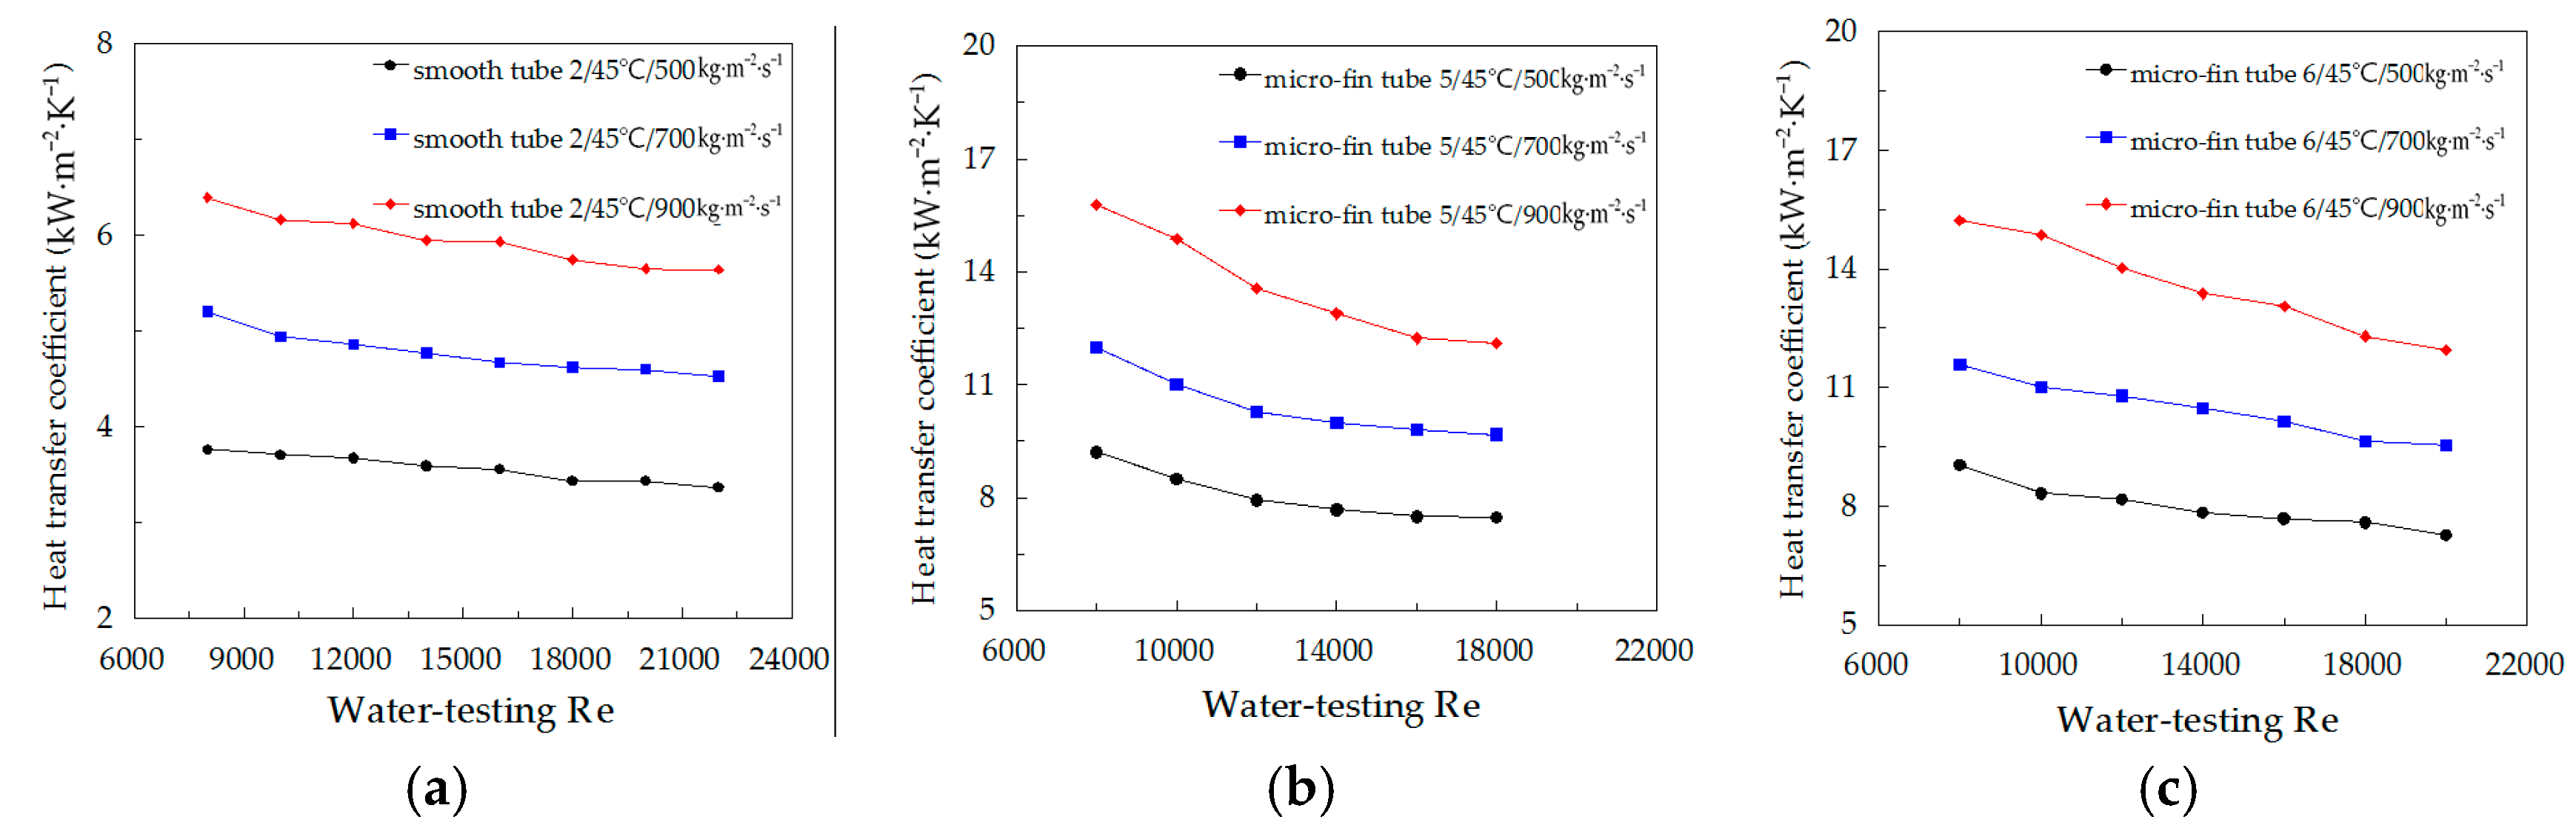
3.1. Single-Phase Heat Transfer Experiment
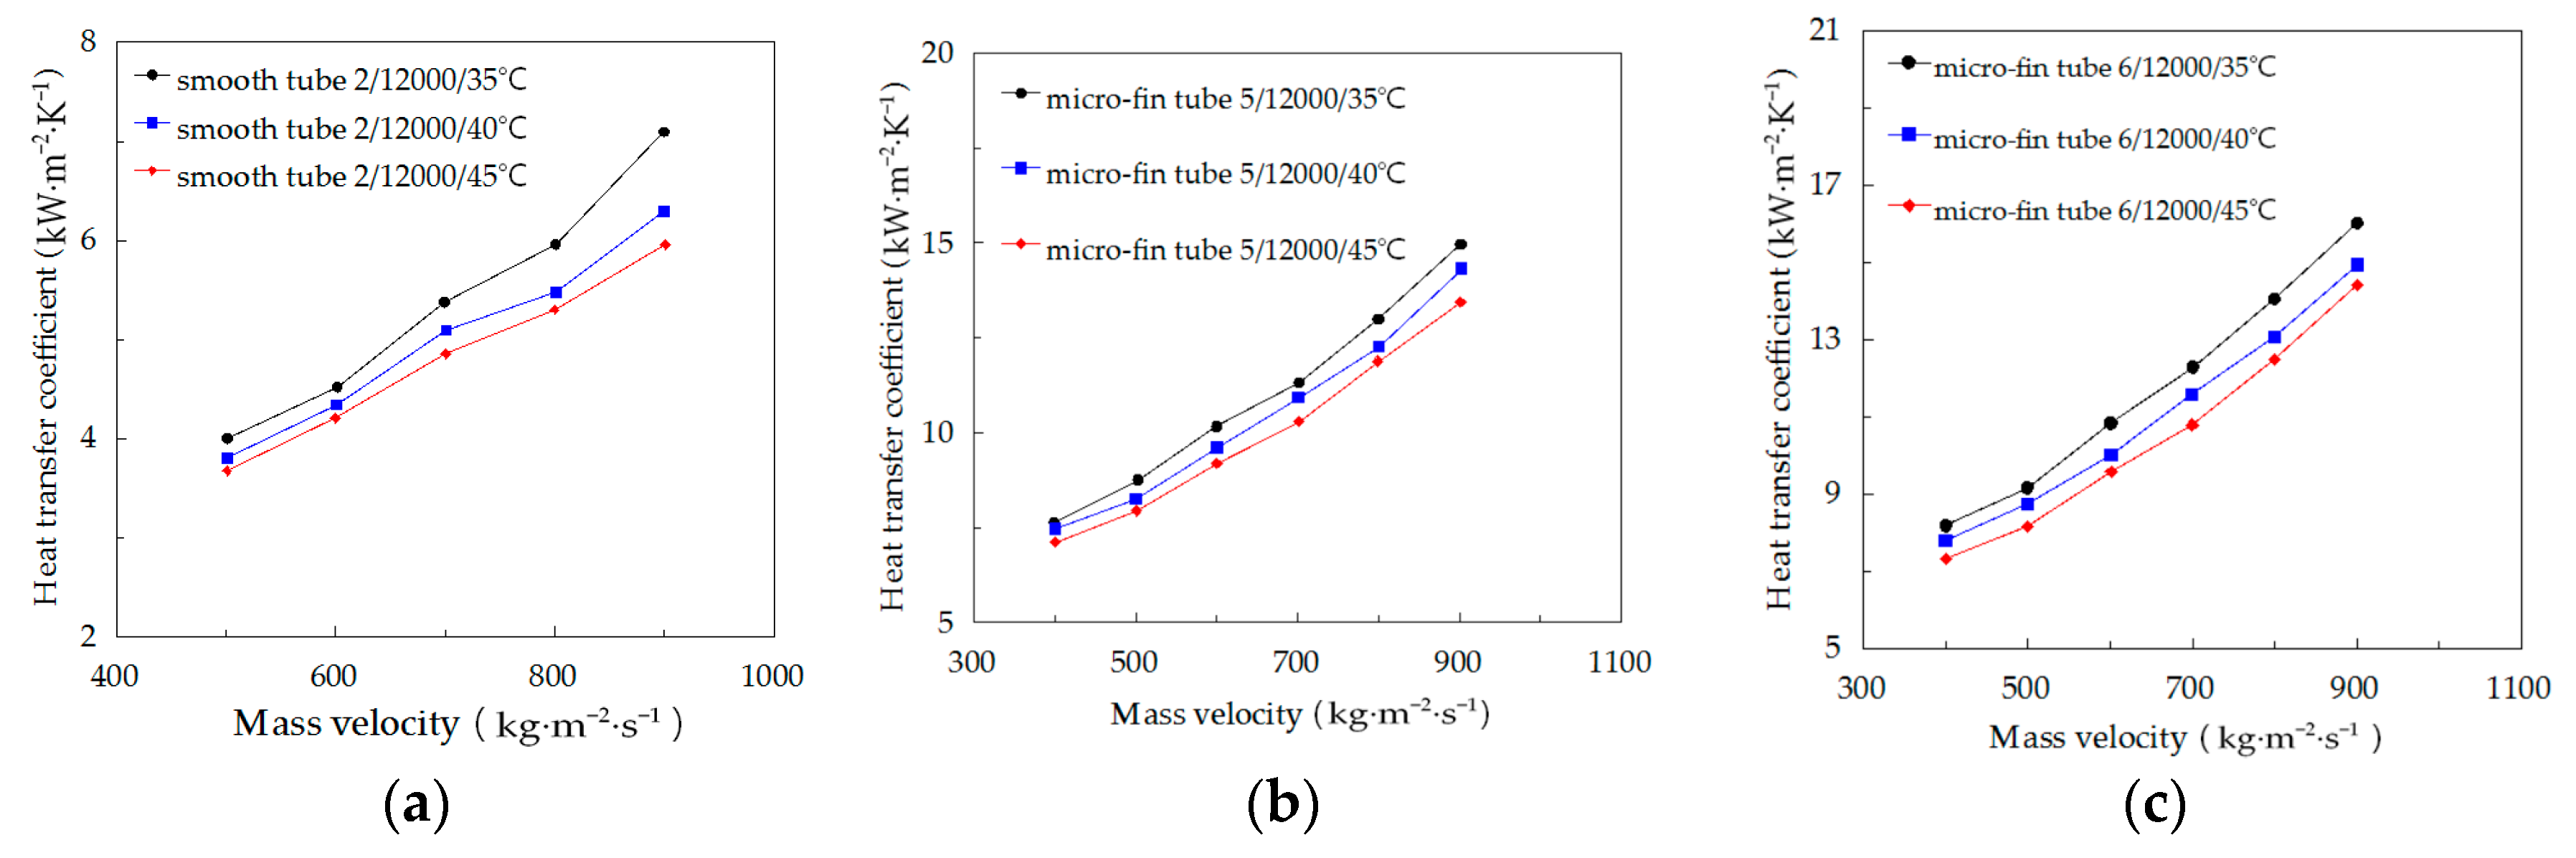
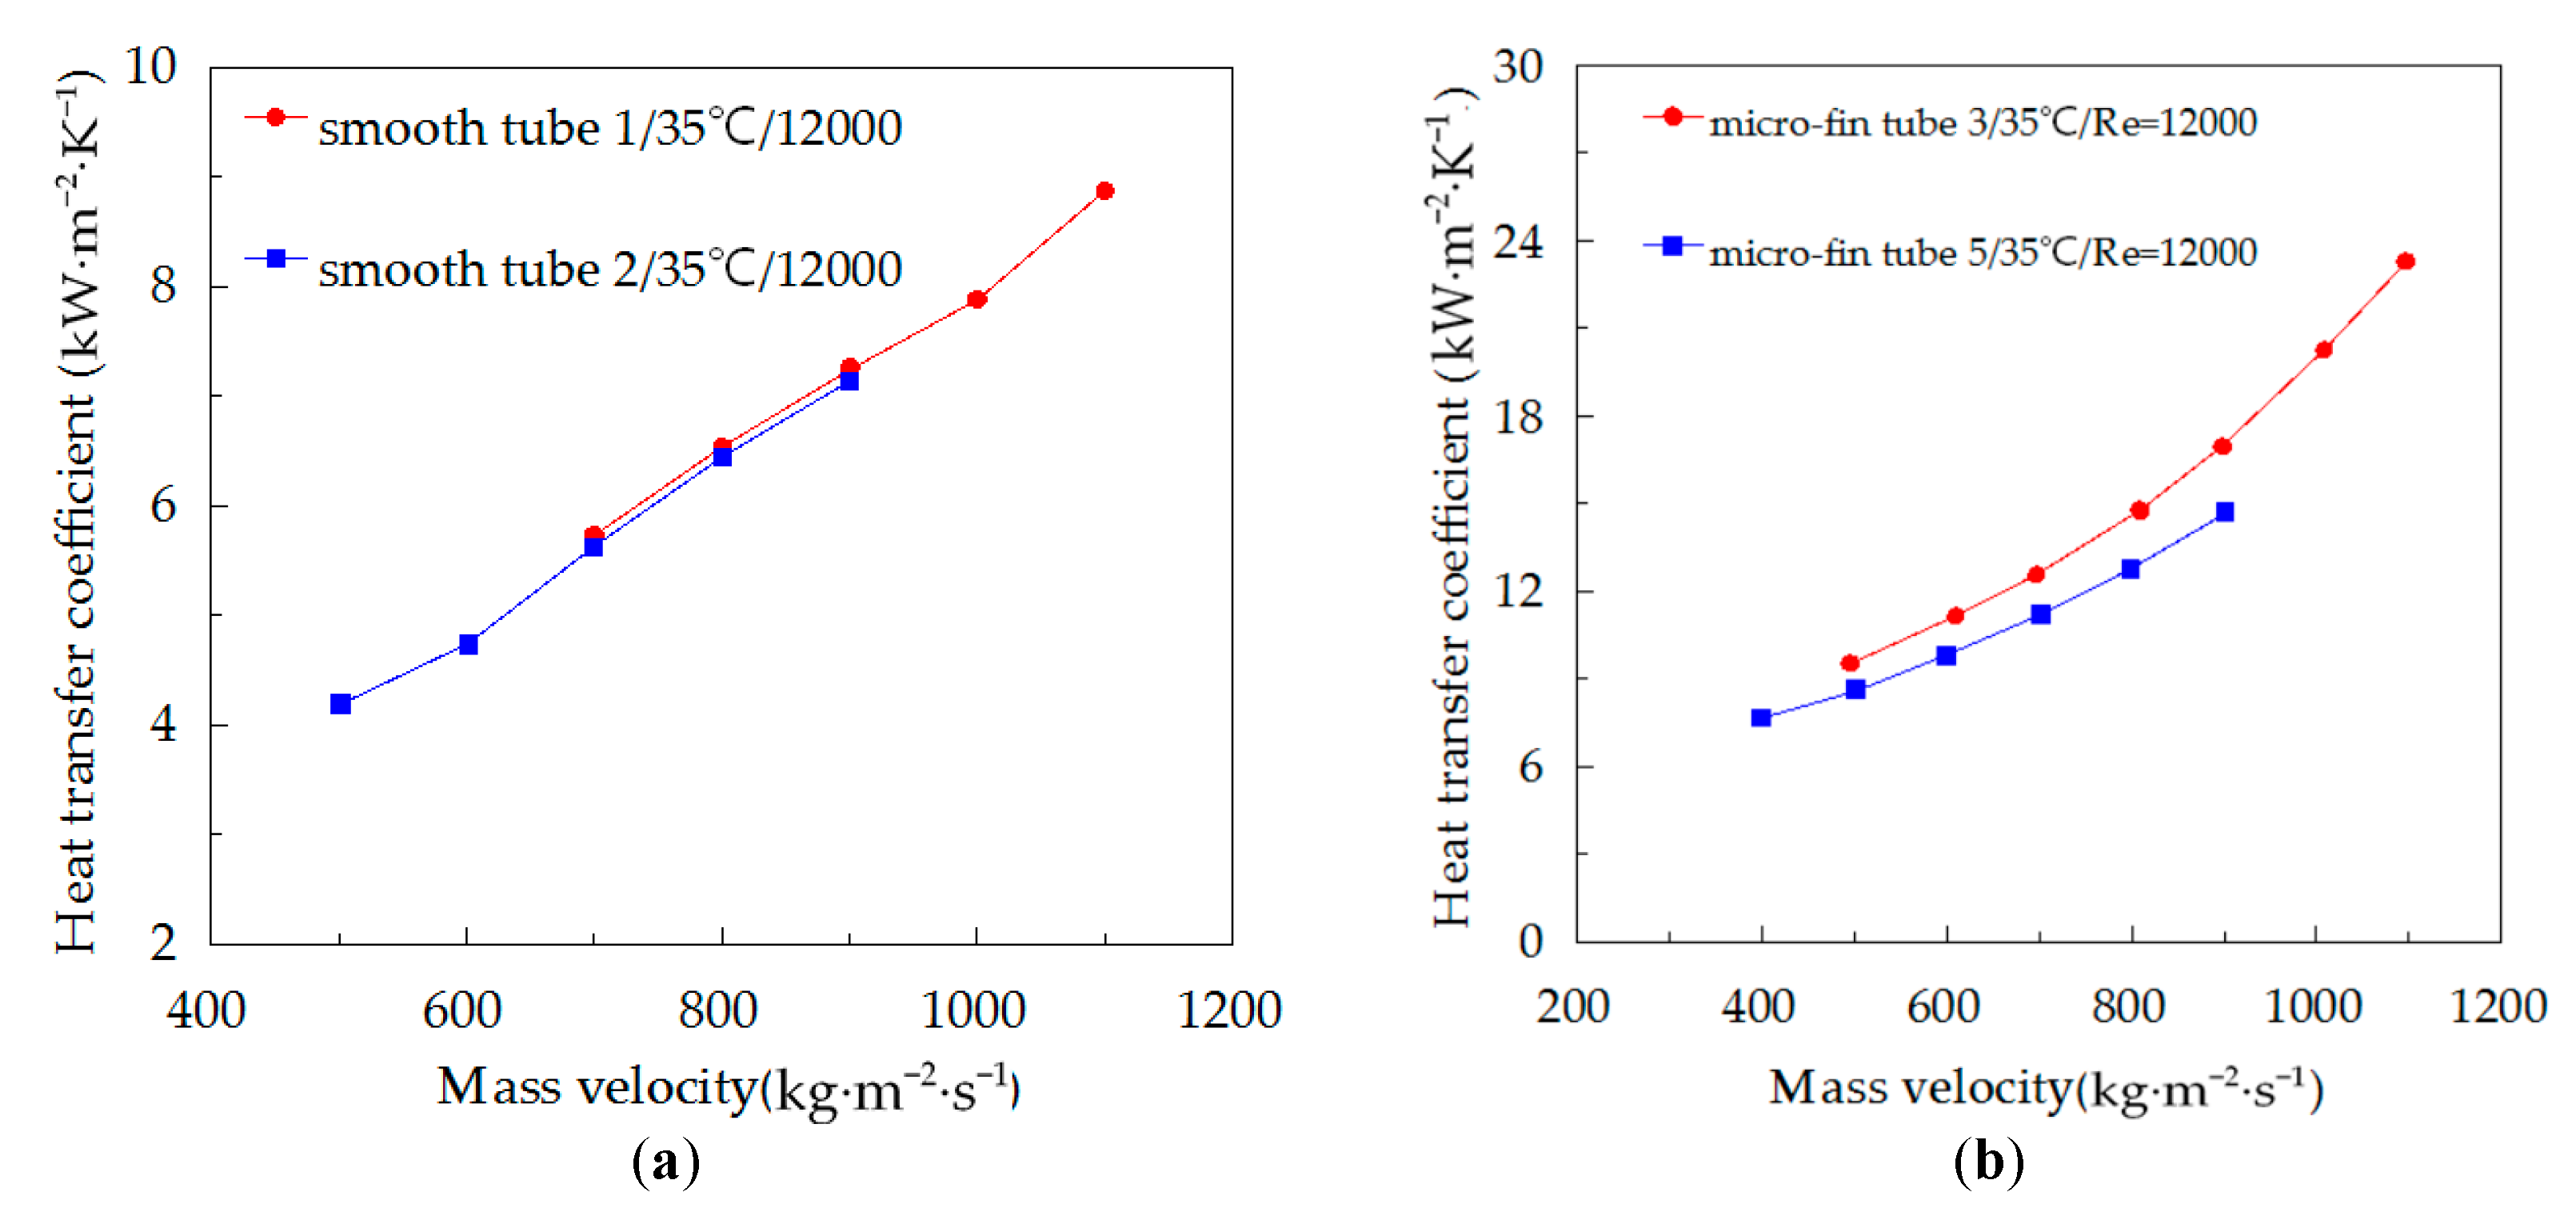
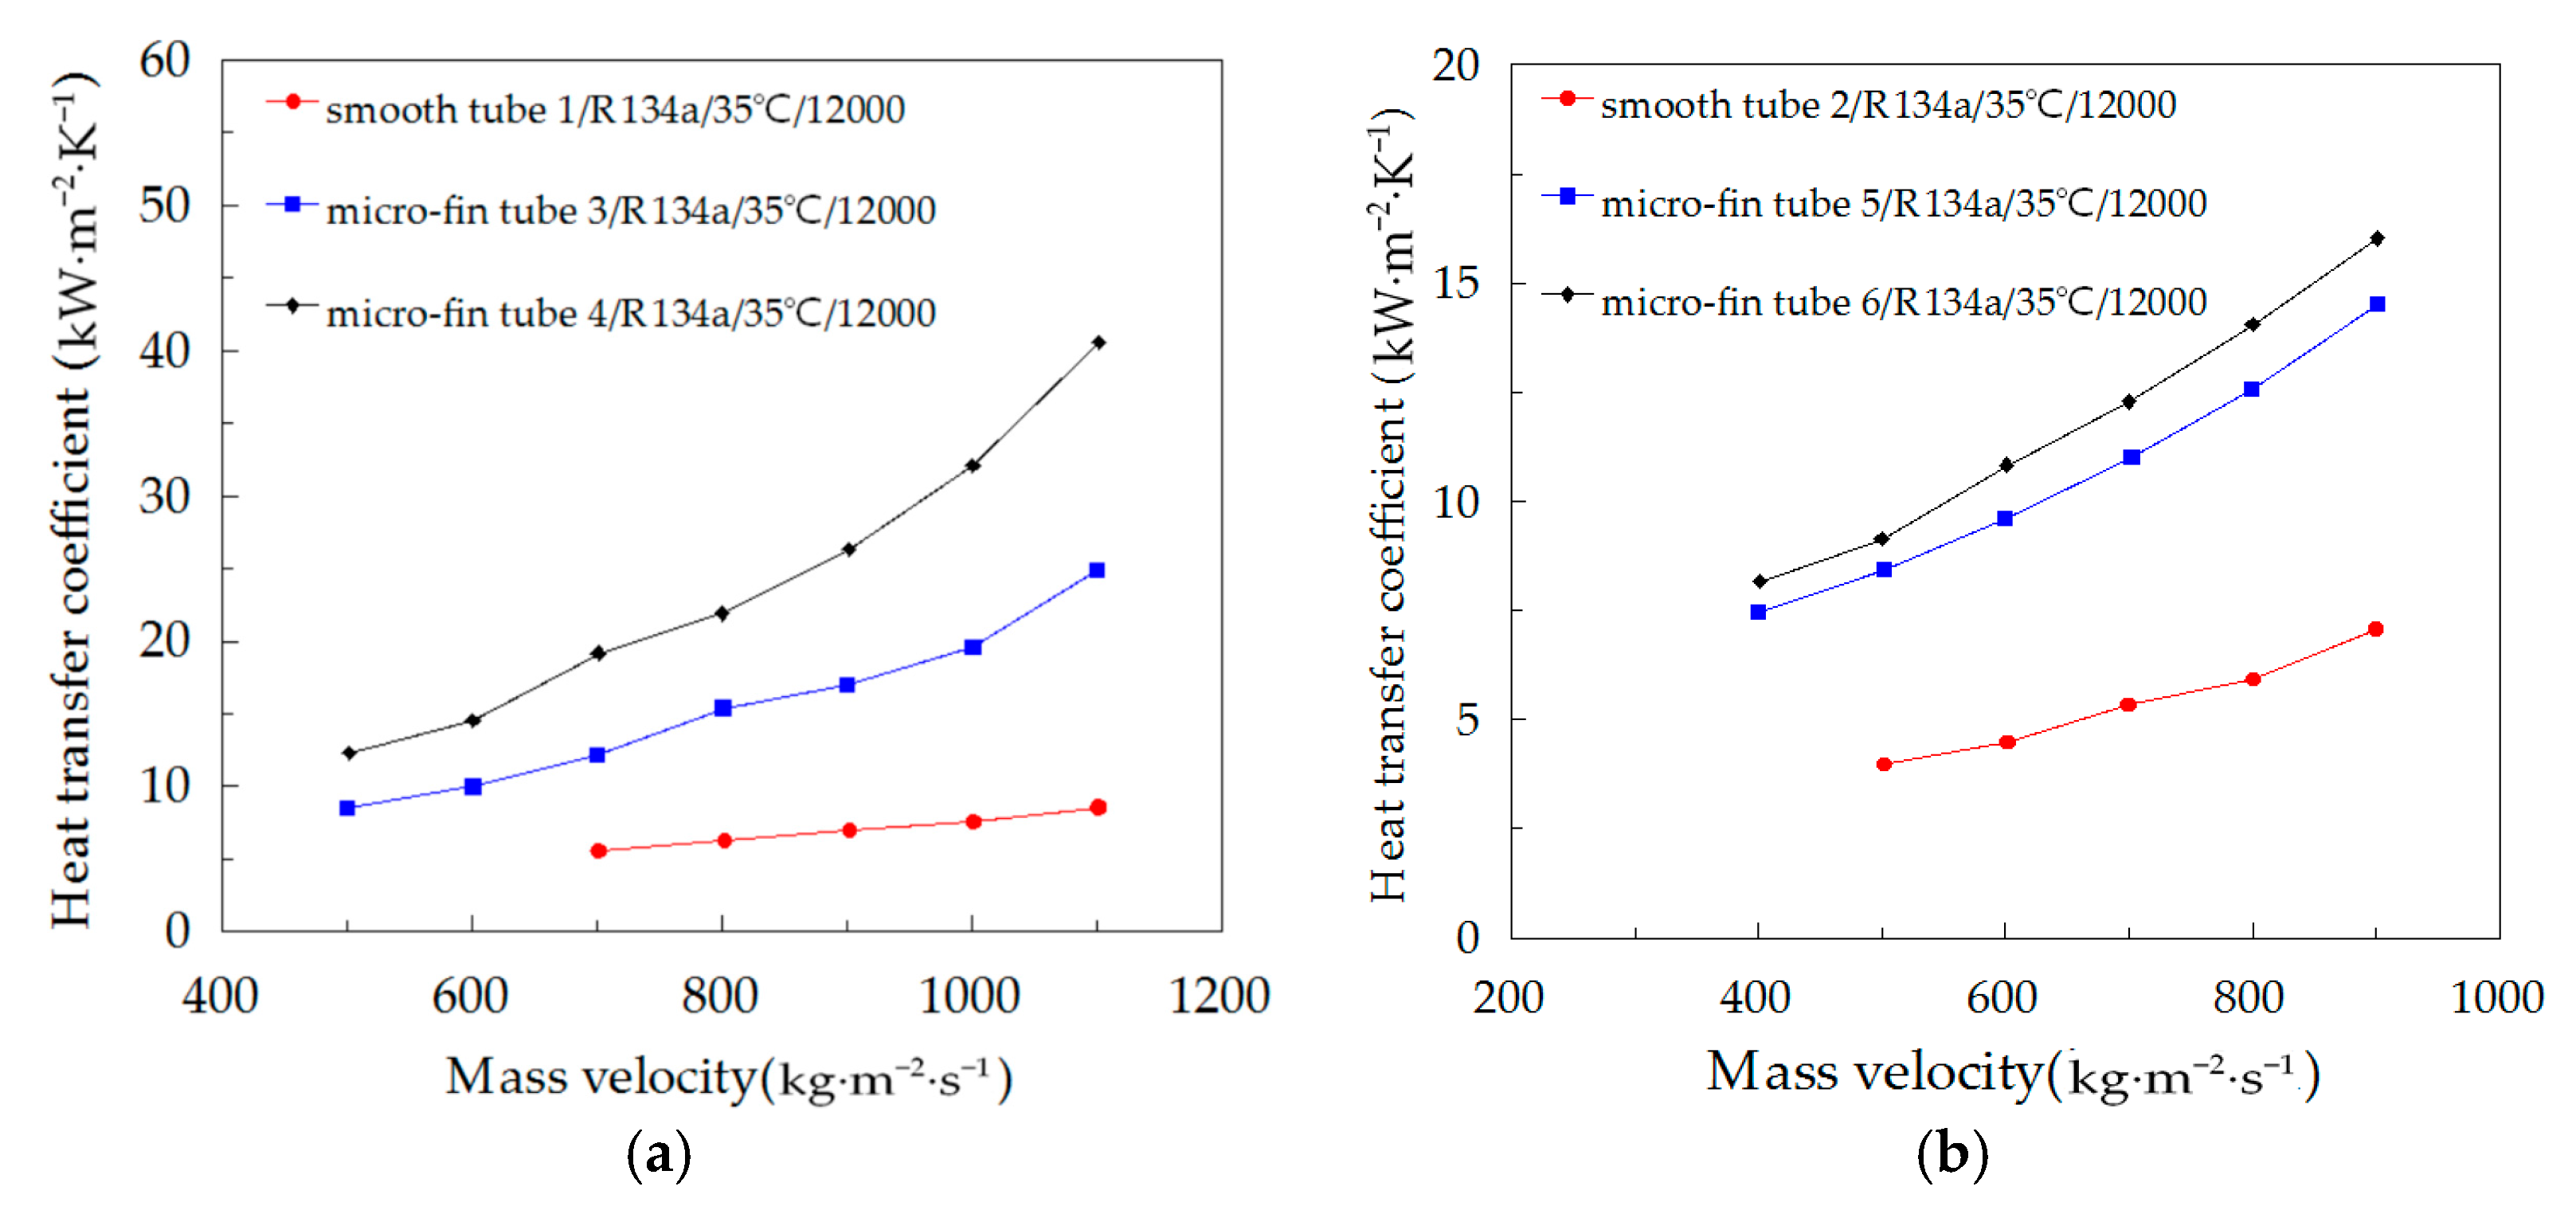
3.2. Two-Phase Heat Transfer Experiment
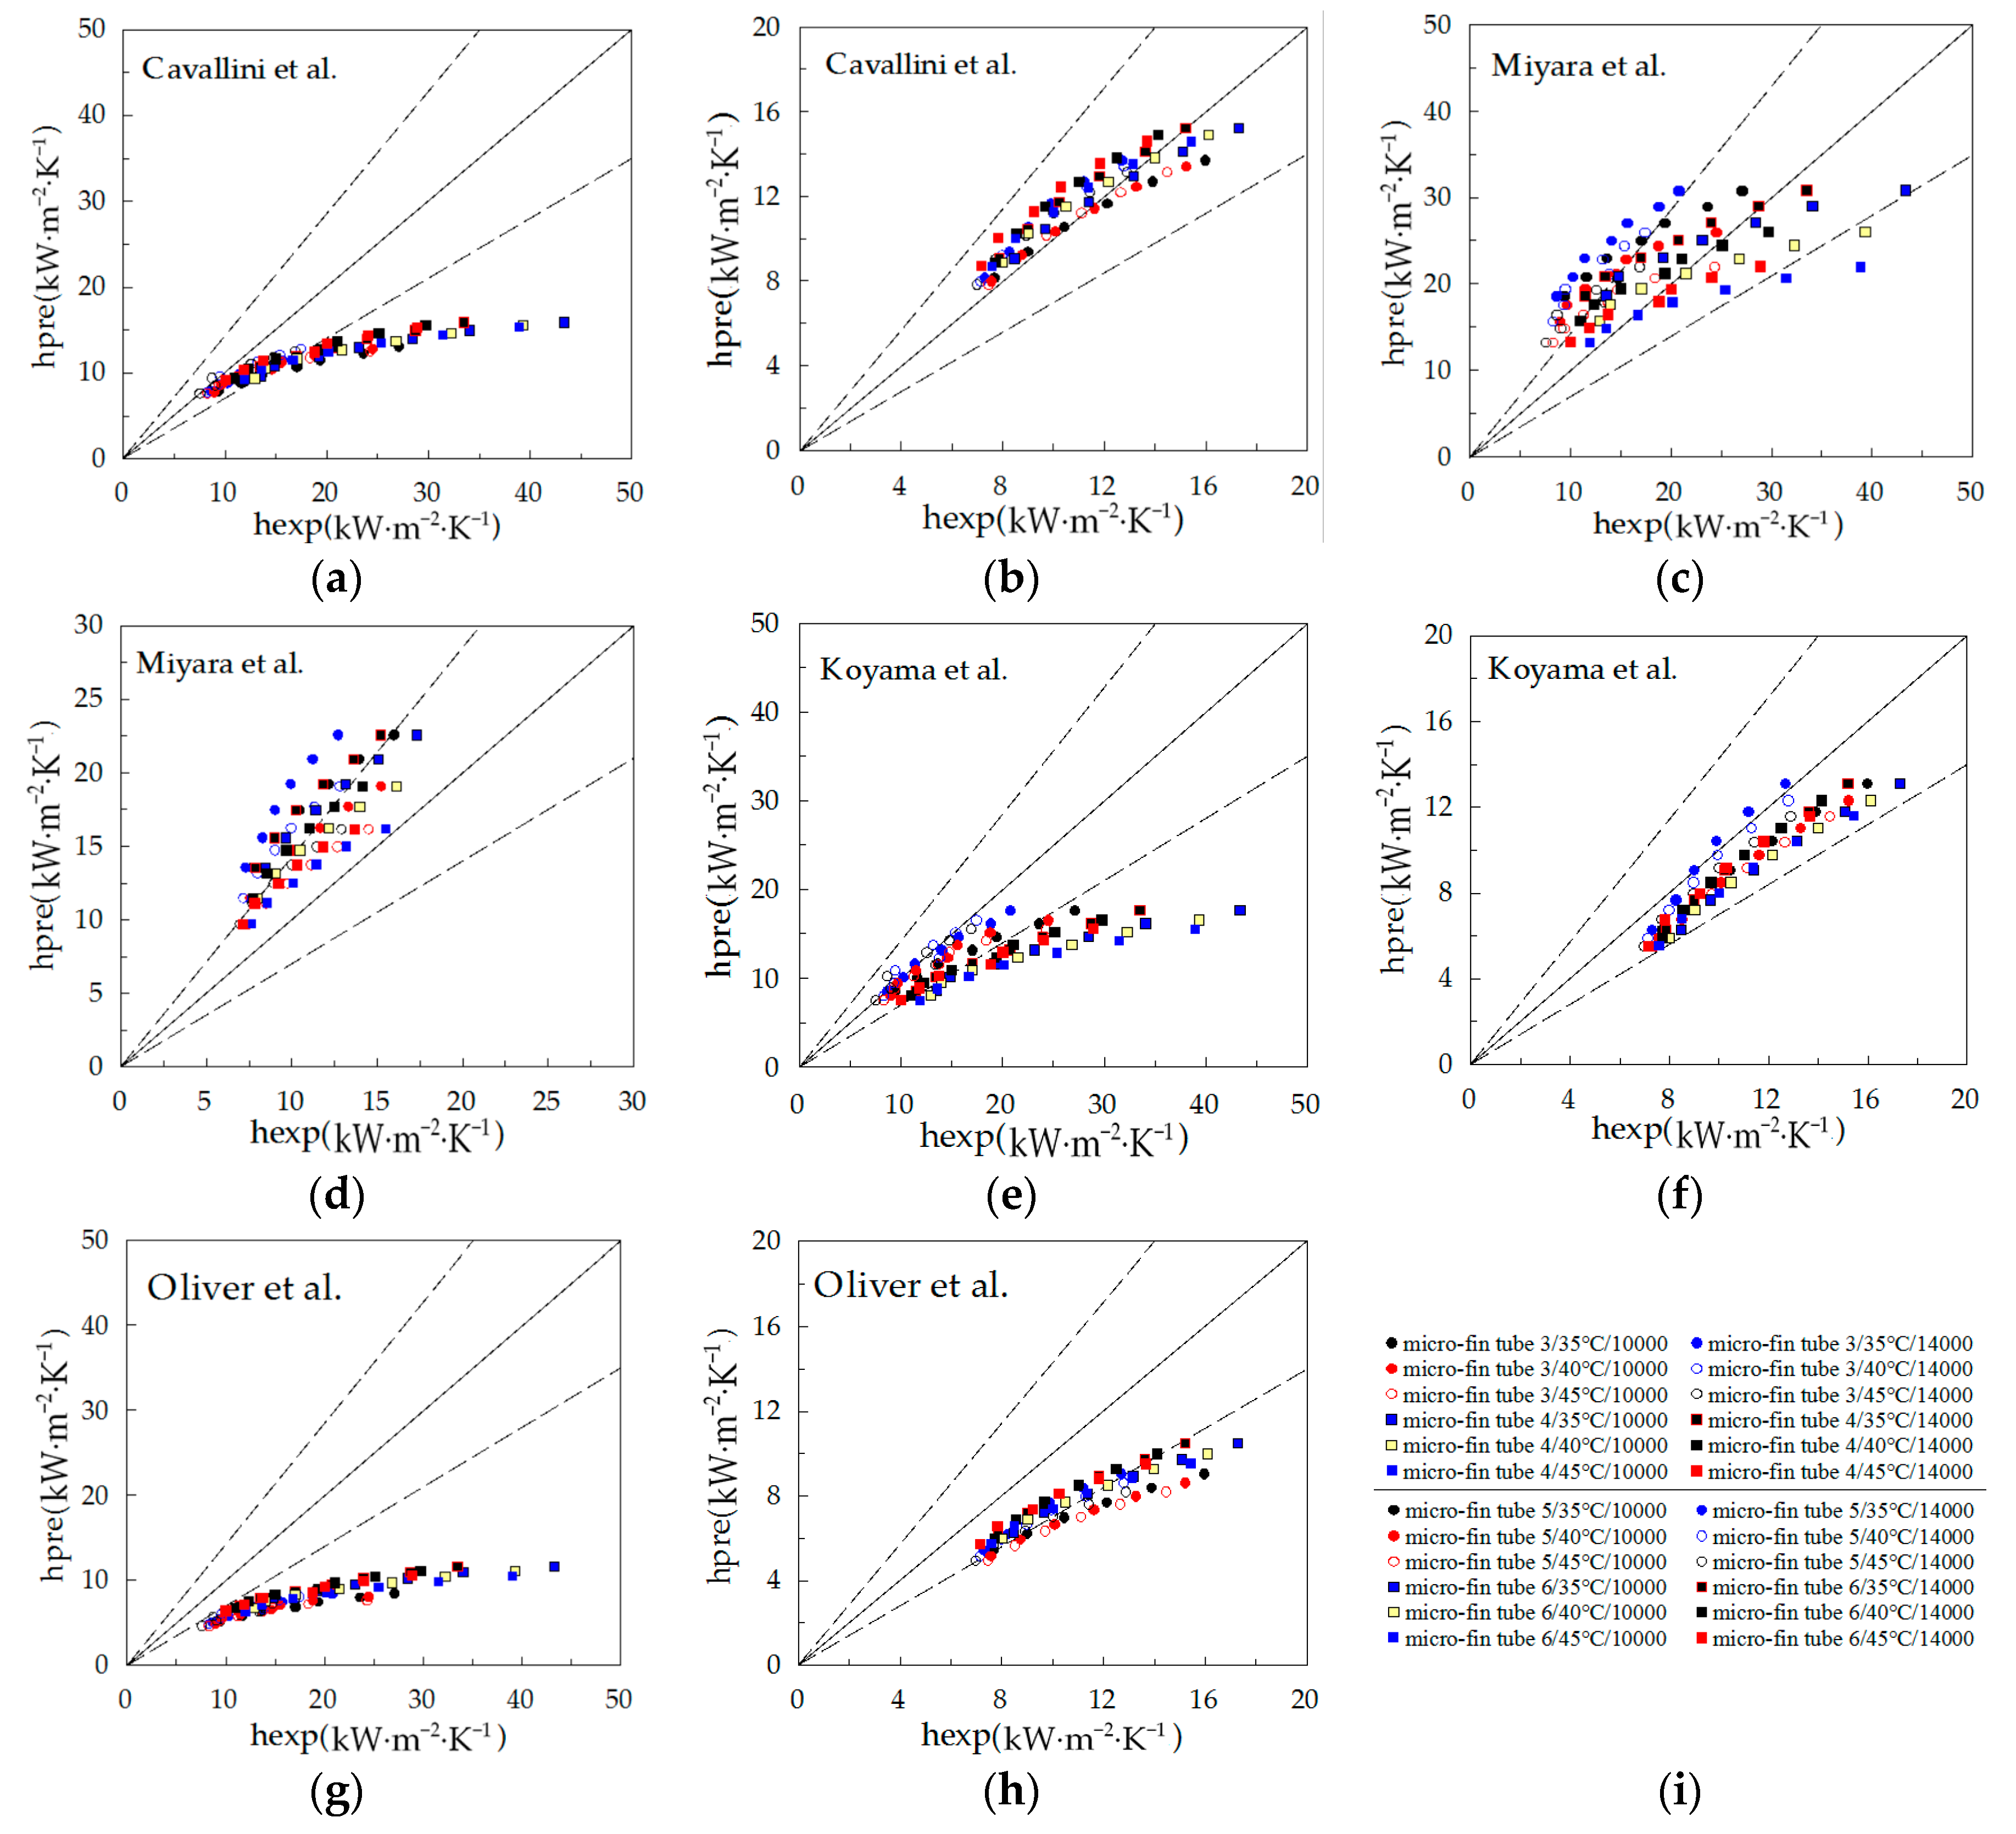
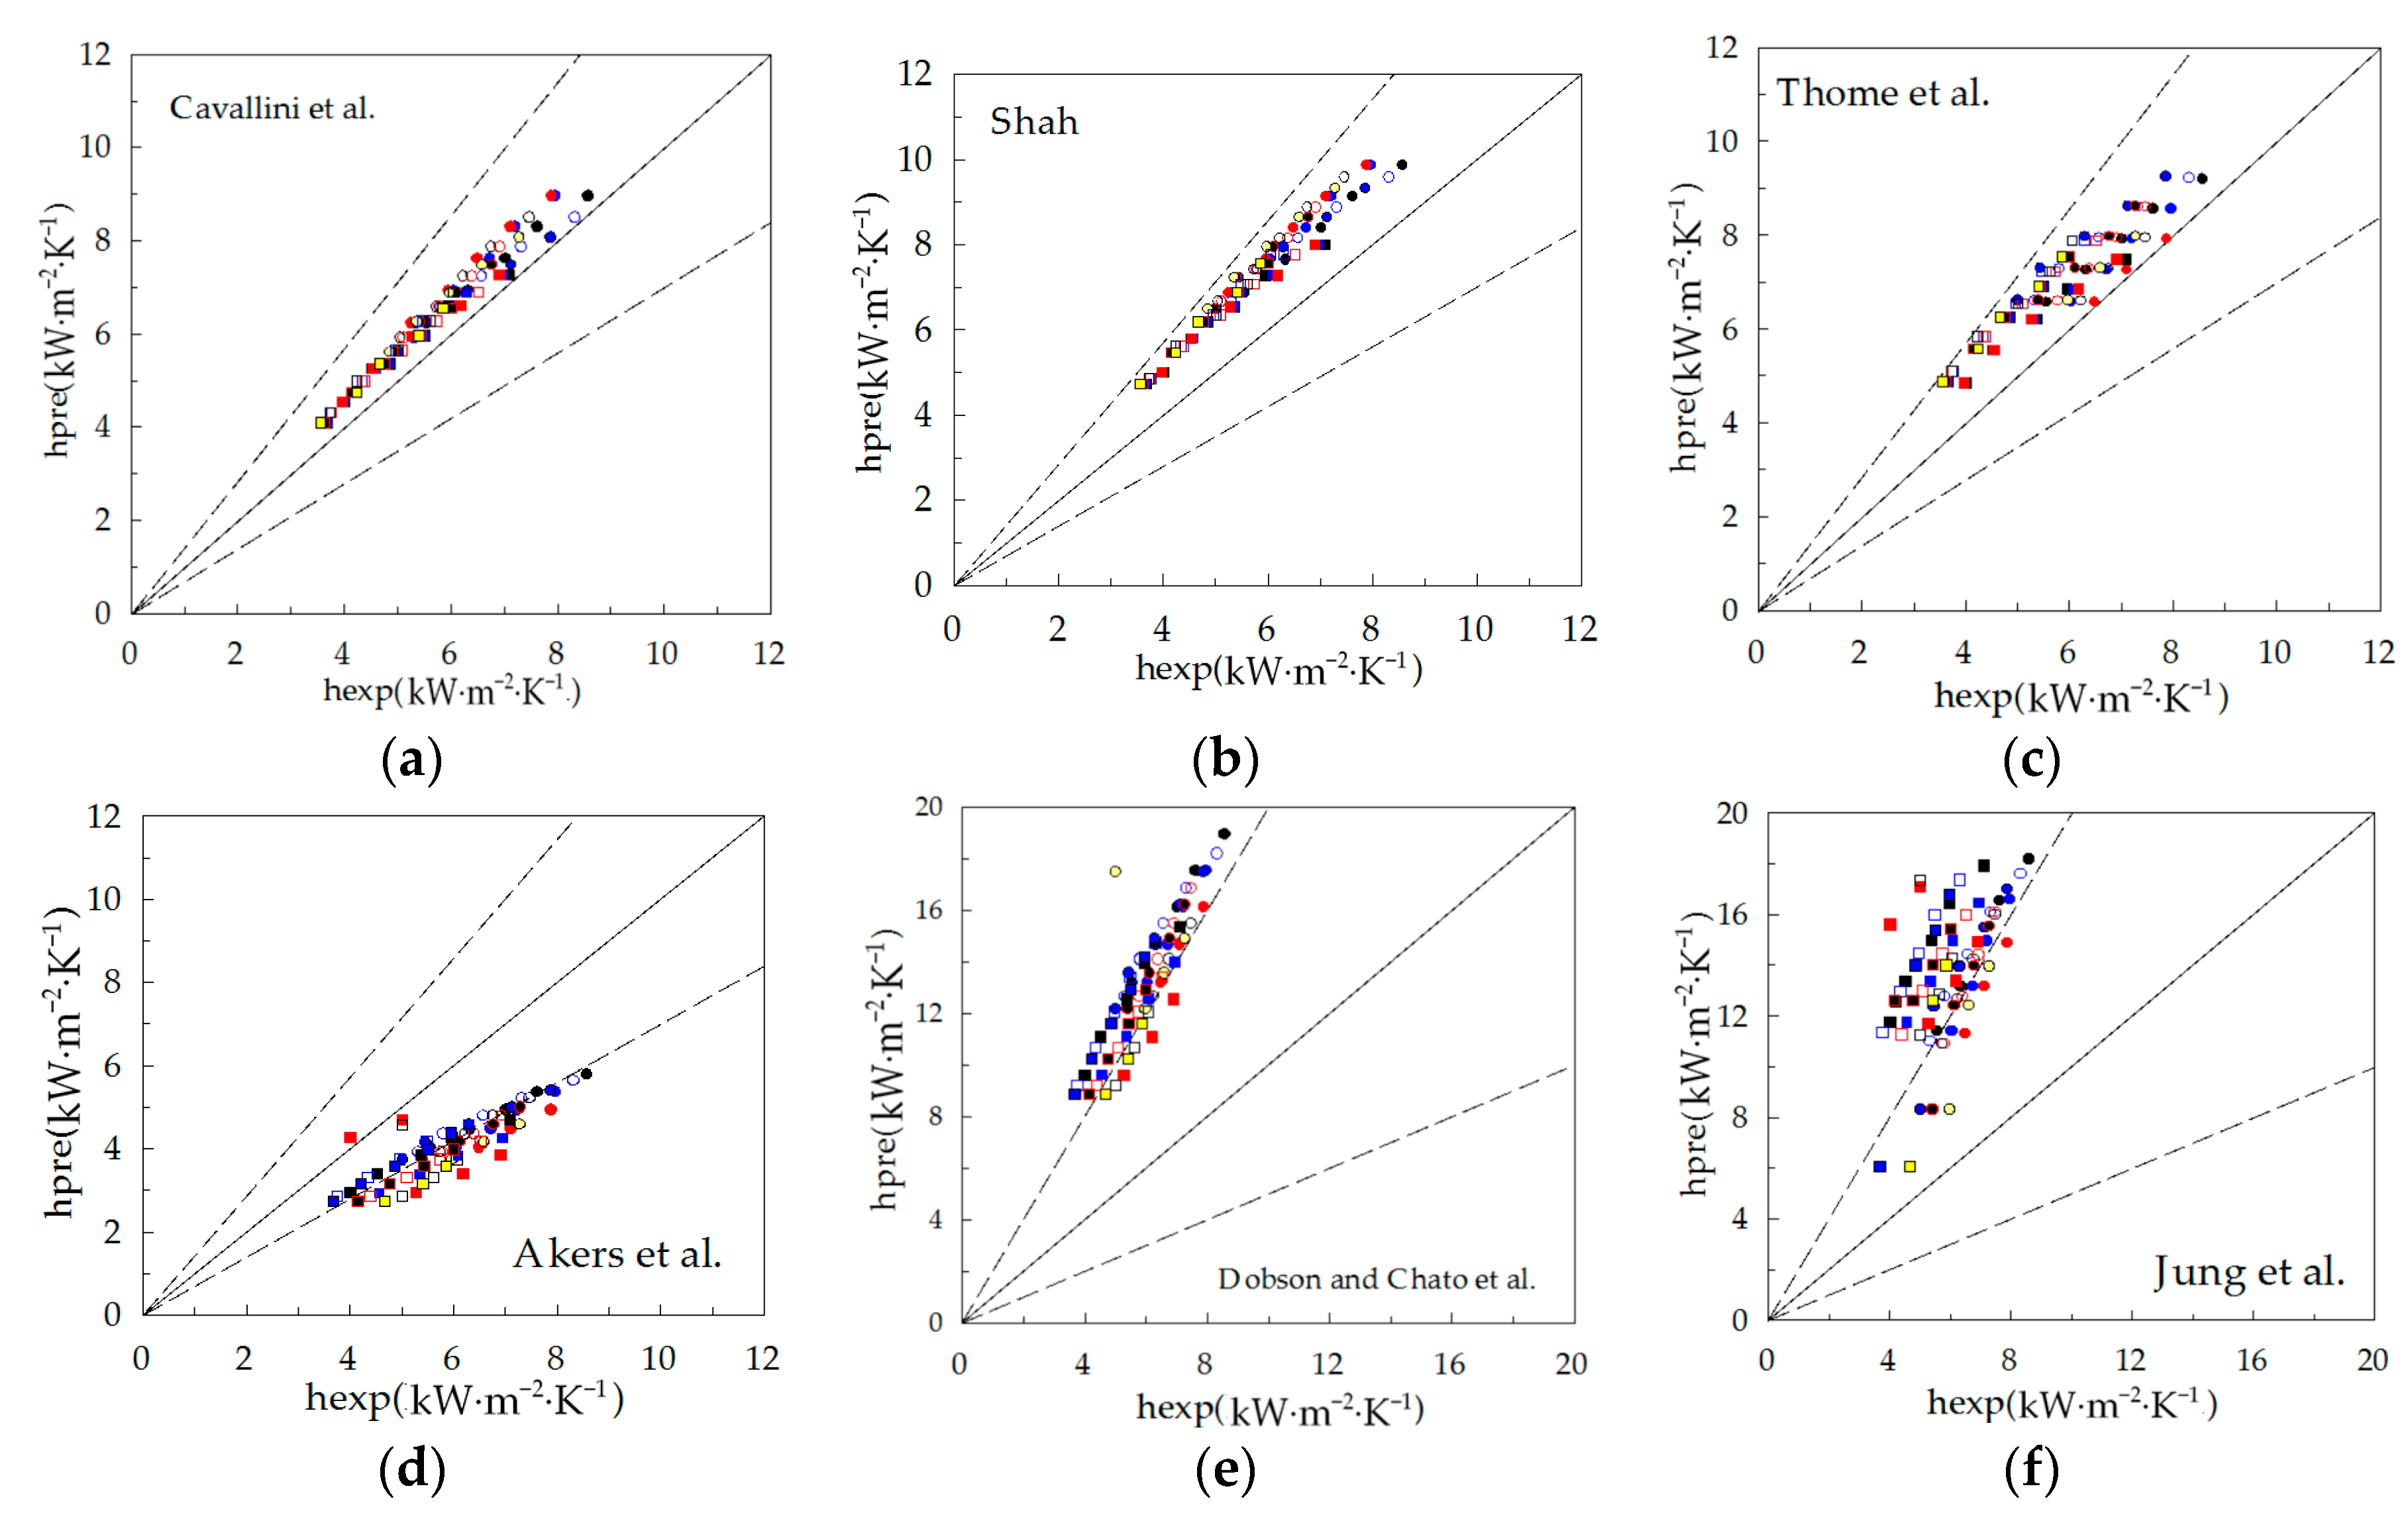
3.3. Comparison with Existing Correlations
4. Conclusions
- (1)
- The heat transfer coefficient of R134a increases with increasing mass velocity, and decreasing condensation temperature and water-testing Reynolds number. The heat transfer coefficient of micro-fin tubes is higher than that of smooth tubes with the same inner diameter, the heat transfer enhancement ratio is 2.19–2.87, 3.23–5.37, 2.12–2.21 and 2.21–2.54 for micro-fin tubes 3, 4, 5 and 6, respectively. The tube diameter has a small influence on the heat transfer for smooth tubes, while the heat transfer coefficient increases with decreasing tube diameter for micro-fin tubes.
- (2)
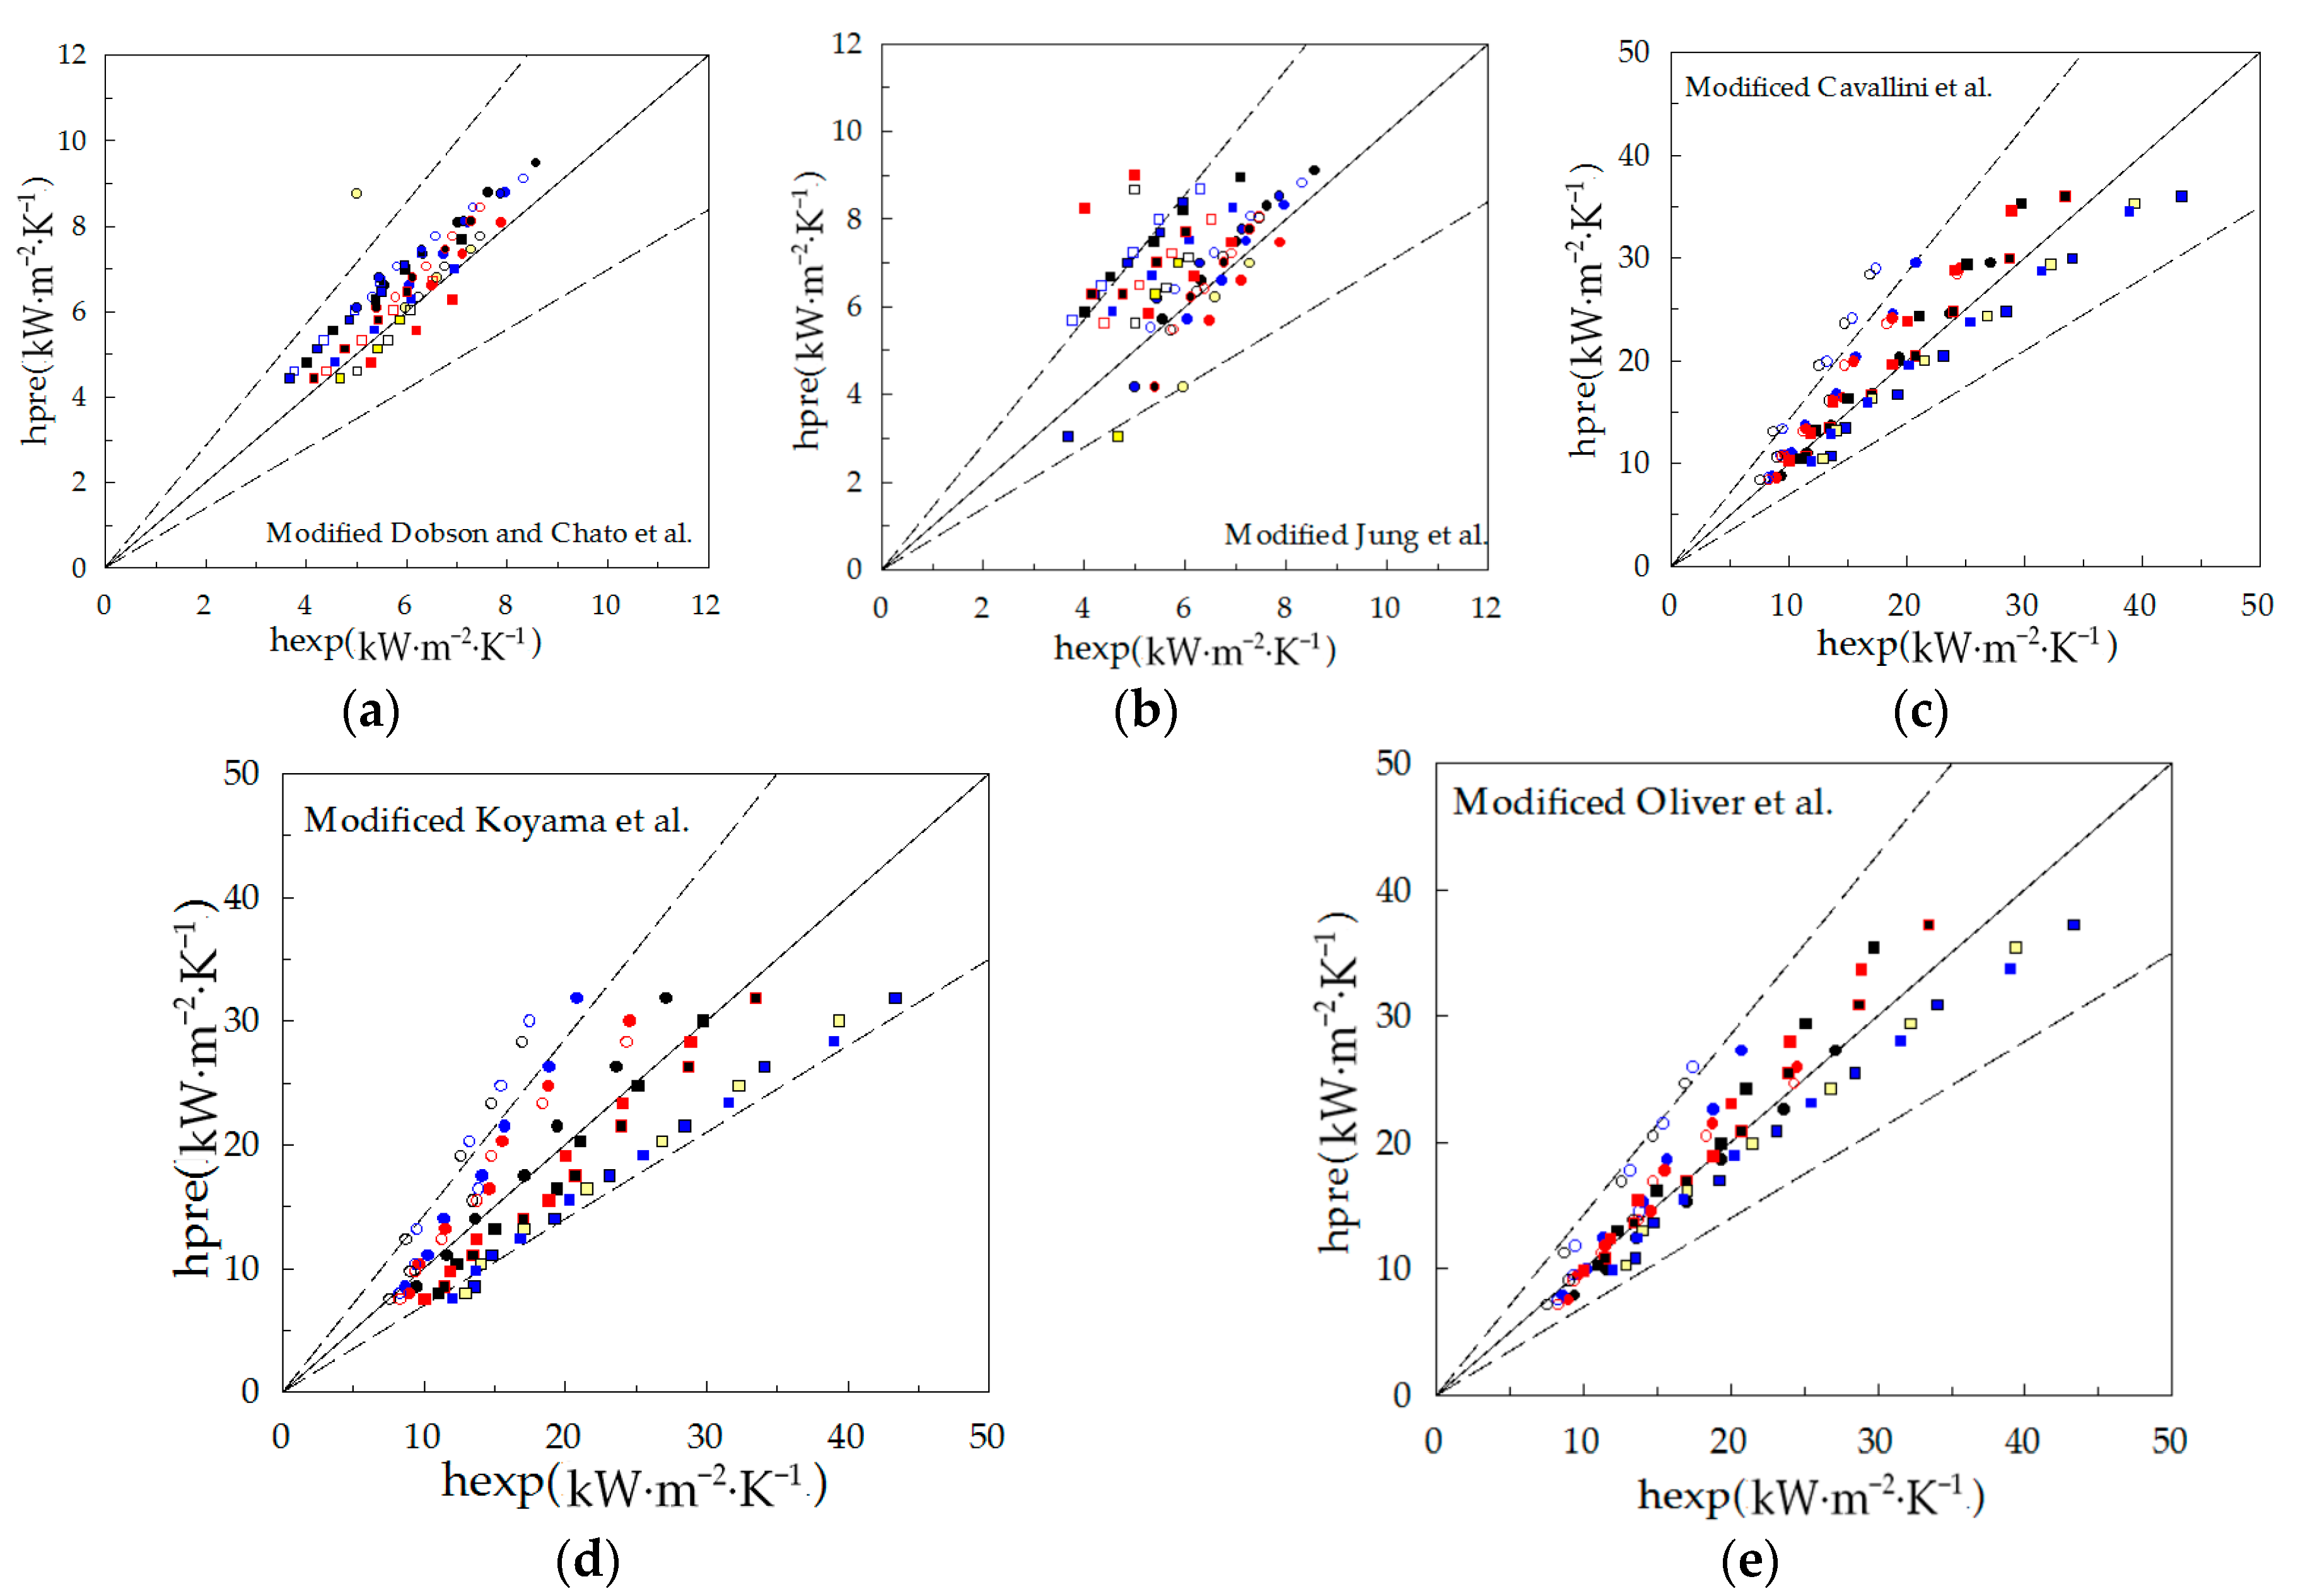
- For the smooth tube, correlations of Cavallini et al., Shah, Thome et al. and Akers et al. can estimate the experimental data with mean absolute deviation of 13.05%, 26.07%, 23.82% and 26.11%, respectively, but Dobson and Chato et al. and Jung et al. fail to capture the heat transfer coefficient, with a poorer prediction accuracy. For the micro-fin tube, although the Miyara et al. correlation overestimates the heat transfer coefficient, correlations of Cavallini et al., Koyama et al. and Oliver et al. all underestimate the experimental data, and their deviation is from 25% to 55% for micro-fin tubes 3 and 4, while their deviations keep to within 30% for micro-fin tubes 5 and 6.
- (3)
- To improve the correlation prediction accuracy, a dimensionless parameter was introduced into the correlations by Dobson and Chato et al. and Jung et al., and designed to enhance the turbulence effect for the micro-fin tube. The correlations of Cavallini et al., Koyama et al., and Oliver et al. were modified, and the prediction accuracy of all modified correlations kept to within 25%. However, the modified correlations do not apply to the micro-fin tube with a larger inner diameter. There exist many works that obtain a general correlation for all test tubes and with a wide working condition region.
Acknowledgments
Author Contributions
Conflicts of Interest
Abbreviations
| Q | heat exchange amount, W | mass flux, kg·m−2·s−1 | |
| G | mass flux, kg·m−2·s−1 | equivalent Reynolds number | |
| T | temperature, °C | liquid Prandtl number | |
| A | area, m2 | bond number | |
| ∆Tm | log-mean temperature difference, °C | Froude number | |
| Reynolds number | Nusselt number for forced convection condensation | ||
| total heat transfer coefficient, W·m−2·°C−1 | frictional two-phase multiplier | ||
| heat-transfer coefficient, W·m−2·°C−1 | trend factor | ||
| pressure drop, kPa | Subscripts | - | |
| Cp | specific heat at constant pressure, J·kg−1·°C−1 | refrigerant | |
| η | heat leakage rate | w | water-testing |
| L | effective length of the heat transfer, m | a | average value |
| D | diameter, m | ah | hydraulic value |
| x | vapor quality | in | inlet |
| density, kg·m−3 | out | outlet | |
| H | fin height, mm | i | inside tube |
| N | number of fins | o | outside tube |
| β | helical angle, ° | con | condensation condition |
| μ | dynamic viscosity, Pa·s | test tube | |
| thermal conductivity, W·m−1·°C−1 | liquid | ||
| a dimensionless parameter | ν | vapor | |
| Martinelli parameter | exp | experimental value | |
| exponent | pre | predicted value | |
| exponent |
References
- Breber, G.; Palen, J.W.; Taborek, J. Prediction of horizontal tubeside condensation of pure components using flow regime criteria. J. Heat Transf. 1980, 102, 471–476. [Google Scholar] [CrossRef]
- Soliman, H. On the annular-to-wavy flow pattern transition during condensation inside horizontal tubes. Can. J. Chem. Eng. 2010, 60, 475–481. [Google Scholar] [CrossRef]
- Coleman, J.W.; Garimella, S. Two-phase flow regimes in round, square and rectangular tubes during condensation of refrigerant R134a. Int. J. Refrig. 2003, 26, 117–128. [Google Scholar] [CrossRef]
- Cavallini, A.; Del, C.D.; Mancin, S.; Rossetto, L. An updated model for condensation of halogenated refrigerants inside enhanced tubes. In Proceedings of the 22nd International Congress of Refrigeration, Beijing, China, 21–26 August 2007. [Google Scholar]
- Chen, Q.; Amano, R.S.; Xin, M. Experimental study of flow patterns and regimes of condensation in horizontal three-dimensional micro-fin tubes. Heat Mass Transfer 2006, 43, 201–206. [Google Scholar] [CrossRef]
- Shah, M.M. A general correlation for heat transfer during film condensation inside pipes. Int. J. Heat Mass Transfer 1979, 22, 547–556. [Google Scholar] [CrossRef]
- Akers, W.W.; Deans, H.A.; Crosser, O.K. Condensation heat transfer within horizontal tubes. Chem. Eng. Prog. Symp. Ser. 1959, 55, 171–176. [Google Scholar]
- Thome, J.R.; El Hajal, J. Two-Phase Flow Pattern Map for Evaporation in Horizontal Tubes: Latest Version. Heat Transfer Eng. 2003, 24, 3–10. [Google Scholar] [CrossRef]
- Dobson, M.K.; Chato, J.C. Condensation in Smooth Horizontal Tubes. J. Heat Transfer 1998, 120, 193–213. [Google Scholar] [CrossRef]
- Cavallini, A.; Col, D.D.; Doretti, L.; Matkovic, M.; Rossetto, L. Condensation in Horizontal Smooth Tubes: A New Heat Transfer Model for Heat Exchanger Design. Heat Transfer Eng. 2006, 27, 31–38. [Google Scholar] [CrossRef]
- Wang, W.W.; Radcliff, T.D.; Christensen, R.N. A condensation heat transfer correlation for millimeter-scale tubing with flow regime transition. Exp. Therm. Fluid Sci. 2002, 26, 473–485. [Google Scholar] [CrossRef]
- Yan, Y.Y.; Lin, T.F. Condensation heat transfer and pressure drop of refrigerant R-134a in flat aluminum multi-channel tubes with and without micro-fins. Int. J. Heat Mass Transfer 1999, 42, 697–708. [Google Scholar] [CrossRef]
- Cavallini, A.; Col, D.D.; Doretti, L.; Longo, G.A.; Rossetto, L. A new computational procedure for heat transfer and pressure drop during refrigerant condensation inside enhanced tubes. J. Enhanc. Heat Transfer 1999, 6, 441–456. [Google Scholar]
- Miyara, A.; Nonaka, K.; Taniguchi, M. Condensation heat transfer and flow pattern inside a herringbone-type micro-fin tube. Int. J. Refrig. 2000, 23, 141–152. [Google Scholar] [CrossRef]
- Goto, M.; Inoue, N.; Yonemoto, R. Condensation heat transfer of R410A inside internally grooved horizontal tubes. Int. J. Refrig. 2003, 26, 410–416. [Google Scholar] [CrossRef]
- Chamra, L.M.; Mago, P.J.; Tan, M.; Kung, C. Modeling of condensation heat transfer of pure refrigerants in micro-fin tubes. Int. J. Heat Mass Transfer 2005, 48, 1293–1302. [Google Scholar] [CrossRef]
- Kedzierski, M.A.; Goncalves, J.M. Horizontal convective condensation of alternative refrigerants within a micro-fin tube. J. Enhanc. Heat Transfer 1999, 6, 161–178. [Google Scholar] [CrossRef]
- Olivier, J.A.; Liebenberg, L.; Thome, J.R.; Meyer, J.P. Heat transfer, pressure drop, and flow pattern recognition during condensation inside smooth, helical micro-fin, and herringbone tubes. Int. J. Refrig. 2007, 30, 609–623. [Google Scholar] [CrossRef]
- Islam, M.A.; Miyara, A. Liquid film and droplet flow behaviour and heat transfer characteristics of herringbone microfin tubes. Int. J. Refrig. 2007, 30, 1408–1416. [Google Scholar] [CrossRef]
- Tang, L.; Ohadi, M.M.; Johnson, A.T. Flow condensation in smooth and micro-fin tubes with HCFC-22, HFC-134a and HFC-410A refrigerants. Part I: Experimental results. J. Enhanc. Heat Transf. 2000, 7, 289–310. [Google Scholar] [CrossRef]
- Lazarek, G.M.; Black, S.H. Evaporative heat transfer, pressure drop and critical heat flux in a small vertical tube with R-113. Int. J. Heat Mass Transfer 1982, 25, 945–960. [Google Scholar] [CrossRef]
- Mishima, K.; Hibiki, T. Some characteristics of air-water two-phase flow in small diameter vertical tubes. Int. J. Multiph. Flow 1996, 22, 703–712. [Google Scholar] [CrossRef]
- Chisholm, D. A theoretical basis for the Lockhart-Martinelli correlation for two-phase flow. Int. J. Heat Mass Transfer 1967, 10, 1767–1778. [Google Scholar] [CrossRef]
- Zhang, M.; Webb, R.L. Correlation of two-phase friction for refrigerants in small-diameter tubes. Exp. Therm. Fluid Sci. 2001, 25, 131–139. [Google Scholar] [CrossRef]
- Koyama, S.; Kuwahara, K.; Nakashita, K.; Yamamoto, K. An experimental study on condensation of refrigerant R134a in a multi-port extruded tube. Int. J. Refrig. 2003, 26, 425–432. [Google Scholar] [CrossRef]
- Sun, L.; Mishima, K. Evaluation analysis of prediction methods for two-phase flow pressure drop in mini-channels. Int. J. Multiph. Flow 2009, 35, 47–54. [Google Scholar] [CrossRef]
- Revellin, R.; Thome, J.R. Adiabatic two-phase frictional pressure drops in microchannels. Exp. Therm. Fluid Sci. 2007, 31, 673–685. [Google Scholar] [CrossRef]
- Gnielinski, V. New equations for heat and mass transfer in turbulent pipe and channel flows. NASA STI/Recon Tech. Rep. A 1976, 75, 8–16. [Google Scholar]
- Petukhov, B.S. Heat transfer and friction in turbulent pipe flow with variable physical properties. Adv. Heat Transfer 1970, 6, 503–564. [Google Scholar]
- Koo, K.; Hwang, J.; Hur, H.; Lee, J.; Na, B.; Hwang, Y.; Kim, B.; Ahn, Y. An experimental study on the thermal and fouling characteristics in a washable shell and helically coiled heat exchanger by the Wilson plot method. J. Mech. Sci. Technol. 2016, 30, 2805–2812. [Google Scholar] [CrossRef]
- Li, M.; Chaobin, D. Flow boiling heat transfer of HFO1234yf and R32 refrigerant mixtures in a smooth horizontal tube: Part 1. Experimental investigation. Int. J. Heat Mass Transfer 2012, 55, 3437–3446. [Google Scholar] [CrossRef]
- Oh, H.K.; Son, C.H. Condensation heat transfer characteristics of R-22, R-134a and R-410A in a single circular micro-tube. Exp. Therm. Fluid Sci. 2011, 35, 706–716. [Google Scholar] [CrossRef]
- El Hajal, J.; Thome, J.R.; Cavallini, A. Condensation in horizontal tubes, part 1: Two-phase flow pattern map. Int. J. Heat Mass Transfer 2003, 46, 3349–3363. [Google Scholar] [CrossRef]
- Baird, J.R.; Fletcher, D.F.; Haynes, B.S. Local condensation heat transfer rates in fine passages. Int. J. Heat Mass Transfer 2003, 46, 4453–4466. [Google Scholar] [CrossRef]
- Shin, J.S.; Kim, M.H. An experimental study of flow condensation heat transfer inside circular and rectangular mini-channels. Heat Transfer Eng. 2005, 26, 36–44. [Google Scholar] [CrossRef]
- Liu, N.; Li, J.M. Experimental study on condensation heat transfer of R32, R152a and R22 in horizontal minichannels. Appl. Therm. Eng. 2015, 90, 763–773. [Google Scholar] [CrossRef]
- Yang, C.Y.; Webb, R.L. A predictive model for condensation in small hydraulic diameter tubes having axial micro-fins. ASME J. Heat Transfer 1997, 119, 776–782. [Google Scholar] [CrossRef]
- Cavallini, A.; Censi, G.; del Col, D.; Doretti, L.; Longo, G.A.; Rossetto, L.; Zilio, C. Condensation inside and outside smooth and enhanced tubes—A review of recent research. Int. J. Refrig. 2003, 26, 373–392. [Google Scholar] [CrossRef]
- Thome, J.R.; El Hajal, J.; Cavallini, A. Condensation in horizontal tubes, part 2: New heat transfer model based on flow regimes. Int. J. Heat Mass Transfer 2003, 46, 3365–3387. [Google Scholar] [CrossRef]
- Jung, D.; Song, K.; Cho, Y.; Kim, S. Flow condensation heat transfer coefficients of pure refrigerants. Int. J. Refrig. 2003, 26, 4–11. [Google Scholar] [CrossRef]
- Koyama, S.; Yu, J. Condensation heat transfer of pure refrigerant inside an internally grooved horizontal tube. In Proceedings of the JAR Annual Conference; 1996; pp. 173–186. [Google Scholar]
- Guo, S.P.; Wu, Z.; Li, W.; Kukulka, D.; Sunden, B.; Zhou, X.P.; Wei, J.J.; Simon, T. Condensation and evaporation heat transfer characteristics in horizontal smooth, herringbone and enhanced surface EHT tubes. Int. J. Heat Mass Transfer 2015, 85, 281–291. [Google Scholar] [CrossRef]


| Number | Type Tube | Outer Diameter Do (mm) | Inner Diameter Di (mm) | Helical Angle β (°) | Fin Height H (mm) | Addendum Angle γ (°) | Number of Fins N | Teeth Space dt (mm) | Groove Width dg (mm) | Effective Length of Heat Transfer L (m) |
|---|---|---|---|---|---|---|---|---|---|---|
| 1 | smooth tube | 6.35 | 5.89 | - | - | - | - | - | - | 2 |
| 2 | smooth tube | 8.00 | 7.56 | - | - | - | - | - | - | 2 |
| 3 | micro-fin tube | 6.35 | 5.89 | 18 | 0.17 | 25 | 44 | 0.4 | 0.25 | 2 |
| 4 | micro-fin tube | 6.35 | 5.89 | 28 | 0.17 | 33 | 54 | 0.35 | 0.15 | 2 |
| 5 | micro-fin tube | 8.00 | 7.56 | 18 | 0.23 | 24.5 | 60 | 0.4 | 0.20 | 2 |
| 6 | micro-fin tube | 8.00 | 7.56 | 28 | 0.23 | 24.5 | 60 | 0.4 | 0.20 | 2 |
| Nomenclature | Uncertainty | Nomenclature | Uncertainty |
|---|---|---|---|
| Temperature | ±0.1 °C | Water-testing Reynolds number | ±0.53% |
| Pressure, range: 0–4.2 MPa | ±0.1% of full scale | Heat transfer rate | ±3.4% |
| Differential pressure, rang: 0–150 kPa | ±0.065% of reading | Heat leakage rate | ±4.1% |
| Water-testing flow rate | 0.5% of reading | Log-mean temperature difference | ±0.31 °C |
| Water–glycol flow rate | 0.5% of reading | Total heat transfer coefficient | ±5.2% |
| Refrigerant mass flux, range: 0–6 kg/min | 0.1% of reading | Water-testing heat transfer coefficient | ±0.55% |
| Refrigerant mass velocity | ±0.1% | Refrigerant heat transfer coefficient | ±13.5% |
| Refrig-erant | Tempe-rature (°C) | Pressure (MPa) | Liquid Density (kg·m−3) | Vapor Density (kg·m−3) | Liquid Thermal Conductivity (W·m−1·°C−1) | Vapor Thermal Conductivity (W·m−1·°C−1) | Liquid Viscosity (Pa·s) | Vapor Viscosity (Pa·s) | Surface Tension (N·m−1) |
|---|---|---|---|---|---|---|---|---|---|
| R134a | 35 | 0.88698 | 1167.5 | 43.416 | 0.076853 | 14.874 | 0.00017200 | 0.000012132 | 0.0067656 |
| 40 | 1.0166 | 1146.7 | 50.085 | 0.075446 | 15.446 | 0.00016145 | 0.000012373 | 0.0061268 | |
| 45 | 1.1599 | 1125.1 | 57.657 | 0.072575 | 16.062 | 0.00015139 | 0.000012633 | 0.0055016 |
| Refrigerant | R134a |
|---|---|
| Condensation temperature | 35 °C, 40 °C, 45 °C |
| Mass velocity, kg·m−2·s−1 | 400, 500, 600, 700, 800, 900, 1000, 1100 |
| Water-testing Reynolds number | 8000, 10,000, 12,000, 14,000, 16,000, 18,000, 20,000, 22,000 |
| Correlation | Cavallini et al. | Shah | Thome et al. | Akers et al. | Dobson and Chato et al. | Jung et al. | ||||
| Deviation | MD b | MD b | MD b | MD b | MD b | MD b | ||||
| Smooth tubes 1 and 2 | 13.05 | 26.07 | 23.82 | 26.11 | 140.18 | 146.23 | ||||
| Correlation | Cavallini et al. | Miyara et al. | Koyama et al. | Oliver et al. | ||||||
| Deviation | AD a | MD b | AD a | MD b | AD a | MD b | AD a | MD b | ||
| Micro-fin tubes 3 and 4 | −30.51 | 31.50 | 37.25 | 55.95 | −26.34 | 27.46 | −52.41 | 54.48 | ||
| Micro-fin tubes 5 and 6 | 6.52 | 6.62 | 4.68 | 4.73 | −16.35 | 16.75 | −28.79 | 29.97 | ||
| Modified Correlation | Modified Dobson and Chato et al. | Modified Jung et al. | Modified Cavallini et al. | Modified Koyama et al. | Modified Oliver et al. | |||||
| Deviation | AD a | MD b | AD a | MD b | AD a | MD b | AD a | MD b | AD a | MD b |
| Smooth tubes 1 and 2 | - | 20.31 | - | 23.24 | - | - | - | - | - | - |
| Micro-fin tubes 3 and 4 | - | - | - | - | 6.75 | 13.06 | −5.57 | 5.37 | 0.62 | 16.13 |
© 2017 by the authors. Licensee MDPI, Basel, Switzerland. This article is an open access article distributed under the terms and conditions of the Creative Commons Attribution (CC BY) license (http://creativecommons.org/licenses/by/4.0/).
Share and Cite
Li, Q.; Tao, L.; Li, L.; Hu, Y.; Wu, S. Experimental Investigation of the Condensation Heat Transfer Coefficient of R134a inside Horizontal Smooth and Micro-Fin Tubes. Energies 2017, 10, 1280. https://doi.org/10.3390/en10091280
Li Q, Tao L, Li L, Hu Y, Wu S. Experimental Investigation of the Condensation Heat Transfer Coefficient of R134a inside Horizontal Smooth and Micro-Fin Tubes. Energies. 2017; 10(9):1280. https://doi.org/10.3390/en10091280
Chicago/Turabian StyleLi, Qingpu, Leren Tao, Lei Li, Yongpan Hu, and Shengli Wu. 2017. "Experimental Investigation of the Condensation Heat Transfer Coefficient of R134a inside Horizontal Smooth and Micro-Fin Tubes" Energies 10, no. 9: 1280. https://doi.org/10.3390/en10091280
APA StyleLi, Q., Tao, L., Li, L., Hu, Y., & Wu, S. (2017). Experimental Investigation of the Condensation Heat Transfer Coefficient of R134a inside Horizontal Smooth and Micro-Fin Tubes. Energies, 10(9), 1280. https://doi.org/10.3390/en10091280