Article

Impedance-Based Stability Analysis in Grid Interconnection Impact Study Owing to the Increased Adoption of Converter-Interfaced Generators

1
School of Electrical and Electronic Engineering, Yonsei University, Seoul 03722, Korea
2
Department of Electrical Engineering, Chonbuk National University, Jeonju 54896, Korea
3
National Renewable Energy Laboratory, Golden, CO 80401, USA
*
Author to whom correspondence should be addressed.
Energies 2017, 10(9), 1355; https://doi.org/10.3390/en10091355
Submission received: 14 July 2017 / Accepted: 9 August 2017 / Published: 8 September 2017

Abstract

:
This study investigates the emerging harmonic stability concerns to be addressed by grid planners in generation interconnection studies, owing to the increased adoption of renewable energy resources connected to the grid via power electronic converters. The wideband and high-frequency electromagnetic transient (EMT) characteristics of these converter-interfaced generators (CIGs) and their interaction with the grid impedance are not accurately captured in the typical dynamic studies conducted by grid planners. This paper thus identifies the desired components to be studied and subsequently develops a practical process for integrating a new CIG into a grid with the existing CIGs. The steps of this process are as follows: the impedance equation of a CIG using its control dynamics and an interface filter to the grid, for example, an LCL filter (inductor-capacitor-inductor type), is developed; an equivalent impedance model including the existing CIGs nearby and the grid observed from the point of common coupling are derived; the system stability for credible operating scenarios is assessed. Detailed EMT simulations validate the accuracy of the impedance models and stability assessment for various connection scenarios. By complementing the conventional EMT simulation studies, the proposed analytical approach enables grid planners to identify critical design parameters for seamlessly integrating a new CIG and ensuring the reliability of the grid.

1. Introduction

Power system planners conduct a series of studies to ensure the reliability of new capacity resources and to avoid their adverse impact on the grid [1,2]. The stability concerns of conventional synchronous machines, in particular, can be adequately studied using phasor-based time-domain simulation tools, because dynamic phenomena occur at frequencies typically less than a few hertz. However, owing to the increased adoption of photovoltaic and wind resources connected to the grid via power electronic converters, high-frequency and wideband electromagnetic transient (EMT) characteristics of converters and their interactions with the grid, that is, harmonic stability concerns, have become crucial. These aspects, however, cannot be accurately captured and adequately addressed in the existing grid interconnection processes and studies.
Harmonics and resonance concerns of power electronics have been investigated widely in distribution systems, and they are crucial issues to be addressed for the integration of converter interfaced generators (CIGs) [3,4,5,6,7]. These are practical detection and mitigation solutions to the existing harmonics and resonance problems, that is, harmonics from the converters and their interaction with the harmonic impedance generated by passive grid elements such as cables, transformers, and harmonic filters. These solutions have focused on the steady-state harmonic interactions. However, wide-bandwidth controls may cause system instability or oscillations owing to the lack of stability margins at frequencies ranging from a few hundred hertz to several kilohertz [8]. The dynamics of CIGs and control interactions among grid components should be properly incorporated and, thus, harmonics and stability issues are addressed in the grid interconnection process.
The state-space analysis including the control dynamics of power electronic converters is a well-known method for the analysis of converter stability [9,10,11]. System instability can be identified by using eigenvalues of the critical system parameters. If the converter is connected to a weak alternating current (AC) system, certain operating conditions or parameter settings can result in system instability [9,10]. However, these studies have focused rather on the interaction among the converters and the grid impedance. It is critical to also investigate the interaction among the converters in the evolving power grid. Furthermore, [11] only deals with the low-frequency relative stability problems in the microgrid.
Impedance-based analysis is another promising method for evaluating the stability. Converter impedance is obtained by considering the control dynamics. Impedance-based stability for both the direct current (DC) [12] and AC systems are assessed [13,14,15,16,17,18,19,20,21,22,23,24]. There have been notable methods for accurately representing the output impedance of a grid-connected voltage-sourced converter (VSC) with dq-domain current control [14,15,16,17,18,19,20] and α β -domain current control [21,22,23,24]. It is also worth noting studies on the stability in high voltage direct current (HVDC) systems [20,21] or multiple grid-connected inverters [18,24]. When the converter and grid impedance characteristics are unknown, it is possible to measure the converter and grid impedance online for the stability assessment and adaptive control [25,26]. However, these studies have not fully incorporated the harmonic stability concerns observable in grid operations. It is desirable to further explore the operating space and identify the scenarios in which these emerging stability concerns may arise, and thus what the grid planners need to address in their CIG interconnection studies, for example, the impact of a new CIG in terms of its siting and operation.
Motivated by the emerging change in grid characteristics and possible complications encountered without advancing the grid interconnection process, this paper identifies the new studies required to incorporate the characteristics of a new CIG. It presents a practical process to ensure harmonious grid integration of the CIG without any adverse control interaction with the existing CIGs. As illustrated in Figure 1, this study includes the development of the impedance equation of a CIG using its control dynamics and an interface filter to the grid, for example, the LCL filter (inductor-capacitor-inductor type) considered in this study (see Section 2); the derivation of an equivalent impedance model including the existing CIGs nearby and the grid observed from the point of common coupling (PCC), as presented in Section 3; the assessment of system stability for credible connection options and operational scenarios, as presented in Section 4; followed by concluding remarks in Section 5. Detailed PSCAD/EMTDC simulations validate the accuracy of the impedance models and stability assessment for the selected connection scenarios.

2. Modeling of Converter-Interfaced Generator Impedance

The impedance of a CIG is affected by various factors such as control parameters, switching delay, and converter harmonic filters [15,23]. This section develops the impedance model of a CIG using a proportional-integral (PI) controller and an LCL filter, owing to their popularity in the industry. For simplicity in the analysis, this research does not implement the damping of the LCL filter. Specific passive and active damping schemes, however, may be considered in the detailed simulation studies when specifications are ready. Subsequently, the analytical derivation of the equation is compared with the impedance measurement from a PSCAD/EMTDC converter model to validate the accuracy of the derived model. The converter parameters used for the impedance measurement are presented in the Appendix A. It is assumed that DC sources are used for constant DC voltage; the reactive power is set to 0, and the switching delay is approximated by a first-order Padé approximation, as follows [23,27]:
G P W M = 1 1.5 T d s / 2 1 + 1.5 T d s / 2
We note that this study focuses on a balanced system. However, the proposed approach can be extended to unbalanced system conditions, which generally requires additional studies and stability assessments in the negative-sequence domain. Advanced phase-locked loop (PLL) structures and control schemes to mitigate adverse impacts on the control performance need to be incorporated as necessary.
Because a PI controller-based converter requires a PLL for grid synchronization, the effect of the PLL on the harmonics should be clarified for the stability assessment. Figure 2 shows a control block diagram of the synchronous reference frame PLL used in this research [28]. From this control block diagram, the closed-loop transfer function of the PLL can be derived in the form of a standard second-order transfer function [29,30,31]:
G c l , p l l = K p , p l l s + K i , p l l s 2 + K p , p l l s + K i , p l l
Using the parameters in the Appendix A, a bode plot of Equation (2) is shown in Figure 3. The bandwidth of the closed-loop transfer function is 32.39 Hz, which indicates that the harmonics of interest (up to 3 kHz) are suppressed by the transfer function. Therefore, the effect of the PLL in the frequency range from 100 Hz to 3 kHz is limited and is not investigated further in this paper. However, it is crucial to understand and consider the destabilizing impact of the PLL as required, especially when the system strength is low. The details of the impact of PLL gain on the system stability can be found in previous research [9,19,32].

2.1. Impedance Equation with Converter Dynamics

A circuit diagram and d-axis current-control block diagram of the converter are shown in Figure 4. The control dynamics can be obtained by using the d q frame representation without considering the dynamics of the capacitance C f for the sake of simplicity, as follows [33]:
V c , d V P C C , d = I g , d ( L c + L g ) s w ( L c + L g ) I g , q
V c , q V P C C , q = I g , q ( L c + L g ) s + w ( L c + L g ) I g , d
In contrast, the AC system dynamics should include the capacitance to derive the converter impedance. It can be obtained in time domain as follows:
V c = V P C C + ( L c + L g ) d I g d t + L c C f d 2 V P C C d t 2 + L c L g C f d 3 I g d t 3
When the d q frame transformation is applied to Equation (5), the equation becomes more complex, owing to the coupling terms. Under the assumption that the time derivative of the frequency is negligible ( d w / d t 0 ), the d- and q-axis current can be derived as follows:
I g , d = Y c V c , d Y g 1 V P C C , d + Y g 2 V P C C , q + I g , q G c
I g , q = Y c V c , q Y g 1 V P C C , q Y g 2 V P C C , d I g , d G c
where
Y c = { L c L g C f s 3 + ( L c + L g 3 w 2 L c L g C f ) s } 1
Y g 1 = Y c ( L c C f s 2 L c C f w 2 + 1 )
Y g 2 = Y c ( 2 w L c C f s )
G c = Y c ( 3 w L c L g C f s 2 + w L c + w L g L c L g C f w 3 )
The assumption of zero reactive power, that is, zero q-axis current of the CIG synchronized to the grid, removes the coupling terms, and only the d-axis current control is thus considered to derive the impedance equation. Thus, Equations (3) and (6) introduce the simplified d-axis current-control block diagram shown in Figure 5 and result in the following d-axis current equations:
I g , d = G o p 1 + G o p I g , d , r e f Y g 1 G P W M Y c 1 + G o p V P C C , d
G o p = G P I G P W M Y c , G P I = K p + K i s
According to [22,23], the converter admittance can be derived as I g / V P C C . Similarly, the converter admittance is obtained as follows:
Y c o n = Y g 1 G P W M Y c 1 + G o p

2.2. Validation of Impedance Equation

The three-phase system impedance can be measured by injecting a small voltage signal in a single line, as documented in [34]. The injection signal at a certain frequency has an impact on the voltage and current of the PCC. The voltage and current response at this frequency is used to obtain the converter impedance. Background harmonics are measured before the signal injection to eliminate the harmonics from the voltage and current response. By substituting the voltage and current response into a symmetrical transformation, positive- and negative-sequence impedance can be derived. Figure 6 illustrates a circuit for signal injection and impedance measurement adopted from [34].
The symmetrical transformation identifies the positive- and negative-sequence currents from the phase currents as follows:
I p I n = 1 3 T I a I a , B G H I b I b , B G H I c I c , B G H
T = 1 e j 2 π / 3 e j 4 π / 3 1 e j 4 π / 3 e j 2 π / 3
where the upper case letters denote the components in the frequency domain, the subscript B G H denotes the background harmonics, and p and n denote the positive and negative components, respectively. The positive- and negative-sequence voltages can be obtained in a similar way from the line-to-line voltages, as follows:
V p V n = 1 3 3 U T V a b V a b , B G H V b c V b c , B G H V c a V c a , B G H
U = e j π / 6 0 0 e j π / 6
On the basis of Equations (15) and (17), the positive- and negative-sequence impedance at a certain frequency can be derived as follows:
Z p ( w ) = V p ( w ) / I p ( w )
Z n ( w ) = V n ( w ) / I n ( w )
Figure 7 compares the frequency response of Equation (14) with the impedance measurement of the converter model. It demonstrates that the frequency response closely matches the impedance measurement and that the converter admittance equation applies to impedance-based stability analysis without the aforementioned coupling terms. Small deviations from the measurement as a result of the coupling term exist, which are, however, worthy of being traded-off for the computational benefit and analytic insight by neglecting the loose coupling. We note also that this research does not investigate the low-frequency range under 100 Hz but focuses on the high-frequency harmonics.

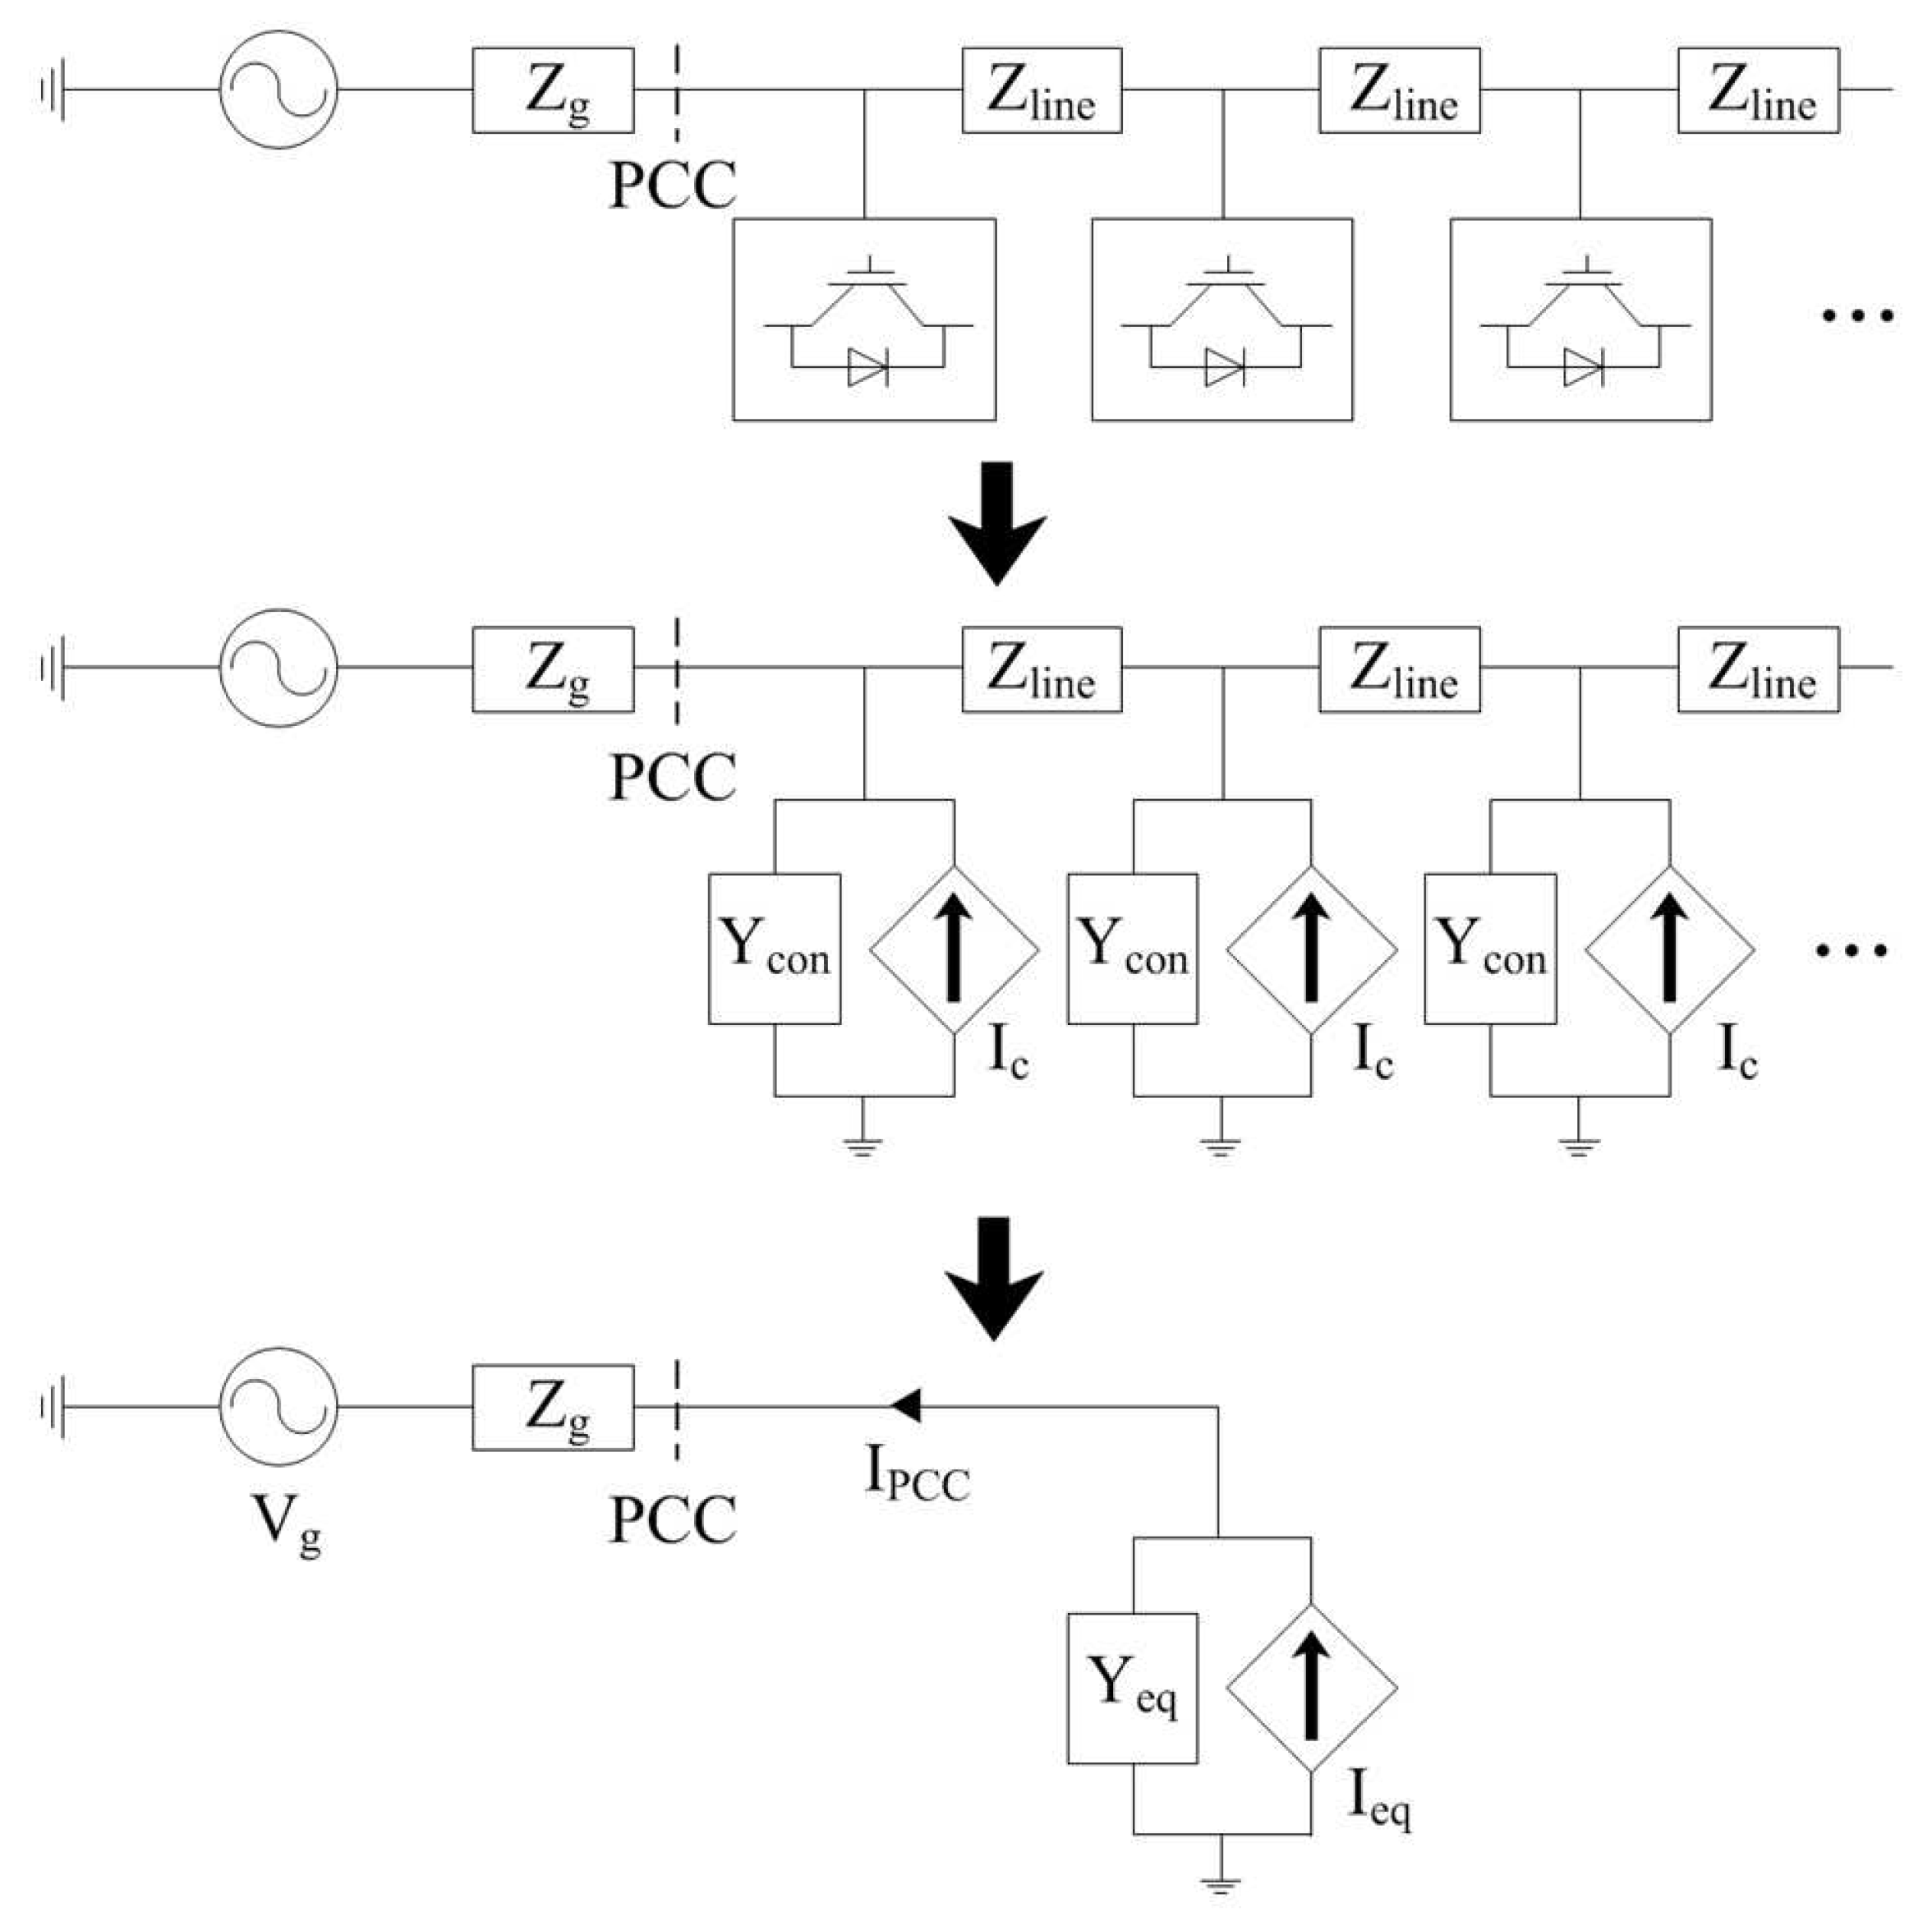
3. Equivalent Impedance Modeling

In order to investigate the stability of multiple CIGs, an equivalent impedance for multiple CIGs is introduced, as illustrated in Figure 8. The line impedance between the converters is modeled as R + j w L with the assumption of a short distance between them. According to Equation (12), the converter can be represented as a parallel connection of a current source and an admittance. The converter admittance, line impedance, and grid impedance are considered in the impedance-based stability analysis. The equivalent admittance observed from the PCC to the converter side is thus derived as follows:
Y e q = Y c o n + 1 Z l i n e + 1 Y c o n + 1 Z l i n e +
This equation is derived from the repetitive pattern of the converter admittance Y c o n obtained in the previous section and the line impedance until the equation covers all the converter-side impedances. In the equivalent circuit, which is the third circuit in Figure 8, the current flowing to the grid, I P C C , is derived as:
I P C C = Y g Y g + Y e q I e q Y e q Y g + Y e q V g Z g
where Y g is the inverse of Z g and I e q is the total current generated from the converters. In this study, the current generated from each converter is assumed to be stable in order to focus on the interconnection among multiple converters. Under the assumption that V g / Z g is also stable, the stability of I P C C can be determined by the common term on the right-hand side, 1 / ( Y g + Y e q ) , in Equation (22).

4. Case Studies

4.1. System Configuration

Figure 9 presents an AC system, illustrating two existing CIGs (labeled as “Converter”) and a CIG to be installed. Points 1 and 2 are assumed to be candidate sites for the third CIG. The CIGs are assumed to be identical with the same control parameters and filter impedance, for the simplicity of analysis. The line capacitance is neglected as before. The DC sources are connected to the DC side. The active power output from each CIG is 100 kW. In the case of the PI-controlled converter, the PLL is set such that the q-axis voltage is 0. The reference of the q-axis current is set to 0 for minimal impact of the coupling term. The line length is set to 1.6 km. All the parameters of the existing and new CIGs for the base case are shown in the Appendix A. Subscripts 1 and 2 denote the parameters of the existing CIGs and the additional CIG, respectively.
Figure 10 shows the poles of the common term, 1 / ( Y g + Y e q ) , as explained in the previous section, for the base case consisting of two CIGs without the additional CIG. As shown in the figure, the base-case system is stable with dominant poles at 489 Hz. The natural frequency of the dominant pole is used to identify the major harmonic components when the system is unstable.

4.2. Connection Point Variation

Figure 11 shows the poles of the common term when the additional CIG is connected to either point 1 or point 2. When the additional CIG is connected to point 2, the system becomes stable with dominant poles at 394 Hz. However, the connection of the additional CIG to point 1 makes the system unstable. The frequency of the dominant poles is changed from 394 to 287 Hz, owing to the change of the system structure. The system instability is observed in the form of a harmonic inclusion. Figure 12 shows the current waveforms at the PCC when the additional converter is connected to point 1 or 2. The upper graph shows the case of connection to point 1, which results in system instability with severe harmonic distortion, whereas the lower graph shows the case of connection to point 2, without severe harmonic distortion. Moreover, the dominant harmonic component in the case of an unstable system appears at the frequency at which the dominant poles exist. Figure 13 shows the current harmonic magnitudes in the case of an unstable system. The interharmonic components are summed up in the integer-order harmonic components on the basis of the subgrouping method in IEC61000-4-7 [35]. Because the dominant pole exists at 287 Hz, the dominant harmonic component is also observed at the fifth-order.
At the connection point 1, the electrical distance between the additional CIG and PCC appears to be the primary contributor to the system stability. The impact of the additional CIG at the connection point 1 on the PCC is stronger than that at the connection point 2. During planning, it is recommended to pay special attention to the parameters affecting the electrical distance, such as the conductor type and system configuration, which can also affect the system loss. Mitigation or correction measures by controls may be considered, as addressed in the following section.

4.3. Control Parameter Variation

In the previous section, it is shown that the connection point could impact the system stability significantly. However, if point 1 is the preferred option for economic or environmental reasons, tuning controllers may be adopted to stabilize the grid, which affects the converter impedance as presented in Equation (14). Figure 14 shows the poles of the common term when the proportional gain K p , 2 of the additional CIG connected to point 1 is changed from 1.15 to 0.8. As the proportional gain decreases, the dominant poles move to a stable region accompanied by a change of frequency of the dominant poles from 287 to 505 Hz. Compared to the proportional gain, the integral gain shows a different characteristic in pole movement, as shown in Figure 15. The small figure in the dashed rectangular box is the enlarged plot of the region of the dominant poles. As the integral gain of the additional CIG K i , 2 is changed from 50 to 200, the dominant poles do not show a significant positional change. This indicates that the integral gain rarely affects the system stability. These results are related with the converter admittance in Equation (14). The proportional gain has an impact on the pole of the converter admittance, whereas the effect of the integral gain on the pole is limited, owing to the small time delay.
In order to secure the system stability, a smaller proportional gain would be appropriate. However, a smaller proportional gain also results in a slow response time of the converter. Therefore, the converter parameters should be tuned by considering both the performance of the converter and the system stability.

4.4. Distance Variation

When there are two proposed sites for the additional CIG, the distance between the converters is another factor to be considered for the system stability. It is assumed that one site is 1.6 km away from point 2 and the other site is located 1.0 km away from point 2. The additional CIG is expected to be connected to point 2 ( K p , 2 = 1.15 and K i , 2 = 50). Figure 16 shows the pole movement for various lengths of the line connecting the additional converter and grid-connected converter. The system is stable for the line length of 1.6 km, whereas the system becomes unstable for the line length of 1.0 km, owing to the reduced resistance, that is, damping. In the unstable case, the frequency of the dominant poles is changed from 394 to 439 Hz and results in a significant seventh-order harmonic, as shown in Figure 17. Compared with Figure 13, the highest harmonic order is changed, owing to the frequency change of the dominant poles. This indicates that the impedance of the grid has an impact on the frequency of the dominant poles.

4.5. Converter Disconnection Contingency

Owing to converter malfunction or maintenance, the converter can be disconnected from the grid. The disconnection of the converter changes the equivalent impedance and system stability. Figure 18 shows the pole movement when the additional converter is connected to point 2 and circuit breaker 1 (CB1) is opened as a result of the converter malfunction. Opening CB1 results in system instability with the dominant poles at 398 Hz. Compared to the base case, which only includes the grid-connected converters as discussed in the previous section, this case has the same grid topology as the base case except for a larger grid impedance and larger proportional gain of the converter. In other words, the increase in the grid impedance and proportional gain as compared to the base case results in system instability. Figure 19 shows the current waveforms when CB1 is opened at 0.5 s. Before the CB1 operation, the system is stable and there is no severe harmonic, whereas after the CB1 operation, the harmonics become increasingly severe, owing to the system instability. In order to maintain the stability of the system despite the converter disconnection, the operation of another CB or the adjustment of proportional gain is considered. Figure 20 shows three measures that can be considered to secure the system stability after CB1 is opened. When CB2 is sequentially opened, the system is still unstable, owing to the high grid impedance and high proportional gain of the additional converter. In contrast, when CB3 is opened, the system becomes stable, owing to the low proportional gain of the grid-connected converter. When the proportional gain of the additional converter is set to 0.7, the system is stable despite CB1 being opened.

5. Conclusions

Existing time-domain phasor-based and EMT simulation tools lack the capability of capturing the fast dynamics of power electronic converters and providing analytical insights. Motivated by this observation, an analytical approach is developed in the current study for the impact analysis of a new CIG interconnection. First, the output impedance of the new CIG is theoretically developed by incorporating control dynamics and an interface filter, such as the LCL filter in this study. On the basis of this converter output impedance model, the equivalent impedance of the power grid at the PCC is subsequently derived. This impedance model represents the new as well as the existing nearby converters and is used to evaluate the influence of the interactions among converters under various planning options and credible operating conditions on the system stability (e.g., points of interconnection (or sites), line distance (or impedance), control parameters, generator tripping, etc). Detailed EMT simulations have demonstrated the accuracy and efficacy of the derived models and methods.
The proposed method is beneficial and is desired in generator interconnection studies, owing particularly to the increased adoption of photovoltaic or wind resources. The analytical results can reinforce the findings from time-domain simulations and enable the identification of any operational risks of the proposed interconnection project, critical design parameters and any mitigation measures for successful integration and grid security.
In order to reinforce and exploit the findings from this research, we continue our research efforts in the following:
  • Exploring the likely scenarios in power grids with high penetration of the CIG and gaining insights into the underlying mechanism.
  • Investigating abnormal grid conditions due to, for example, single- and three-phase line faults and emergency response of the advanced CIGs.
  • Investigating more utility-friendly ways to represent and understand the study results.
  • Developing robust and damping control methods to avoid and mitigate the stability concerns for various conditions.

Acknowledgments

This research was supported by the Korea Electric Power Corporation (grant number: R15XA03-28). This research was supported by Korea Electric Power Corporation. (Grant number: R17XA05-4).

Author Contributions

Youngho Cho investigated the impedance-based analysis and conducted simulation studies under the supervision of the corresponding author, Kyeon Hur. Yong Cheol Kang and Eduard Muljadi helped improve the theoretical aspects and practicality of this study.

Conflicts of Interest

The authors declare no conflict of interest.

Appendix A. System Parameters

Table A1. Grid parameters.
ParametersValues
Grid voltage400 V
Grid frequency60 Hz
Grid impedance R g r i d 0.4 Ω
L g r i d 0.3 mH
Line impedance R l i n e 0.4375 Ω /km
L l i n e 0.875 mH/km
Distance between converters1.6 km
Table A2. Converter parameters.
ParametersValues
Switching frequency1980 Hz
Switching delay ( T d )20 μ s
Filter impedance L g 0.4 mH
C f 200 uF
L c 1.5 mH
PI control K p , 1 0.5
K p , 2 1.15
K i , 1 = K i , 2 50
PLL K p , p l l 140
K i , p l l 9800

References

  1. GE Energy. Western Wind and Solar Integration Study; Technical Report; The National Renewable Energy Laboratory: Golden, CO, USA, 2010.
  2. PJM. Generation and Transmission Interconnection Process; Technical Report; PJM: Norristown, PA, USA, 2016. [Google Scholar]
  3. Hoseinpour, A.; Barakati, S.M.; Ghazi, R. Harmonic reduction in wind turbine generators using a Shunt Active Filter based on the proposed modulation technique. Int. J. Electr. Power Energy Syst. 2012, 43, 1401–1412. [Google Scholar] [CrossRef]
  4. Chen, Z.; Luo, A.; Kuang, H.; Zhou, L.; Chen, Y.; Huang, Y. Harmonic resonance characteristics of large-scale distributed power plant in wideband frequency domain. Electr. Power Syst. Res. 2017, 143, 53–65. [Google Scholar] [CrossRef]
  5. Monjo, L.; Sainz, L.; Liang, J.; Pedra, J. Study of resonance in wind parks. Electr. Power Syst. Res. 2015, 128, 30–38. [Google Scholar] [CrossRef]
  6. Guerrero-Rodríguez, N.; Rey-Boué, A.B. Modelling, simulation and experimental verification for renewable agents connected to a distorted utility grid using a Real-Time Digital Simulation Platform. Energy Convers. Manag. 2014, 84, 108–121. [Google Scholar] [CrossRef]
  7. Cho, Y.; Lee, C.; Hur, K.; Kang, Y.C.; Muljadi, E.; Park, S.H.; Choy, Y.D.; Yoon, G.G. A Framework to Analyze the Stochastic Harmonics and Resonance of Wind Energy Grid Interconnection. Energies 2016, 9, 700. [Google Scholar] [CrossRef]
  8. Sun, J. Power Quality in Renewable Energy Systems—Challenges and Opportunities. In Proceedings of the International Conference on Renewable Energies and Power Quality, Santiago de Compostela, Spain, 28–30 March 2012. [Google Scholar]
  9. Zhou, J.Z.; Ding, H.; Fan, S.; Zhang, Y.; Gole, A.M. Impact of Short-Circuit Ratio and Phase-Locked-Loop Parameters on the Small-Signal Behavior of a VSC-HVDC Converter. IEEE Trans. Power Del. 2014, 29, 2287–2296. [Google Scholar] [CrossRef]
  10. Zhang, L.; Harnefors, L.; Nee, H.P. Interconnection of Two Very Weak AC Systems by VSC-HVDC Links Using Power-Synchronization Control. IEEE Trans. Power Syst. 2011, 26, 344–355. [Google Scholar] [CrossRef]
  11. Mohamed, Y.A.R.I.; El-Saadany, E.F. Adaptive Decentralized Droop Controller to Preserve Power Sharing Stability of Paralleled Inverters in Distributed Generation Microgrids. IEEE Trans. Power Electron. 2008, 23, 2806–2816. [Google Scholar] [CrossRef]
  12. Radwan, A.A.A.; Mohamed, Y.A.R.I. Assessment and Mitigation of Interaction Dynamics in Hybrid AC/DC Distribution Generation Systems. IEEE Trans. Smart Grid 2012, 3, 1382–1393. [Google Scholar] [CrossRef]
  13. Xu, L.; Fan, L. Impedance-Based Resonance Analysis in a VSC-HVDC System. IEEE Trans. Power Del. 2013, 28, 2209–2216. [Google Scholar] [CrossRef]
  14. Sun, J. Impedance-Based Stability Criterion for Grid-Connected Inverters. IEEE Trans. Power Electron. 2011, 26, 3075–3078. [Google Scholar] [CrossRef]
  15. Cespedes, M.; Sun, J. Impedance Modeling and Analysis of Grid-Connected Voltage-Source Converters. IEEE Trans. Power Electron. 2014, 29, 1254–1261. [Google Scholar] [CrossRef]
  16. Sun, J. Small-Signal Methods for AC Distributed Power Systems-A Review. IEEE Trans. Power Electron. 2009, 24, 2545–2554. [Google Scholar]
  17. Song, Y.; Wang, X.; Blaabjerg, F. Impedance-Based High-Frequency Resonance Analysis of DFIG System in Weak Grids. IEEE Trans. Power Electron. 2017, 32, 3536–3548. [Google Scholar] [CrossRef]
  18. Cao, W.; Ma, Y.; Yang, L.; Wang, F.; Tolbert, L.M. D-Q Impedance Based Stability Analysis and Parameter Design of Three-Phase Inverter-Based AC Power Systems. IEEE Trans. Ind. Electron. 2017, 64, 6017–6028. [Google Scholar] [CrossRef]
  19. Wen, B.; Dong, D.; Boroyevich, D.; Burgos, R.; Mattavelli, P.; Shen, Z. Impedance-Based Analysis of Grid-Synchronization Stability for Three-Phase Paralleled Converters. IEEE Trans. Power Electron. 2016, 31, 26–38. [Google Scholar] [CrossRef]
  20. Bayo-Salas, A.; Beerten, J.; Rimez, J.; Hertem, D.V. Impedance-based stability assessment of parallel VSC HVDC grid connections. In Proceedings of the 11th IET International Conference on AC and DC Power Transmission, Birmingham, UK, 10–12 February 2015; pp. 1–9. [Google Scholar]
  21. Lyu, J.; Cai, X.; Molinas, M. Frequency Domain Stability Analysis of MMC-Based HVdc for Wind Farm Integration. IEEE J. Emerg. Sel. Top. Power Electron. 2016, 4, 141–151. [Google Scholar] [CrossRef]
  22. Wang, X.; Blaabjerg, F.; Wu, W. Modeling and Analysis of Harmonic Stability in an AC Power-Electronics-Based Power System. IEEE Trans. Power Electron. 2014, 29, 6421–6432. [Google Scholar] [CrossRef]
  23. Wang, X.; Blaabjerg, F.; Liserre, M.; Chen, Z.; He, J.; Li, Y. An Active Damper for Stabilizing Power-Electronics-Based AC Systems. IEEE Trans. Power Electron. 2014, 29, 3318–3329. [Google Scholar] [CrossRef]
  24. Yoon, C.; Bai, H.; Beres, R.N.; Wang, X.; Bak, C.L.; Blaabjerg, F. Harmonic Stability Assessment for Multiparalleled, Grid-Connected Inverters. IEEE Trans. Sustain. Energy 2016, 7, 1388–1397. [Google Scholar] [CrossRef]
  25. Roinila, T.; Messo, T.; Santi, E. MIMO-Identification Techniques for Rapid Impedance-based Stability Assessment of Three Phase Systems in DQ Domain. IEEE Trans. Power Electron. 2017, PP, 1. [Google Scholar] [CrossRef]
  26. Roinila, T.; Vilkko, M.; Sun, J. Online Grid Impedance Measurement Using Discrete-Interval Binary Sequence Injection. IEEE J. Emerg. Sel. Top. Power Electron. 2014, 2, 985–993. [Google Scholar] [CrossRef]
  27. Golnaraghi, F.; Kuo, B.C. Automatic Control Systems, 9th ed.; Wiley: Hoboken, NJ, USA, 2010. [Google Scholar]
  28. Teodorescu, R.; Liserre, M.; Rodriguez, P. Grid Converters for Photovoltaic and Wind Power Systems; Wiley: West Sussex, UK, 2011. [Google Scholar]
  29. Kaura, V.; Blasko, V. Operation of a phase locked loop system under distorted utility conditions. IEEE Trans. Ind. Appl. 1997, 33, 58–63. [Google Scholar] [CrossRef]
  30. Chung, S.K. A phase tracking system for three phase utility interface inverters. IEEE Trans. Power Electron. 2000, 15, 431–438. [Google Scholar] [CrossRef]
  31. Golestan, S.; Guerrero, J.M. Conventional Synchronous Reference Frame Phase-Locked Loop is an Adaptive Complex Filter. IEEE Trans. Ind. Electron. 2015, 62, 1679–1682. [Google Scholar] [CrossRef]
  32. Li, G.; Du, Z.; An, T.; Xia, Y.; Lei, J. Impact of PLL and VSC control parameters on the AC/MTDC systems stability. Electr. Power Syst. Res. 2016, 141, 476–486. [Google Scholar] [CrossRef]
  33. Yazdani, A.; Iravani, R. Voltage-Sourced Converters in Power Systems: Modeling, Control, and Applications; Wiley: Hoboken, NJ, USA, 2010. [Google Scholar]
  34. Cespedes, M.; Sun, J. Three-phase impedance measurement for system stability analysis. In Proceedings of the 2013 IEEE 14th Workshop on Control and Modeling for Power Electronics (COMPEL), Salt Lake City, UT, USA, 23–26 June 2013; pp. 1–6. [Google Scholar]
  35. Electromagnetic Compatibility (EMC)-Part 4-7: Testing and Measurement Techniques-General Guide on Harmonics and Interharmonics Measurements and Instrumentation, for Power Supply Systems and Equipment Connected Thereto; IEC 61000-4-7; International Electrotechnical Commission: Geneva, Switzerland, 2002.
Figure 1. Proposed analytical approach: derive and validate the theoretical impedance models of a new converter-interfaced generator (CIG) and the power grid at the point of common coupling (PCC); conduct stability assessment for various planning options and operating scenarios.
Energies 10 01355 g001
Figure 2. Control block diagram of the synchronous reference frame phase-locked loop (PLL).
Energies 10 01355 g002
Figure 3. Bode plot of the synchronous reference frame phase-locked loop (PLL).
Energies 10 01355 g003
Figure 4. Circuit diagram and control system of the power converter: (a) overall control system and (b) d-axis current-control block diagram.
Energies 10 01355 g004
Figure 5. Simplified d-axis current-control block diagram without the coupling term.
Energies 10 01355 g005
Figure 6. Circuit for signal injection and impedance measurement.
Energies 10 01355 g006
Figure 7. Comparison between the impedance measurement and frequency response of the impedance equation.
Energies 10 01355 g007
Figure 8. Equivalent model of multiple grid-connected converter-interfaced generators (CIGs).
Energies 10 01355 g008
Figure 9. AC system configuration of a converter-connected grid with the additional converter to be installed.
Energies 10 01355 g009
Figure 10. Poles of 1 / ( Y g + Y e q ) for the base case that includes two grid-connected converters.
Energies 10 01355 g010
Figure 11. Poles of 1 / ( Y g + Y e q ) depending on the connection point of the additional converter.
Energies 10 01355 g011
Figure 12. Current waveforms at the point of common coupling (PCC) depending on the connection point of the additional converter. The upper graph shows the case of connection to point 1, whereas the lower graph shows the case of connection to point 2.
Energies 10 01355 g012
Figure 13. Current harmonic components at the point of common coupling (PCC) when the system becomes unstable, owing to the connection point.
Energies 10 01355 g013
Figure 14. Poles of 1 / ( Y g + Y e q ) when the proportional gain of the additional converter parameter changes.
Energies 10 01355 g014
Figure 15. Poles of 1 / ( Y g + Y e q ) when the integral gain of the additional converter parameter changes.
Energies 10 01355 g015
Figure 16. Poles of 1 / ( Y g + Y e q ) when the distance between the converters varies ( K p , 2 = 1.15 and K i , 2 = 50 ).
Energies 10 01355 g016
Figure 17. Current harmonic components at the point of common coupling (PCC) when the system is unstable owing to short line length.
Energies 10 01355 g017
Figure 18. Poles of 1 / ( Y g + Y e q ) when CB1 is opened owing to converter malfunction.
Energies 10 01355 g018
Figure 19. Current waveforms at the point of common coupling (PCC) when CB1 is opened at 0.5 s.
Energies 10 01355 g019
Figure 20. Poles of 1 / ( Y g + Y e q ) after CB1 is opened.
Energies 10 01355 g020

