Abstract
In this study, laboratory experiments and simulations have been conducted to investigate single water phase flow through self-affine rough fractures. It is the first time that 3D printing technology is proposed for the application of generating self-affine rough fractures. The experimental setup was designed to measure the water volume by dividing the discharging surface into five sections with equal distances under constant injection flow rates. Water flow through self-affine rough fractures was simulated numerically by using the Lattice Boltzmann method (LBM). An agreement between the experimental data and the numerical simulation results was achieved. The fractal dimension is positively correlated to fracture surface roughness and the fracture inclination represents the gravity force acting on the water flow. The influences of fracture inclinations, fractal dimensions, and mismatch wavelengths were studied and analyzed, with an emphasis on flow paths through a self-affine rough fracture. Different values of fractal dimensions, fracture inclinations, and mismatch wavelengths result in small changes of flow rates from five sections of discharging surface. However, the section of discharging surface with the largest flow rate remains constant. In addition, it is found that the gravity force can affect flow paths. Combined with the experimental data, the simulation results are used to explain the preferential flow paths through fracture rough surfaces from a new perspective. The results may enhance our understanding of fluid flow through fractures and provide a solid background for further research in the areas of energy exploration and production.
1. Introduction
Fluid flow in fracture networks that are constituted by individual fractures in reservoir rocks is encountered in different areas, such as enhanced oil and gas recovery, geothermal reservoir exploitation, geological sequestration of carbon dioxide, and water resources exploitation [1,2,3,4]. Therefore, the understanding of fluid flow in a fracture is of crucial importance for modeling flow in more complex fracture networks.
For fully saturated, single phase flow in a single fracture, the parallel plate model is the most widely used conceptual model because it is very convenient for quantitative analysis [5,6]. In a parallel plate model, the derivation of the cubic law is given as the solution to the Navier-Stokes equations for incompressible, steady state flow through a single fracture [7]. However, it ignores the complex roughness of actual fracture surfaces. The roughness of fracture surfaces is of great importance in qualifying the flow and transport processes through fractures. Although the roughness of fractures is really complex, many experimental approaches and modeling methods have been proposed to investigate fracture roughness and its impact on flow. Among different experimental approaches, X-ray computed tomography and 3D laser scanning techniques have been proved as effective experimental approaches to characterize fracture surfaces with variable apertures [8,9,10]. Experimental studies show that fracture roughness determines fracture aperture density distribution and affects fluid flow through fractures [11,12,13,14,15].
In order to represent fluid flow through fractures, the Reynolds Lubrication Equation was introduced, describing laminar flow between slightly nonparallel surfaces, a more computationally intensive solution of the Navier-Stokes equations [16]. A new model considering the spatial variability of fracture apertures was developed by solving the Reynolds equation [17], which is well known as the classical Local Cubic Law. On the basis of solving the Reynolds Equation, many researchers evaluated and applied this approximation for estimating the hydraulic behaviors of rough-walled fractures [18,19,20,21]. Modeling a rough-walled fracture required three main parameters: the fractal dimension, the roughness at a reference length scale, and a length scale describing the degree of mismatch between two fracture surfaces [22]. The use of various simplifications of the Navier-Stokes equation including the lubrication equations was discussed, showing that at low Reynolds numbers (Re < 1), the effective cubic law aperture was lower than the actual aperture by a factor related to the ratio of the mean aperture to the aperture standard deviation [23,24]. Flow in synthetic self-affine fractures was simulated [25] and an applied range of the Reynolds Equation for flow in a fracture was analyzed by Yeo and Ge [26]. A modified Local Cubic Law that takes into account local tortuosity and roughness and works across a low range of local Reynolds Numbers was developed by Wang et al. [27].
In recent decades, the Lattice Boltzmann method (LBM), an extension of Lattice Gas Automata, has been applied to solve problems with geometrically complex boundaries [28,29,30,31,32]. Fluid flow in the fractures with rough surfaces was modeled and simulated using the Lattice Gas Automata [33,34]. LBM was applied for the permeability prediction of rough-walled fractures through various simulation confining pressure conditions appropriate to mid-crustal depths [35]. The scaling behaviors of transport properties in rough self-affine fractures was studied through the Lattice Boltzmann simulations, showing that anisotropy of the fracture has more influence on the fracture permeability than the fractal dimension and the mean fracture aperture [36]. Dou et al. [37] used the LBM to investigate the influence of wettability in a 3D self-affine rough fracture, finding that the wettability has a significant effect on the evolution of effective interfacial areas. With the application of the LBM, the influence of surface roughness on nonlinear flow behaviors in 3D self-affine rough fractures was simulated by considering the secondary roughness [38]. Briggs et al. [39] also investigated the effects of roughness on flow in fractures, showing that increasing fracture roughness led to greater eddy volumes and lower effective hydraulic conductivities for the same Re values.
2. Mathematical Methods
2.1. Generation of Fracture Rough Surfaces
The term self-affine fractal was used to describe fractal shapes that occur as natural surfaces, and are scaled by different amounts in all directions to produce statistical equivalence with self-similar fractals [40,41,42,43,44,45,46]. Mandelbrot [40] introduced the fractional Brownian motions (fBm) concept as a generalization of random function. The rough surfaces of natural fractures are generated synthetically by following a self-affine fractal distribution and the self-affinity is usually tested by fBm [34,47,48,49].
The statistical self-affine property can be expressed with the following mean and a variance of increments [50]:
where is the variance defined as a function of r, r is a constant, and H is the Hurst exponent.
The range of the Hurst exponent varies from 0 to 1, noting that the value of the Hurst exponent has been proved to mainly distribute between 0.45 and 0.85 [49,51]. The self-affine distribution is produced with the fractal dimension D = 3 − H. For example, a Hurst exponent of 0.8 means that the fractal dimension is equal to 2.2.
In addition, the variation between two real fracture surfaces should be taken into consideration [22,52]. Based on a previous study, Ogilvie et al. [53] proposed a parameter PSD ratio with the following form:
The PSDR calculates the ratio of the PSDs from the aperture with the sum of the PSDs of the two surfaces composing the fracture.
Based on the theories proposed above, the software SynFrac [53] has been used to produce 128 × 128 data sets for generating self-affine rough fracture surfaces with controlled fracture surface properties. In addition to the fractal dimension, capturing the fracture properties at all wavelengths is an important consideration when generating synthetic fractures. An example of input parameters used to generate self-affine rough fracture surfaces synthetically is shown in the following section.
2.2. Lattice Boltzmann Method
LBM provides an effective numerical method for the computational modeling of single and multiphase flow systems with complex geometries. LBM has solved the Boltzmann equation on a discrete lattice and proved that Navier-Stokes equations can be recovered at a macroscopic scale [32,54]. This method has been successfully applied to the simulation of various cases, such as flow in porous media, colloidal suspensions, and thermal flows [55,56,57].
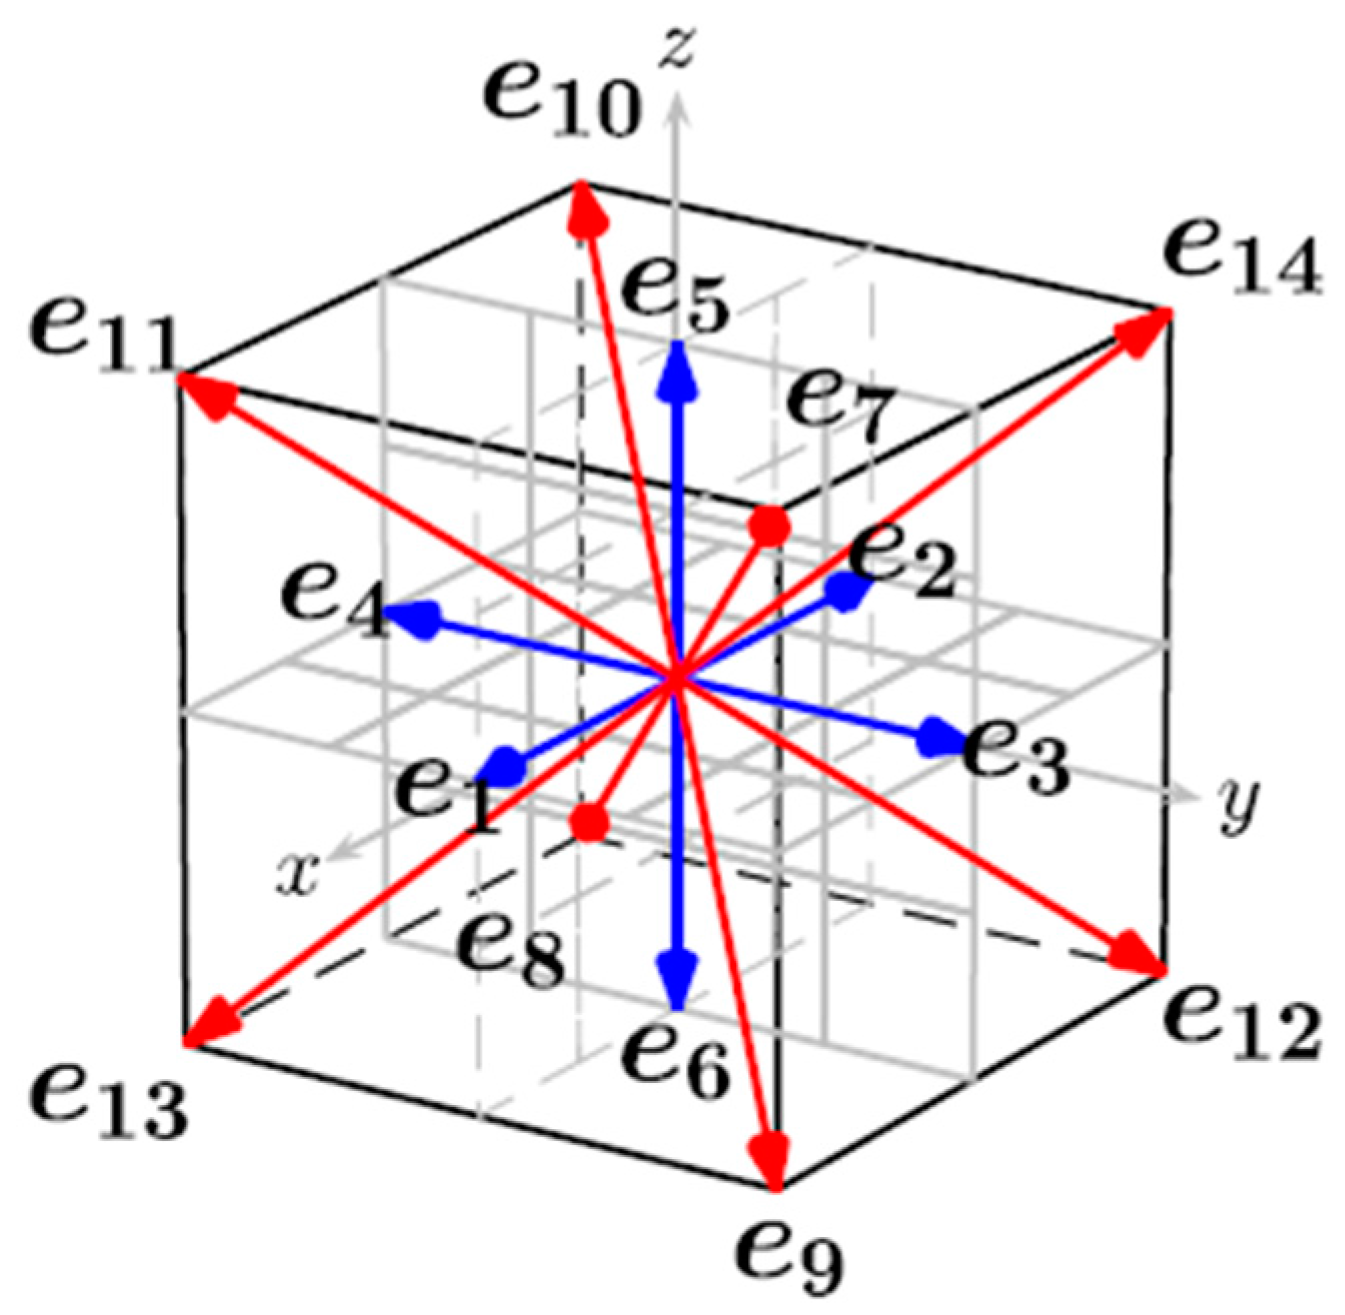
In this study, a three-dimensional D3Q15 lattice model was used for the simulation of water phase flow through a single self-affine rough fracture [58,59]. The space of the D3Q15 model is divided into a cubic domain that has fifteen discrete velocities in Figure 1 [59]. The velocity vectors are given by:
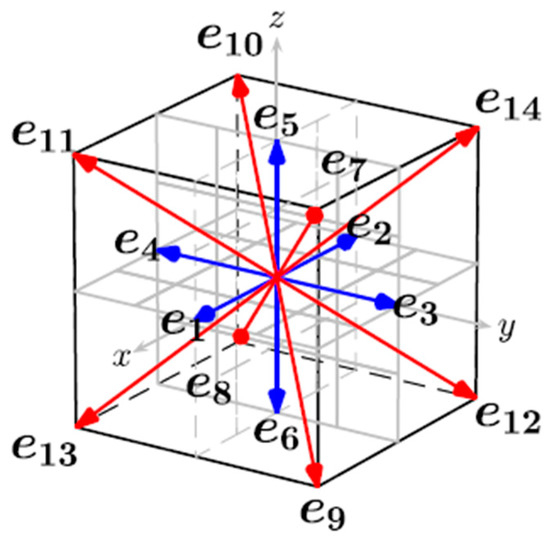
Figure 1.
Velocity vectors in an LBM cell of the D3Q15 model (Galindo-Torres et al., 2013 [59]).
Based on the Chapman-Enskog expansion of the Boltzmann equation [60], the distribution function satisfying the evolution rule is shown as follows:
where is the fluid particle distribution function with velocity (the mesoscopic velocity in the i-th direction) at position and time t, is the length of time step, and is the collision operator representing the relaxation process due to the collision of the fluid particles.
The Bhatnagar-Gross-Krook model for the collision operator is used [54]:
where τ is the relaxation time and is the equilibrium distribution.
In lattice units, the relaxation time τ governs the rate at which the fluid tends towards equilibrium with the following expression:
where ν is the kinematic viscosity of the fluid.
The definition of is given by:
with C = δx/δk defined as a characteristic lattice velocity in a cell size δx.
The bounce-back boundary condition [57,58,61,62] is used here because the fluid is assumed to be reflected by the solid boundaries. In the bounce-back condition, after the collision step, the distribution functions are swapped symmetrically as follows:
where the subscript −i refers to the opposite direction to the i-th velocity.
The density and the velocity at a cell position can be calculated as:
And the weight factors for the D3Q15 model are:
With the purpose of modeling any additional forces, a net force that modifies the velocity used for the calculation of the equilibrium function is introduced as follows [63]:
For this study, the gravity force should be taken into consideration. The additional force is , where is the gravitational acceleration [64].
3. Experimental Design and Setup
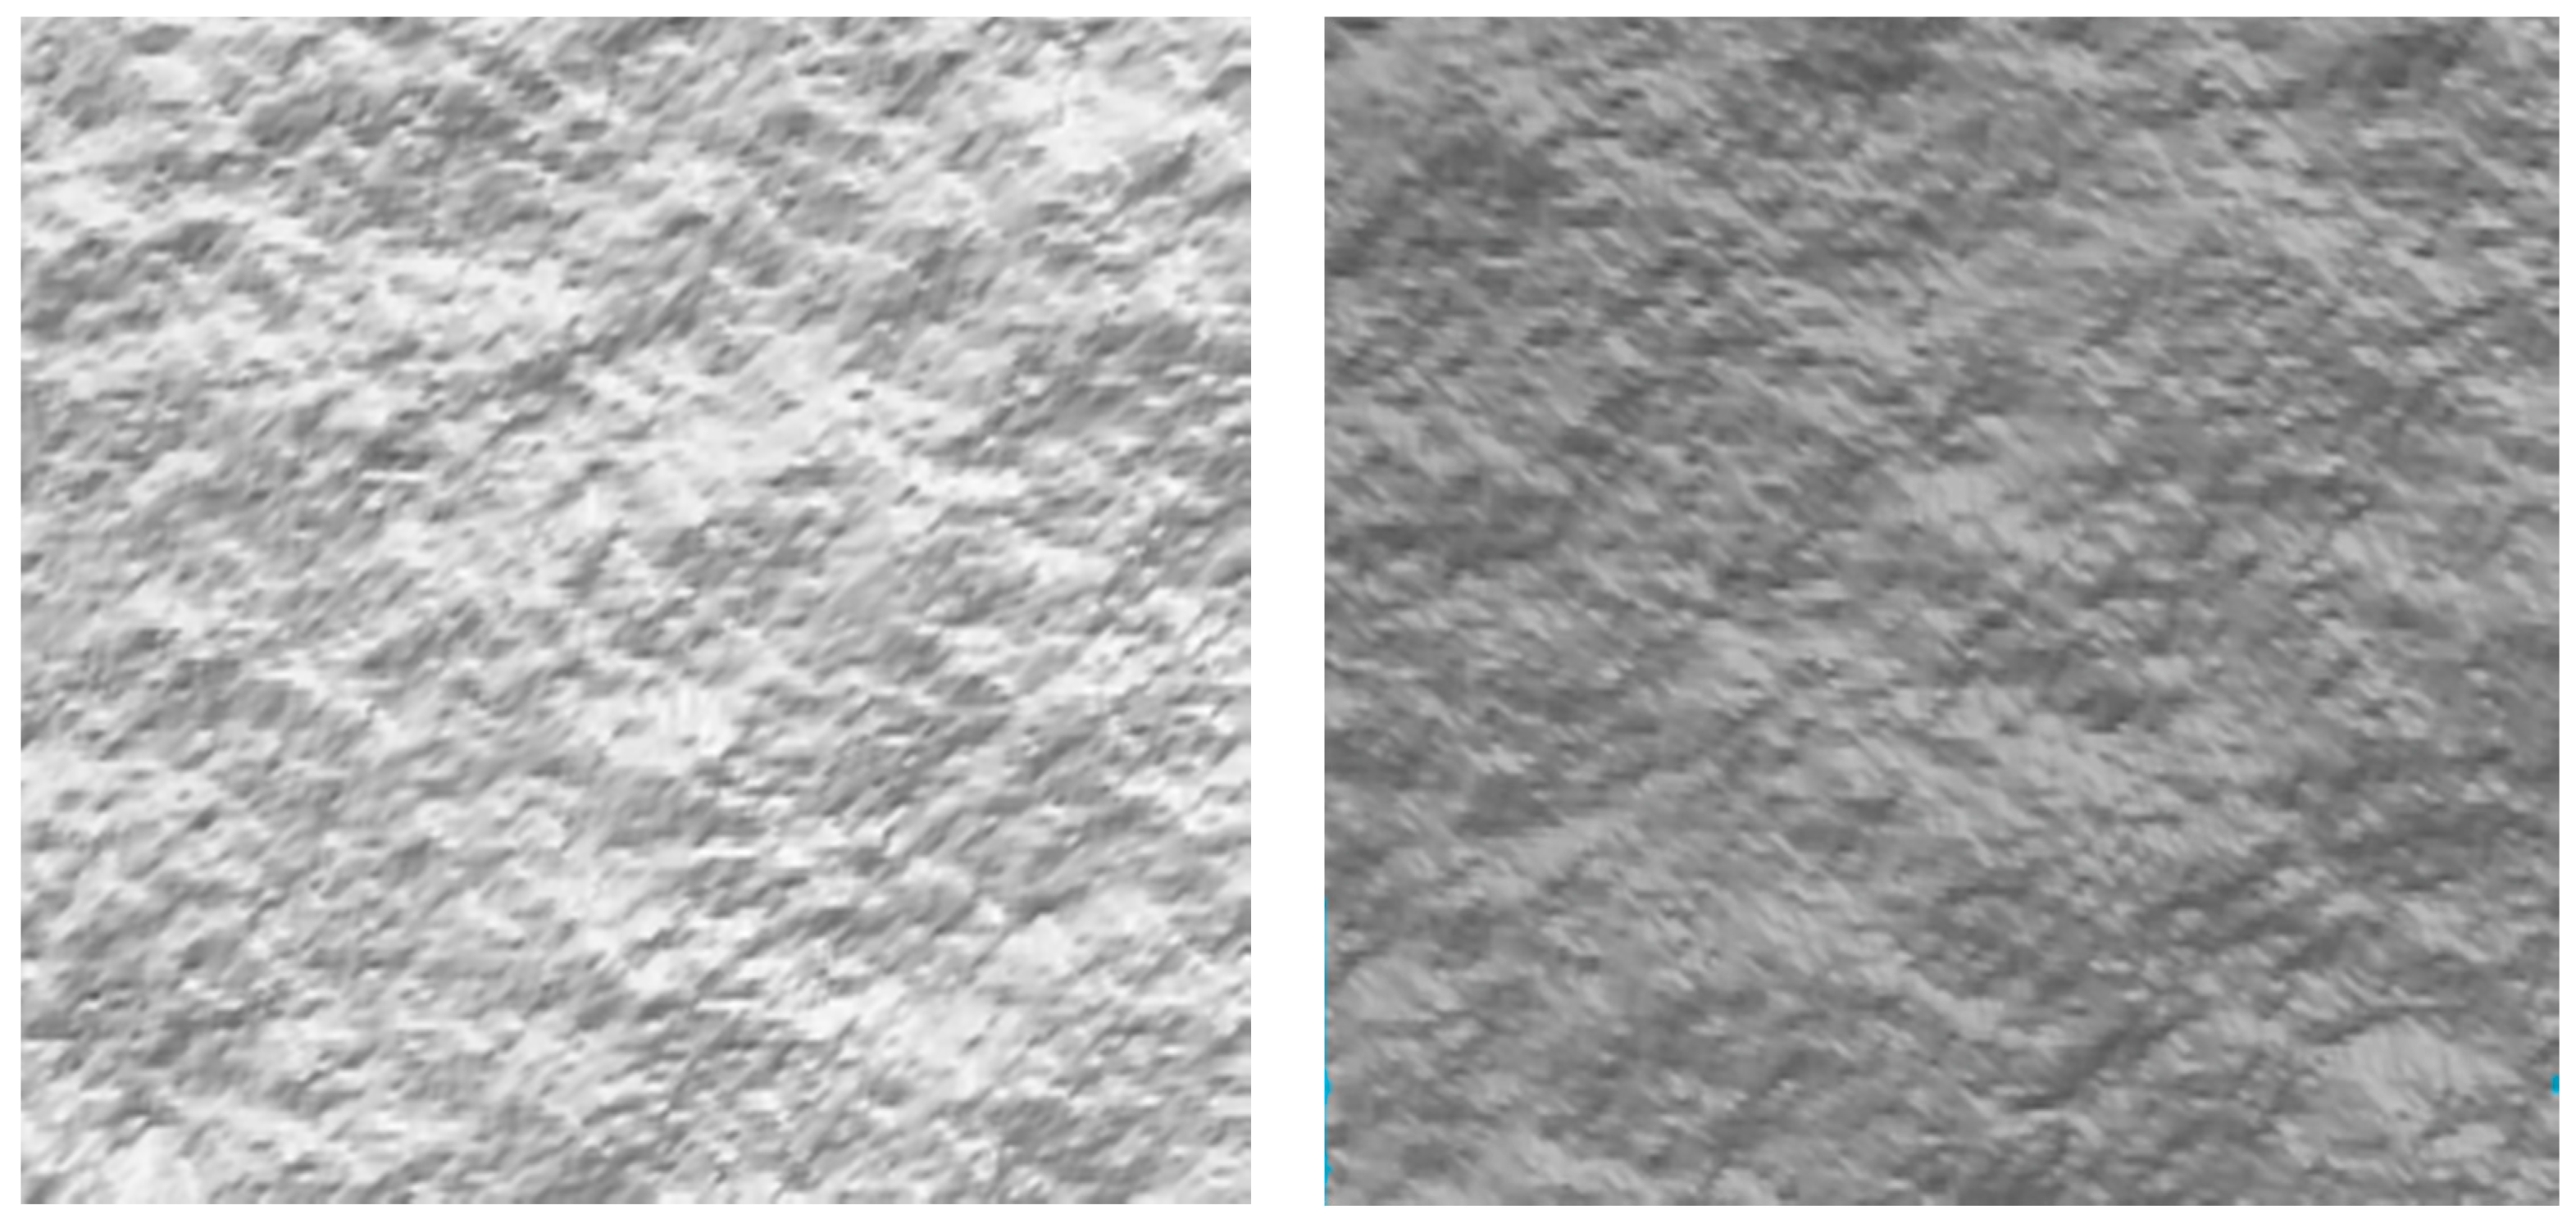
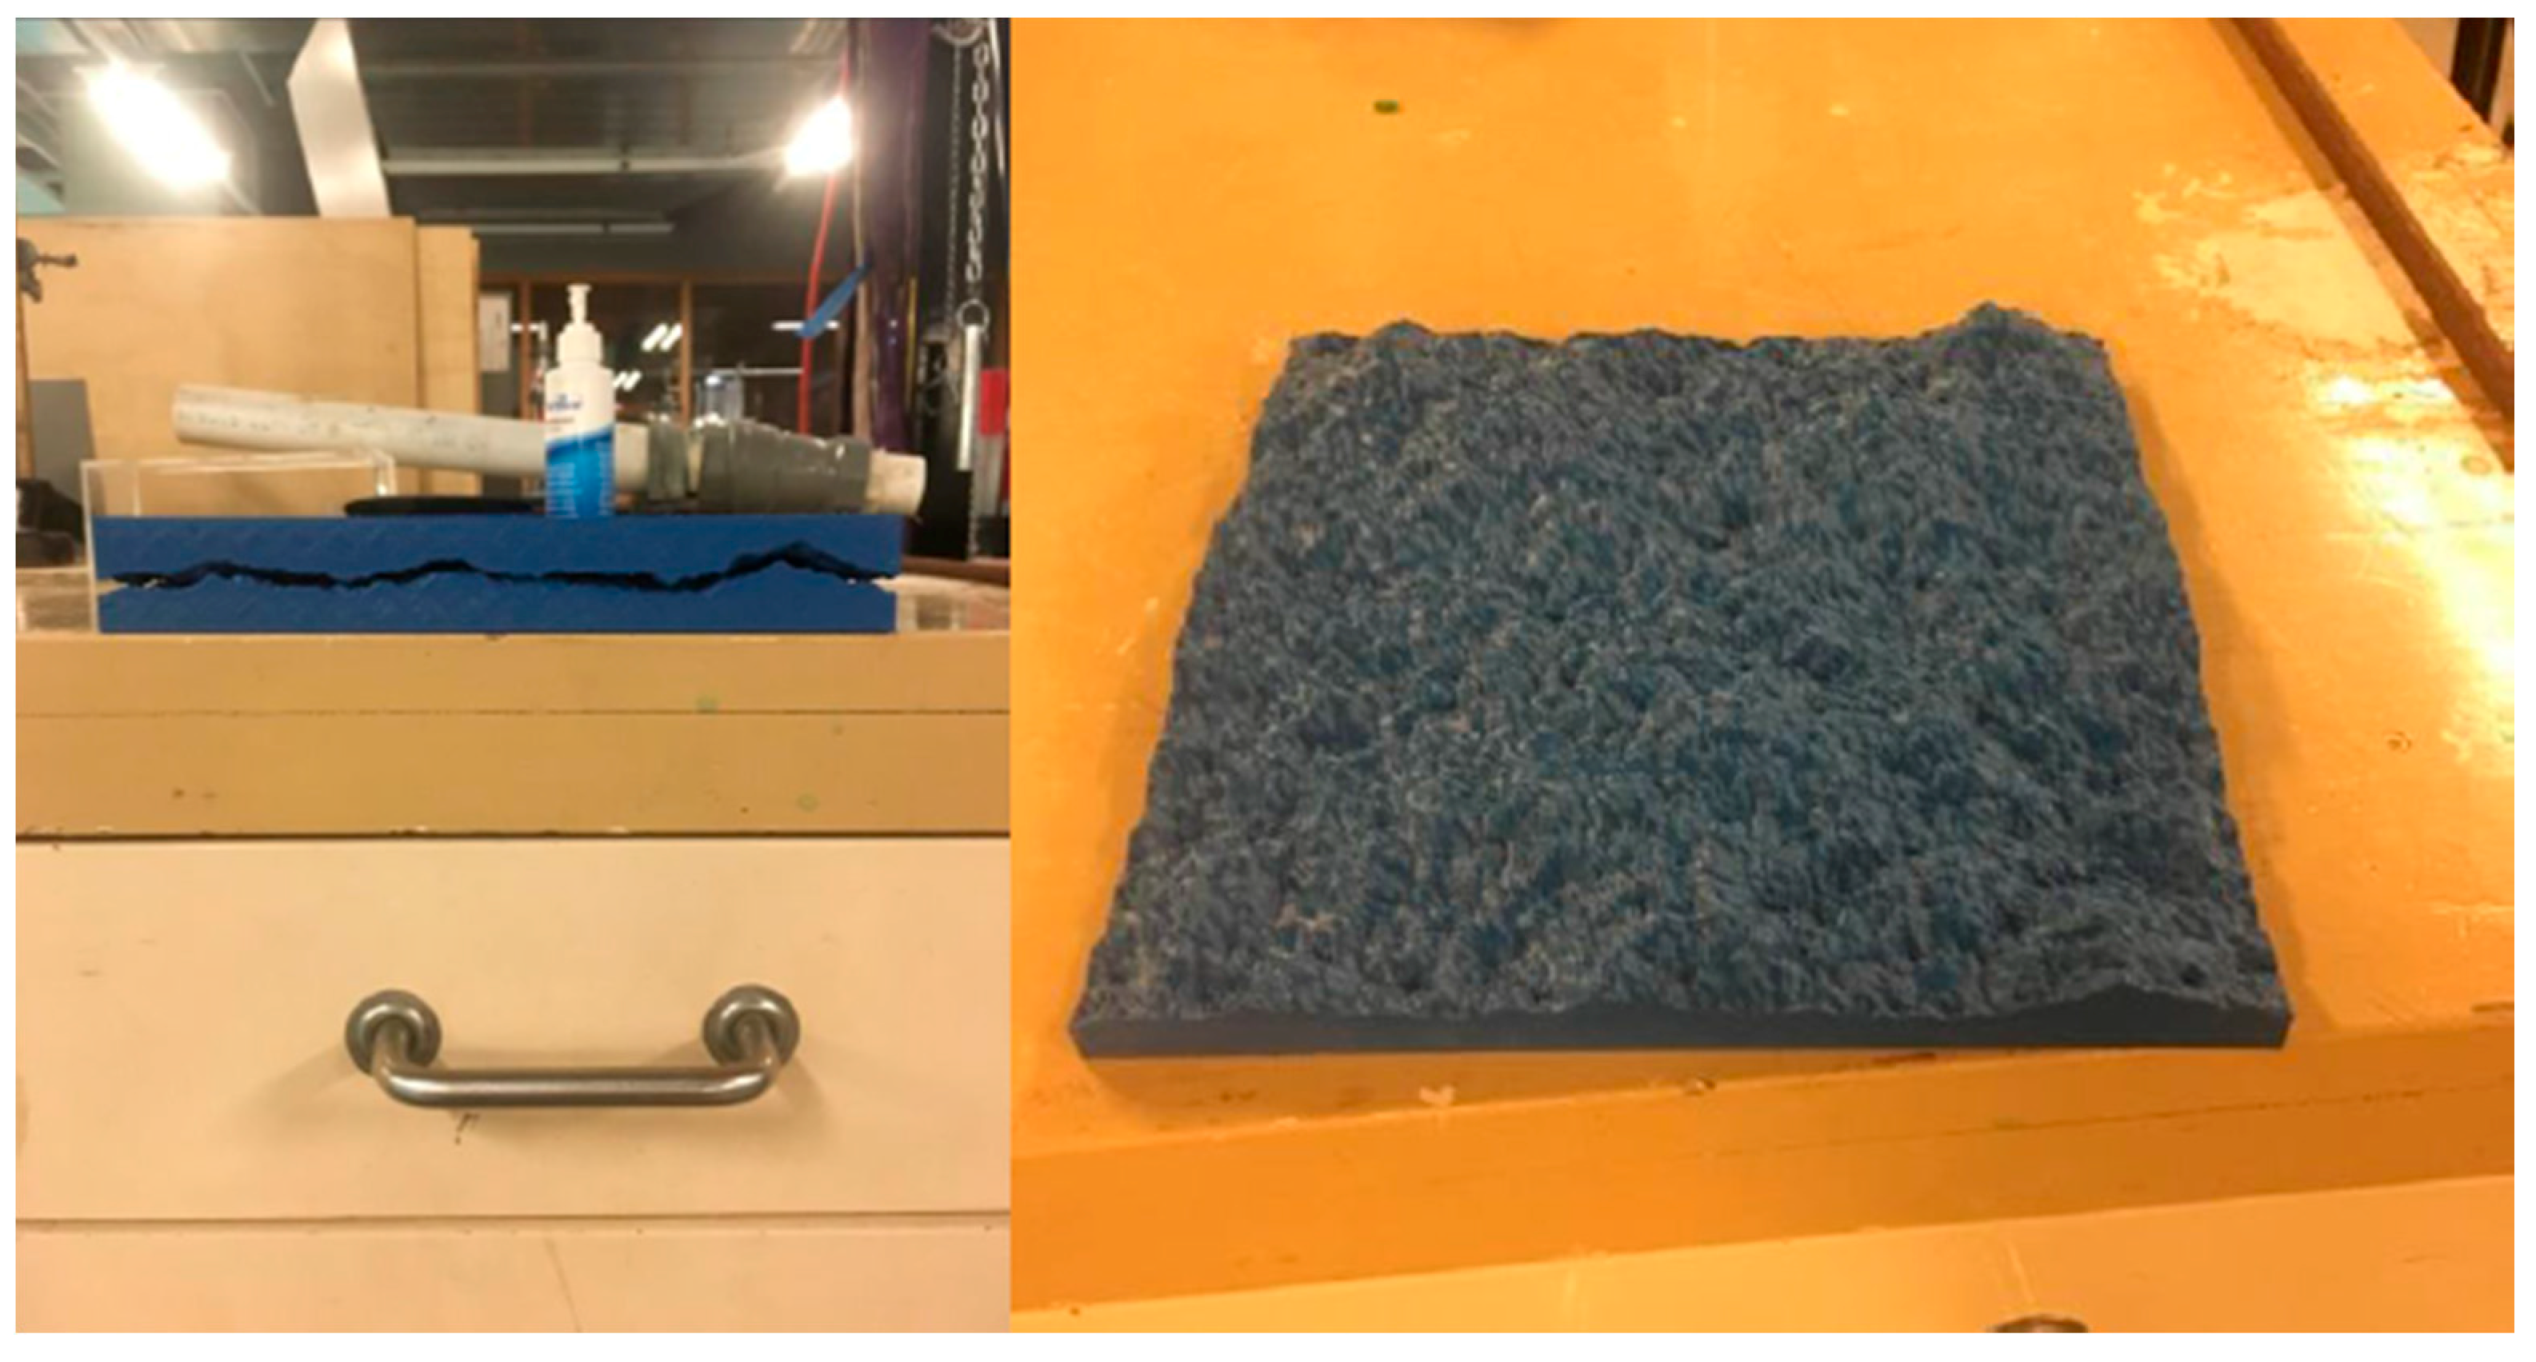
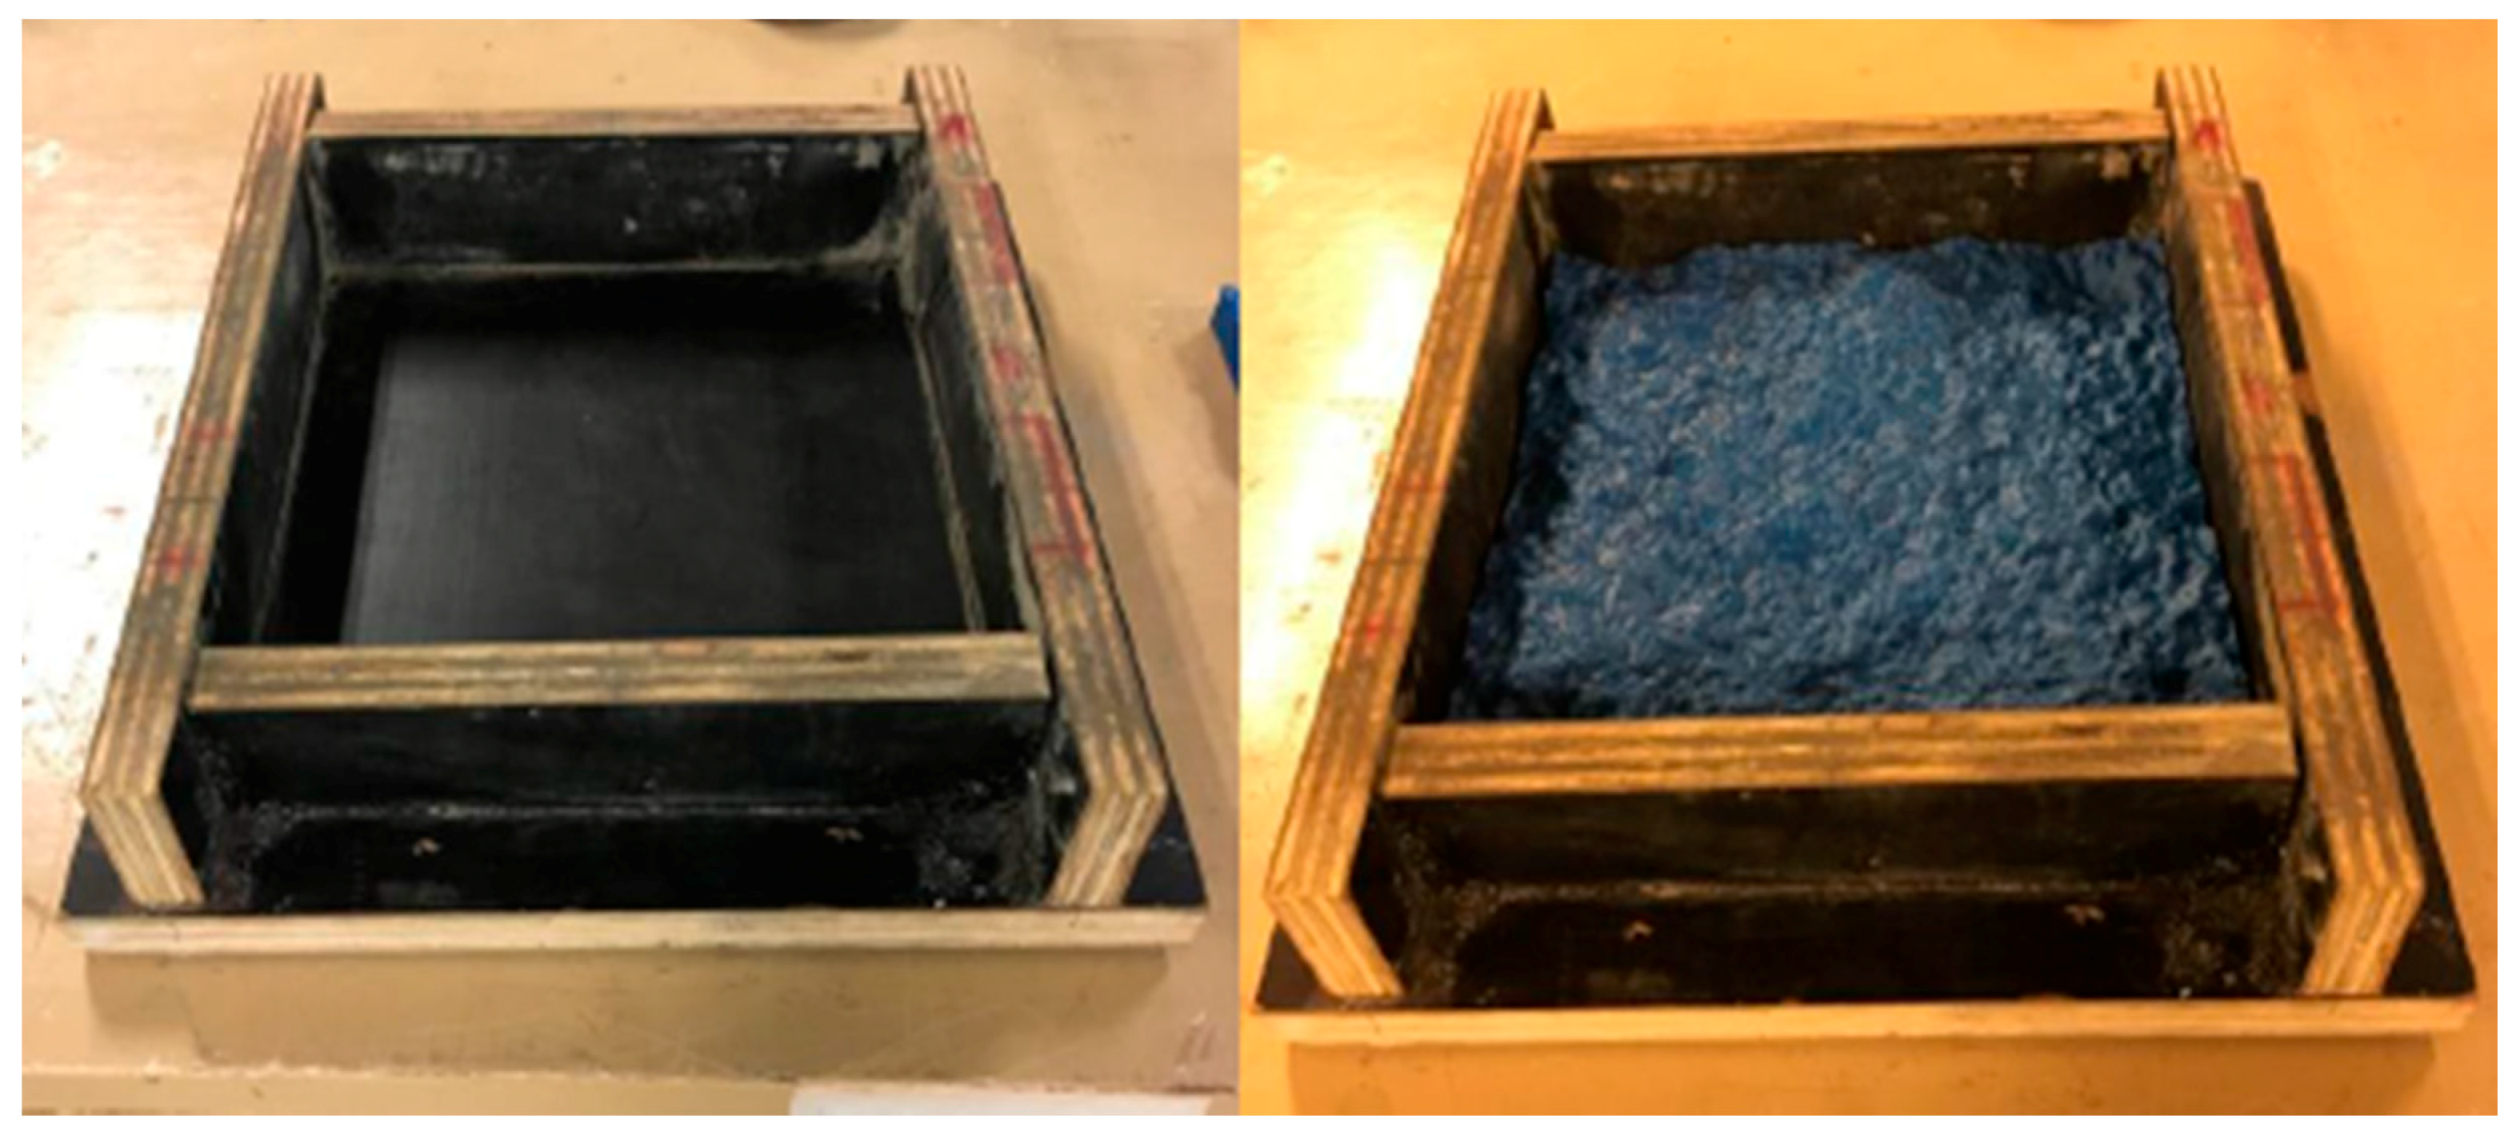
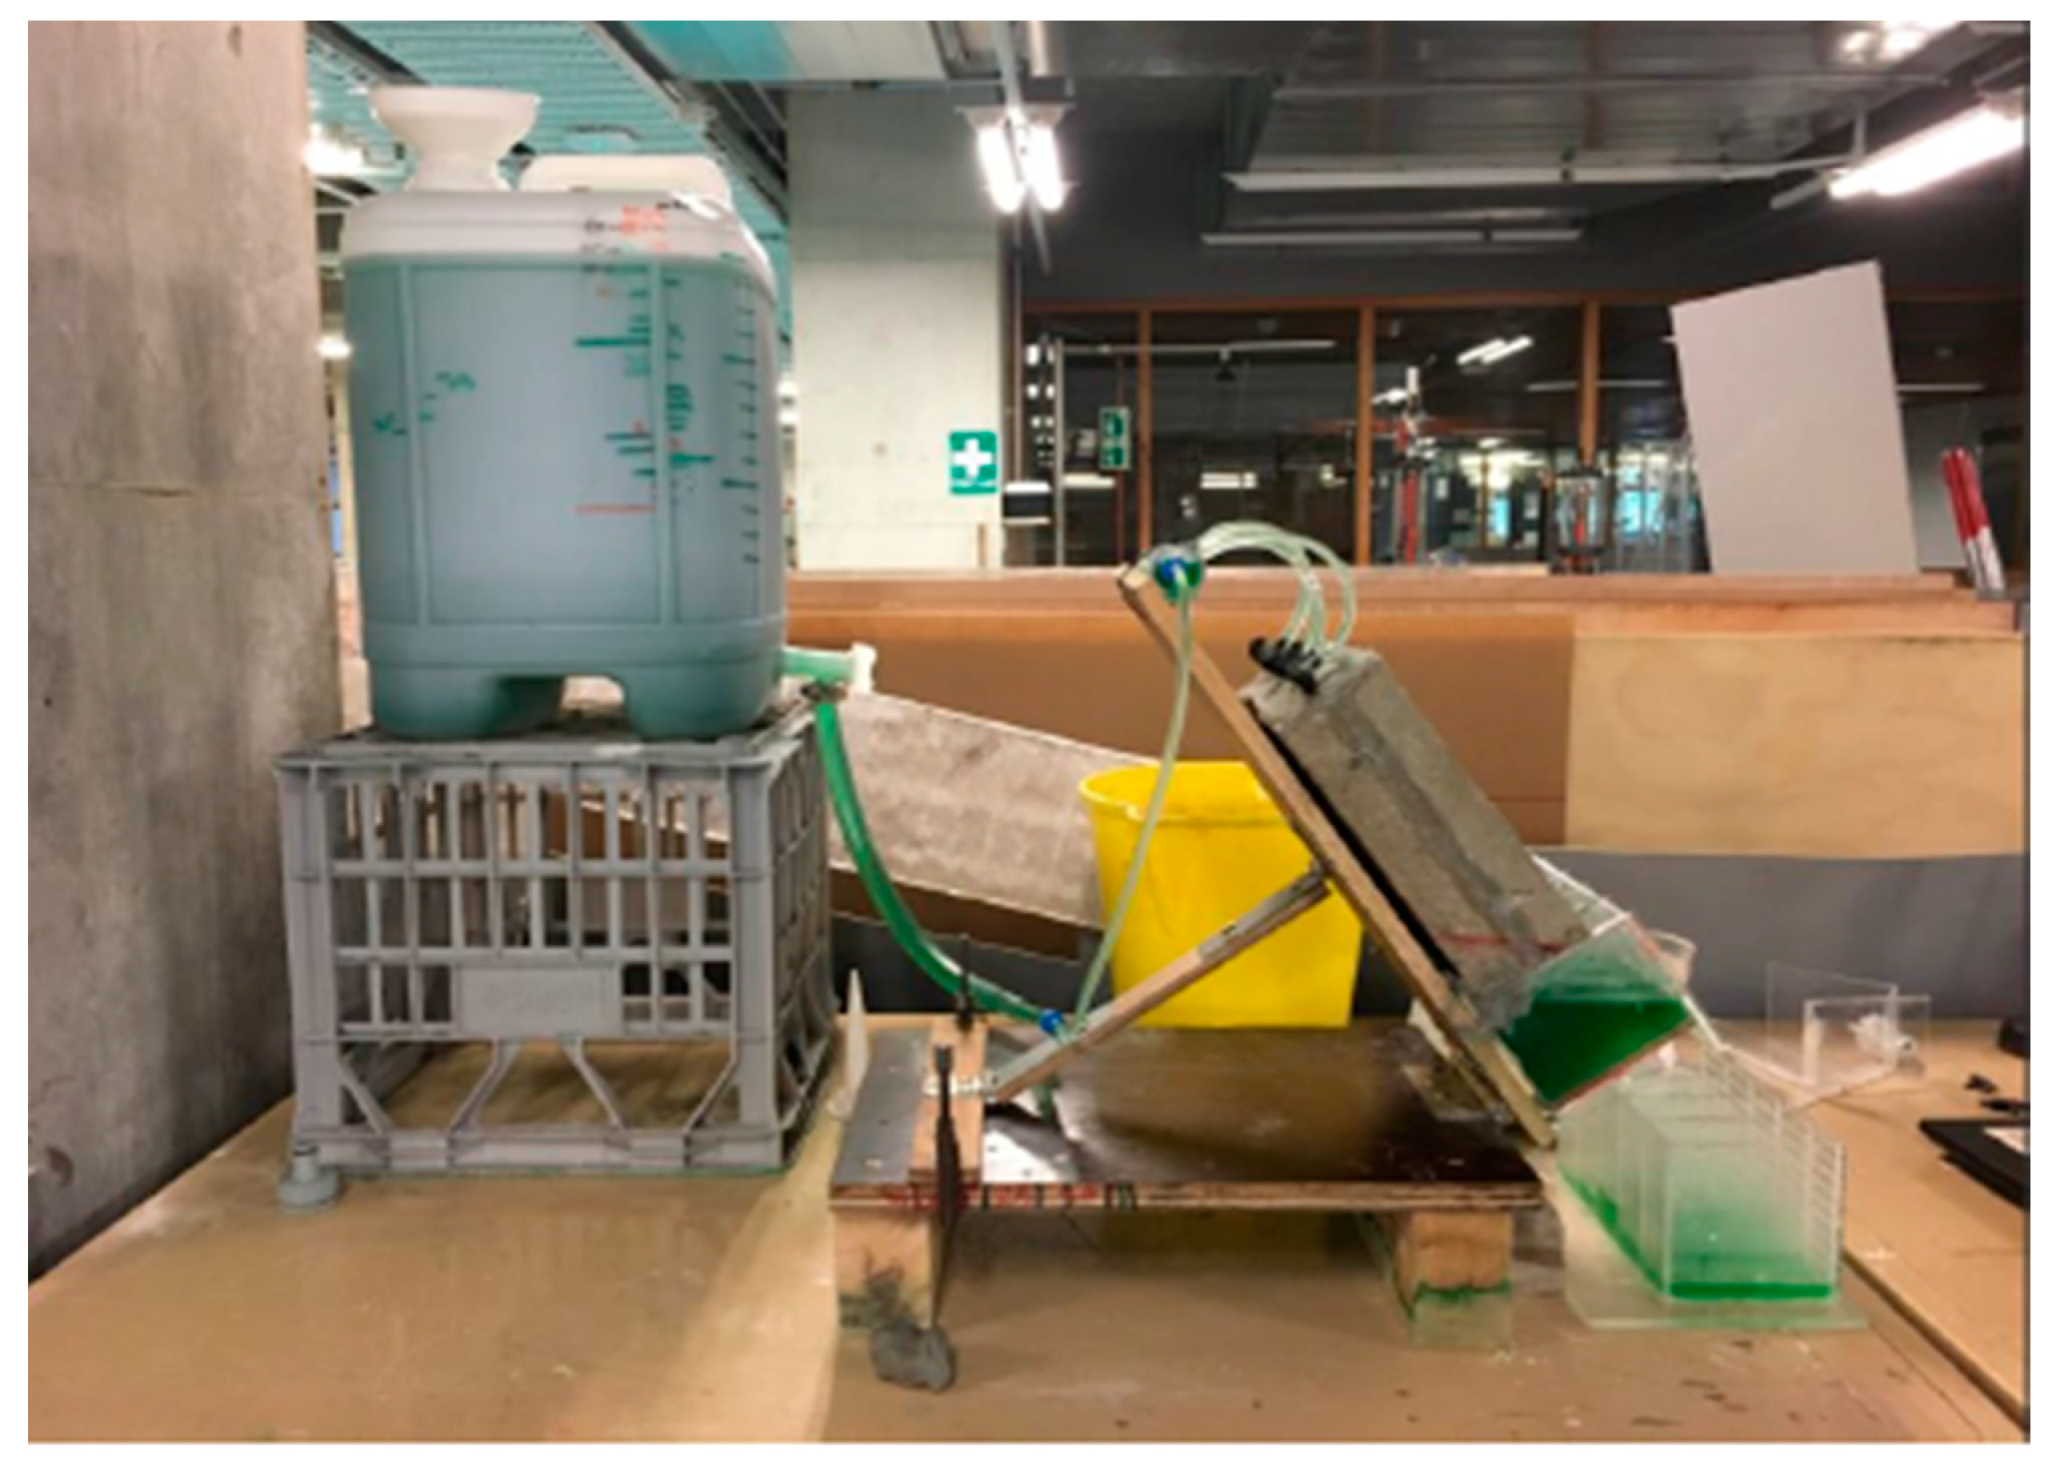
In recent years, 3D printing has been proved to be an efficient technology that can be applied in the areas of manufacturing, medical, and industry [65,66,67,68]. In this experiment, 3D printing technology was used in order to reflect rough surfaces of fractures accurately based on the data generated by the numerical method mentioned above. Figure 2 shows an example of top and bottom surfaces for a facture model used in the 3D builder. Self-affine rough fractures with square shapes were printed by using brightly colored filaments with 204.8 mm each side (Figure 3). In order to handle fractures easily during the experiment process, the 3D printed fractures were put into the formwork mould and concrete was poured on the outer surface of the 3D printed fractures (Figure 4). Three sets of self-affine rough fractures are printed and moulded with different fractal dimensions that correspond to 2.2, 2.3, and 2.4, respectively. In Figure 5, a 30 L water drum was installed and filled with water with a green color that was easily identified. Five micro drippers were used for water injection into self-affine rough fractures. In order to maintain a constant injection flow rate, water should be added into the water drum to maintain a constant hydraulic head during the experimental process. Based on the constant hydraulic head, flow rates for five drippers can be calculated, which is 0.0728 mL/s. The fracture sample was put on the top of a container that was divided into five equal sections and there was another same container located below the upper container for measuring the volume of water discharging from each section. With the application of software called Time-lapse Video, a laptop was placed in front of the experimental apparatus to record the volume of water discharging from each section of the fracture sample every 20 s.
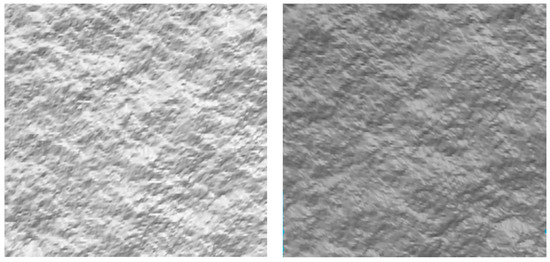
Figure 2.
An example of the top and bottom surfaces for a fracture in the 3D builder.
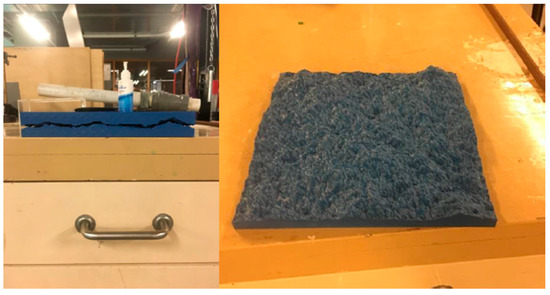
Figure 3.
3D printed fracture.
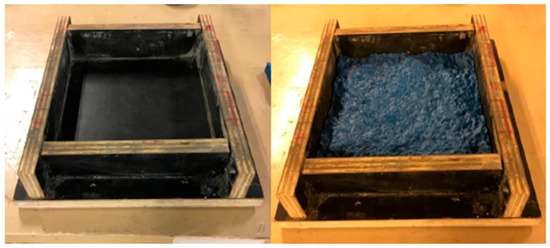
Figure 4.
3D printed facture mould.
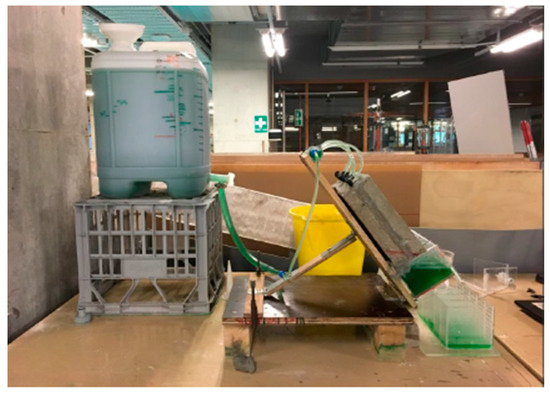
Figure 5.
Experimental apparatus.
During the experiments, water volume discharging from the fracture sample in the containers was measured and recorded. The record would stop when one of the containers was full of water. In order to identify this more easily, the water volume in each container was marked as Outlet 1, 2, 3, 4, and 5.
4. Results and Discussion
The length and width of self-affine rough fracture samples for the experiments is 204.8 mm. The value of height is 20.8 mm because it is larger than apertures from 128 × 128 data sets used for generating fracture samples and it can save computational costs. The sample is divided into 512 × 512 × 52 cells and the length, width, and height of each cell is 0.4 mm. The real physical units can be transformed into lattice units based on non-dimensional parameters and relevant correlations.
4.1. Simulation of Water Flow through the Self-Affine Rough Fracture
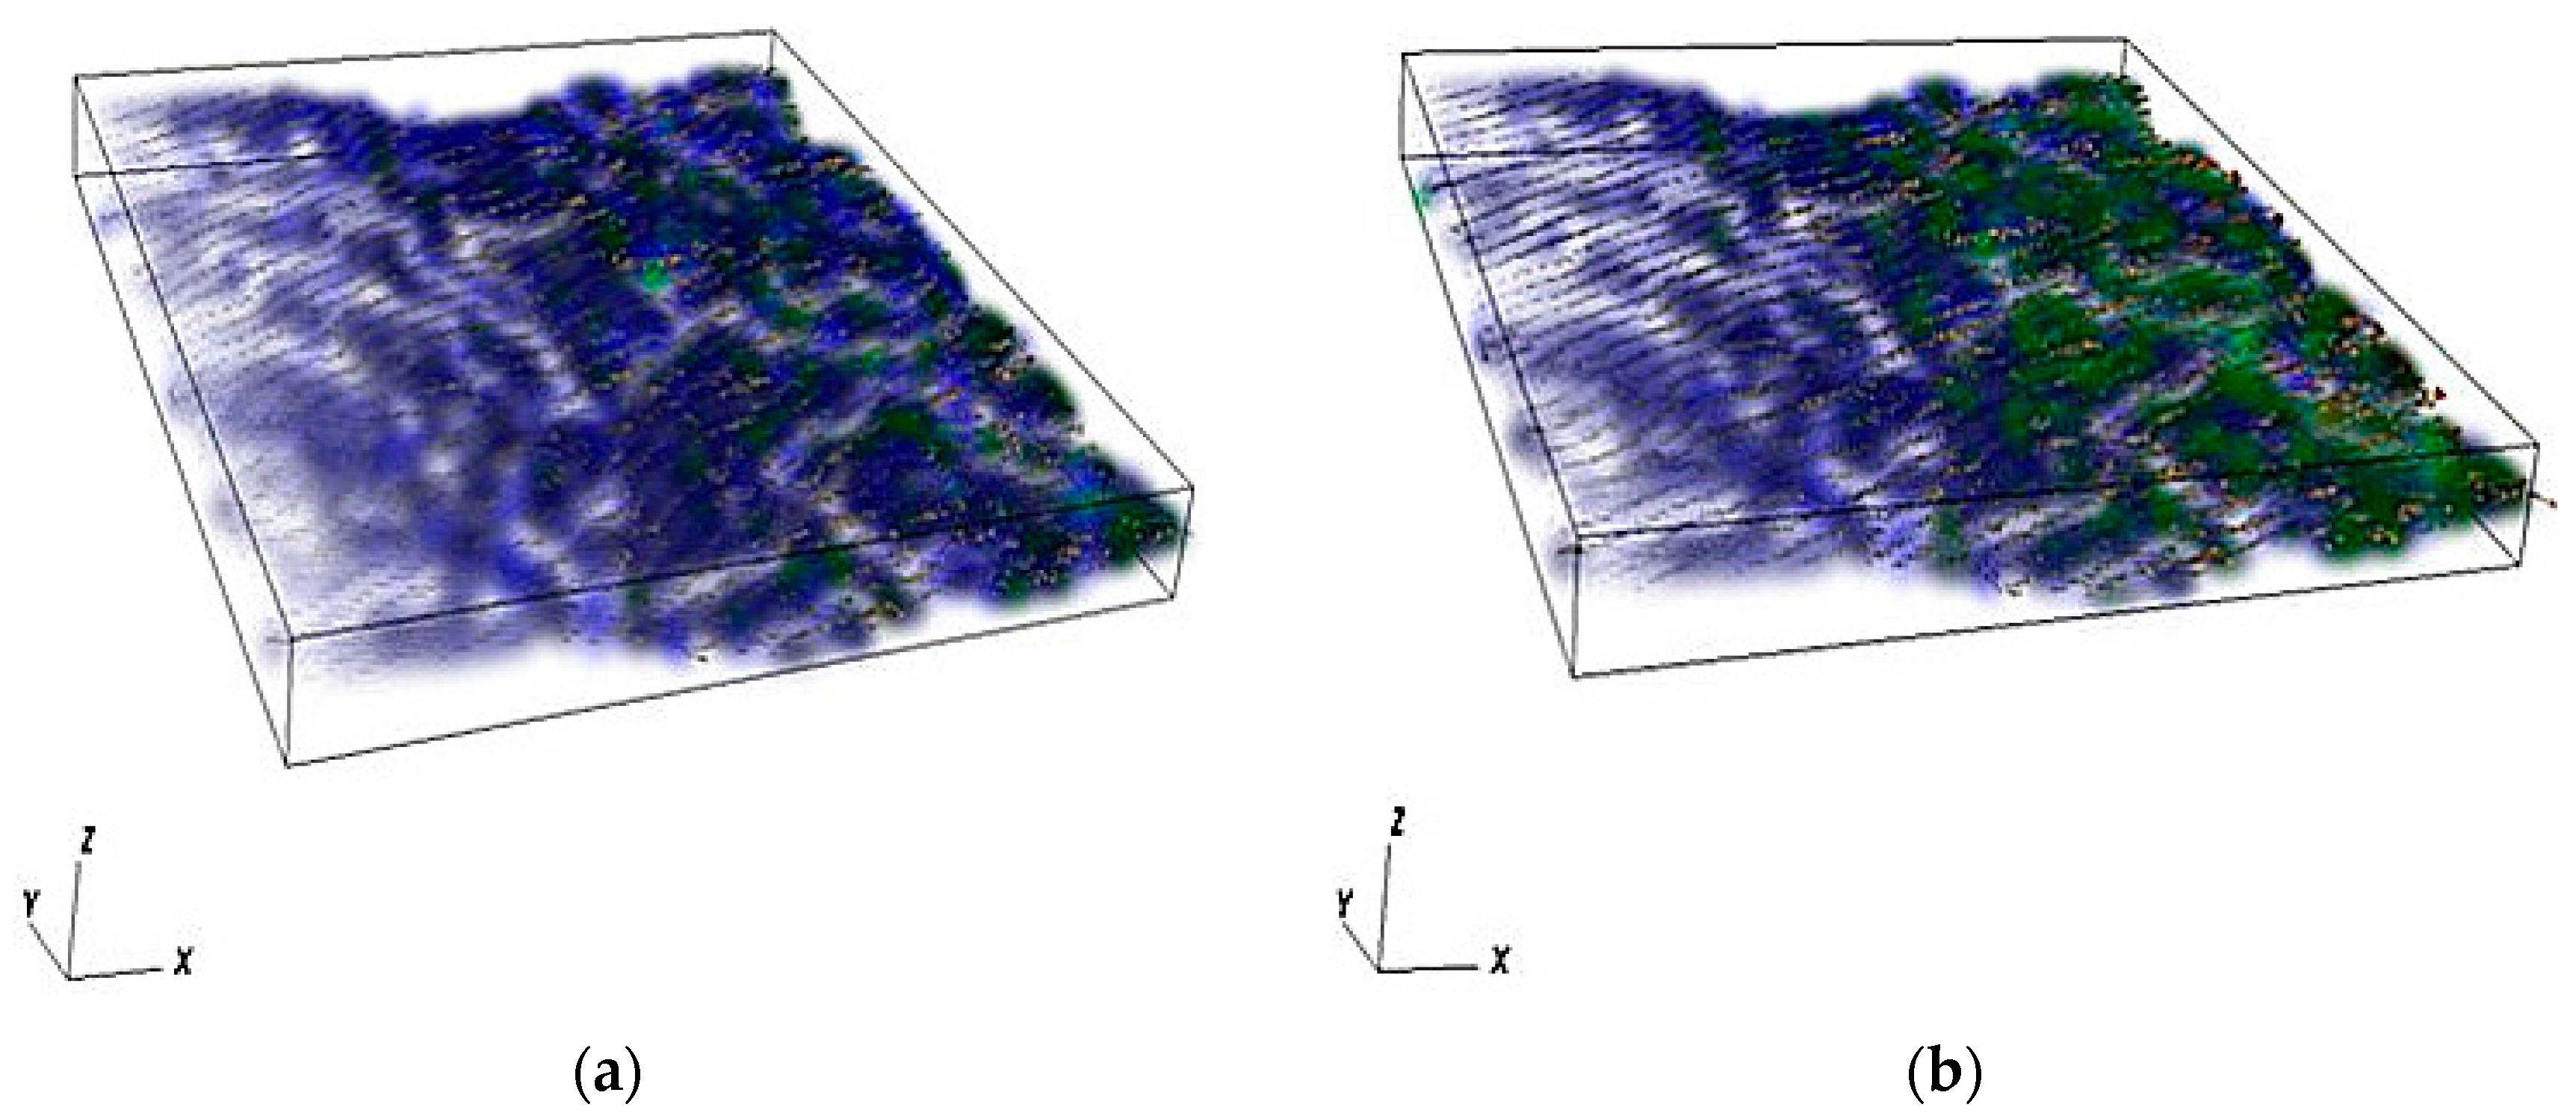
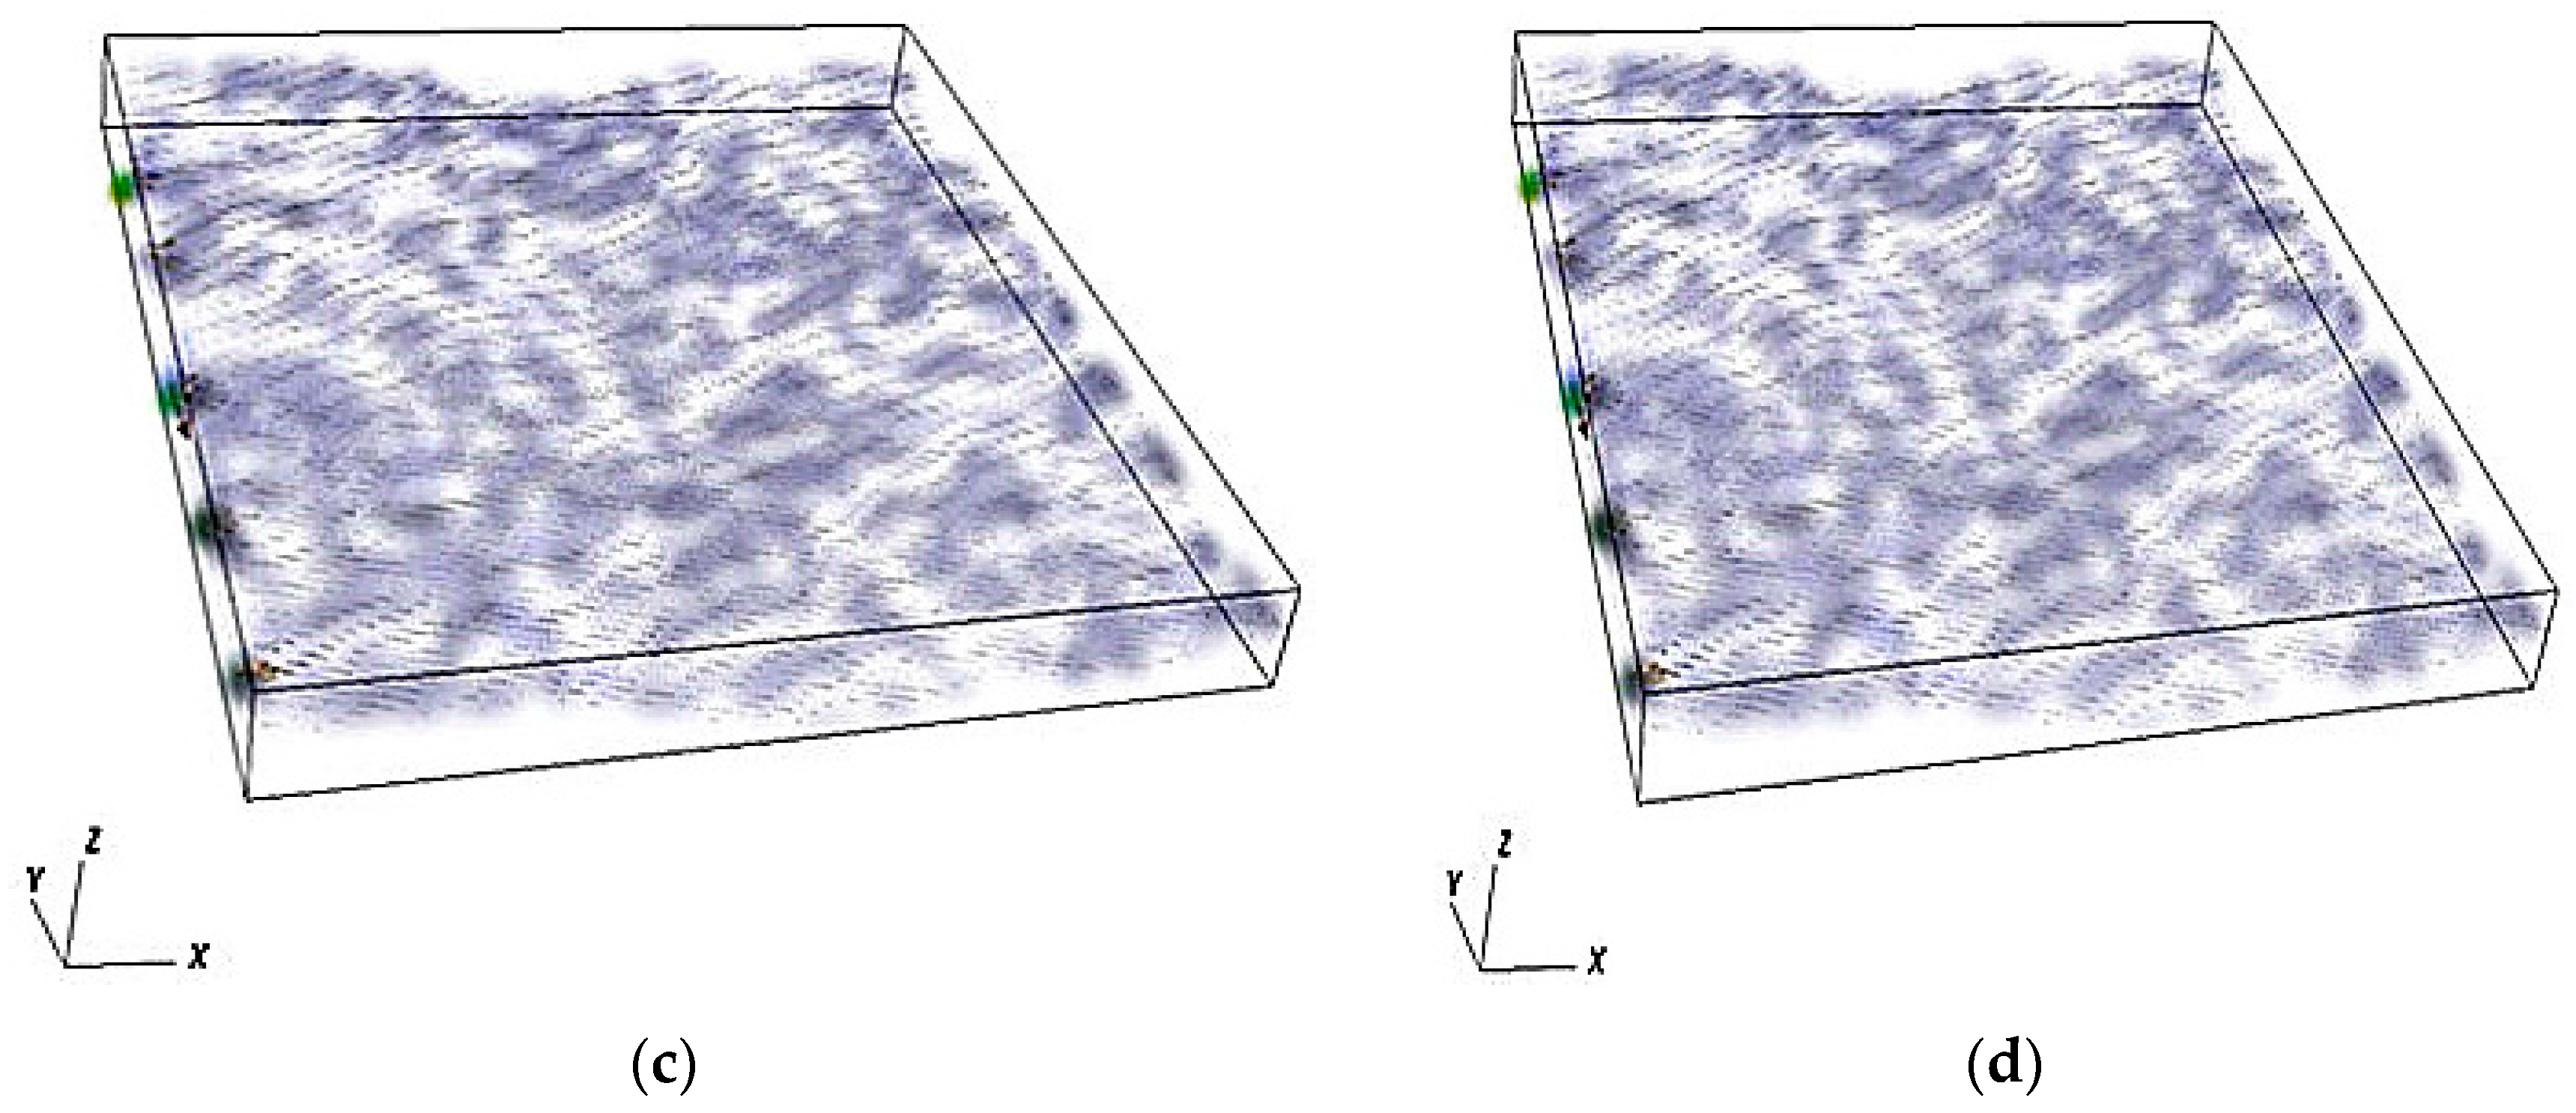
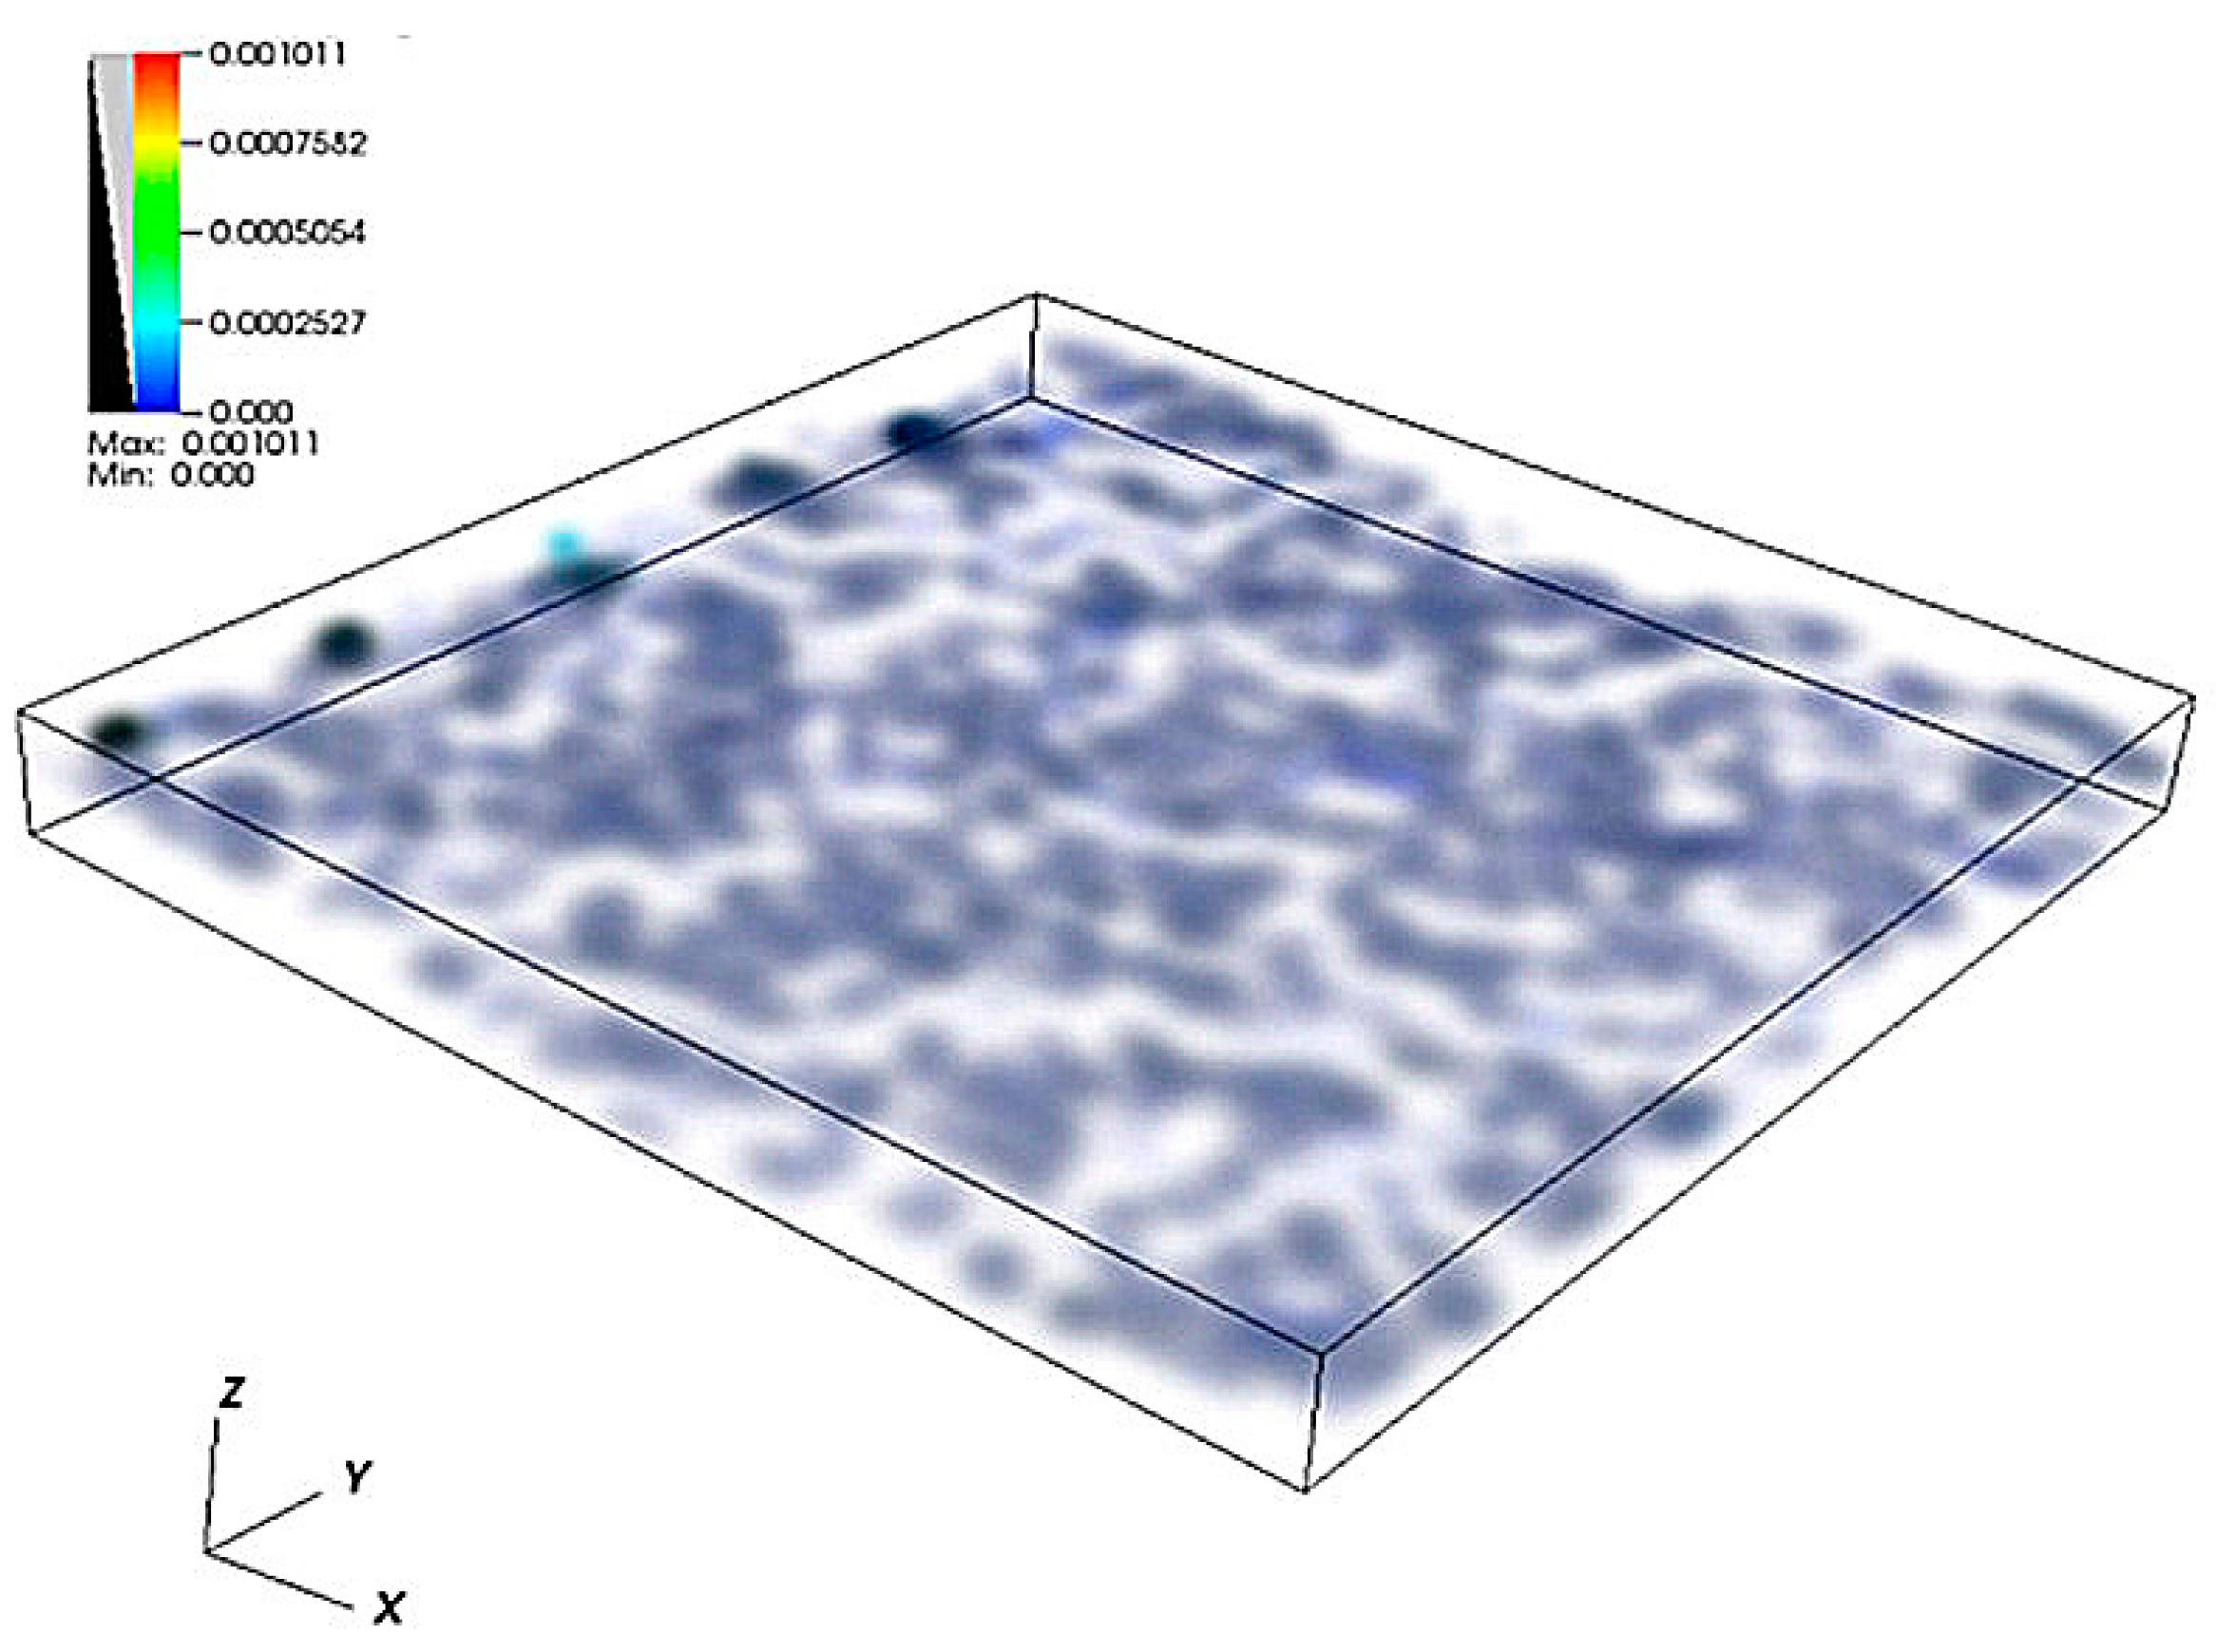
The self-affine rough fracture model with fractal dimension 2.2 is shown in Figure 6. Five injection holes on the surface of the fracture model are shown to reflect the fact that five micro drippers were used in the experiment. In addition, the areas of the injection holes are the same to guarantee the same injection rates. The velocity distributions of water flow through the fracture with fractal dimension 2.2 and inclination 65° at different times are shown in Figure 7. It is obvious that the flow paths can be identified on the basis of the velocity distributions. Unlike the parallel plate model, the flow paths in this study are irregular and based on a smaller scale distribution of fracture roughness. The values of velocity and velocity distributions are variable at the time ta = 5000, 10,000, and 60,000 ts, respectively. This is because the water flow through the fracture is at an unsteady state. Based on the simulation results, the maximum velocity and velocity distributions between the time ta = 60,000 and 70,000 ts are the same. It can be concluded that the water flow has reached a steady state at the time ta = 60,000 ts in Figure 7. The values of velocities at the steady state are used to calculate flow rates of five sections from the discharging surface and the results are compared with experimental data in the following sections.

Figure 6.
The self-affine rough fracture model. (a) Injection side of the model; (b) Discharging side of the model.
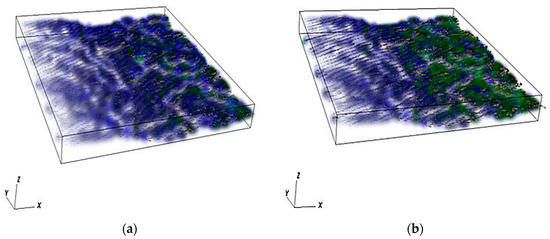
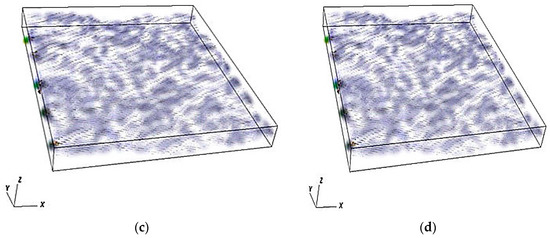
Figure 7.
Velocity distributions for different times. (a) ta = 5000 ts (b) ta = 10,000 ts (c) ta = 60,000 ts (d) ta = 70,000 ts.
4.2. Model Validation
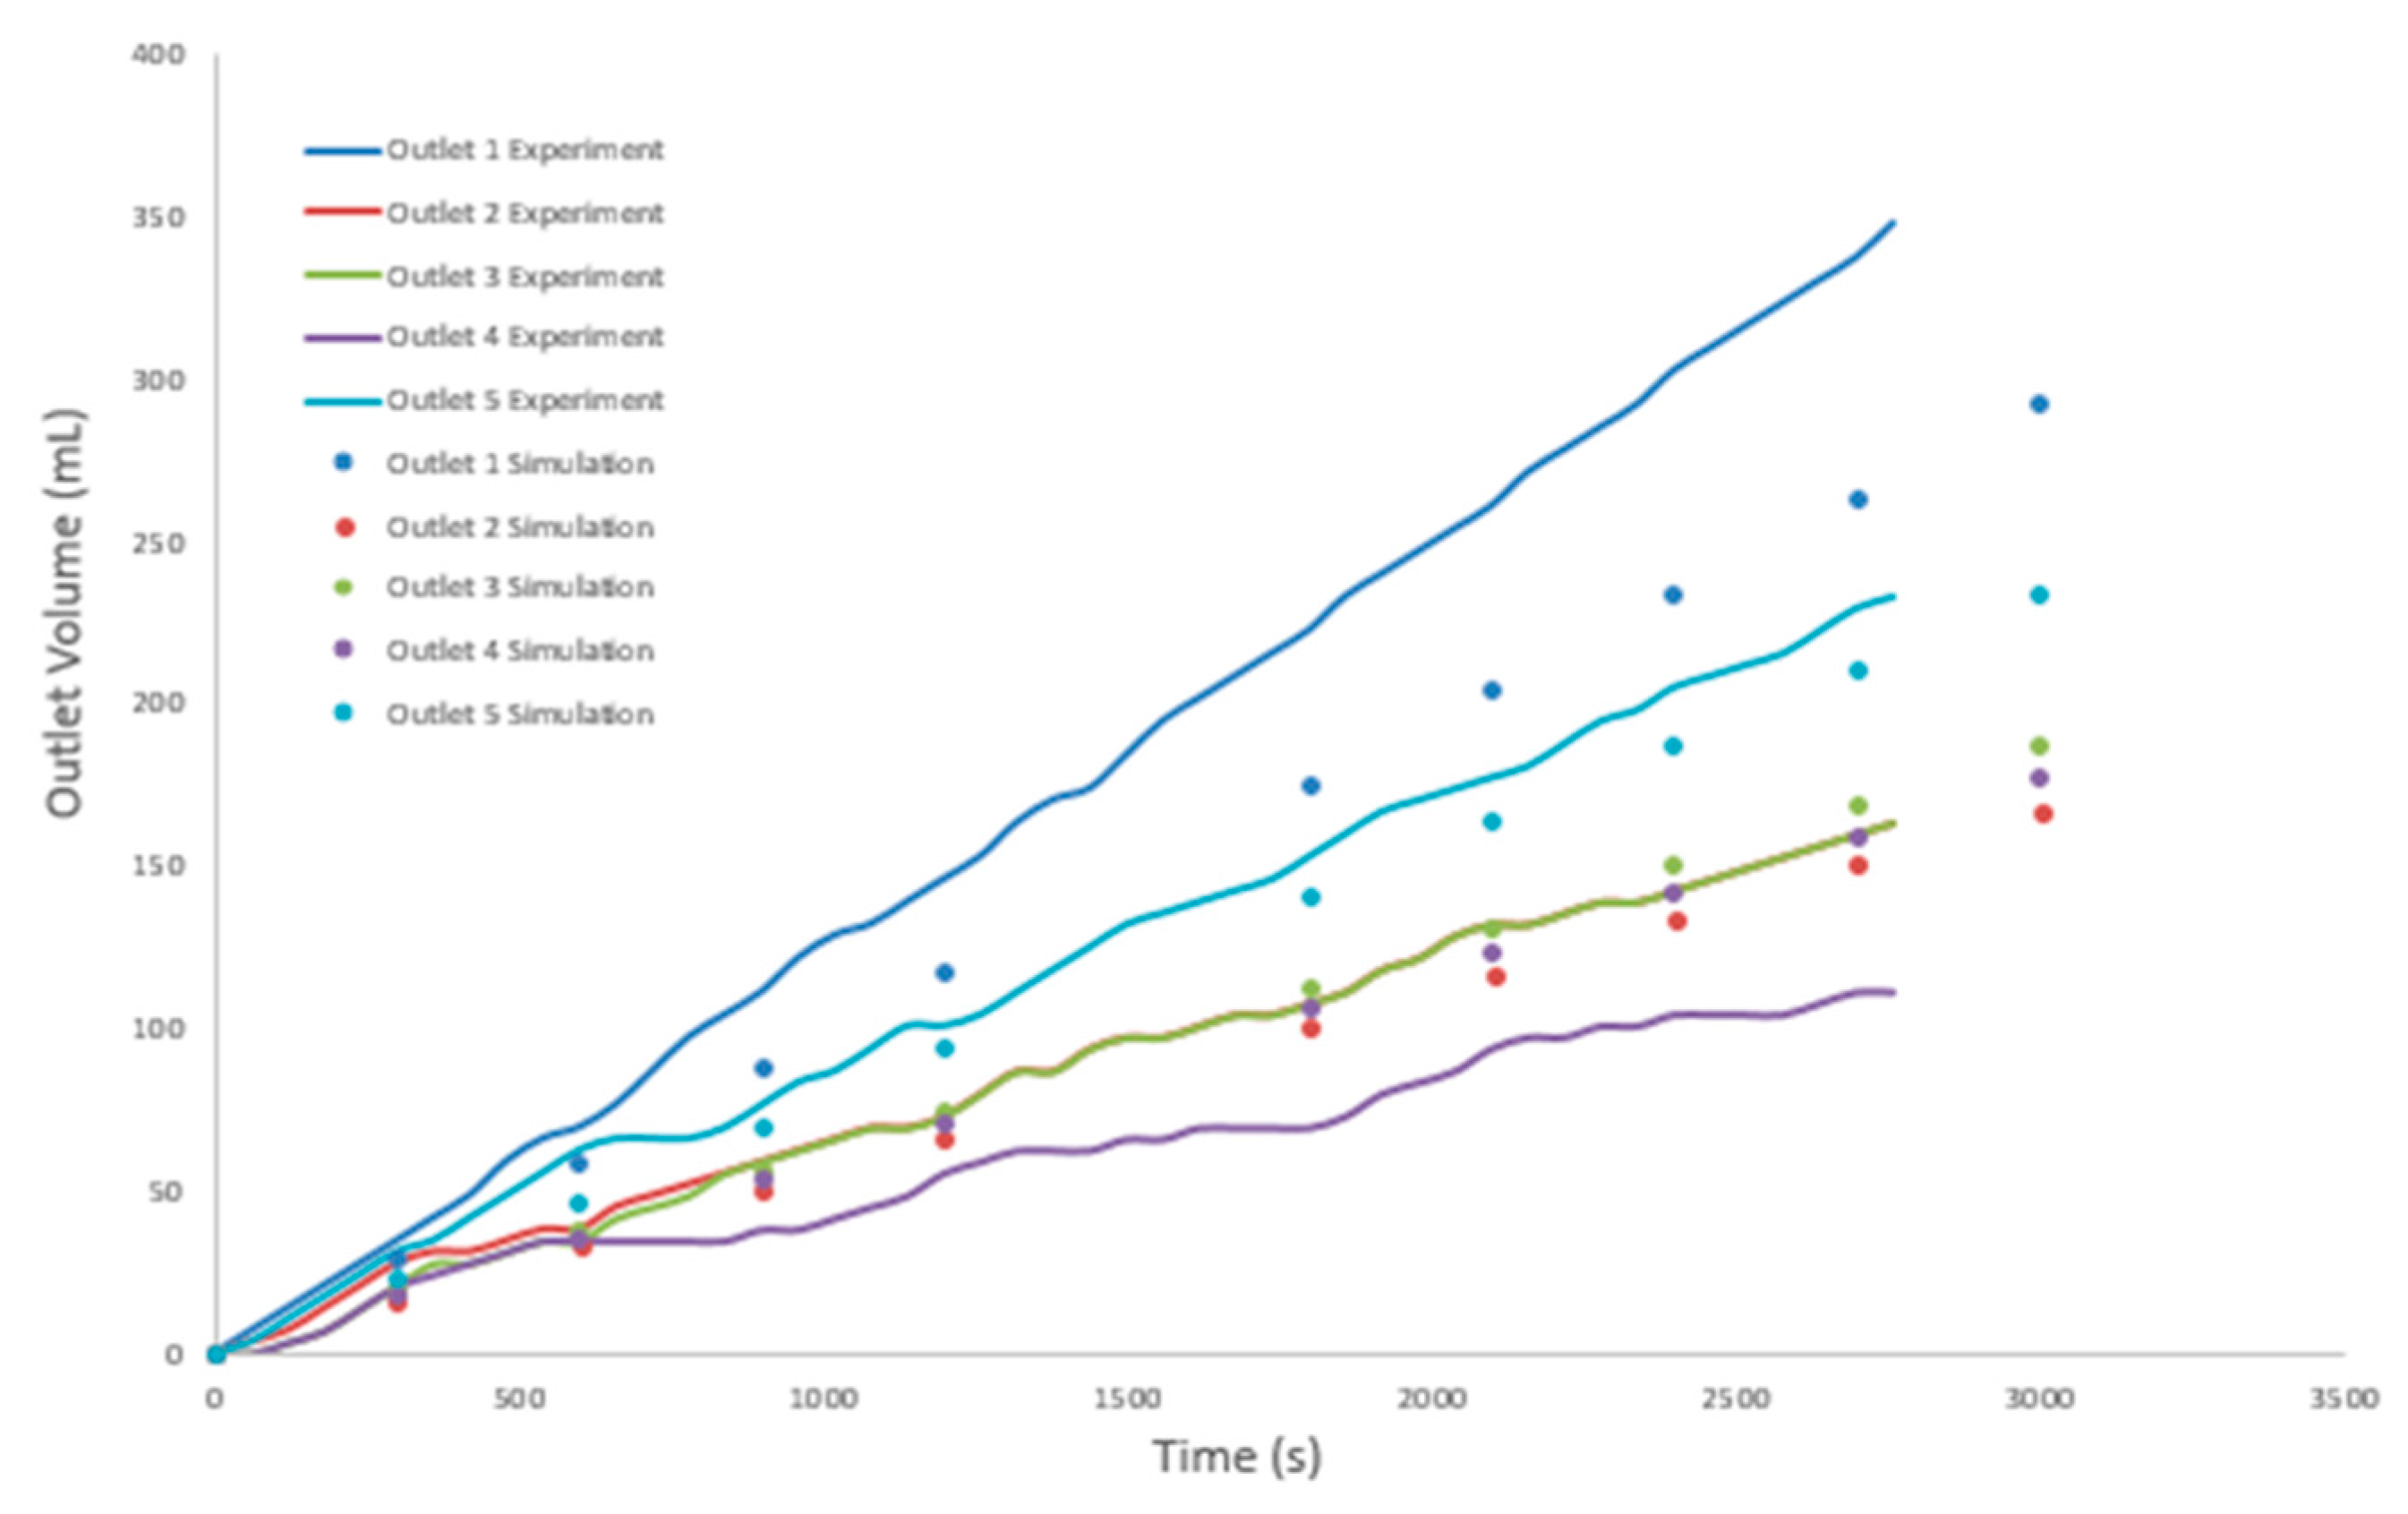
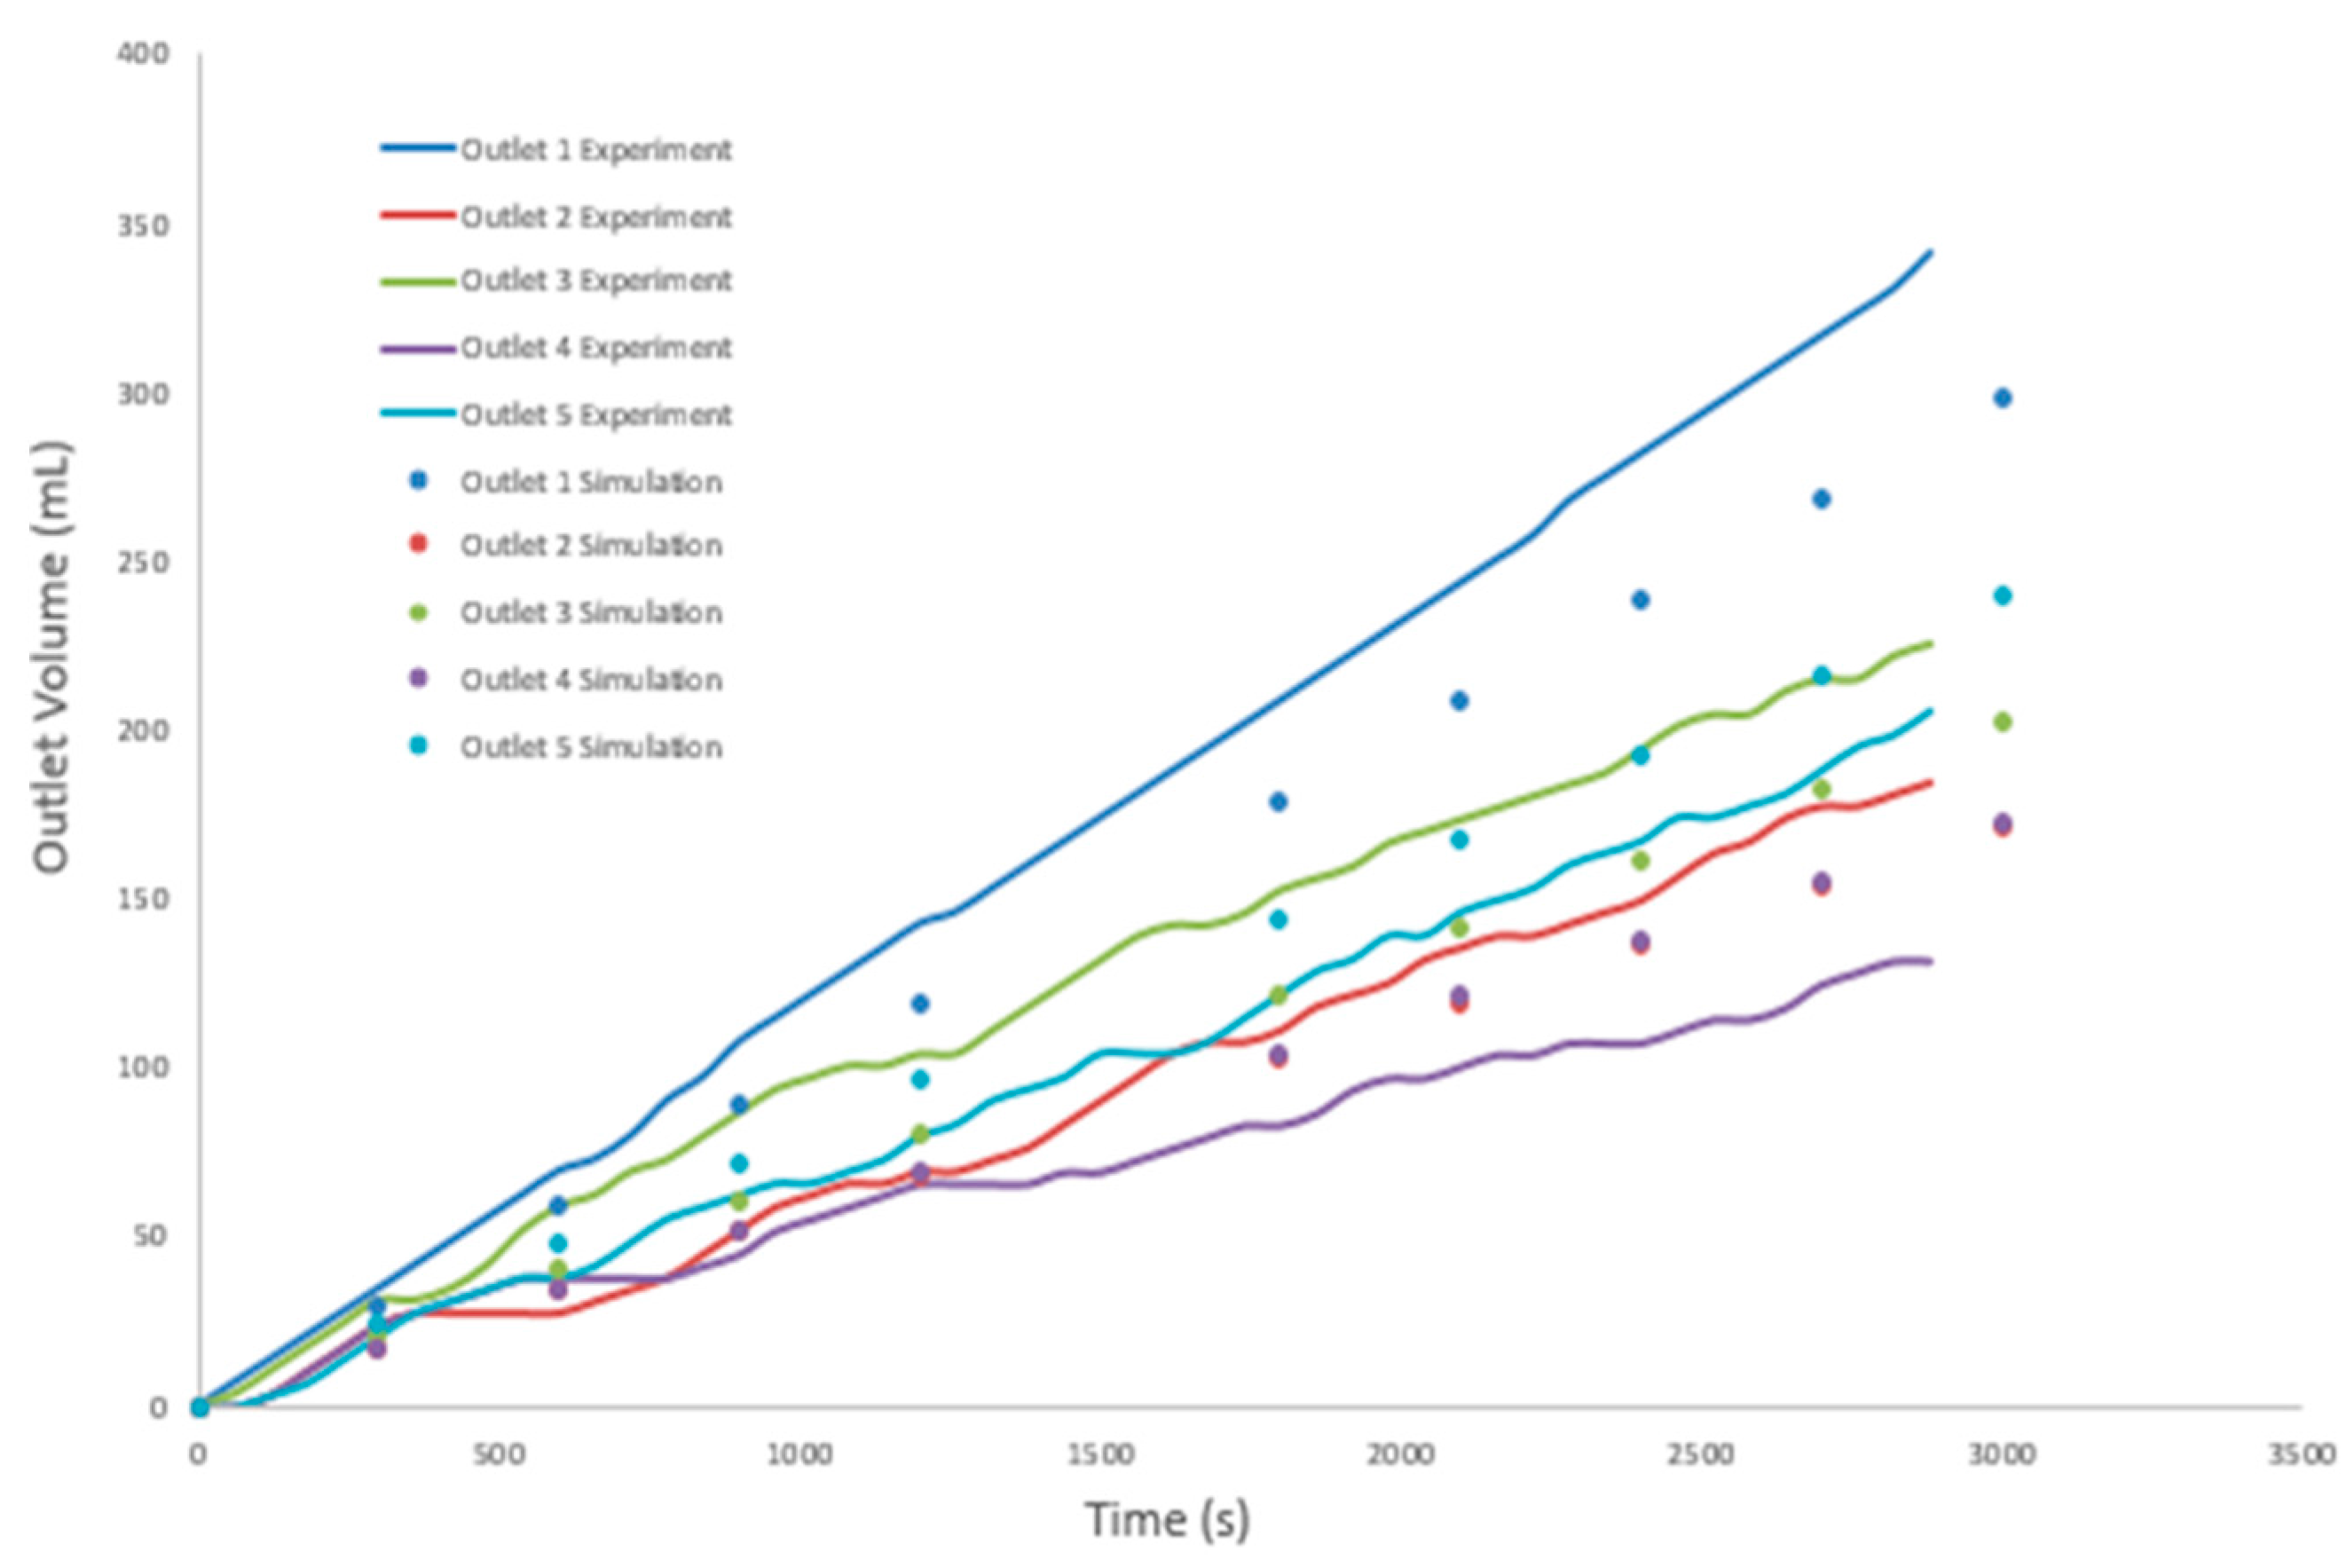
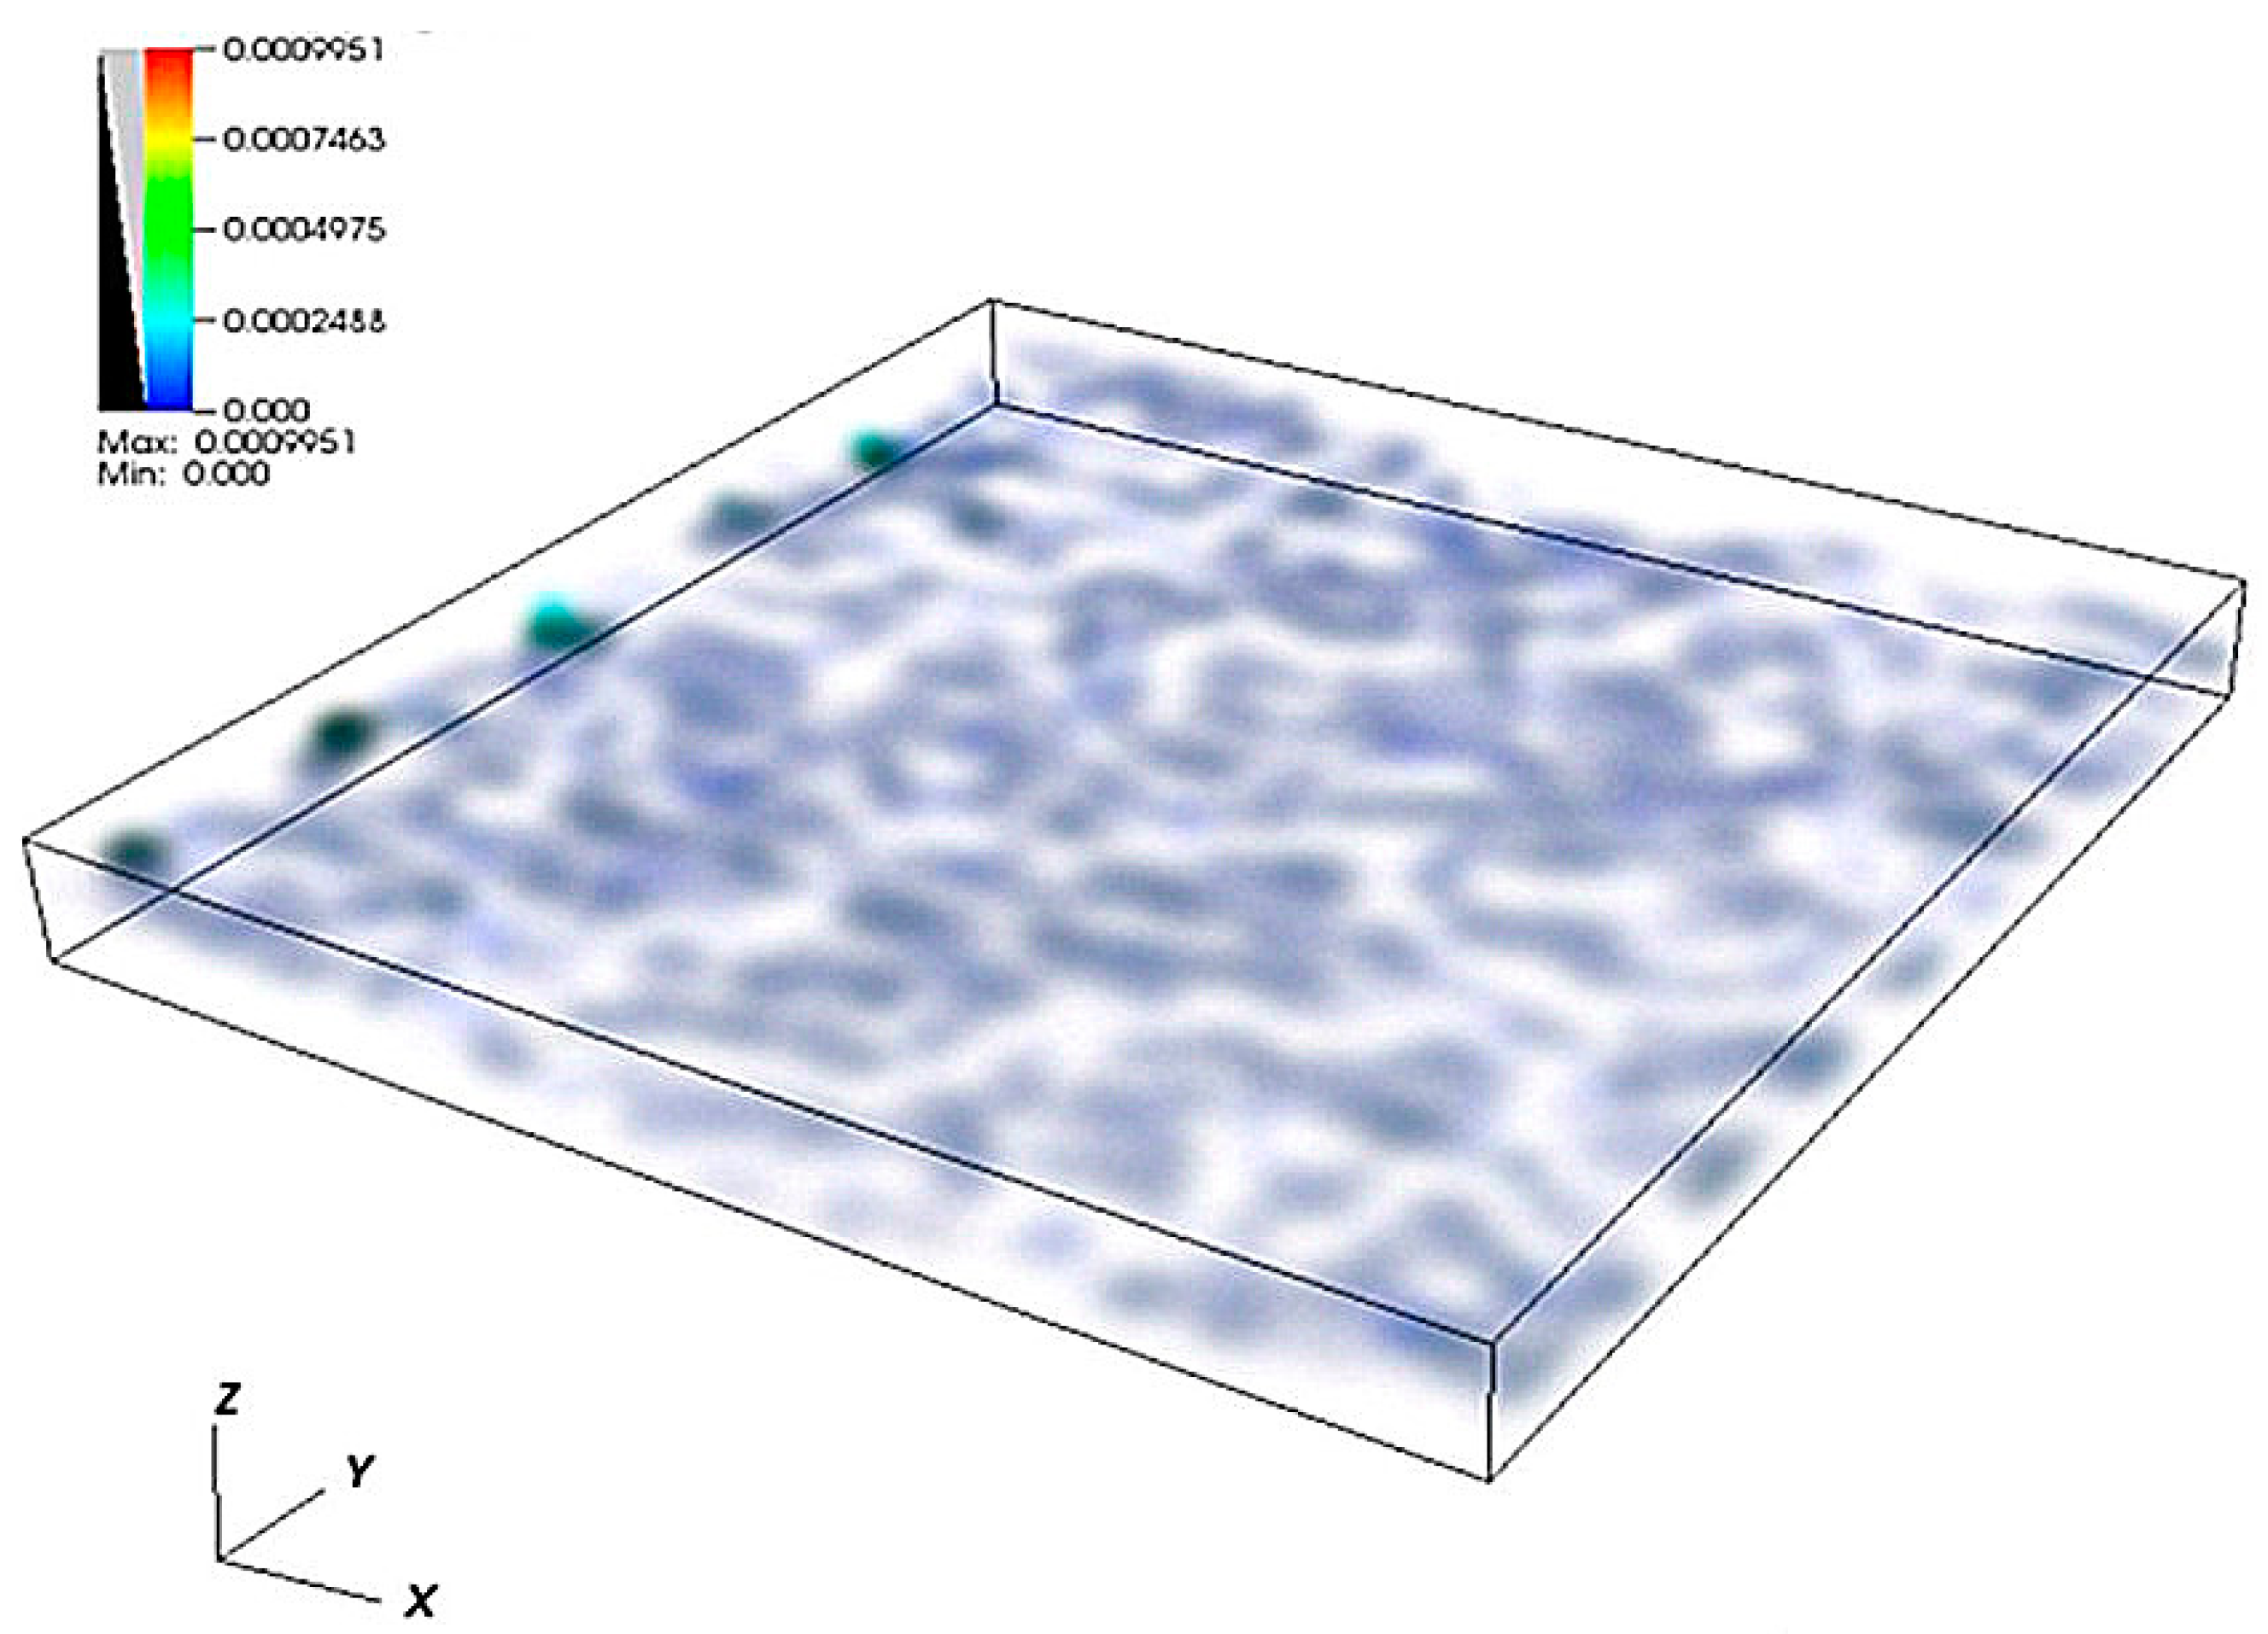
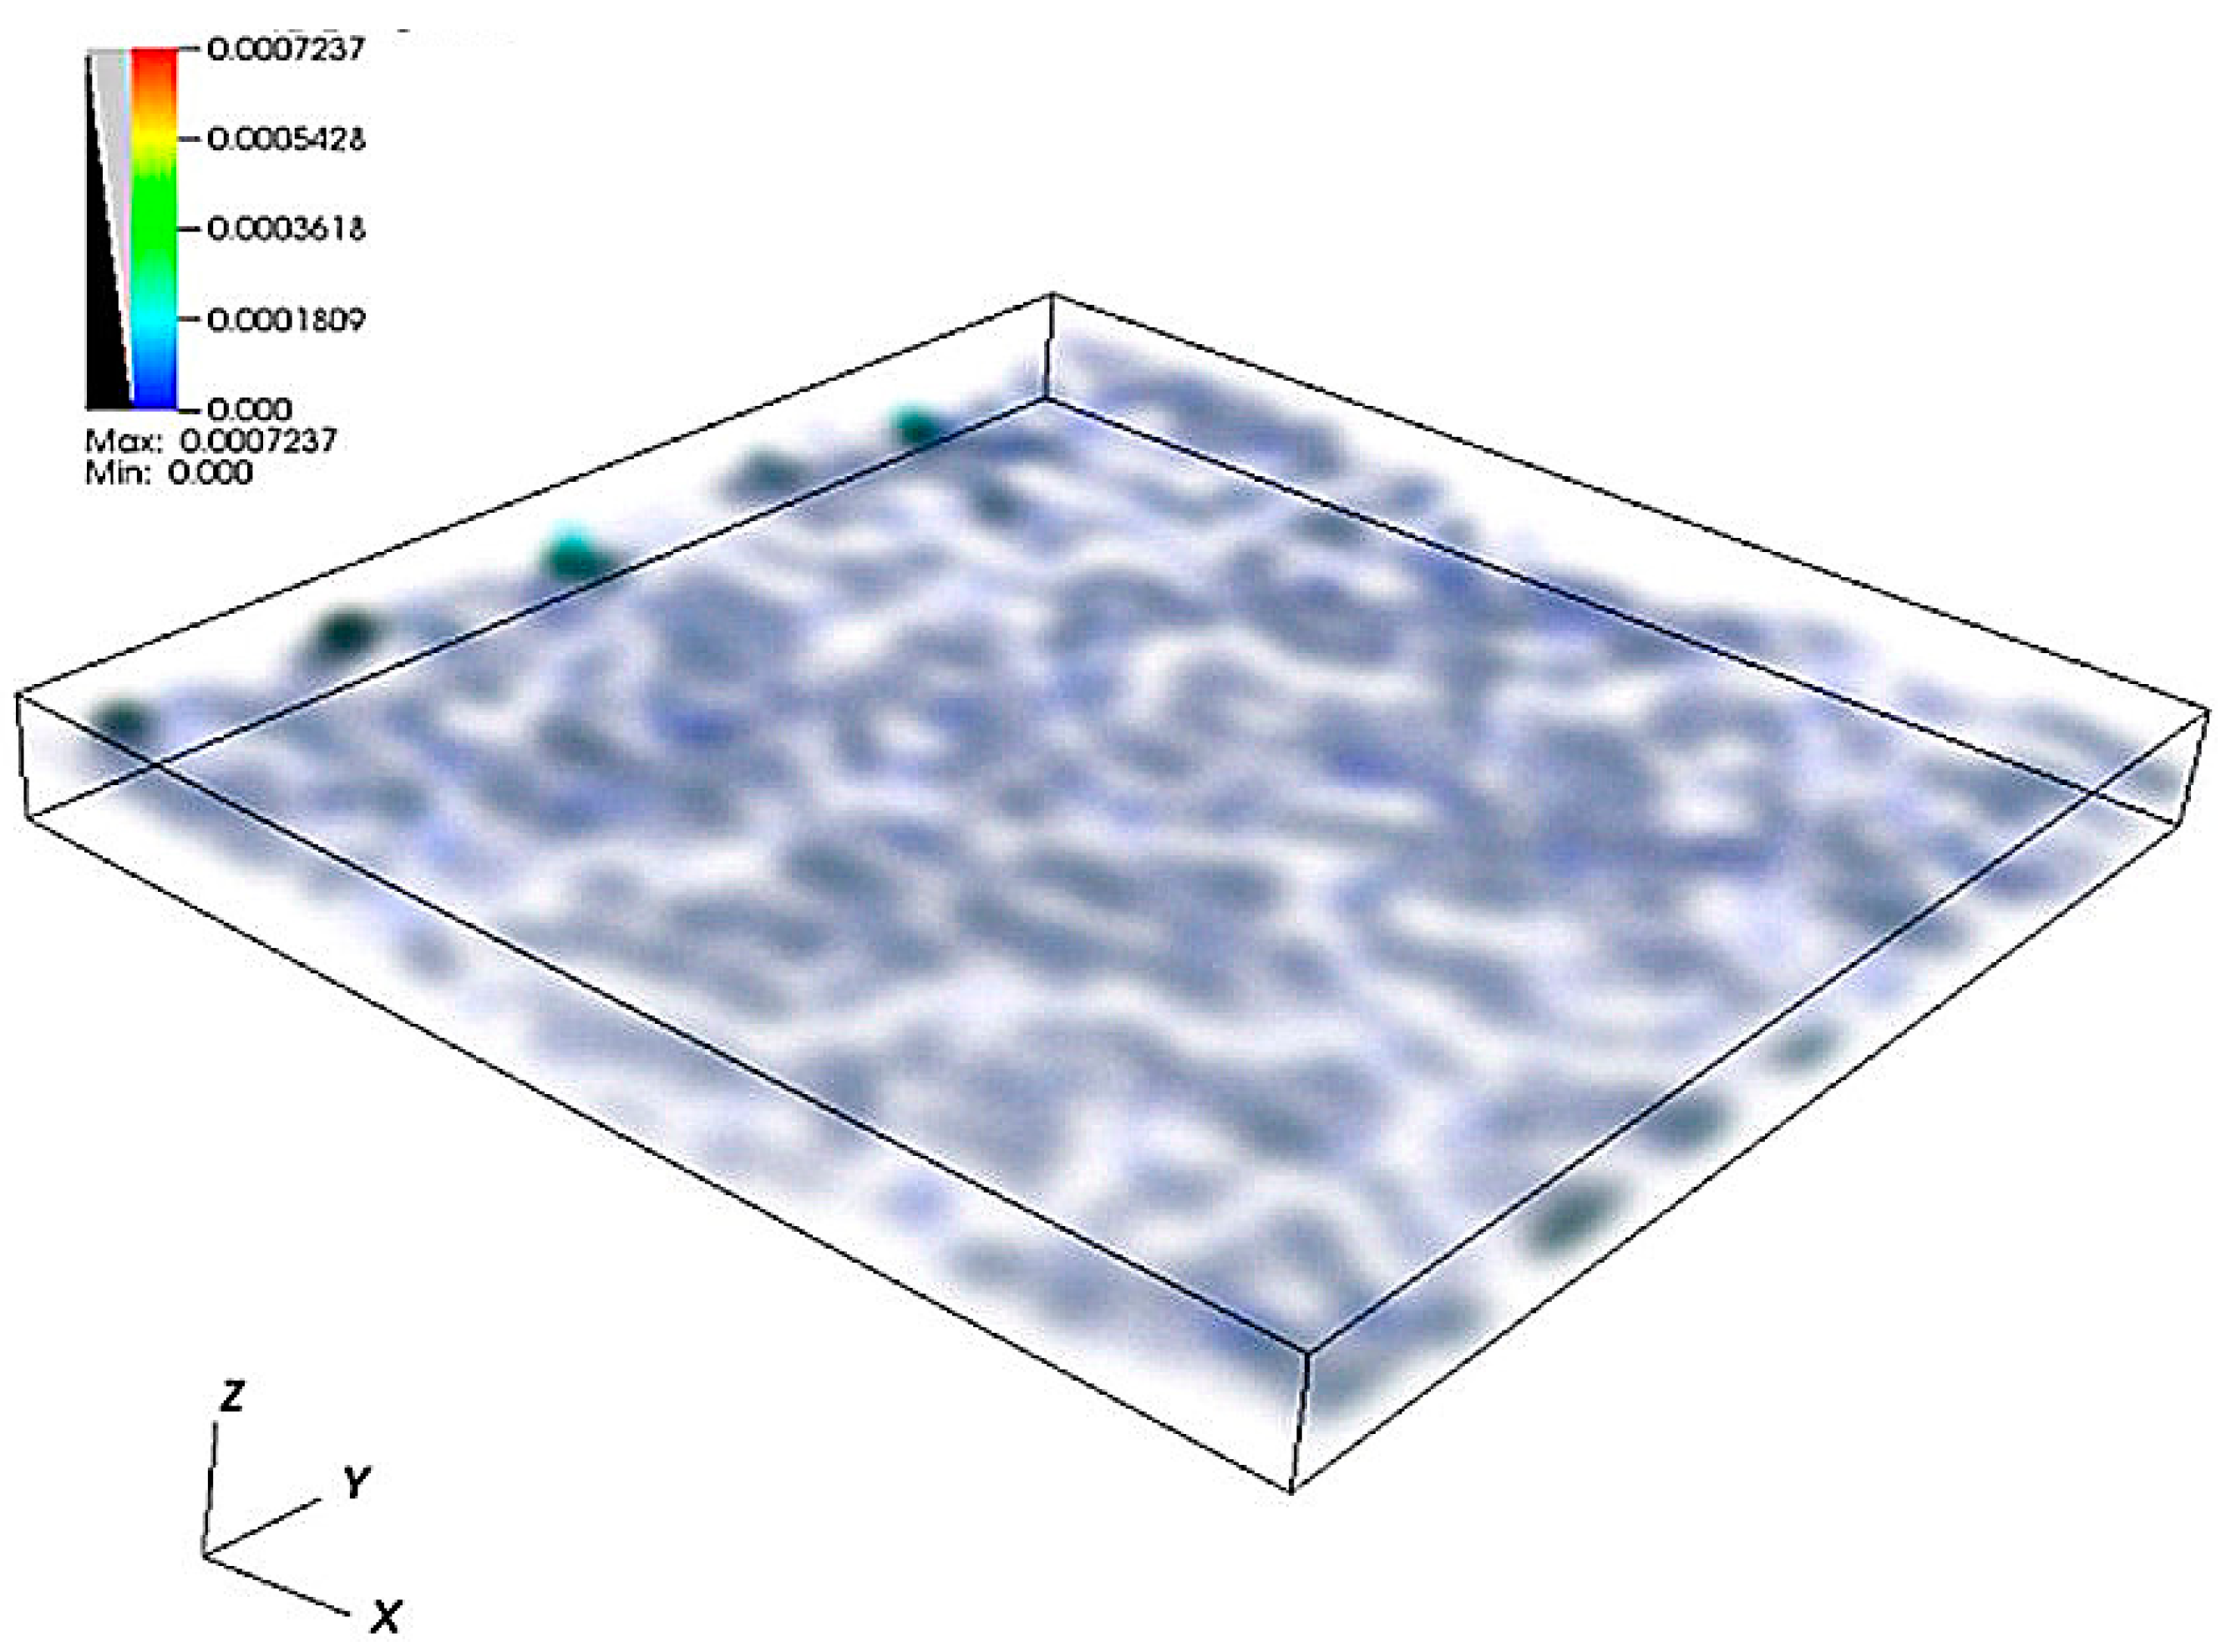
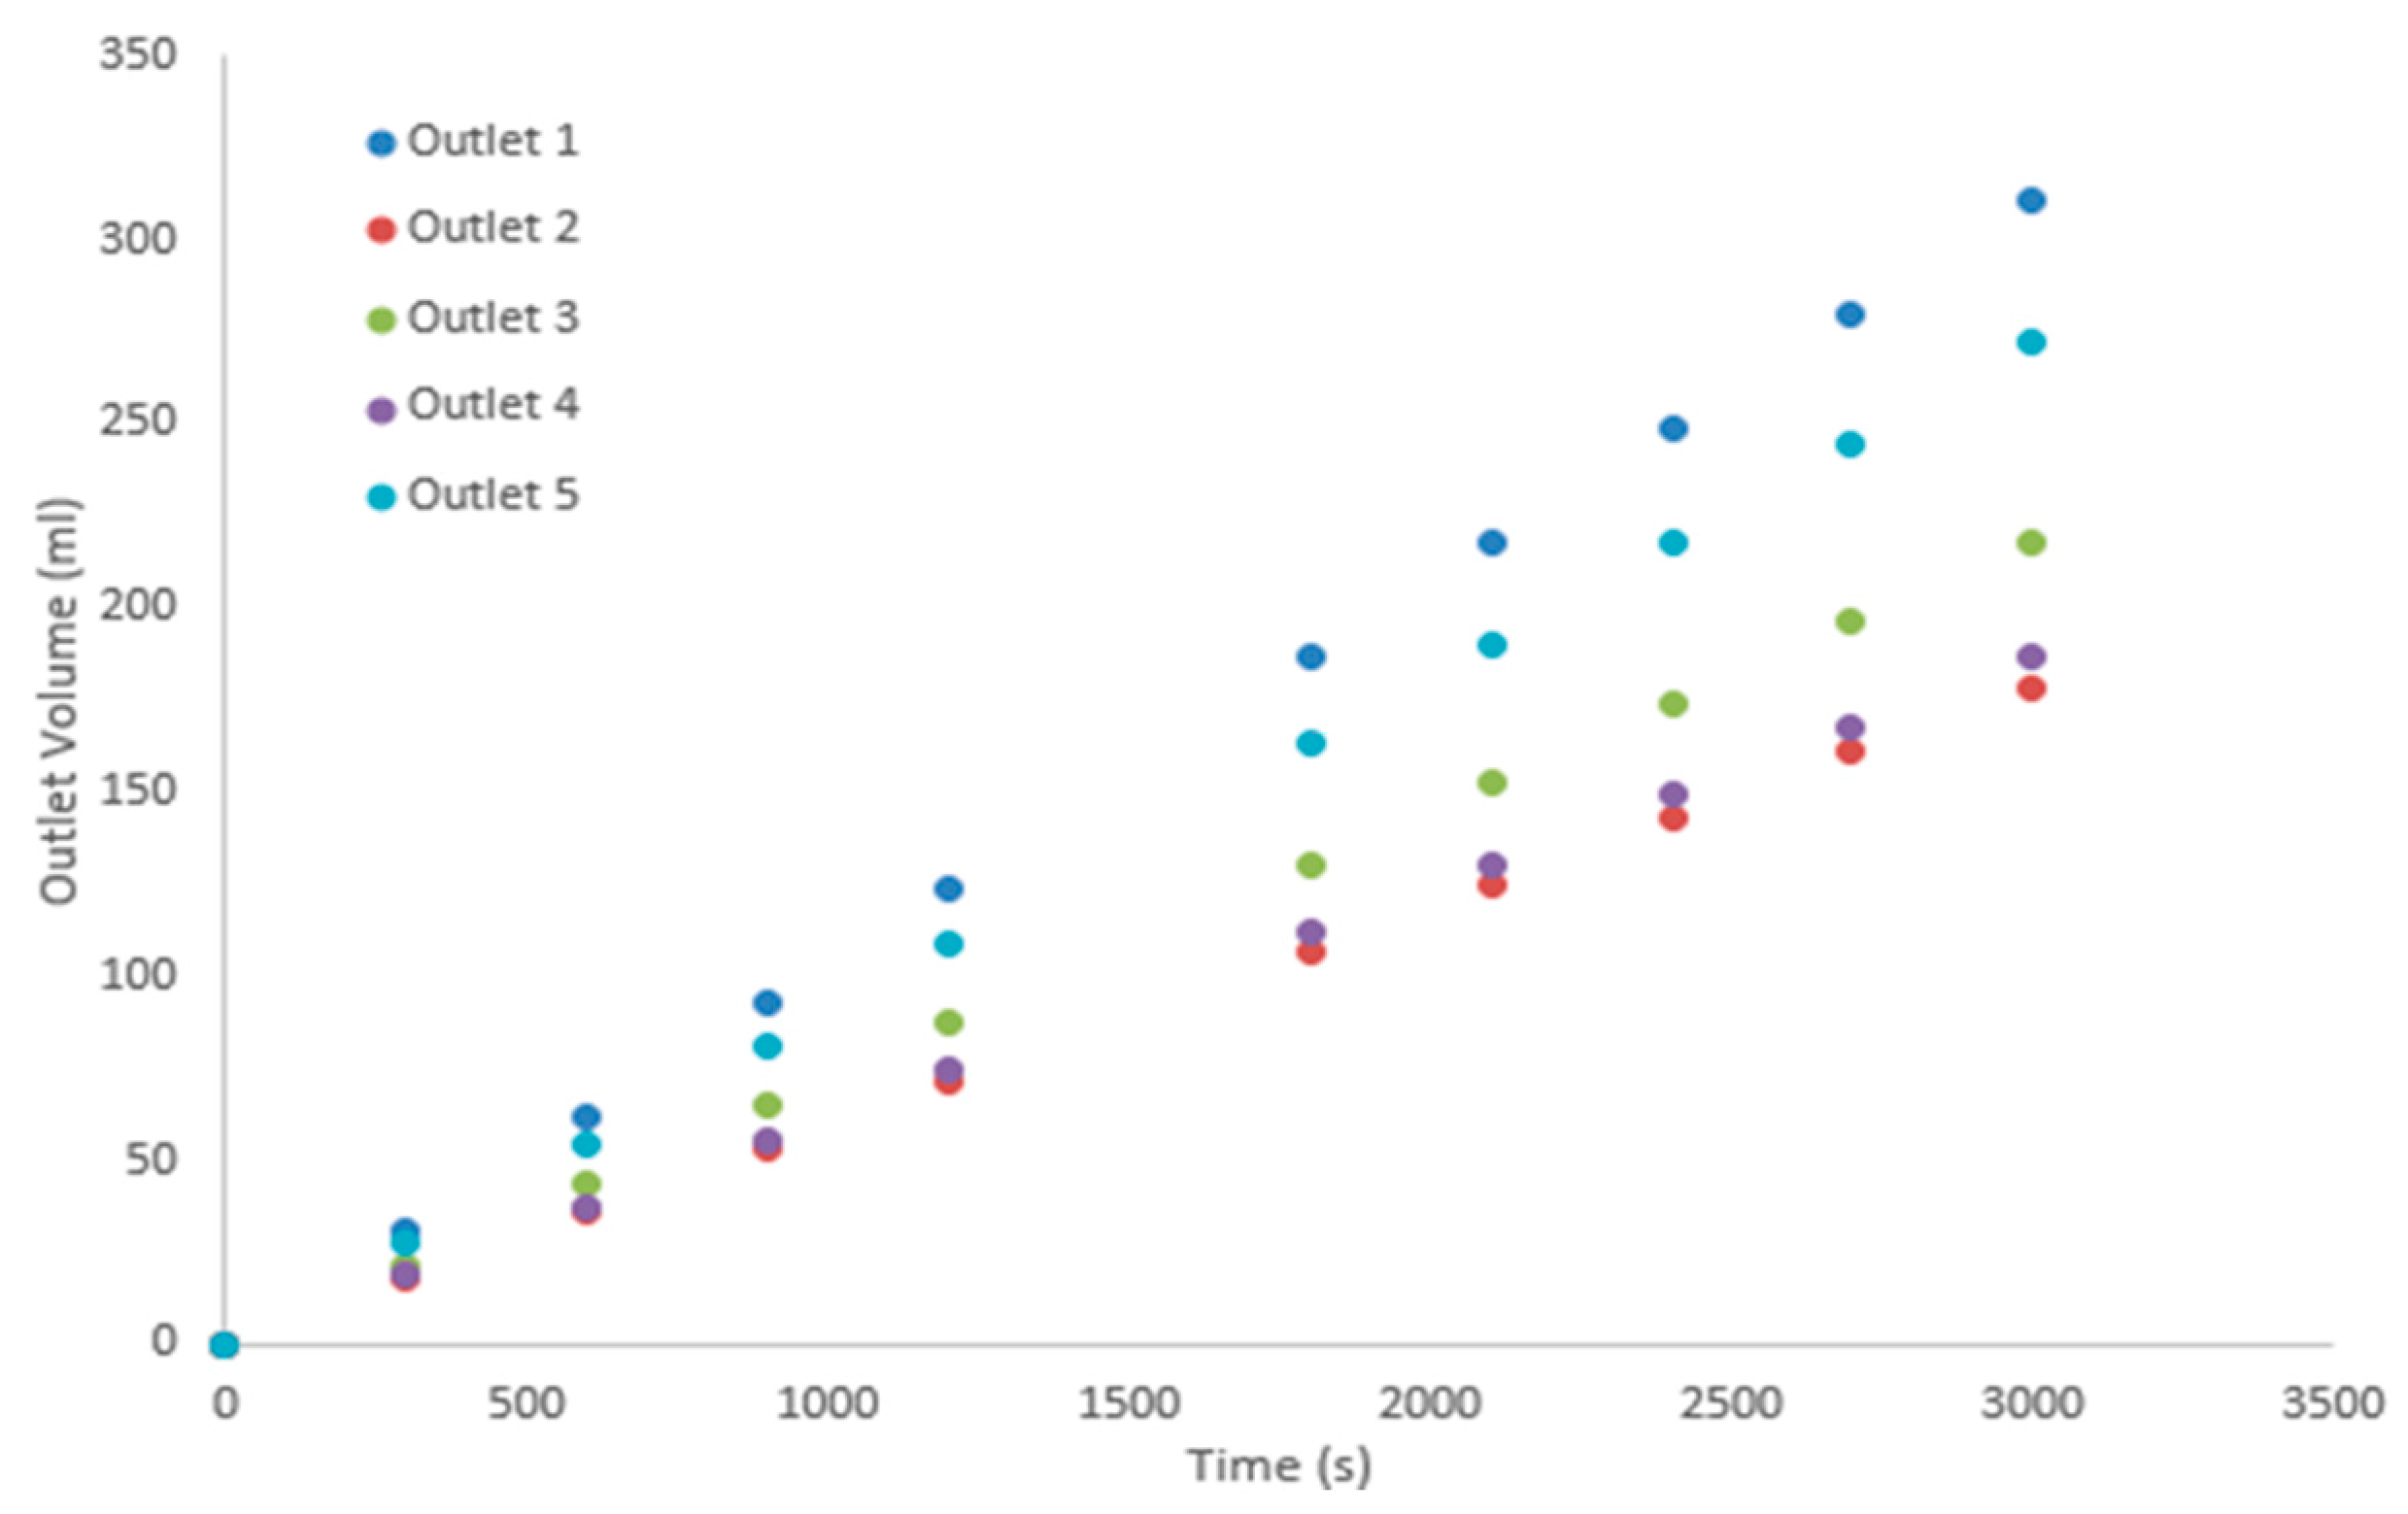
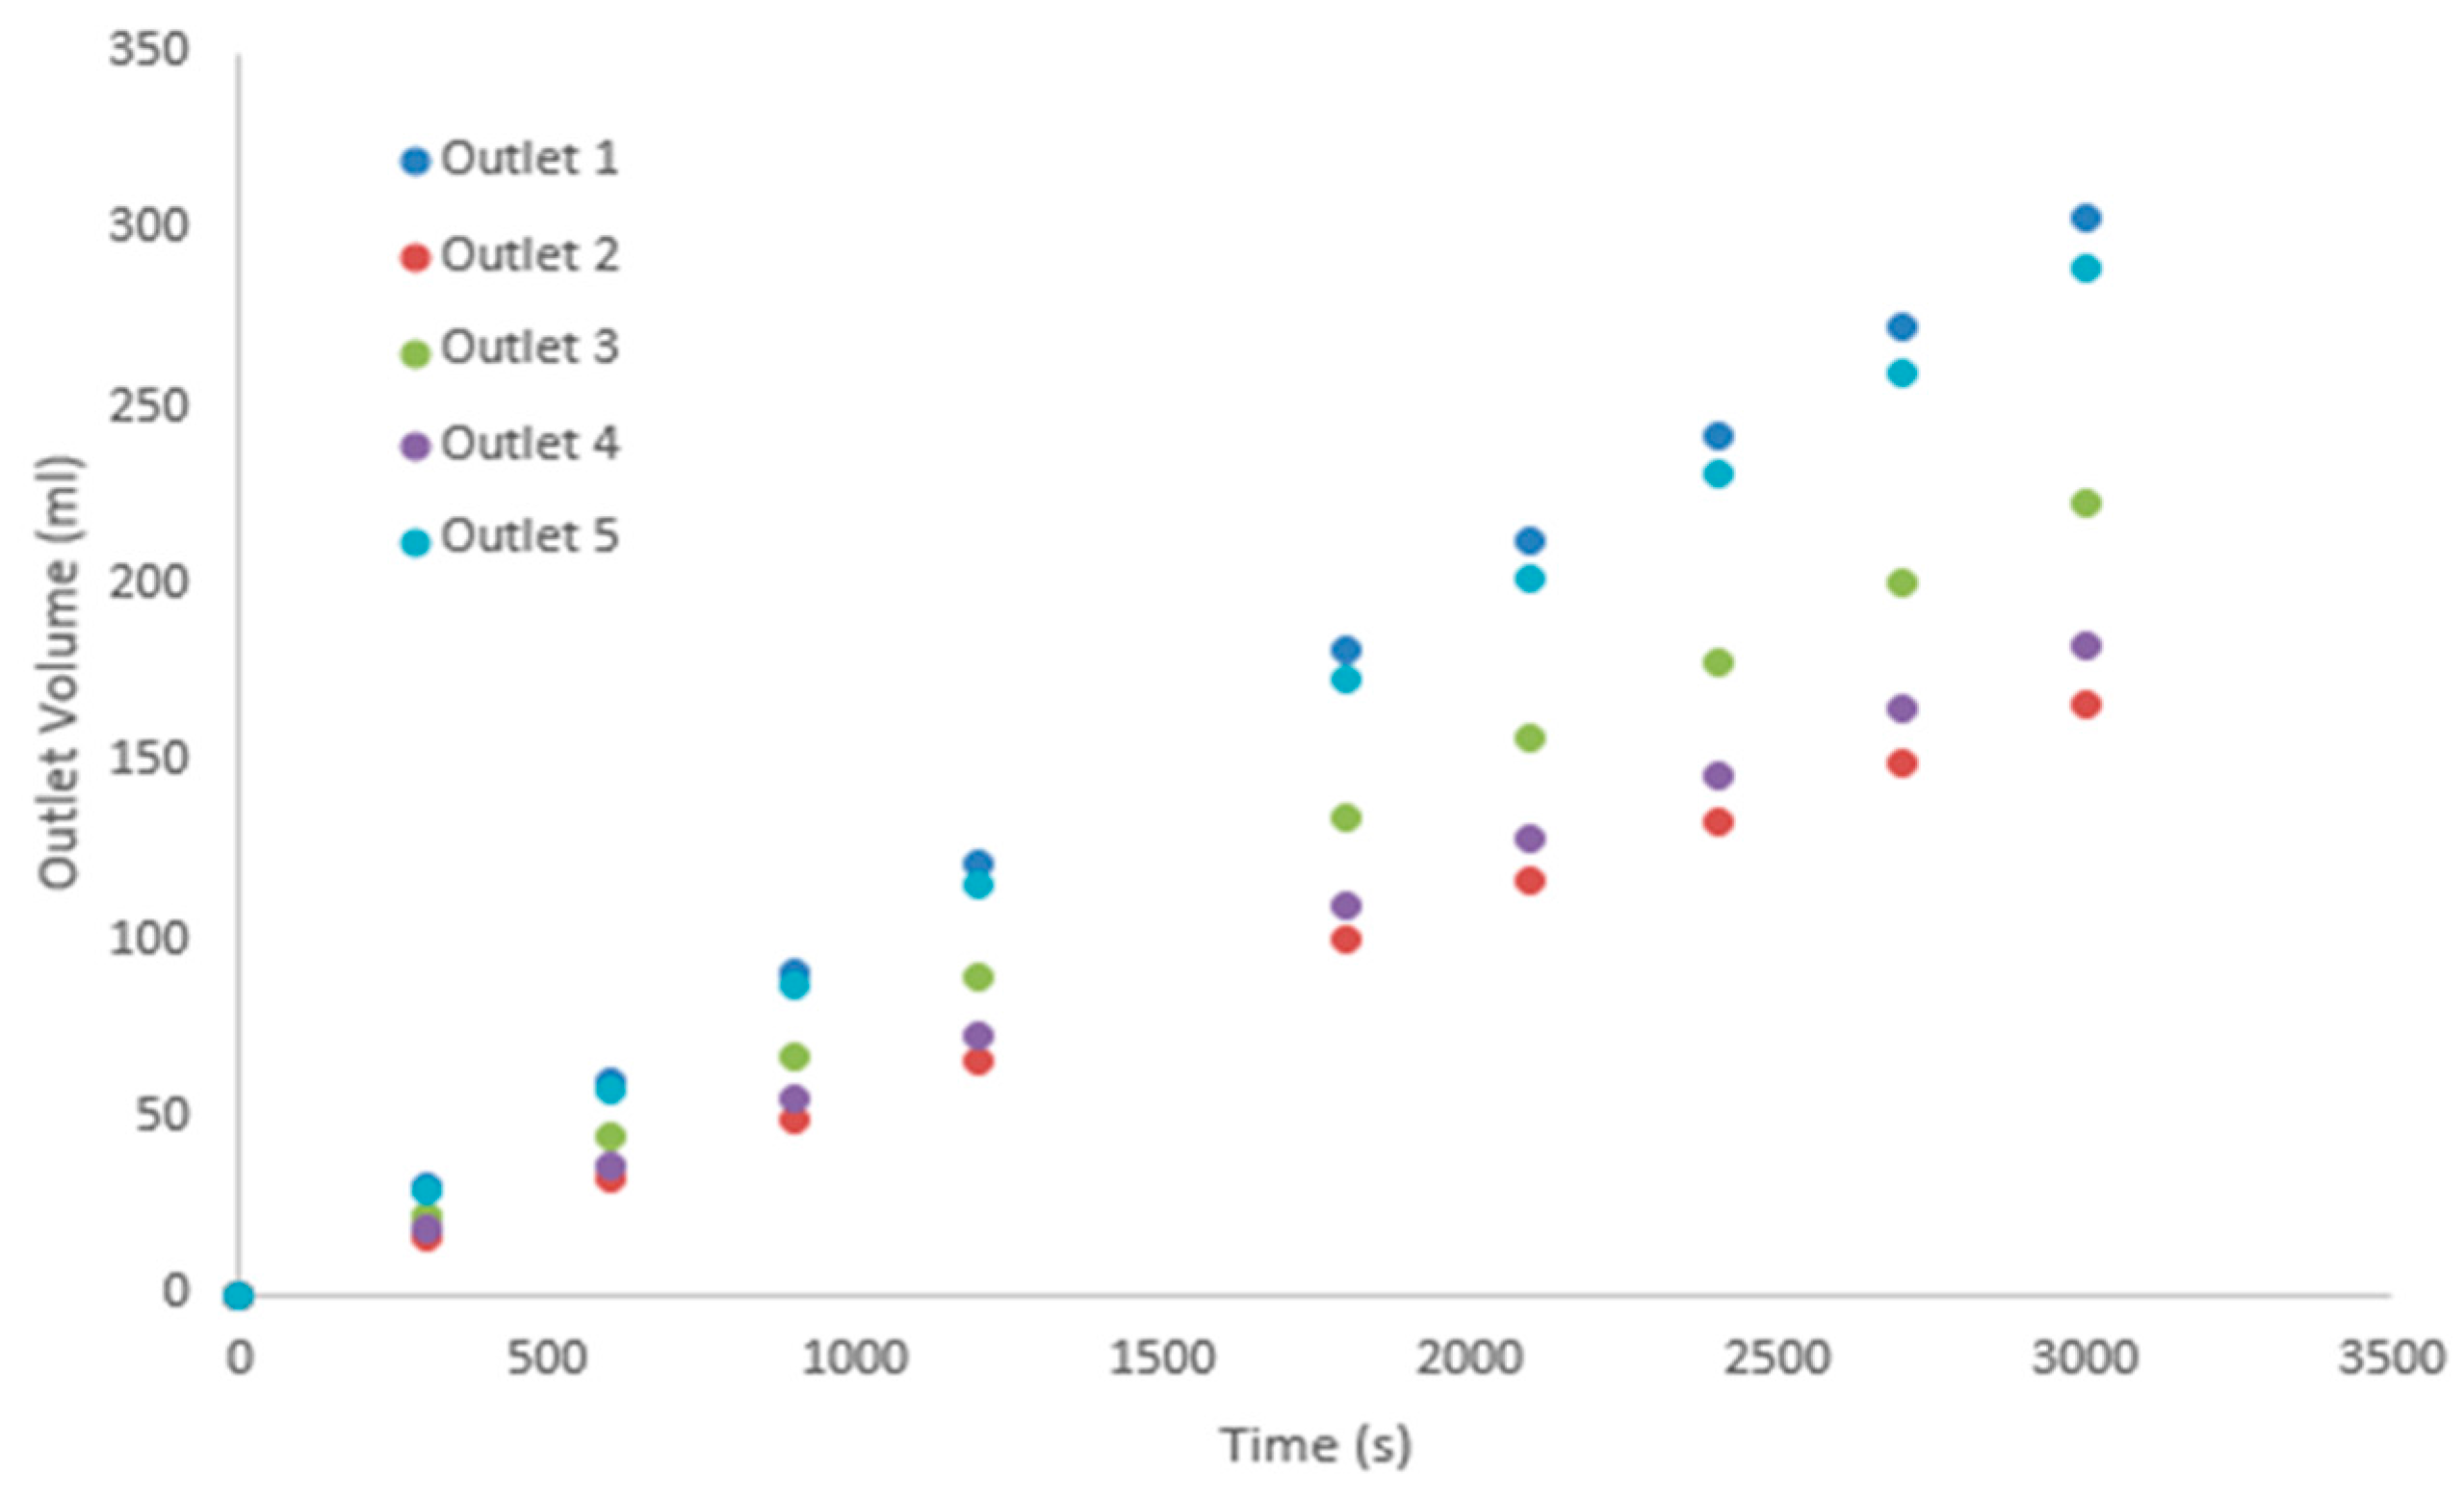
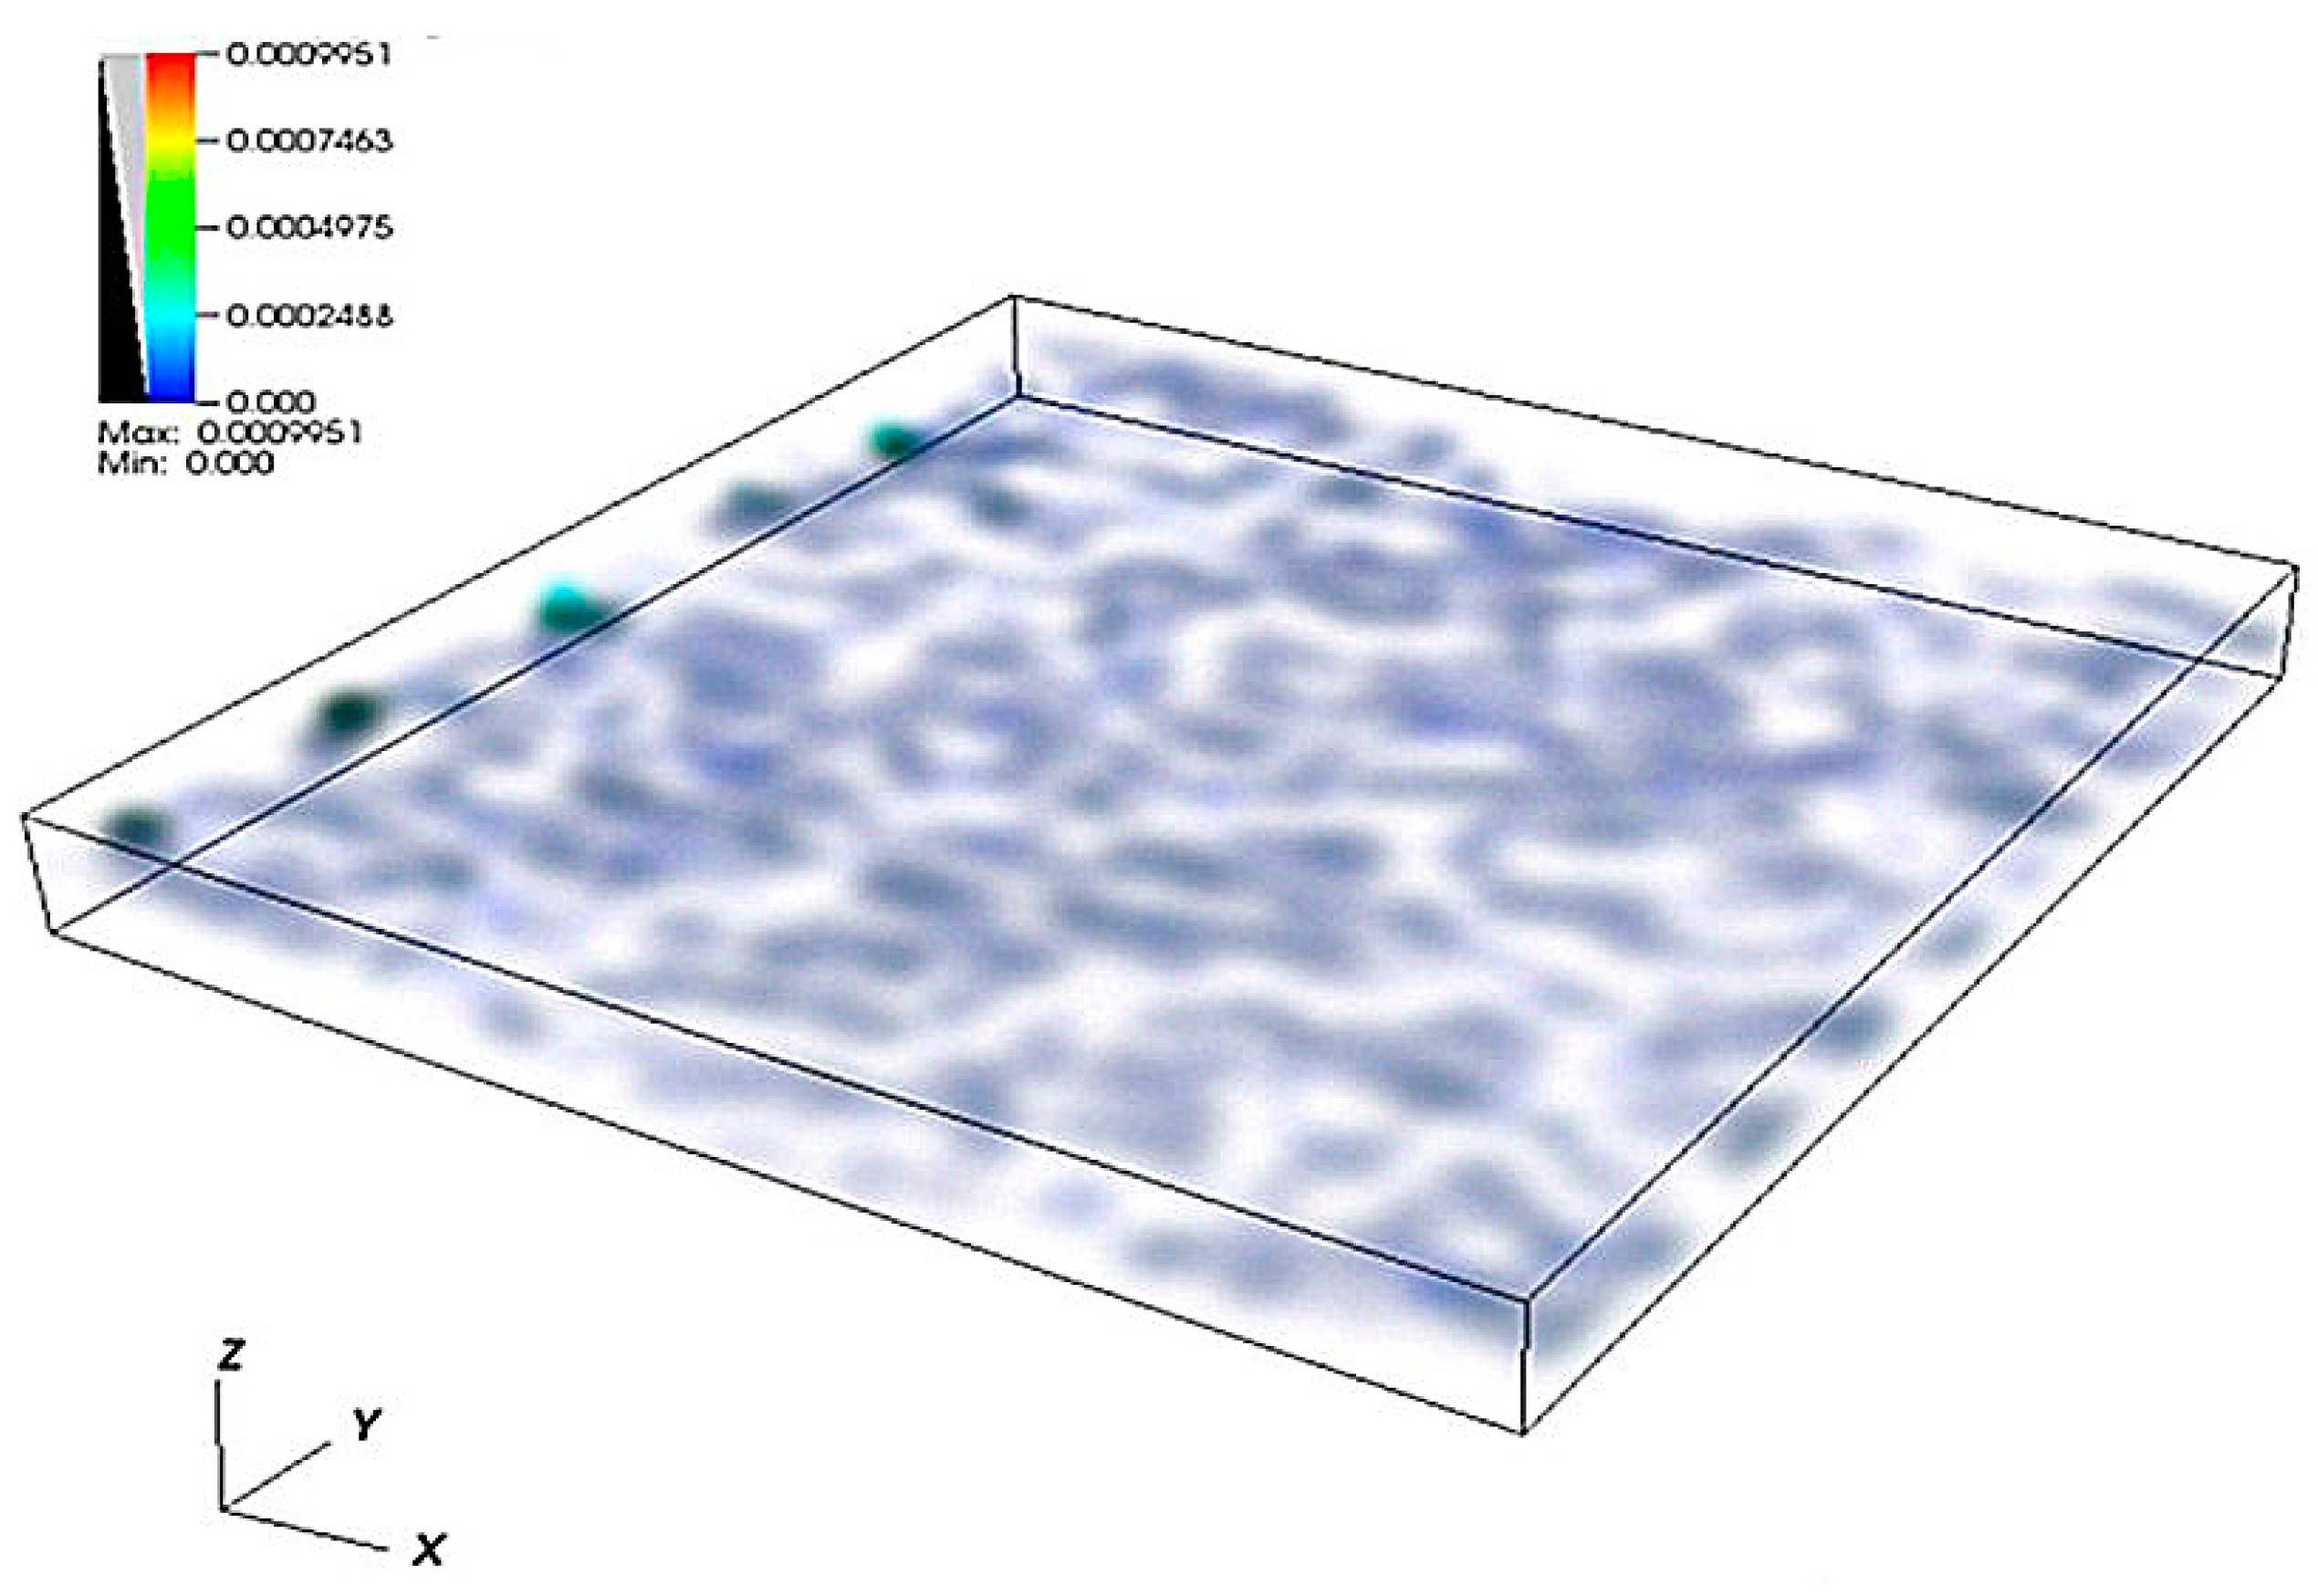
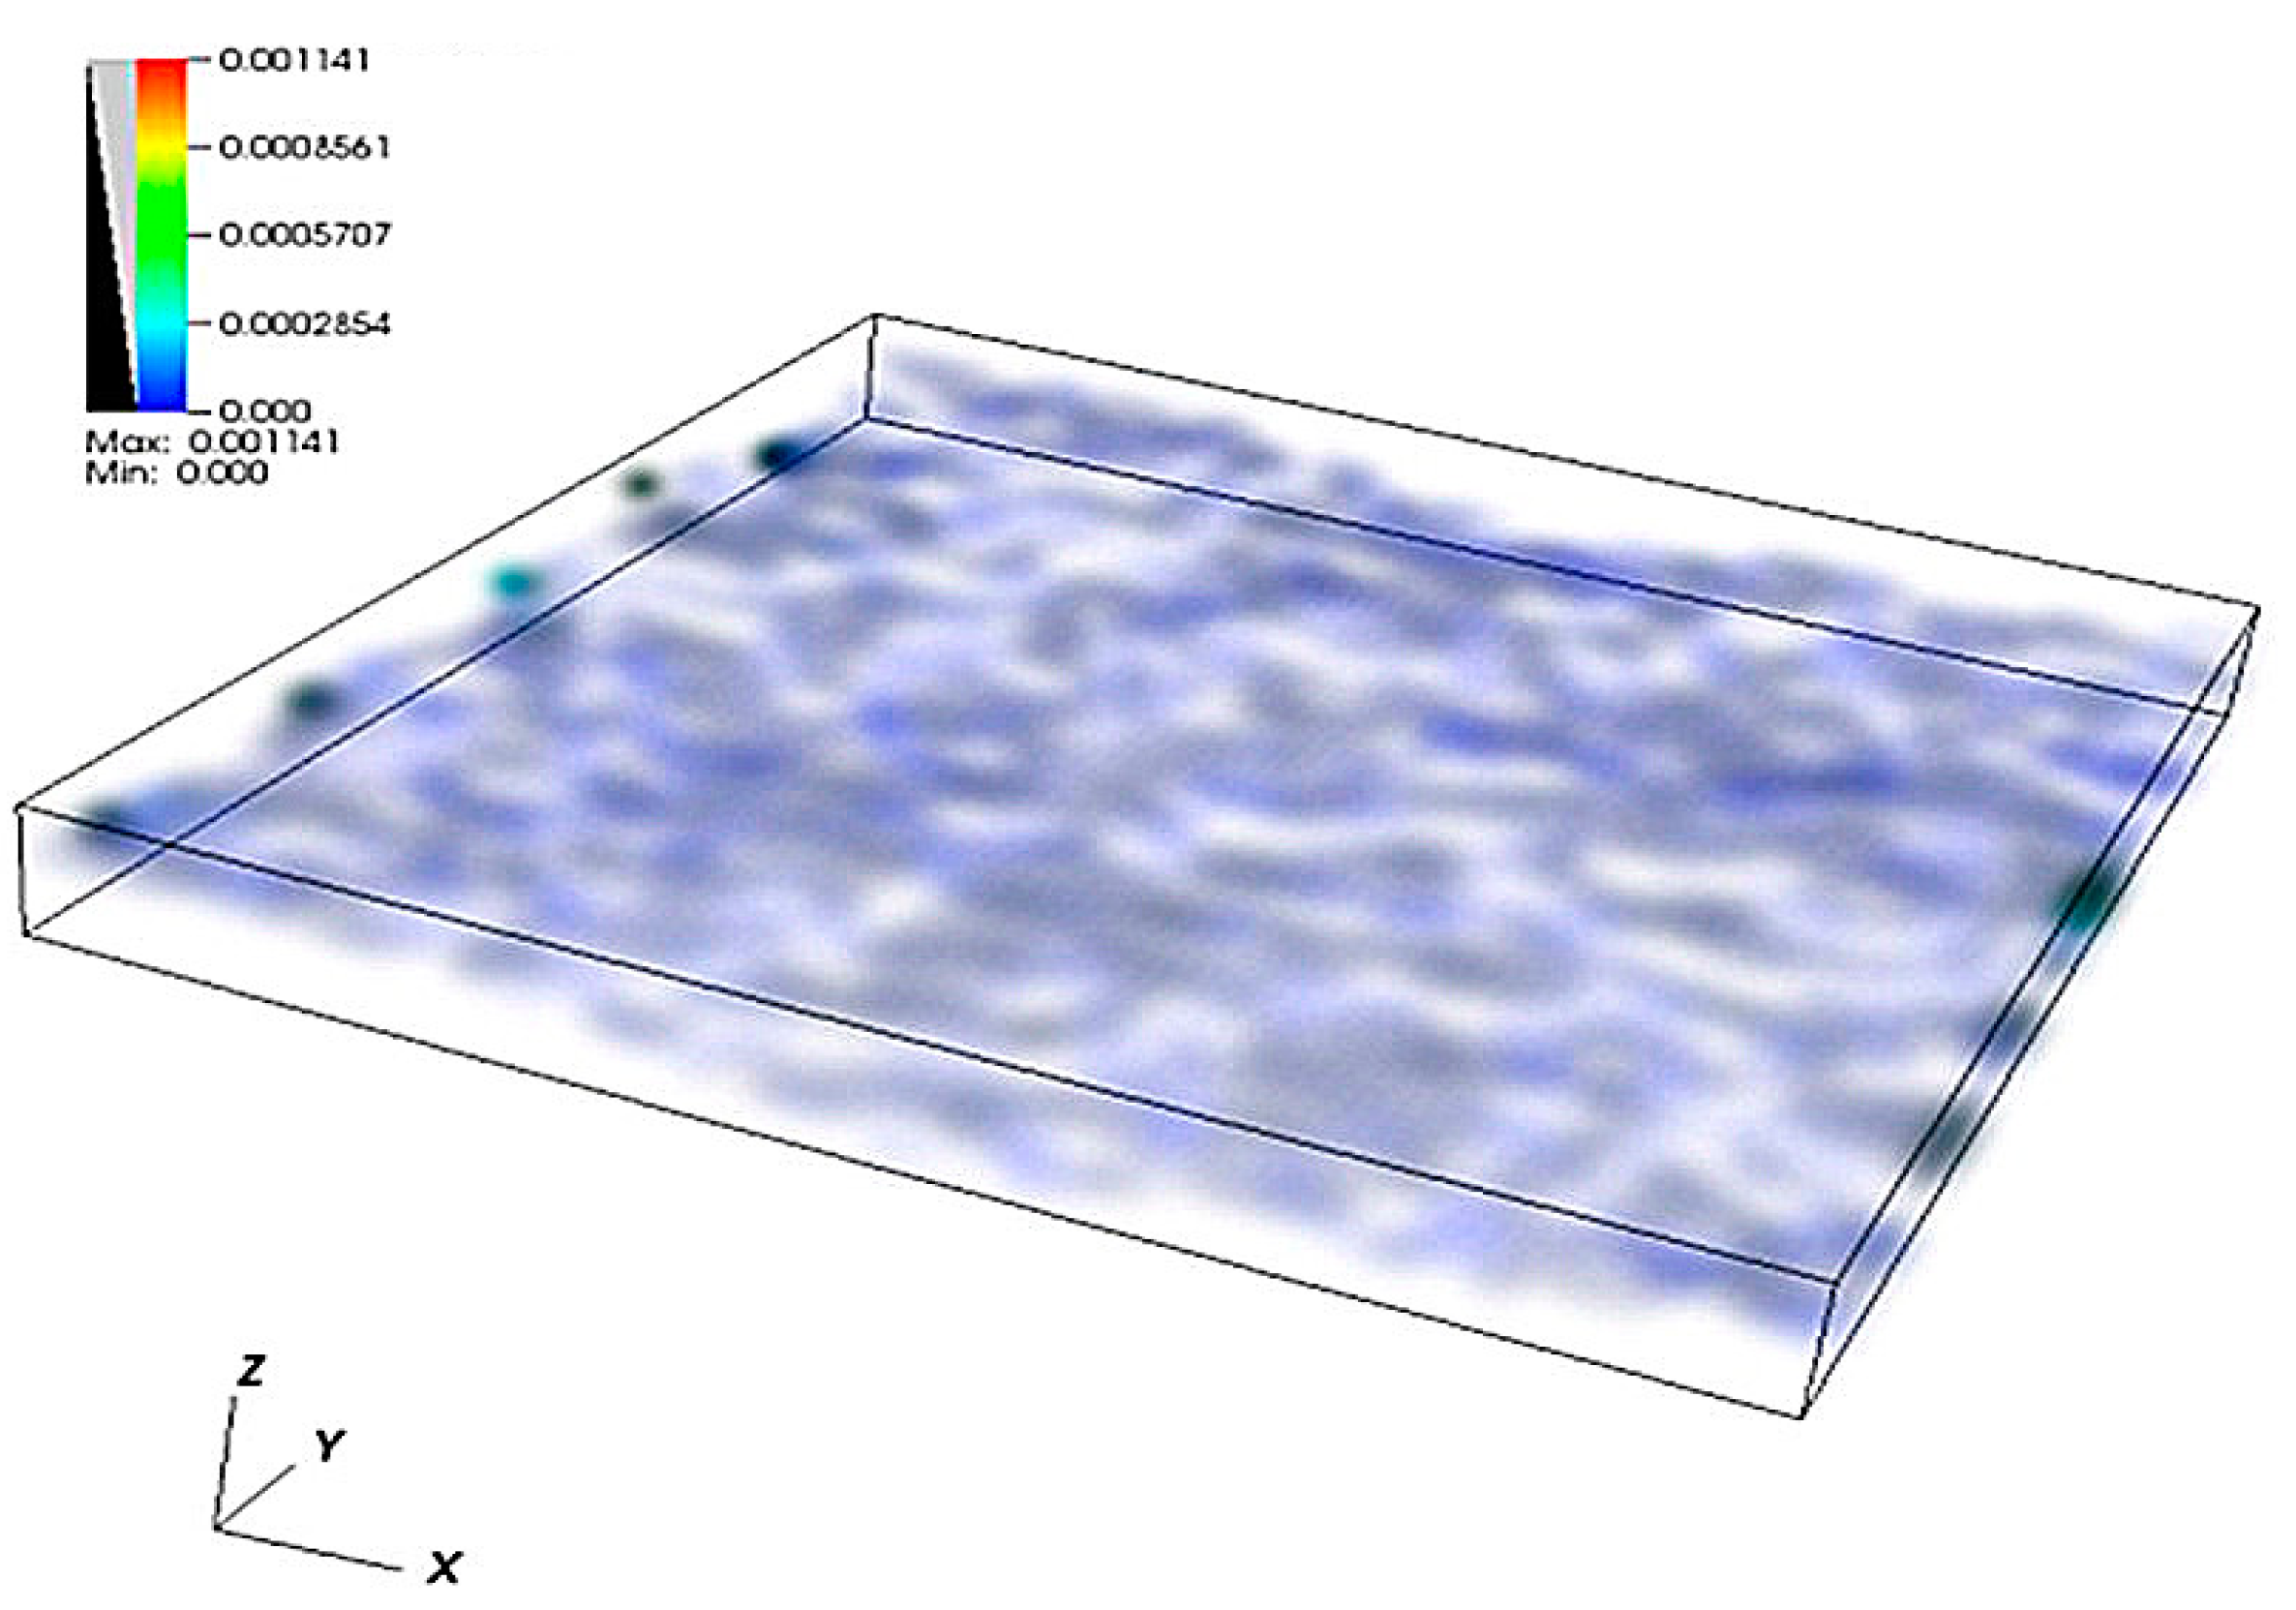
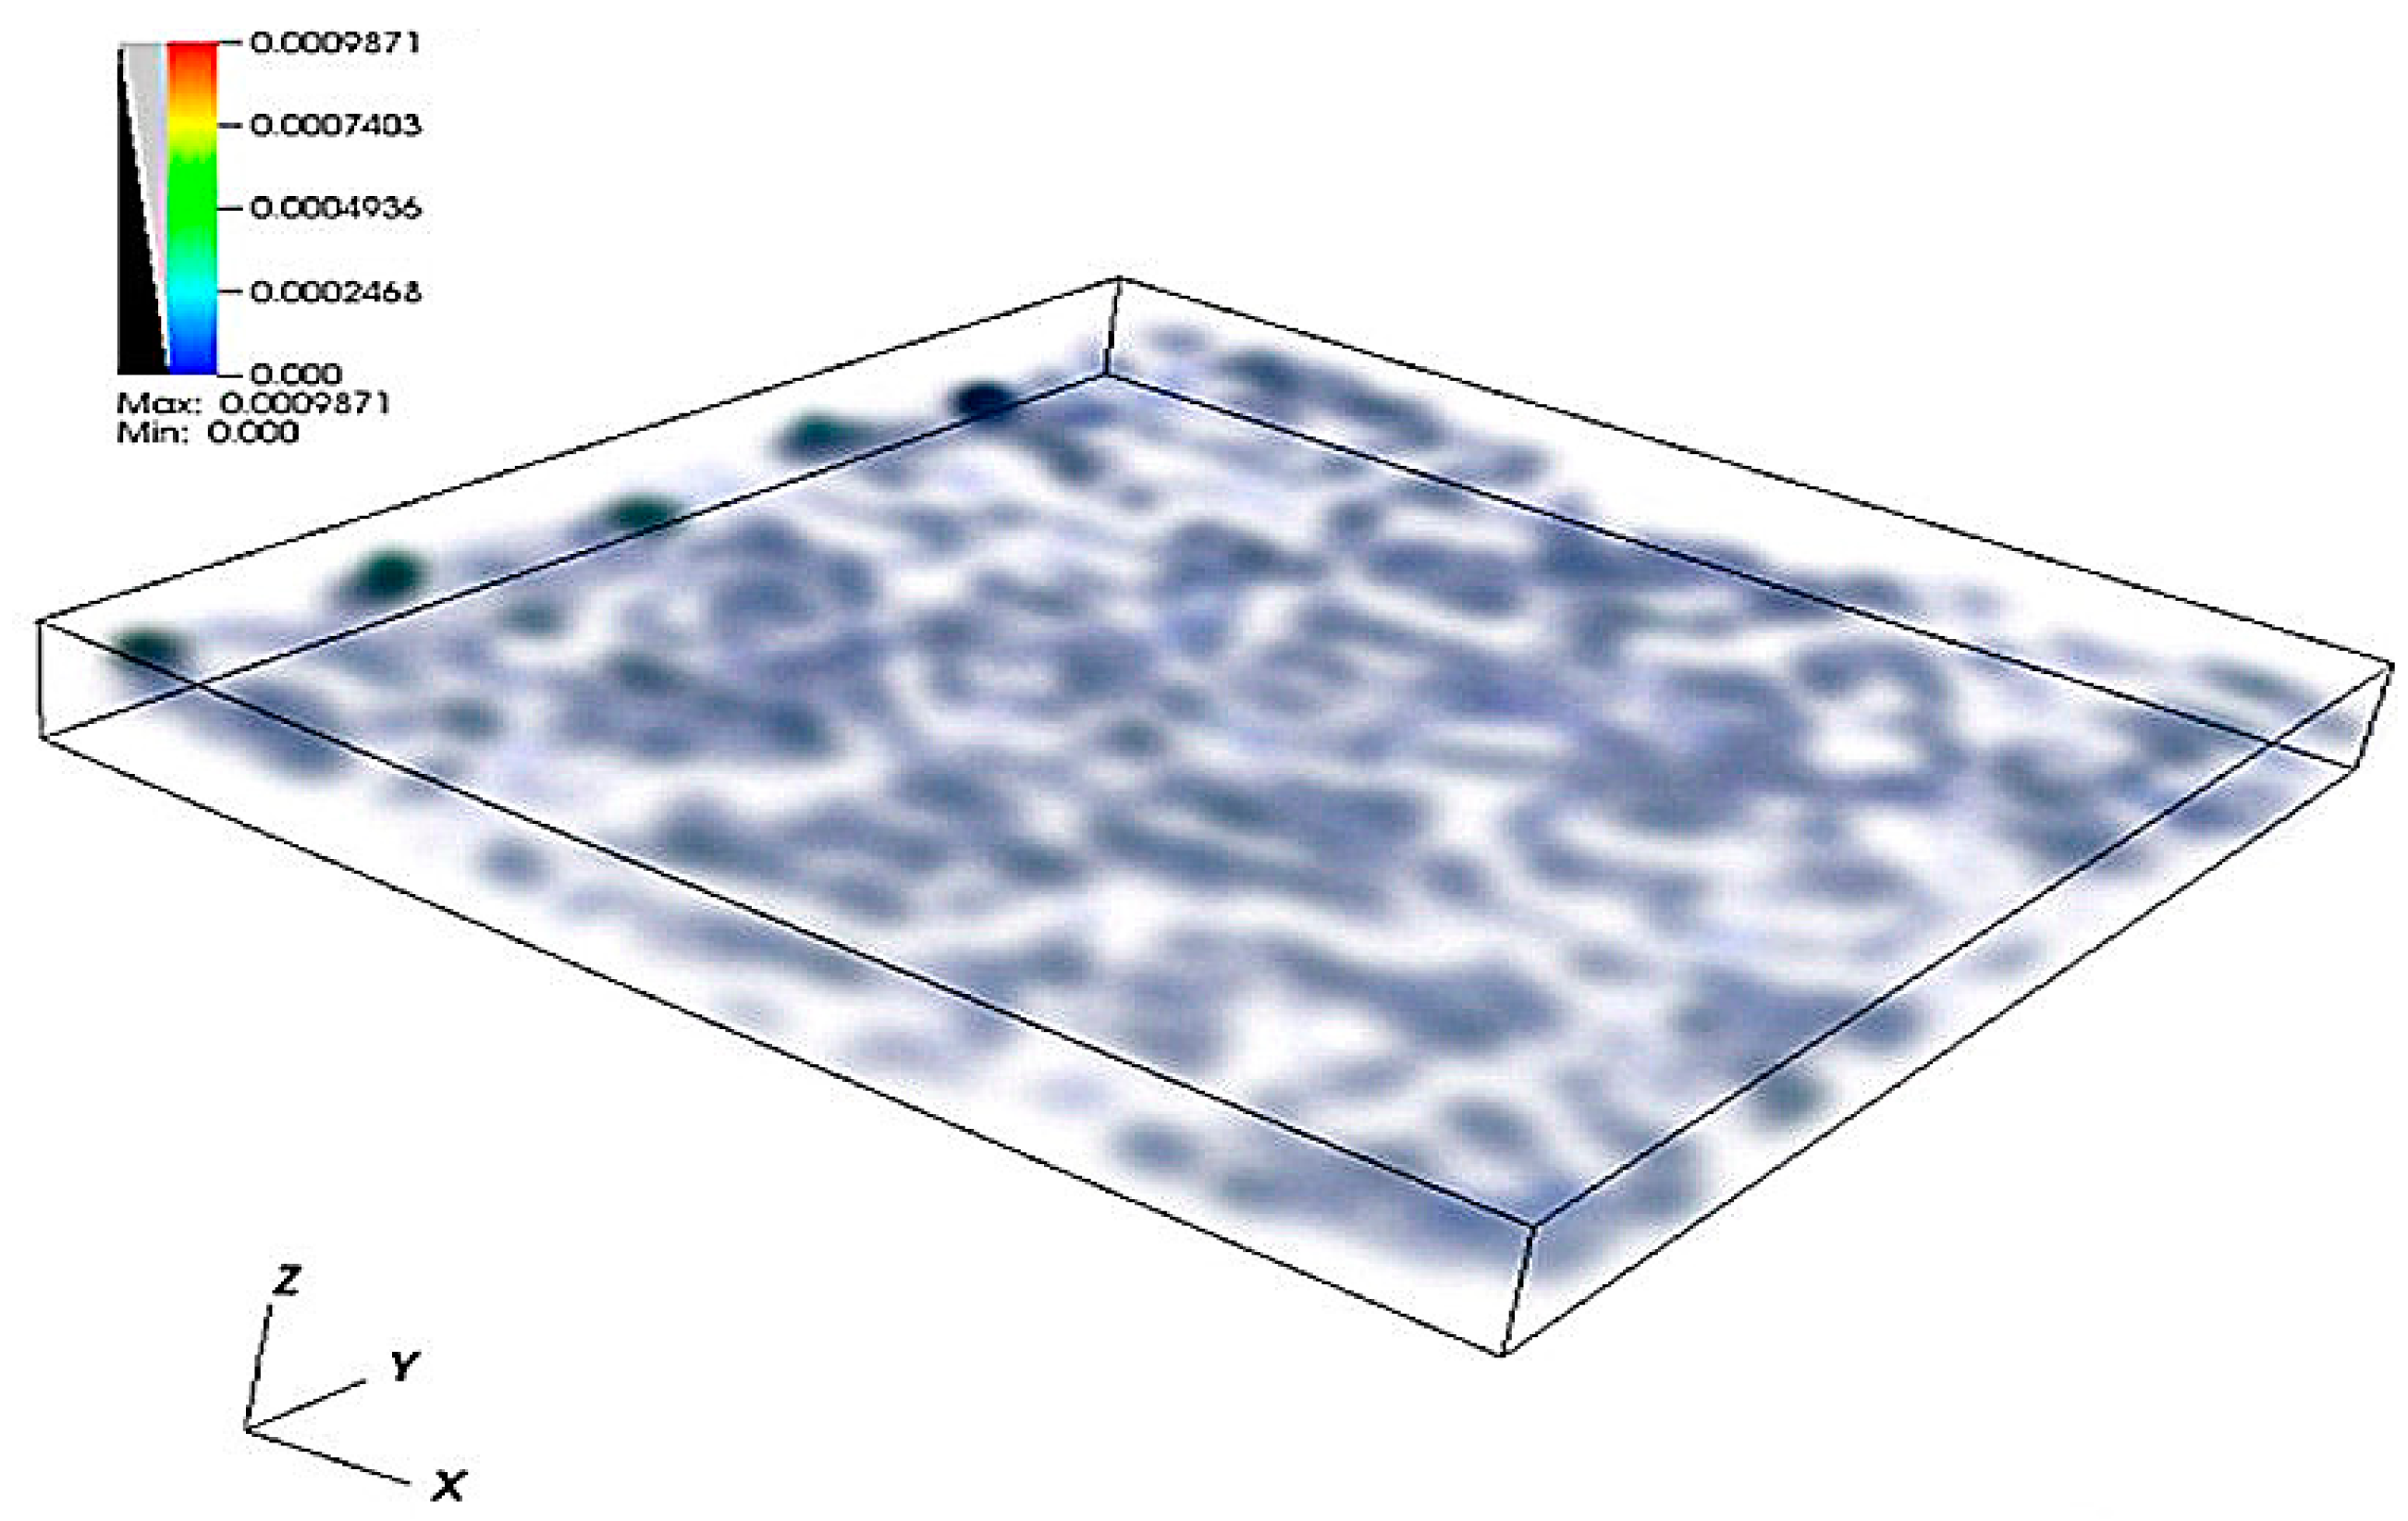
In this section, the data set includes: the fractal dimension is equal to 2.2 and the fracture inclinations are 65° and 75°. The simulation results from the LBM model are presented in Figure 8 and Figure 9 to allow comparisons with the experimental data. The data for Figure 8 and Figure 9 are shown in in the Table A1, Table A2, Table A3 and Table A4 in the Appendix A respectively. It can be seen that the simulation results are in good agreement with the experimental data, though small differences exist. As is shown in Figure 8, Outlet 1 has the largest flow rate and Outlet 5 has the second largest flow rate in both simulation and experimental data. However, the flow rates of Outlet 2 and 3 are almost same and Outlet 4 has the smallest flow rate. The simulation results show that the flow rates of Outlet 2, 3, and 4 are similar. In Figure 9, the flow rate of Outlet 1 is also the largest flow rate in both simulation and experimental data. Moreover, Outlet 2 has a smaller flow rate than that of Outlet 1 and larger than those of other outlets from simulation results. The flow rates of Outlet 2, 3, and 4 are similar, while Outlet 3 has a larger flow rate in the experimental data. As for velocity distributions from simulation results, a deeper color means a higher velocity. The differences in flow rates among every outlet are caused by the velocity distributions and the number of cells to calculate the flow rates in the area of the outlets. In Figure 10 and Figure 11, the areas on the discharging surface corresponding to Outlet 1 and 5 have more concentrated velocity distributions. This gives an explanation that Outlet 1 and 5 have larger flow rates than Outlet 2, 3, and 4. It is also shown that there are three concentrated velocity distributions with higher values of velocity on the discharging surface corresponding to Outlet 2, 3, and 4. However, there are three velocity distributions: one belongs to Outlet 2, one belongs to Outlet 2 and 3, and one belongs to Outlet 3 and 4. Though there are three concentrated velocity distributions with higher values in the areas of Outlet 2, 3, and 4, it cannot be ignored that the existence of blank areas occupying large proportions of areas of Outlet 2, 3, and 4 means much lower values of velocity. The velocity distributions in the areas of Outlet 2, 3, and 4 result in the smaller flow rates. It should be noted that the maximum velocity shown in the Figure 10 and Figure 11 only represents the velocity for certain numbers of cells in Lattice Boltzmann Domain. In addition, in Section 4.3 and Section 4.4, the cells on discharging surfaces are different for each case. The analysis above gives a detailed explanation of different flow rates corresponding to different outlets.
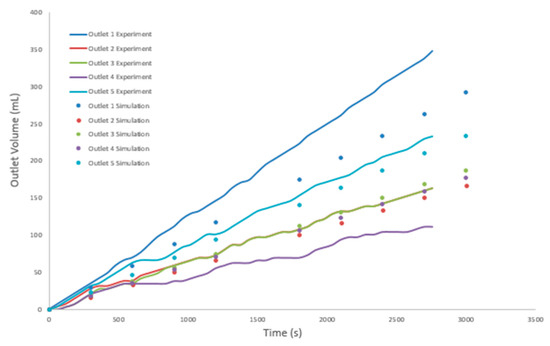
Figure 8.
The outlet volume of the fracture inclination 65° from experimental and simulation results.
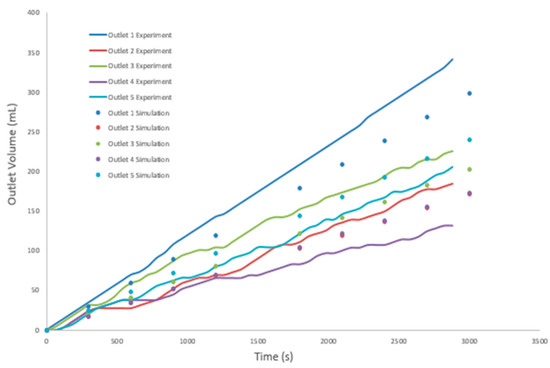
Figure 9.
The outlet volume of the fracture inclination 75° from experimental and simulation results.
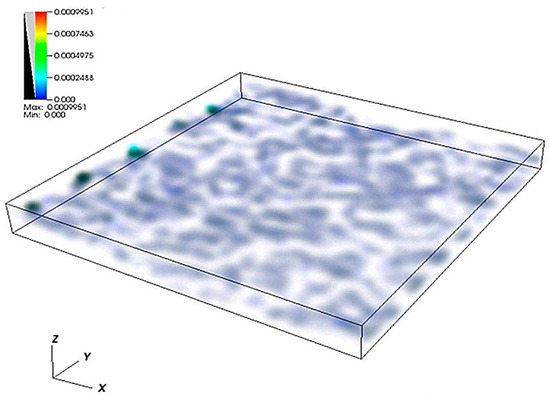
Figure 10.
The velocity distribution of the fracture inclination 65° from LBM simulation.
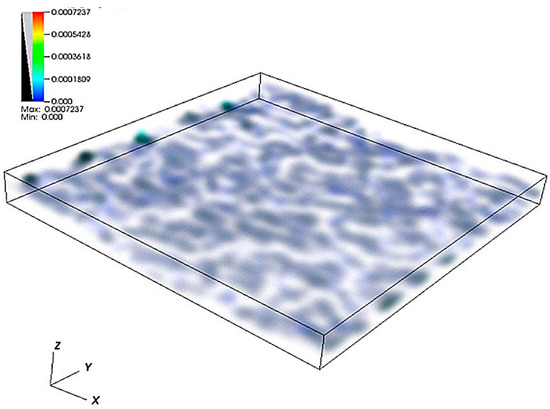
Figure 11.
The velocity distribution of the fracture inclination 75° from LBM simulation.
On the basis of the above statements, the fracture inclination affects the flow paths to a certain extent, meaning that the gravity force has an effect on the flow paths. It has shown that the main trends of simulation results are in good agreement with those of experimental data, despite the differences that exist among them.
4.3. Influence of Fractal Dimension
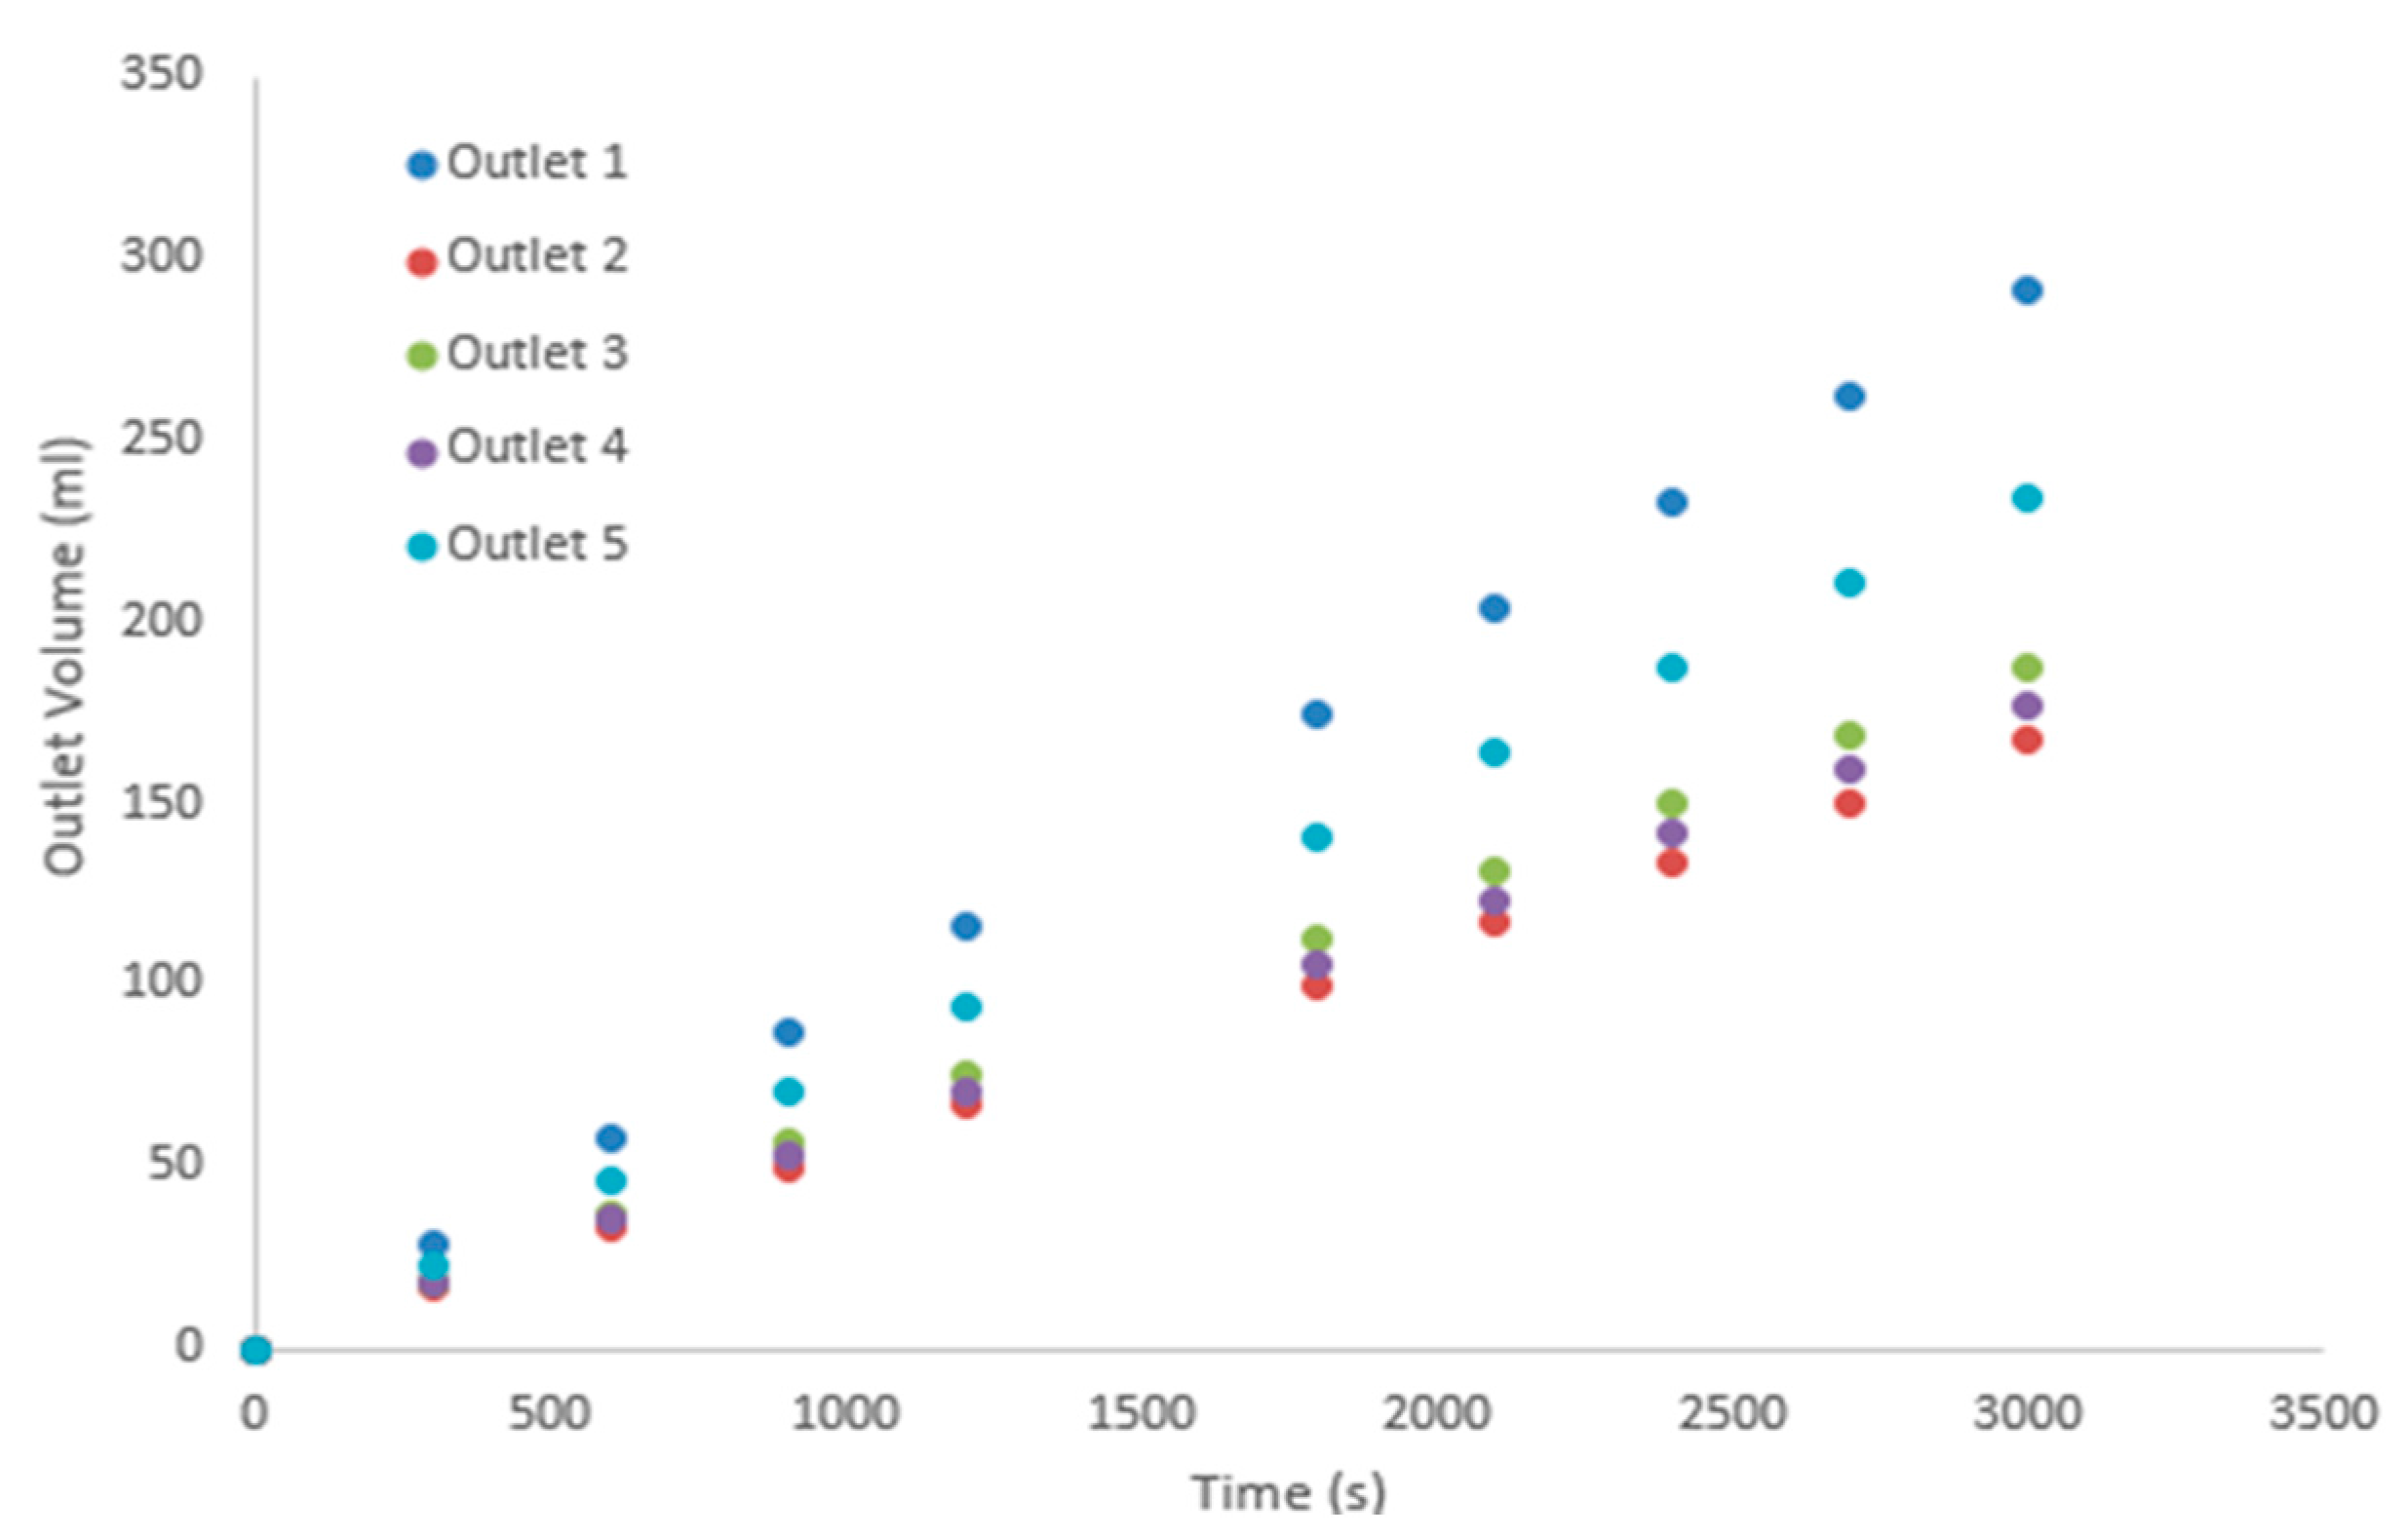
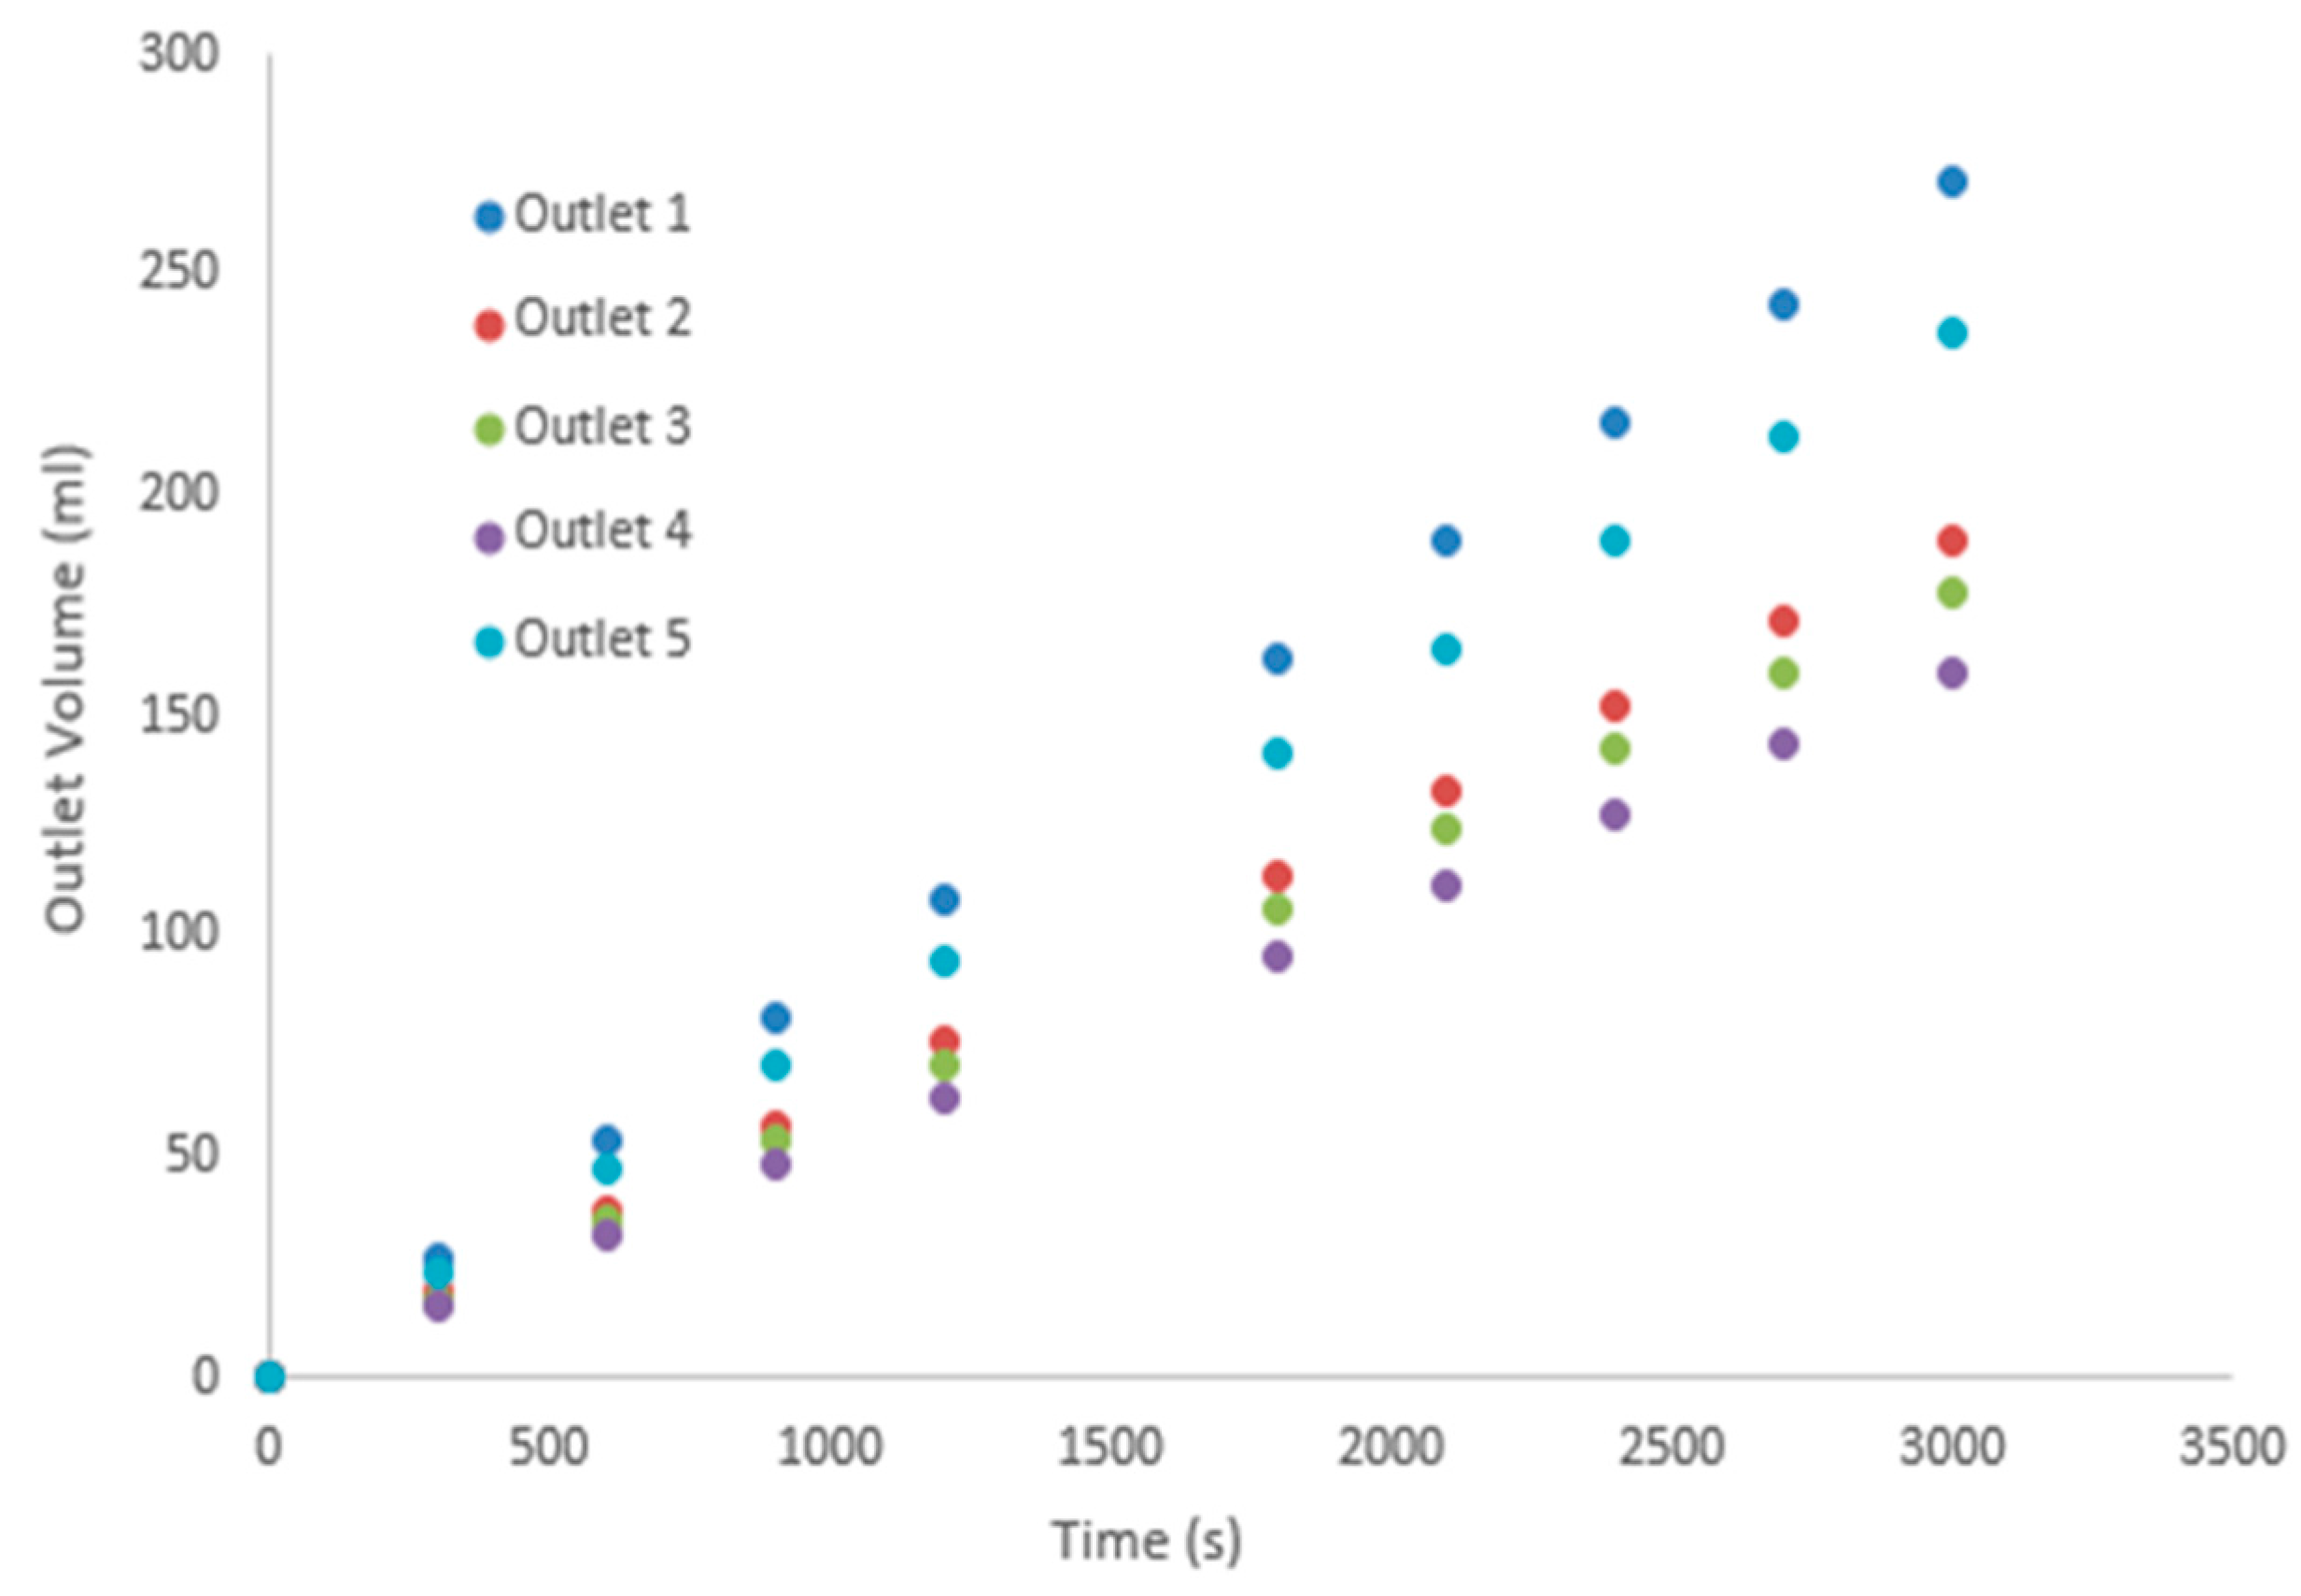
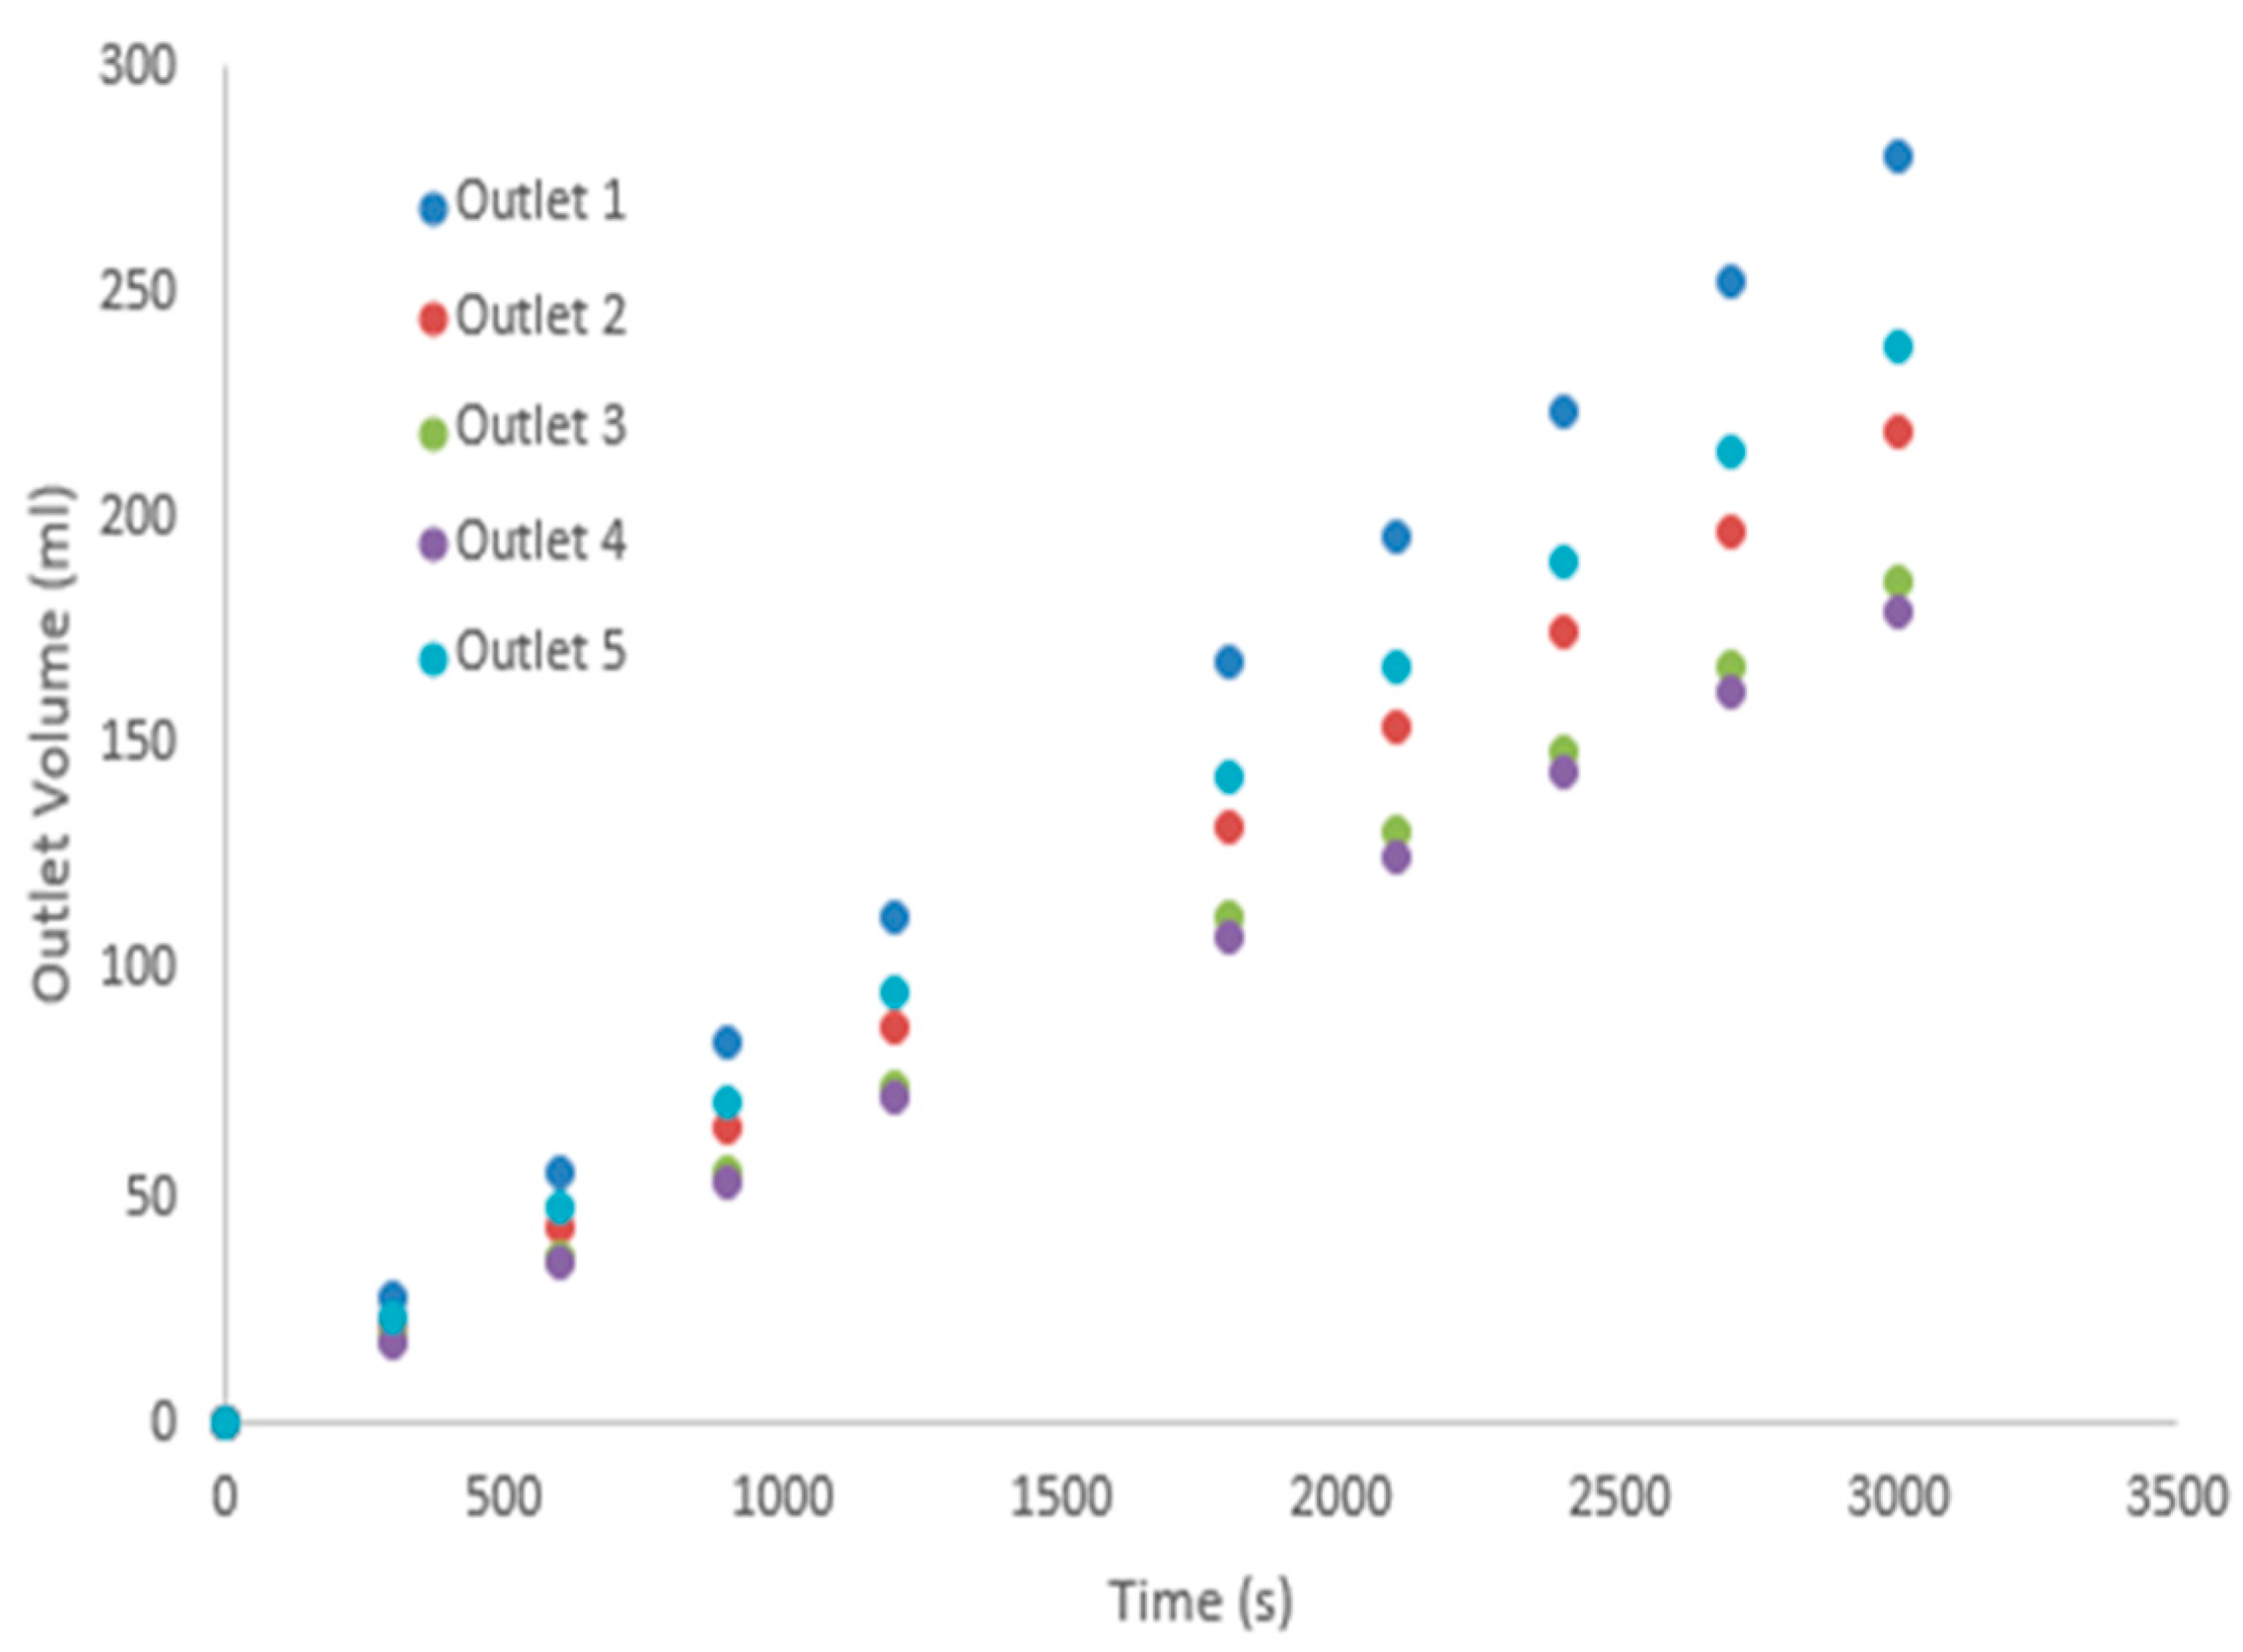
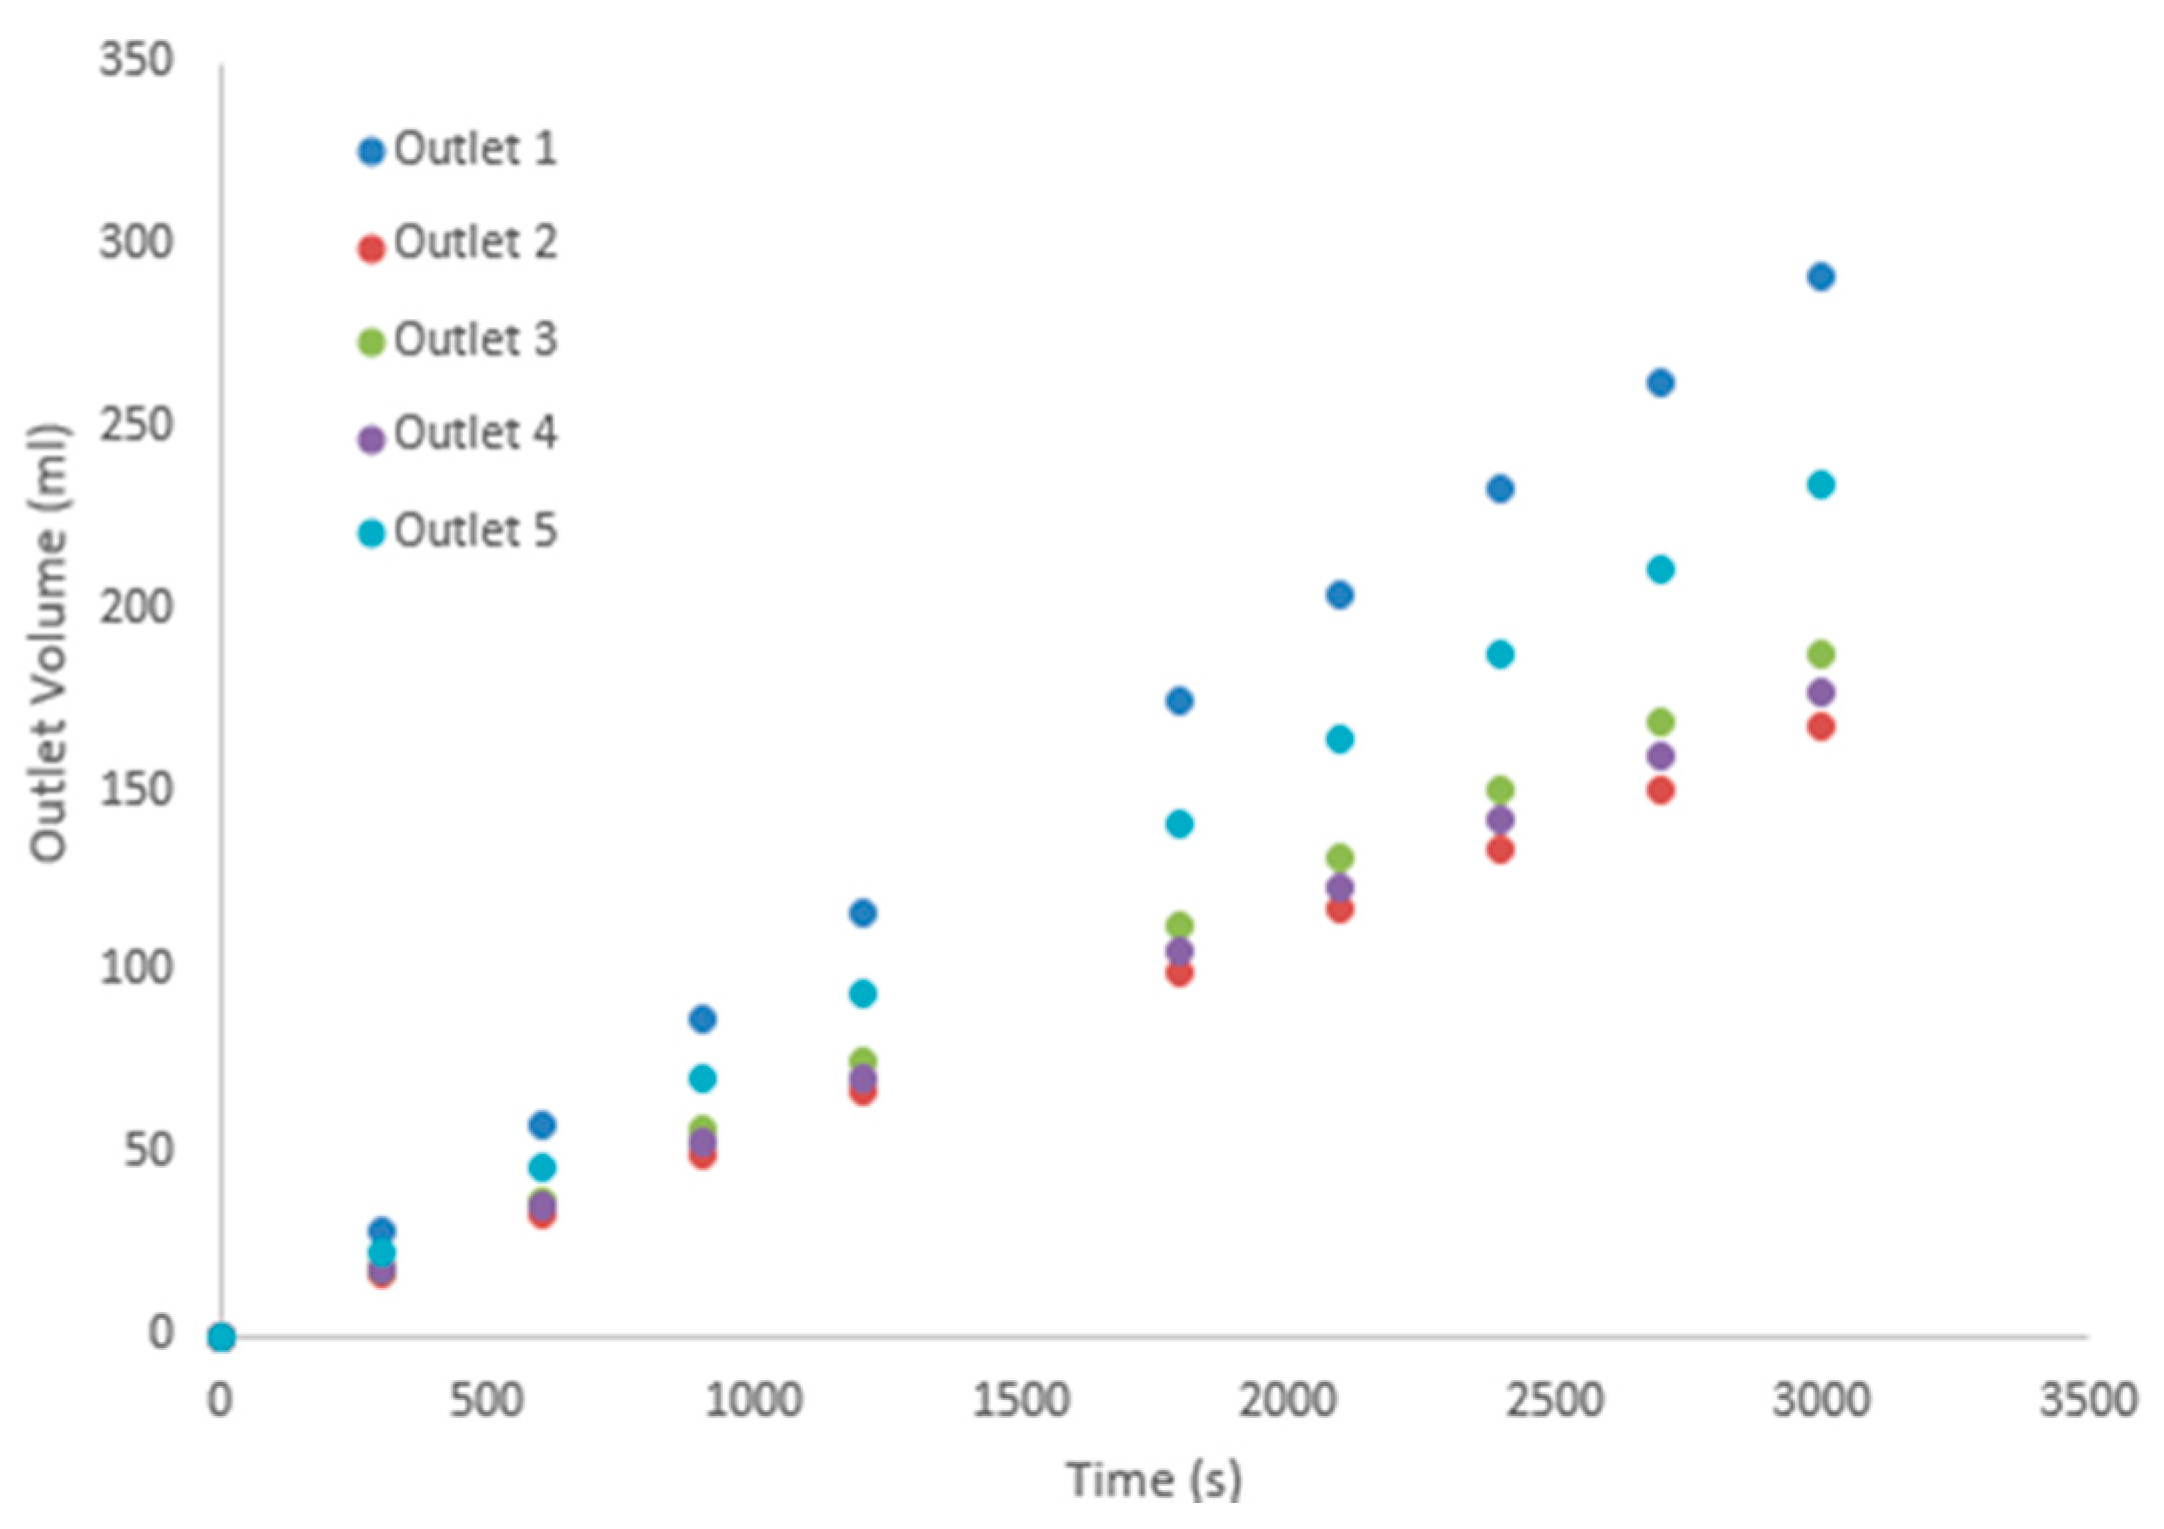
With the inclination being 65°, the fractal dimension is set as 2.2, 2.3, and 2.4 and the other input parameters remain constant. The simulation results from the LBM model are presented in Figure 10, Figure 11 and Figure 12, corresponding to the fractal dimension of 2.2, 2.3, and 2.4, respectively. In Figure 12, Outlet 1 has the largest volume at the same time, meaning that the flow rate of Outlet 1 is the maximum. Additionally, the flow rate of Outlet 5 is smaller than that of Outlet 1, but larger than those of the other outlets. The flow rates of Outlet 2, 3, and 4 are similar. According to Figure 13, the flow rate of Outlet 1 is also the maximum, but Outlet 5 has a smaller flow rate. In addition, Outlet 3 and 4 have similar flow rates while the flow rate of Outlet 2 is the minimum. Figure 14 shows that Outlet 1 has the largest flow rate and Outlet 2 has the second largest flow rate. The flow rates of Outlet 3, 4, and 5 are almost the same and a half of the flow rate of Outlet 1. Based on Figure 12, Figure 13 and Figure 14, the same phenomenon is exhibited in that Outlet 1 has the largest flow rate and Outlet 5 has the second largest flow rate, which can be identified from flow rates of other outlets easily. However, there are small differences in the distributions of flow rates for Outlet 2, 3, and 4. With the increase of the fractal dimension, the differences of flow rates between Outlet 1 and 5 become smaller and the flow rates of Outlet 3 are larger than those of Outlet 2 and 4. It proves that the changes of the fractal dimension lead to the changes of roughness on fracture surfaces, resulting in different flow rates of the outlets.
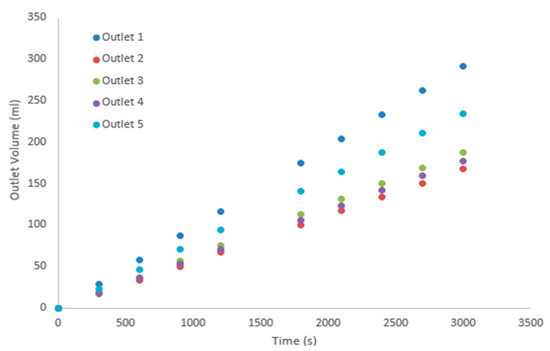
Figure 12.
The outlet volume of the fractal dimension 2.2 from LBM simulation.
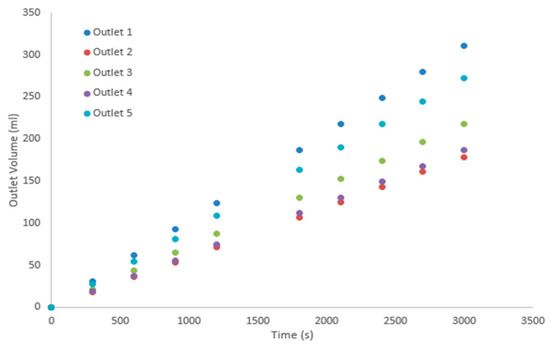
Figure 13.
The outlet volume of the fractal dimension 2.3 from LBM simulation.
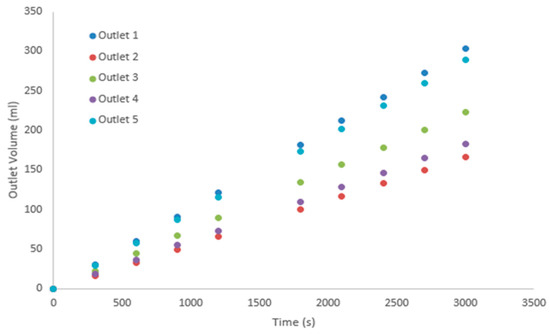
Figure 14.
The outlet volume of the fractal dimension 2.4 from LBM simulation.
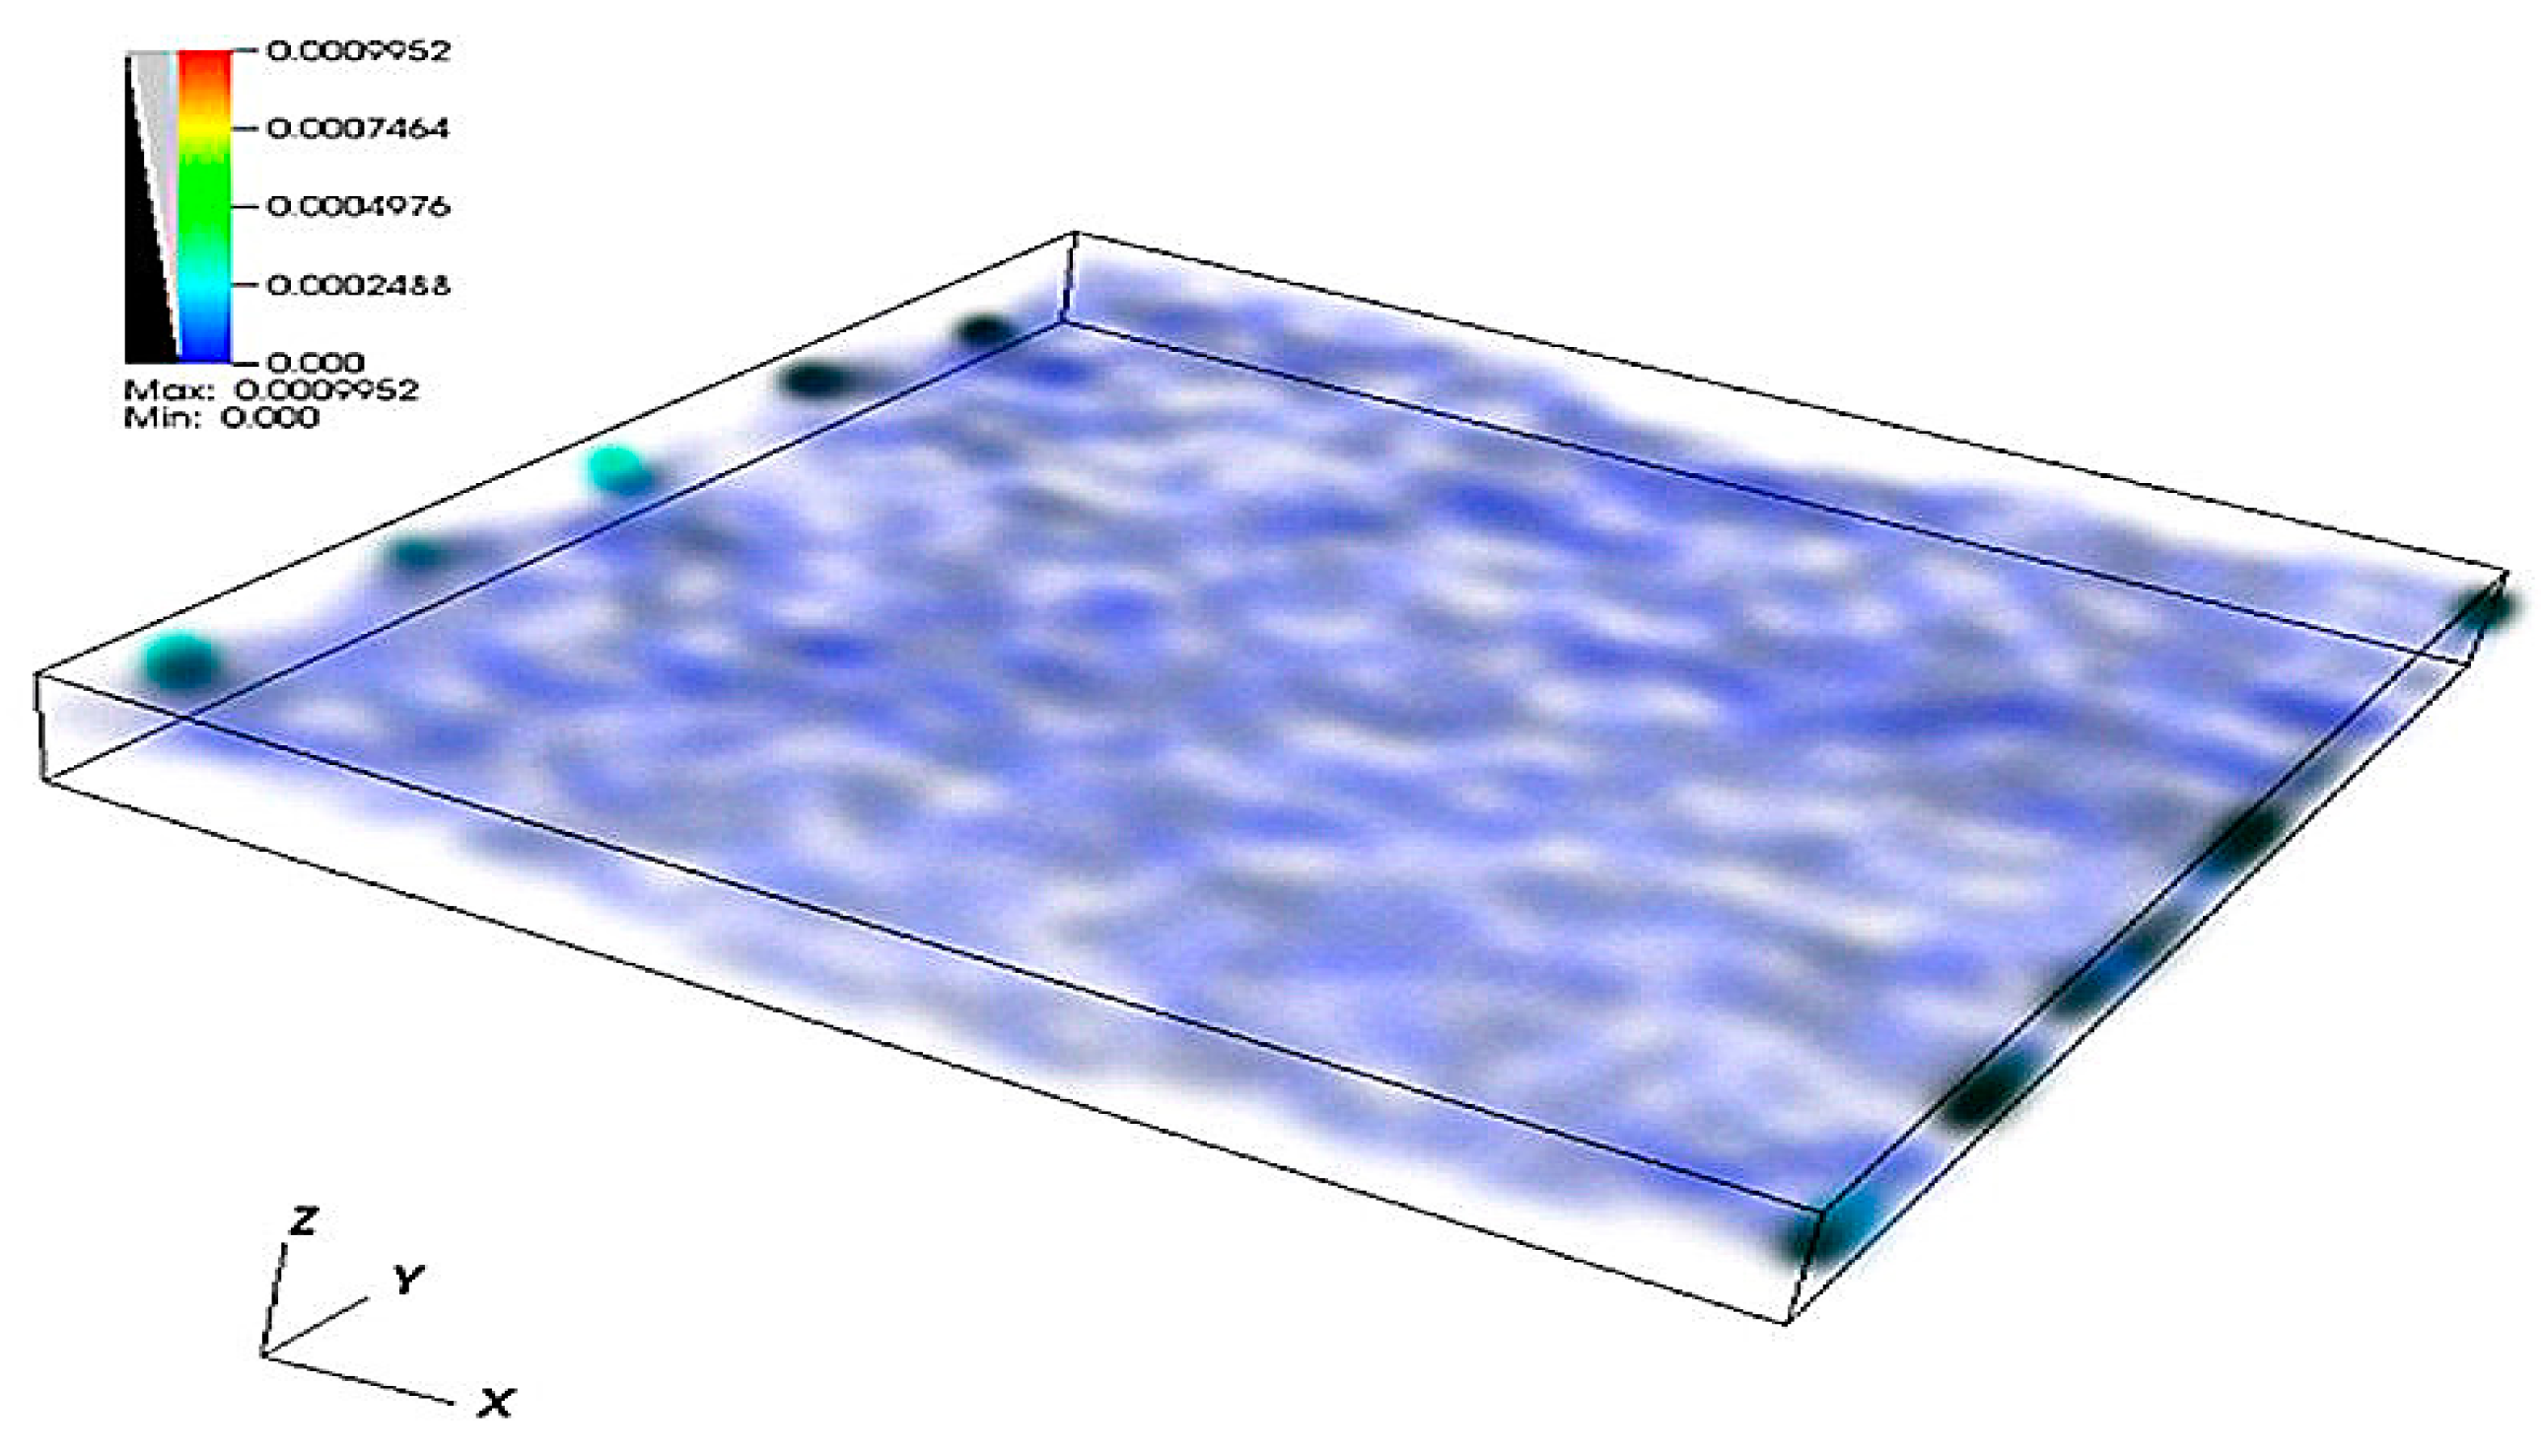
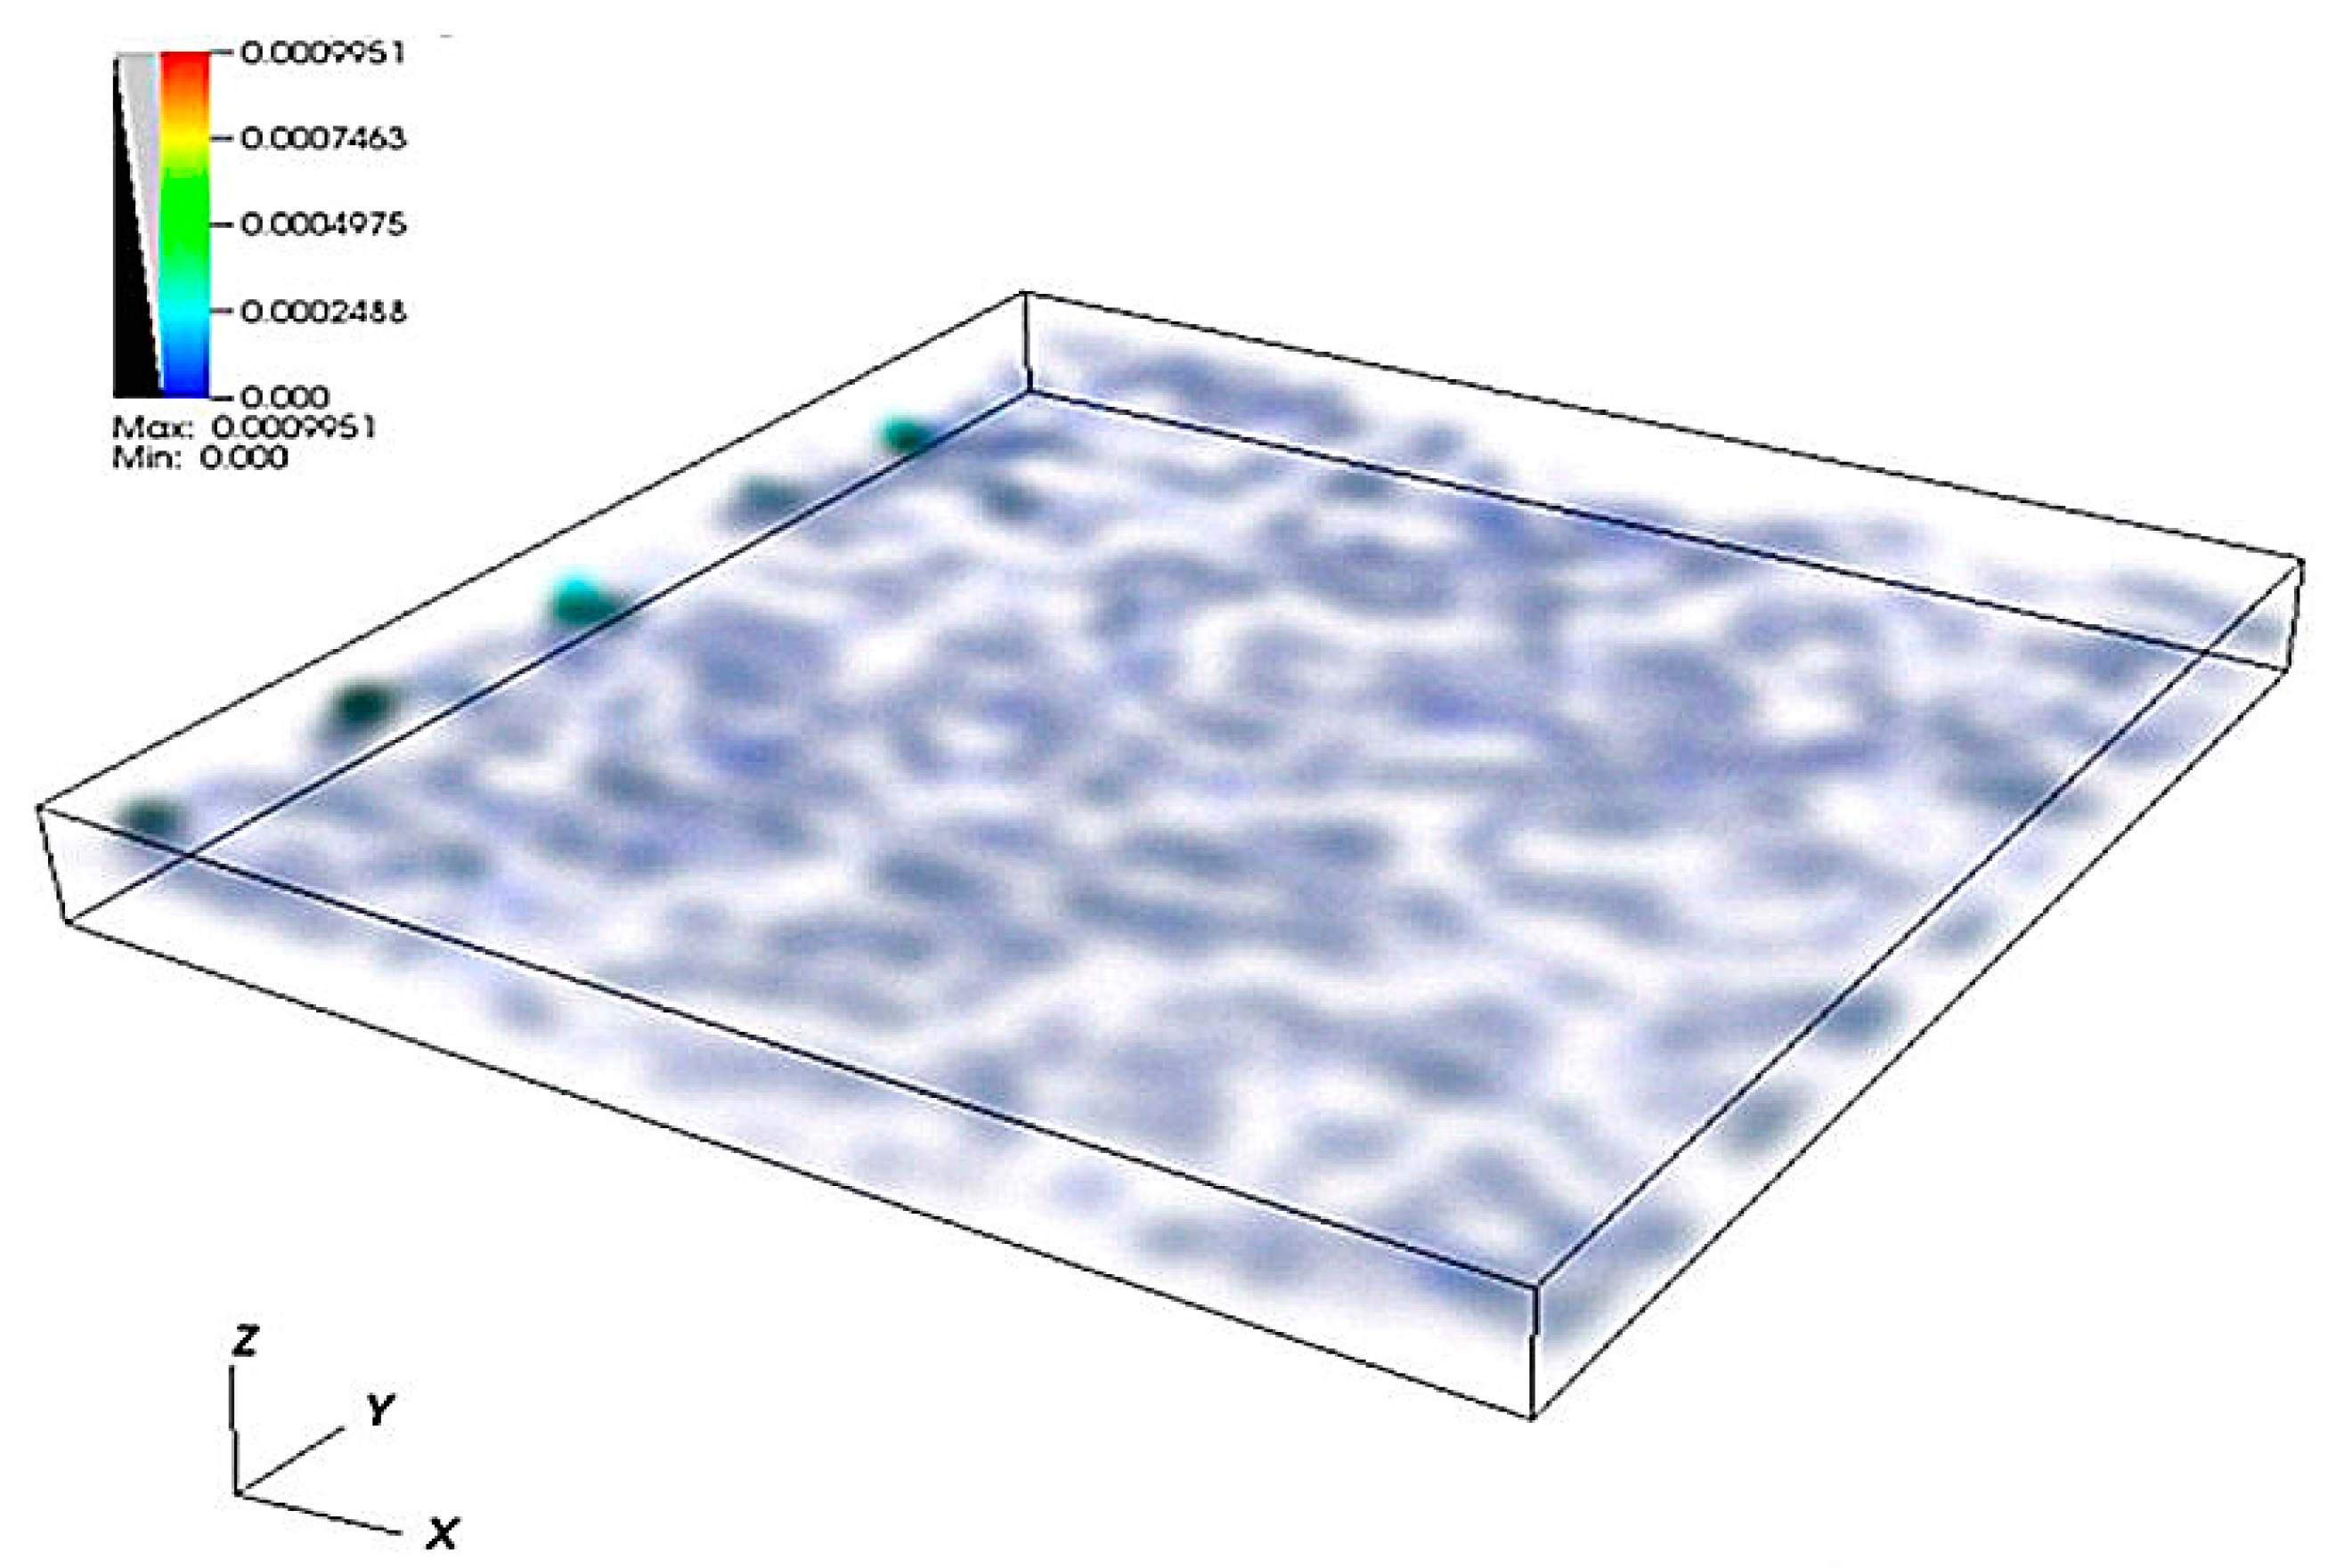
As is shown in Figure 15, Figure 16 and Figure 17, it is obvious that preferential flow paths exist on the fracture rough surfaces based on the velocity distribution, where a deeper color means a higher velocity. The areas on the discharging surface corresponding to Outlet 1 and 5 have more concentrated velocity distributions, which explains the flow rates of Outlet 1 and 5 are larger than those of other flow rates. In addition, the areas on the discharging surface corresponding to Outlet 2, 3 and 4 have three concentrated velocity distributions with higher values of velocity. However, three velocity distributions: one belongs to Outlet 2, one belongs to Outlet 2 and 3, and one belongs to Outlet 3 and 4. Though there are three concentrated velocity distributions with higher values in the areas of Outlet 2, 3, and 4, there are still blank areas meaning much lower values of velocity, which occupy large proportions of areas of Outlet 2, 3, and 4. The velocity distributions in the areas of Outlet 2, 3, and 4 lead to the smaller flow rates of Outlet 2, 3, and 4 compared with those of Outlet 1 and 5. The analysis above gives a detailed explanation of different flow rates corresponding to different outlets.
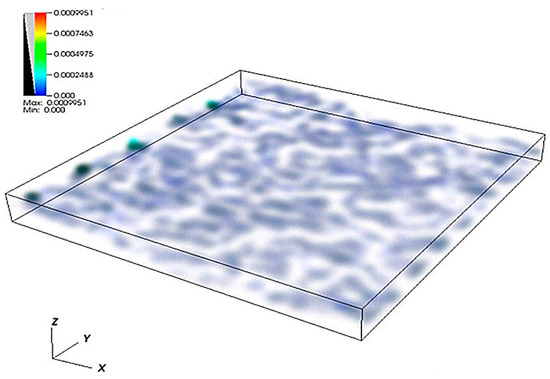
Figure 15.
The velocity distribution of the fractal dimension 2.2 from LBM simulation.
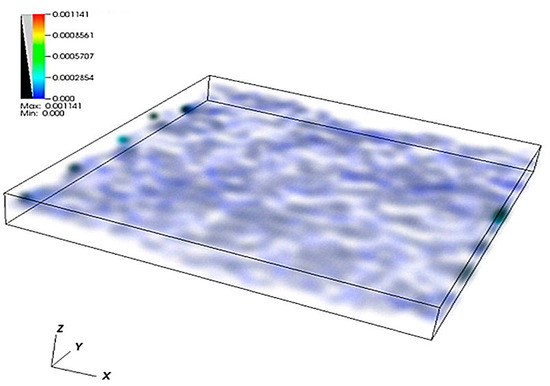
Figure 16.
The velocity distribution of the fractal dimension 2.3 from LBM simulation.
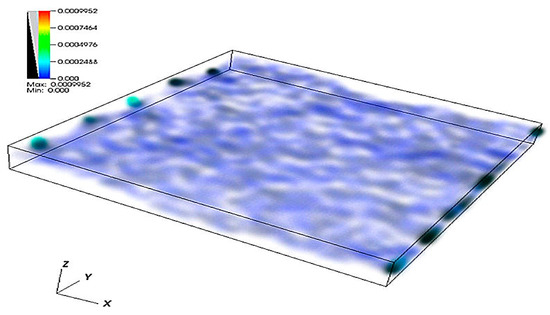
Figure 17.
The velocity distribution of the fractal dimension 2.4 from LBM simulation.
4.4. Influence of Mismatch Wavelength
The inclination is set as 65° and the fractal dimension is equal to 2.2. The mismatch wavelengths are 20 mm, 25 mm, and 30 mm, respectively. As is shown in Figure 18, Outlet 1 exhibits the largest volume at the same time, which means that Outlet 1 has the largest flow rate among the five outlets. Additionally, the flow rate of Outlet 5 is a little smaller than that of Outlet 1, but larger than those of the other outlets. The flow rates of Outlet 2 and 3 are similar and the flow rate of Outlet 4 is the minimum. According to Figure 19, the flow rate of Outlet 1 is also the maximum, but Outlet 5 has a smaller flow rate. In addition, Outlet 3 and 4 have similar flow rates, while the flow rate of Outlet 2 is larger than those of Outlet 3 and 4 and close to the flow rate of Outlet 5. Figure 20 illustrates that Outlet 1 has the largest flow rate and Outlet 2 has the second largest flow rate. The flow rates of Outlet 3, 4, and 5 are almost the same. Unlike Figure 18 and Figure 19, the flow rate of Outlet 2 is the minimum, which is smaller than those of Outlet 3 and 4. Based on Figure 18, Figure 19 and Figure 20, it is clear that Outlet 1 has the largest flow rate and Outlet 5 has the second largest flow rate, which can be identified from flow rates of other outlets easily. With the increase of the fractal dimension, the flow rate of Outlet 2 decreases from third to the minimum. It can be concluded that the changes of mismatch wavelength result in different flow rates of the outlets.
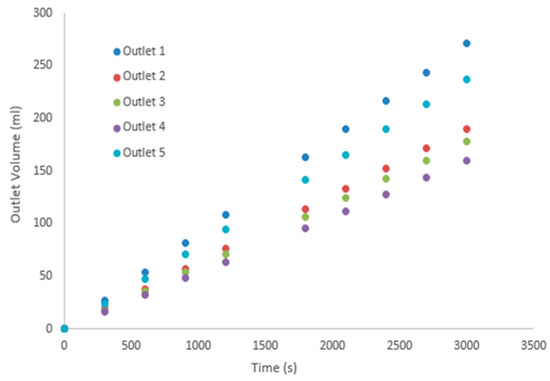
Figure 18.
The outlet volume of the mismatch wavelength 20 mm from LBM simulation.
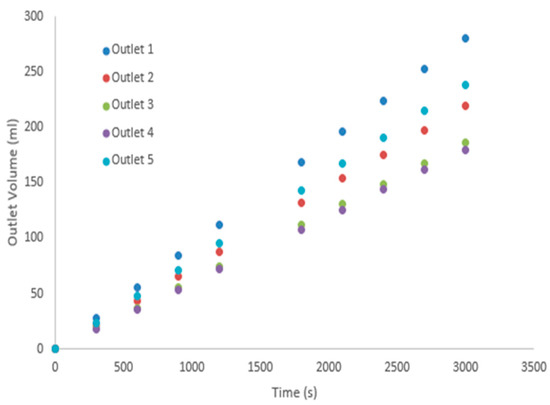
Figure 19.
The outlet volume of the mismatch wavelength 25 mm from LBM simulation.
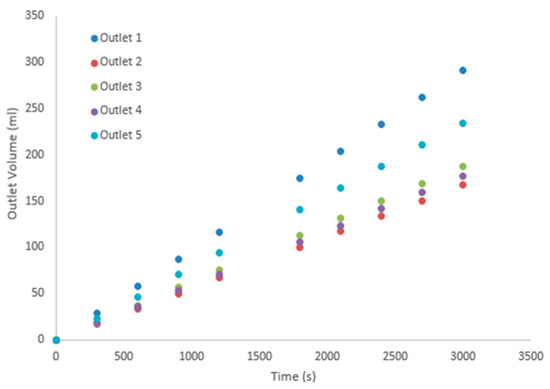
Figure 20.
The outlet volume of the mismatch wavelength 30 mm from LBM simulation.
In Figure 21, Figure 22 and Figure 23, it can also be seen that there are preferential flow paths on the fracture rough surfaces according to the velocity distribution. In these cases, a deeper color means a higher velocity. The areas on the discharging surface corresponding to Outlet 1 and 5 have concentrated velocity distributions covering the whole area of Outlet 1 and 5. This explains why the flow rates of Outlet 1 and 5 are larger than those of other flow rates. Three concentrated velocity distributions with higher values of velocity exist in the areas of the discharging surface corresponding to Outlet 2, 3, and 4. Moreover, three velocity concentrations are distributed as: one locates in Outlet 2, one is shared by Outlet 2 and 3, and one is shared by Outlet 3 and 4. Though three concentrated velocity distributions exist with higher values, there are still large proportions of blank areas, meaning much lower values of velocity in the areas of Outlet 2, 3, and 4. The velocity distributions in the areas of Outlet 2, 3, and 4 result in the smaller flow rates of Outlet 2, 3, and 4 compared with those of Outlet 1 and 5.
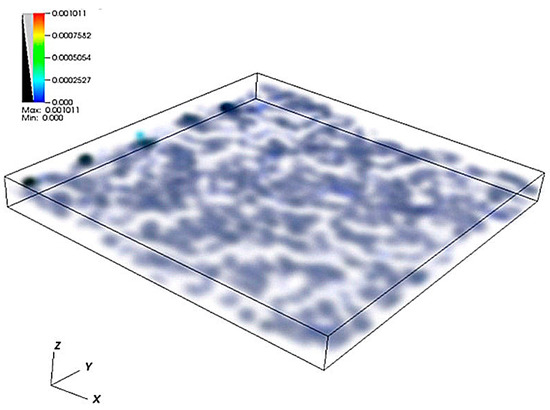
Figure 21.
The velocity distribution of the mismatch wavelength 20 mm from LBM simulation.
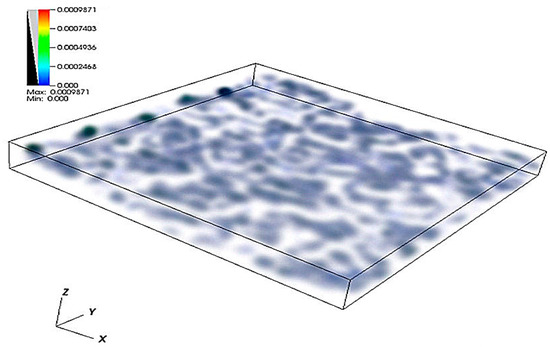
Figure 22.
The velocity distribution of the mismatch wavelength 25 mm from LBM simulation.
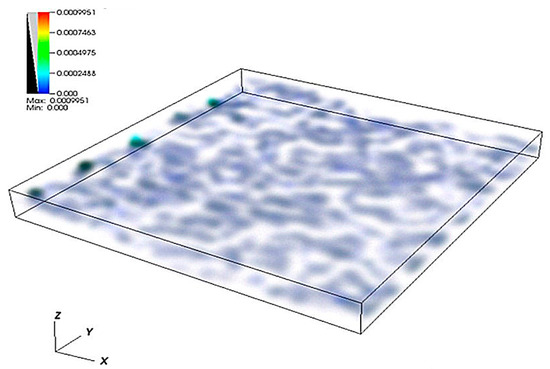
Figure 23.
The velocity distribution of the mismatch wavelength 30 mm from LBM simulation.
5. Conclusions
A novel experimental method with the application of 3D printing technology was proposed to study the water flow through a self-affine rough fracture. Compared with experimental methods that apply tensile forces for the generation of fractures, 3D printing technology can reduce the uncertainty of fracture surfaces and reflect fracture surfaces accurately. The LBM was adopted and a D3Q15 LBM code was programmed to simulate water flow in the single fracture. The agreement between the experimental data and the LBM simulation results implies that the LBM can be used to simulate flows through a self-affine rough fracture with reasonable accuracy. Additionally, the results from LBM simulations provide a detailed analysis for the preferential flow paths through the fracture rough surfaces. In the above cases, the flow rate of Outlet 1 is obviously larger than those of other outlets and Outlet 5 has the second largest flow rates. The flow rates of Outlet 2, 3, and 4 are variable in different cases, which reflects the effects of different fracture inclinations, fractal dimensions, and mismatch wavelengths. It should be noted that the influence of the fracture inclination (gravity force) on the flow paths cannot be ignored, though it is small in this study. For applications in reservoir systems (oil/gas, geothermal, shale gas), further research will focus on the scale and wettability effects of two-phase flow with different boundary conditions.
Author Contributions
Claudia Cherubini and Nicola Pastore conceived and designed the experiments. Jiawei Li performed the experiments, LBM simulations and results analysis. Sergio Andres Galindo Torres and Zi Li provided supports for LBM programming and simulations. Ling Li, Claudia Cherubini, Sergio Andres Galindo Torres and Zi Li contributed to the results and theories analysis.
Conflicts of Interest
The authors declare no conflict of interest.
Appendix A

Table A1.
Experimental data for Figure 8.
Table A1.
Experimental data for Figure 8.
| Time (s) | Outlet 1 (mL) | Outlet 2 (mL) | Outlet 3 (mL) | Outlet 4 (mL) | Outlet 5 (mL) |
|---|---|---|---|---|---|
| 0 | 0 | 0 | 0 | 0 | 0 |
| 60 | 0 | 0 | 0 | 0 | 0 |
| 120 | 6.956 | 3.478 | 0 | 0 | 3.478 |
| 180 | 13.912 | 6.956 | 3.478 | 3.478 | 10.434 |
| 240 | 20.868 | 13.912 | 6.956 | 6.956 | 17.39 |
| 300 | 27.824 | 20.868 | 13.912 | 13.912 | 24.346 |
| 360 | 34.78 | 27.824 | 20.868 | 20.868 | 31.302 |
| 420 | 41.736 | 31.302 | 27.824 | 24.346 | 34.78 |
| 480 | 48.692 | 31.302 | 27.824 | 27.824 | 41.736 |
| 540 | 59.126 | 34.78 | 31.302 | 31.302 | 48.692 |
| 600 | 66.082 | 38.258 | 34.78 | 34.78 | 55.648 |
| 660 | 69.56 | 38.258 | 34.78 | 34.78 | 62.604 |
| 720 | 76.516 | 45.214 | 41.736 | 34.78 | 66.082 |
| 780 | 86.95 | 48.692 | 45.214 | 34.78 | 66.082 |
| 840 | 97.384 | 52.17 | 48.692 | 34.78 | 66.082 |
| 900 | 104.34 | 55.648 | 55.648 | 34.78 | 69.56 |
| 960 | 111.296 | 59.126 | 59.126 | 38.258 | 76.516 |
| 1020 | 121.73 | 62.604 | 62.604 | 38.258 | 83.472 |
| 1080 | 128.686 | 66.082 | 66.082 | 41.736 | 86.95 |
| 1140 | 132.164 | 69.56 | 69.56 | 45.214 | 93.906 |
| 1200 | 139.12 | 69.56 | 69.56 | 48.692 | 100.862 |
| 1260 | 146.076 | 73.038 | 73.038 | 55.648 | 100.862 |
| 1320 | 153.032 | 79.994 | 79.994 | 59.126 | 104.34 |
| 1380 | 163.466 | 86.95 | 86.95 | 62.604 | 111.296 |
| 1440 | 170.422 | 86.95 | 86.95 | 62.604 | 118.252 |
| 1500 | 173.9 | 93.906 | 93.906 | 62.604 | 125.208 |
| 1560 | 184.334 | 97.384 | 97.384 | 66.082 | 132.164 |
| 1620 | 194.768 | 97.384 | 97.384 | 66.082 | 135.642 |
| 1680 | 201.724 | 100.862 | 100.862 | 69.56 | 139.12 |
| 1740 | 208.68 | 104.34 | 104.34 | 69.56 | 142.598 |
| 1800 | 215.636 | 104.34 | 104.34 | 69.56 | 146.076 |
| 1860 | 222.592 | 107.818 | 107.818 | 69.56 | 153.032 |
| 1920 | 233.026 | 111.296 | 111.296 | 73.038 | 159.988 |
| 1980 | 239.982 | 118.252 | 118.252 | 79.994 | 166.944 |
| 2040 | 246.938 | 121.73 | 121.73 | 83.472 | 170.422 |
| 2100 | 253.894 | 128.686 | 128.686 | 86.95 | 173.9 |
| 2160 | 260.85 | 132.164 | 132.164 | 93.906 | 177.378 |
| 2220 | 271.284 | 132.164 | 132.164 | 97.384 | 180.856 |
| 2280 | 278.24 | 135.642 | 135.642 | 97.384 | 187.812 |
| 2340 | 285.196 | 139.12 | 139.12 | 100.862 | 194.768 |
| 2400 | 292.152 | 139.12 | 139.12 | 100.862 | 198.246 |
| 2460 | 302.586 | 142.598 | 142.598 | 104.34 | 205.202 |
| 2520 | 309.542 | 146.076 | 146.076 | 104.34 | 208.68 |
| 2580 | 316.498 | 149.554 | 149.554 | 104.34 | 212.158 |
| 2640 | 323.454 | 153.032 | 153.032 | 104.34 | 215.636 |
| 2700 | 330.41 | 156.51 | 156.51 | 107.818 | 222.592 |
| 2760 | 337.366 | 159.988 | 159.988 | 111.296 | 229.548 |
| 2820 | 347.8 | 163.466 | 163.466 | 111.296 | 233.026 |

Table A2.
Simulation data for Figure 8.
Table A2.
Simulation data for Figure 8.
| Time (s) | Outlet 1 (mL) | Outlet 2 (mL) | Outlet 3 (mL) | Outlet 4 (mL) | Outlet 5 (mL) |
|---|---|---|---|---|---|
| 0 | 0 | 0 | 0 | 0 | 0 |
| 300 | 29.184 | 16.728 | 18.723 | 17.679 | 23.382 |
| 600 | 58.368 | 33.456 | 37.446 | 35.358 | 46.764 |
| 900 | 87.552 | 50.184 | 56.169 | 53.037 | 70.146 |
| 1200 | 116.736 | 66.912 | 74.892 | 70.716 | 93.528 |
| 1800 | 175.104 | 100.368 | 112.338 | 106.074 | 140.292 |
| 2100 | 204.288 | 117.096 | 131.061 | 123.753 | 163.674 |
| 2400 | 233.472 | 133.824 | 149.784 | 141.432 | 187.056 |
| 2700 | 262.656 | 150.552 | 168.507 | 159.111 | 210.438 |
| 3000 | 291.84 | 167.28 | 187.23 | 176.79 | 233.82 |

Table A3.
Experimental data for Figure 9.
Table A3.
Experimental data for Figure 9.
| Time (s) | Outlet 1 (mL) | Outlet 2 (mL) | Outlet 3 (mL) | Outlet 4 (mL) | Outlet 5 (mL) |
|---|---|---|---|---|---|
| 0 | 0 | 0 | 0 | 0 | 0 |
| 60 | 6.956 | 0 | 3.478 | 0 | 0 |
| 120 | 13.912 | 3.478 | 10.434 | 3.478 | 3.478 |
| 180 | 20.868 | 10.434 | 17.39 | 10.434 | 6.956 |
| 240 | 27.824 | 17.39 | 24.346 | 17.39 | 13.912 |
| 300 | 34.78 | 24.346 | 31.302 | 24.346 | 20.868 |
| 360 | 41.736 | 27.824 | 31.302 | 27.824 | 27.824 |
| 420 | 48.692 | 27.824 | 34.78 | 31.302 | 31.302 |
| 480 | 55.648 | 27.824 | 41.736 | 34.78 | 34.78 |
| 540 | 62.604 | 27.824 | 52.17 | 38.258 | 38.258 |
| 600 | 69.56 | 27.824 | 59.126 | 38.258 | 38.258 |
| 660 | 73.038 | 31.302 | 62.604 | 38.258 | 41.736 |
| 720 | 79.994 | 34.78 | 69.56 | 38.258 | 48.692 |
| 780 | 90.428 | 38.258 | 73.038 | 38.258 | 55.648 |
| 840 | 97.384 | 45.214 | 79.994 | 41.736 | 59.126 |
| 900 | 107.818 | 52.17 | 86.95 | 45.214 | 62.604 |
| 960 | 114.774 | 59.126 | 93.906 | 52.17 | 66.082 |
| 1020 | 121.73 | 62.604 | 97.384 | 55.648 | 66.082 |
| 1080 | 128.686 | 66.082 | 100.862 | 59.126 | 69.56 |
| 1140 | 135.642 | 66.082 | 100.862 | 62.604 | 73.038 |
| 1200 | 142.598 | 69.56 | 104.34 | 66.082 | 79.994 |
| 1260 | 146.076 | 69.56 | 104.34 | 66.082 | 83.472 |
| 1320 | 153.032 | 73.038 | 111.296 | 66.082 | 90.428 |
| 1380 | 159.988 | 76.516 | 118.252 | 66.082 | 93.906 |
| 1440 | 166.944 | 83.472 | 125.208 | 69.56 | 97.384 |
| 1500 | 173.9 | 90.428 | 132.164 | 69.56 | 104.34 |
| 1560 | 180.856 | 97.384 | 139.12 | 73.038 | 104.34 |
| 1620 | 187.812 | 104.34 | 142.598 | 76.516 | 104.34 |
| 1680 | 194.768 | 107.818 | 142.598 | 79.994 | 107.818 |
| 1740 | 201.724 | 107.818 | 146.076 | 83.472 | 114.774 |
| 1800 | 208.68 | 111.296 | 153.032 | 83.472 | 121.73 |
| 1860 | 215.636 | 118.252 | 156.51 | 86.95 | 128.686 |
| 1920 | 222.592 | 121.73 | 159.988 | 93.906 | 132.164 |
| 1980 | 229.548 | 125.208 | 166.944 | 97.384 | 139.12 |
| 2040 | 236.504 | 132.164 | 170.422 | 97.384 | 139.12 |
| 2100 | 243.46 | 135.642 | 173.9 | 100.862 | 146.076 |
| 2160 | 250.416 | 139.12 | 177.378 | 104.34 | 149.554 |
| 2220 | 257.372 | 139.12 | 180.856 | 104.34 | 153.032 |
| 2280 | 267.806 | 142.598 | 184.334 | 107.818 | 159.988 |
| 2340 | 274.762 | 146.076 | 187.812 | 107.818 | 163.466 |
| 2400 | 281.718 | 149.554 | 194.768 | 107.818 | 166.944 |
| 2460 | 288.674 | 156.51 | 201.724 | 111.296 | 173.9 |
| 2520 | 295.63 | 163.466 | 205.202 | 114.774 | 173.9 |
| 2580 | 302.586 | 166.944 | 205.202 | 114.774 | 177.378 |
| 2640 | 309.542 | 173.9 | 212.158 | 118.252 | 180.856 |
| 2700 | 316.498 | 177.378 | 215.636 | 125.208 | 187.812 |
| 2760 | 323.454 | 177.378 | 215.636 | 128.686 | 194.768 |
| 2820 | 330.41 | 180.856 | 222.592 | 132.164 | 198.246 |
| 2880 | 340.844 | 184.334 | 226.07 | 132.164 | 205.202 |

Table A4.
Simulation data for Figure 9.
Table A4.
Simulation data for Figure 9.
| Time (s) | Outlet 1 (mL) | Outlet 2 (mL) | Outlet 3 (mL) | Outlet 4 (mL) | Outlet 5 (mL) |
|---|---|---|---|---|---|
| 0 | 0 | 0 | 0 | 0 | 0 |
| 300 | 29.844 | 17.109 | 20.244 | 17.298 | 24.048 |
| 600 | 59.688 | 34.218 | 40.488 | 34.596 | 48.096 |
| 900 | 89.532 | 51.327 | 60.732 | 51.894 | 72.144 |
| 1200 | 119.376 | 68.436 | 80.976 | 69.192 | 96.192 |
| 1800 | 179.064 | 102.654 | 121.464 | 103.788 | 144.288 |
| 2100 | 208.908 | 119.763 | 141.708 | 121.086 | 168.336 |
| 2400 | 238.752 | 136.872 | 161.952 | 138.384 | 192.384 |
| 2700 | 268.596 | 153.981 | 182.196 | 155.682 | 216.432 |
| 3000 | 298.44 | 171.09 | 202.44 | 172.98 | 240.48 |
References
- Berkowitz, B. Characterizing flow and transport in fractured geological media: A review. Adv. Water Resour. 2002, 25, 861–884. [Google Scholar] [CrossRef]
- Curtis, J.B. Fractured shale-gas systems. AAPG Bull. 2002, 86, 1921–1938. [Google Scholar]
- Matter, J.M.; Kelemen, P.B. Permanent storage of carbon dioxide in geological reservoirs by mineral carbonation. Nat. Geosci. 2009, 2, 837–841. [Google Scholar] [CrossRef]
- Sun, Z.; Zhang, X.; Xu, Y.; Yao, J.; Wang, H.; Lv, S.; Sun, Z.; Huang, Y.; Cai, M.; Huang, X. Numerical simulation of the heat extraction in EGS with thermal hydraulic-mechanical coupling method based on discrete fractures model. Energy 2017, 120, 20–33. [Google Scholar] [CrossRef]
- Gangi, A.F. Variation of whole and fractured porous rock permeability with confining pressure. Int. J. Rock Mech. Min. Sci. Geomech. Abstr. 1978, 15, 249–257. [Google Scholar] [CrossRef]
- Kranz, R.L.; Frankel, A.D.; Engelder, T. The permeability of whole and jointed Barre Granite. Int. J. Rock Mech. Min. Sci. Geomech. Abstr. 1979, 16, 225–234. [Google Scholar] [CrossRef]
- Witherspoon, P.A.; Wang, J.S.Y.; Iwai, K.; Gale, J.E. Validity of Cubic Law for fluid flow in a deformable rock fracture. Water Resour. Res. 1980, 16, 1016–1024. [Google Scholar] [CrossRef]
- Lanaro, F. A random field model for surface roughness and aperture of rock fractures. Int. J. Rock Mech. Min. Sci. 2000, 37, 1195–1210. [Google Scholar] [CrossRef]
- Gouze, P.; Noiriel, C.; Bruderer, C.; Loggia, D.; Leprovost, R. X-ray tomography characterization of fracture surfaces during dissolution. Geophys. Res. Lett. 2003, 30, 1267. [Google Scholar] [CrossRef]
- Muralidharan, V.; Chakravarthy, D.; Putra, E.; Schechter, D.S. Investigating Fracture Aperture Distributions under Various Stress Conditions Ssing X-Ray CT Scanner; PETSOC-2004-230; Petroleum Society of Canada: Calgary, AB, Canada, 2004. [Google Scholar]
- Tsang, Y.W.; Witherspoon, P.A. The dependence of fracture mechanical and fluid flow properties on fracture roughness and sample size. J. Geophys. Res. 1983, 88, 2359–2366. [Google Scholar] [CrossRef]
- Hakami, E.; Larsson, E. Aperture measurements and flow experiments on a single natural fracture. Int. J. Rock Mech. Min. Sci. Geomech. Abstr. 1996, 33, 395–404. [Google Scholar] [CrossRef]
- Qian, J.; Zhan, H.; Zhao, W.; Sun, F. Experimental study of turbulent unconfined groundwater flow in a single fracture. J. Hydrol. 2005, 311, 134–142. [Google Scholar] [CrossRef]
- Qian, J.; Chen, Z.; Zhan, H.; Guan, H. Experimental study of the effect of roughness and Reynolds number on fluid flow in rough-walled single fractures: A check of local cubic law. Hydrol. Process. 2011, 25, 614–622. [Google Scholar] [CrossRef]
- Develi, K.; Babadagli, T. Experimental and visual analysis of single-phase flow through rough fracture replicas. Int. J. Rock Mech. Min. Sci. 2015, 73, 139–155. [Google Scholar] [CrossRef]
- Brown, S.R. Fluid flow through rock joints the effect of surface roughness. J. Geophys. Res. 1987, 92, 1337–1347. [Google Scholar] [CrossRef]
- Zimmerman, R.W.; Kumar, S.; Bodvarsson, G.S. Lubrication theory analysis of the permeability of rough-walled fractures. Int. J. Rock Mech. Min. Sci. Geomech. Abstr. 1991, 28, 325–331. [Google Scholar] [CrossRef]
- Mourzenko, V.; Thovert, J.F.; Adler, P. Permeability of a single fracture: Validity of the Reynolds equation. J. Phys. II Fr. 1995, 5, 465–482. [Google Scholar] [CrossRef]
- Ge, S. A governing equation for fluid flow in rough fractures. Water Resour. Res. 1997, 33, 53–61. [Google Scholar] [CrossRef]
- Nicholl, M.J.; Rajaram, H.; Glass, R.J.; Detwiler, R.L. Saturated flow in a single fracture: Evaluation of the Reynolds equation in measured aperture fields. Water Resour. Res. 1999, 35, 3361–3373. [Google Scholar] [CrossRef]
- Koyama, T.; Neretnieks, I.; Jing, L. A numerical study on differences in using Navier-Stokes and Reynold equations for modeling the fluid flow and particle transport in single rock fractures with shear. Int. J. Rock Mech. Min. Sci. 2007, 45, 1082–1101. [Google Scholar] [CrossRef]
- Brown, S.R. Simple mathematical model of a rough fracture. J. Geophys. Res. Solid Earth 1995, 100, 5941–5952. [Google Scholar] [CrossRef]
- Zimmerman, R.W.; Bodvarsson, G.S. Hydraulic conductivity of rock fractures. Transp. Porous Media 1996, 23, 1–30. [Google Scholar] [CrossRef]
- Brush, D.J.; Thomson, N.R. Fluid flow in synthetic rough-walled fractures: Navier-Stokes, Stokes, and local cubic law simulations. Water Resour. Res. 2003, 39, 1085. [Google Scholar] [CrossRef]
- Oron, A.P.; Berkowitz, B. Flow in rock fractures: The local cubic law assumption reexamined. Water Resour. Res. 1998, 34, 2811–2825. [Google Scholar] [CrossRef]
- Yeo, I.W.; Ge, S. Applicable range of the Reynolds equation for fluid flow in a rock Fracture. Geosci. J. 2005, 9, 347–352. [Google Scholar] [CrossRef]
- Wang, L.; Cardenas, M.B.; Slottke, D.T.; Ketcham, R.A.; Sharp, J.M., Jr. Modification of the Local Cubic Law of fracture flow for weak inertia, tortuosity, and roughness. Water Resour. Res. 2015, 51, 2064–2080. [Google Scholar] [CrossRef]
- d’Humieres, D.; Lallemand, P.; Frisch, U. Lattice gas models for 3D hydrodynamics. Europhys. Lett. 1986, 2, 291. [Google Scholar] [CrossRef]
- Frisch, U.; d’Humieres, D.; Hasslacher, B.; Lallemand, P.; Pomeau, Y.; Rivet, J.P. Lattice gas hydrodynamics in two and three dimensions. Complex Syst. 1987, 1, 649–707. [Google Scholar]
- Mcnamara, G.R.; Zanetti, G. Use of the Boltzmann Equation to simulate Lattice-Gas Automata. Phys. Rev. Lett. 1988, 61, 2332–2335. [Google Scholar] [CrossRef] [PubMed]
- Chen, S.Y.; Doolen, G.D. Lattice Boltzmann method for fluid flows. Annu. Rev. Fluid Mech. 1998, 30, 329–364. [Google Scholar] [CrossRef]
- Succi, S. The Lattice Boltzmann Equation for Fluid Dynamics and Beyond; Clarendon Press: Oxford, UK, 2001. [Google Scholar]
- Gutfraind, R.; Hansen, A. Study of fracture permeability using lattice gas automata. Transp. Porous Media 1995, 18, 131–149. [Google Scholar] [CrossRef]
- Brown, S.R.; Stockman, H.W.; Reeves, S.J. Applicability of the Reynolds equation for modeling fluid flow between rough surfaces. Geophys. Res. Lett. 1995, 22, 2537–2540. [Google Scholar] [CrossRef]
- Kim, J.; Gao, X.; Srivatsan, T.S. Modeling of crack growth in ductile solids: A three-dimensional analysis. International J. Solids Struct. 2003, 40, 7357–7374. [Google Scholar] [CrossRef]
- Eker, E.; Akin, S. Lattice Boltzmann simulation of fluid flow in synthetic fractures. Transp. Porous Media 2006, 65, 363–384. [Google Scholar] [CrossRef]
- Dou, Z.; Zhou, Z.; Sleep, B.E. Influence of wettability on interfacial area during immiscible liquid invasion into a 3D self-affine rough fracture: Lattice Boltzmann simulations. Adv. Water Resour. 2013, 61, 1–11. [Google Scholar] [CrossRef]
- Wang, M.; Chen, Y.; Ma, G.; Zhou, J.; Zhou, C. Influence of surface roughness on nonlinear flow behaviors in 3D self-affine rough fractures: Lattice Boltzmann simulations. Adv. Water Resour. 2016, 96, 373–388. [Google Scholar] [CrossRef]
- Briggs, S.; Karney, B.W.; Sleep, B.E. Numerical modeling of the effects of roughness on flow and eddy formation in fractures. J. Rock Mech. Geotech. Eng. 2017, 9, 105–115. [Google Scholar] [CrossRef]
- Mandelbrot, B.B. The Fractal Geometry of Nature; Freeman: San Francisco, CA, USA, 1982. [Google Scholar]
- Mandelbrot, B.B. Self-affine fractals and fractal dimension. Phys. Scr. 1985, 32, 257–260. [Google Scholar] [CrossRef]
- Cai, J.C.; Yu, B.M.; Zou, M.Q.; Mei, M.F. Fractal analysis of surface roughness of particles in porous media. Chin. Phys. Lett. 2010, 27, 024705. [Google Scholar]
- Wang, W.D.; Su, Y.L.; Zhang, X.; Sheng, G.L.; Ren, L. Analysis of the complex fracture flow in multiple fractured horizontal wells with the fractal tree-like network models. Fractals 2015, 23, 1550014. [Google Scholar] [CrossRef]
- Zhao, Y.S.; Feng, Z.C.; Lv, Z.X.; Zhao, D.; Liang, W.G. Percolation laws of a fractal fracture-pore double medium. Fractals 2016, 24, 1650053. [Google Scholar] [CrossRef]
- Harpreet, S.; Cai, J.C. Screening improved recovery methods in tight-oil formations by injecting and producing through fractures. Int. J. Heat Mass Transf. 2018, 116, 977–993. [Google Scholar]
- Cai, J.C.; Wei, W.; Hu, X.Y.; Liu, R.C.; Wang, J.J. Fractal characterization of dynamic fracture network extension in porous media. Fractals 2017, 25, 1750023. [Google Scholar] [CrossRef]
- Huang, S.L.; Oelfke, S.M.; Speke, R.C. Applicability of fractal characterization and modelling to rock joint profiles. Int. J. Rock Mech. Min. Sci. Geomech. Abstr. 1992, 29, 89–98. [Google Scholar] [CrossRef]
- Odling, N.E. Natural fracture profiles, fractal dimension and joint roughness coefficients. Rock Mech. Rock Eng. 1994, 27, 135–153. [Google Scholar] [CrossRef]
- Schmittbuhl, J.; Steyer, A.; Jouniaux, L.; Toussaint, R. Fracture morphology and viscous transport. Int. J. Rock Mech. Min. Sci. 2008, 45, 422–430. [Google Scholar] [CrossRef]
- Molz, F.; Liu, H.; Szulga, J. Fractional Brownian motion and fractional Gaussian noise in subsurface hydrology: A review, presentation of fundamental properties, and extensions. Water Resour. Res. 1997, 33, 2273–2286. [Google Scholar] [CrossRef]
- Babadagli, T.; Ren, X.; Develi, K. Effects of fractal surface roughness and lithology on single and multiphase flow in a single fracture: An experimental investigation. Int. J. Multiph. Flow 2015, 68, 40–58. [Google Scholar] [CrossRef]
- Power, W.L.; Tullis, T.E.; Brown, S.R.; Boitnott, G.N.; Scholz, C.H. Roughness of natural fault surfaces. Geophys. Res. Lett. 1987, 14, 29–32. [Google Scholar] [CrossRef]
- Ogilvie, S.R.; Isakov, E.; Glover, P.W.J. Fluid flow through rough fractures in rocks. II: A new matching model for rough rock fractures. Earth Planet. Sci. Lett. 2006, 241, 454–465. [Google Scholar] [CrossRef]
- Qian, Y.H.; d’Humieres, D.; Lallemand, P. Lattice BGK models for Navier-Stokes equation. Europhys. Lett. 1992, 17, 479. [Google Scholar] [CrossRef]
- Okabe, H.; Blunt, M.J. Prediction of permeability for porous media reconstructed using multiple-point statistics. Phys. Rev. E 2004, 70, 066135. [Google Scholar] [CrossRef] [PubMed]
- Shi, X.-Y.; Gao, H.; Lazouskaya, V.I.; Kang, Q.; Jin, Y.; Wang, L.P. Viscous flow and colloid transport near air-water interface in a microchannel. Comput. Math. Appl. 2010, 59, 2290–2304. [Google Scholar] [CrossRef]
- Li, Q.; Luo, K.H.; Kang, Q.J.; He, Y.L.; Chen, Q.; Liu, Q. Lattice Boltzmann methods for multiphase flow and phase-change heat transfer. Prog. Energy Combust. Sci. 2016, 52, 62–105. [Google Scholar] [CrossRef]
- Galindo-Torres, S.A.; Scheuermann, A.; Li, L. Numerical study on the permeability in a tensorial form for laminar flow in anisotropic porous media. Phys. Rev. E 2012, 86, 046306. [Google Scholar] [CrossRef] [PubMed]
- Galindo-Torres, S.A.; Scheuermann, A.; Li, L.; Pedroso, D.M.; Williams, D.J. A Lattice Boltzmann model for studying transient effects during imbibition–drainage cycles in unsaturated soils. Comput. Phys. Commun. 2013, 184, 1086–1093. [Google Scholar] [CrossRef]
- Mohamad, A.A. Lattice Boltzmann Method: Fundamentals and Engineering Applications with Computer Codes; Springer: London, UK, 2011. [Google Scholar]
- Rosis, A.; Ubertini, S.; Ubertini, F. A comparison between the interpolated bounce-back scheme and the immersed boundary method to treat solid boundary conditions for laminar flows in the lattice Boltzmann framework. J. Sci. Comput. 2014, 61, 477–489. [Google Scholar]
- Jahanshaloo, L.; Sidik, N.A.C.; Fazeli, A.; Pesaran, H.A.M. An overview of boundary implementation in lattice Boltzmann method for computational heat and mass transfer. Int. Commun. Heat Mass Transf. 2016, 78, 1–12. [Google Scholar] [CrossRef]
- Martys, N.S.; Chen, H. Simulation of multicomponent fluids in complex three dimensional geometries by the Lattice Boltzmann method. Phys. Rev. E 1996, 53, 743–750. [Google Scholar] [CrossRef]
- Buick, J.M.; Greated, C.A. Gravity in a lattice boltzmann model. Phys. Rev. E 2000, 61, 5307–5320. [Google Scholar] [CrossRef]
- El-Hajje, A.; Kolos, E.C.; Wang, J.K.; Maleksaeedi, S.; He, Z.; Wiria, F.E.; Choong, C.; Ruys, A.J. Physical and mechanical characterization of 3D-printed porous titanium for biomedical applications. J. Mater. Sci. Mater. Med. 2014, 25, 2471–2480. [Google Scholar] [CrossRef] [PubMed]
- Gross, B.C.; Erkal, J.L.; Lockwood, S.Y.; Chen, C.; Spence, D.M. Evaluation of 3D printing and its potential impact on biotechnology and the chemical sciences. Anal. Chem. 2014, 86, 3240–3253. [Google Scholar] [CrossRef] [PubMed]
- Hong, S.; Sycks, D.; Chan, H.; Lin, S.; Lopez, G.P.; Guilak, F.; Leong, K.W.; Zhao, X. 3D printing of highly stretchable and tough hydrogels into complex, cellularized structures. Adv. Mater. 2015, 27, 4035–4040. [Google Scholar] [CrossRef] [PubMed]
- Martin, J.J.; Fiore, B.E.; Erb, R.M. Designing bioinspired composite reinforcement architectures via 3D magnetic printing. Nat. Commun. 2015, 6, 8641. [Google Scholar] [CrossRef] [PubMed]
© 2018 by the authors. Licensee MDPI, Basel, Switzerland. This article is an open access article distributed under the terms and conditions of the Creative Commons Attribution (CC BY) license (http://creativecommons.org/licenses/by/4.0/).

