1. Introduction
With the growing shortage of energy, wind power generation has become the preferred alternative energy source. Whether wind turbine generators, which are the core devices of wind power generation technology, can be operated safely for a long period of time is directly related to benefits for power generation companies and local economic development. Fatigue life determines the length of the service life of a wind turbine under normal working conditions, and it is very important to predict the fatigue life accurately. References [
1,
2] present some new approaches based on stochastic processes, apply these methods to estimate the fatigue loads on wind turbines, and achieve significant results. In reference [
3], a method for estimating the fatigue life of components by combining the non-homogeneous Poisson stochastic process function with the theory of concomitant damage is put forward. It is applied to the estimation of the fatigue life of wind turbine blades. The results show that this method is reliable and effective, which provides a new path for the fatigue reliability design of wind turbine blades. Reference [
4] proposes a novel scheme for extending the lifetime of a wind energy conversion system (WECS) by integrating an online damage evaluation model into a control strategy for structural load reduction.
Although scholars have conducted extensive research on wind power life and proposed many ways to extend its operation, in the actual process, due to the complex structure of wind power equipment and the extremely harsh working conditions, a fault diagnosis involves the comprehensive application of many professional disciplines, such as modern dynamics, methods for recognizing the failure mechanisms of wind power generation equipment, fault diagnosis methods, signal acquisition, signal processing, pattern recognition, and network communication. Thus, it is very difficult to conduct fault diagnosis. There are many kinds of fault diagnosis methods for wind power generation equipment. These include the three major types of diagnostic methods: mechanical signal fault diagnosis, electrical signal fault diagnosis, and artificial intelligence fault diagnosis. These methods use measurement equipment to obtain the corresponding electrical or non-electrical quantity signals and then use advanced high-efficiency signal processing technology to analyze and process the signals, after which feature information is accurately extracted to reflect the nature of the fault and the degree of failure.
Mechanical Signal Method
Faults, such as generator bearing failures, shaft misalignments, unbalanced rotor masses, loose seats, and rotor eccentricities, can be diagnosed by monitoring generator vibration, temperature, and speed signals. This is currently the most mature and most widely discussed technology. This fault diagnosis method has been successfully applied to the health monitoring of and fault diagnosis in key components, such as gearboxes, bearings, and blades, in wind turbines.
In 2014, the study in reference [
5] proposed a noise reduction method for the characteristics of strong nonlinear noise in wind turbine vibration signals. They then constructed effective features based on the information after de-noising and modeled wind turbines using manifold learning algorithms allowing for early weak fault diagnosis. In 2016, the study in reference [
6] proposed that the signals of vibrations of wind turbines in the fault signal extraction process are weak. It was proposed that the vibration signal-to-noise ratio of the motor can be increased and then de-noised using the empirical wavelet transform, after which the fault feature can be extracted. To monitor wind turbine vibrations, in 2017, reference [
7] presented normal behaviour models to predict tower-top accelerations and drivetrain vibrations. In reference [
8], the implementation and performance analysis of a vibration-response-based Gaussian Mixture Model Random Coefficient (GMM-RC) model-based structural health monitoring (SHM) framework for structures with time-dependent dynamics under significant uncertainty (operational and environmental) have been presented. The experimental results demonstrate that the GMM-RC model-based framework has consistently good performance.
Electrical Signal Method
An electrical fault in a generator is usually identified by monitoring the stator coil temperature, stator voltage, stator and rotor current, generator output rate, rotor speed, and other parametric signals. Relative to the vibration signal, the fault-related signals contained in electrical signals (such as current signals) are often relatively weak, and they are usually overwhelmed by electrical signals inherent in the motor and random noise. Thus, the signal-to-noise ratio is relatively low, and it is difficult to compare extracted fault features. At present, common methods of electrical fault diagnosis include stator current detection, partial discharge monitoring, flux detection, and current harmonics.
In 2014, reference [
9] proposed a new online approach based on the instantaneous power spectrum of the rotor to detect doubly fed induction generator stator winding faults. A theoretical analysis showed that, compared with the common current and voltage spectrum analysis methods, the instantaneous power spectrum has an advantage insofar as external sensors and hardware devices are not needed. Moreover, the spectrum has immunity to interference. Once some slip tracking or calculation errors occur, the characteristic frequency will not change because the characteristic frequency is not affected by slip. In 2015, upon examining the problem that internal faults in doubly fed induction generators are not easily diagnosed and identified, reference [
10] proposed a method for fault diagnosis in and positioning of doubly fed wind generators based on electromagnetic and wavelet transforms from the perspective of electromagnetic changes. In 2016, the study in reference [
11] used a synchronous sampling method to extract fault features from current signals of varying conditions and then used correlation dimension analysis to quantitatively analyze the different faults of wind turbines. In 2017, aimed at the nonstationary and nonlinear characteristics of wind turbine vibration signals, reference [
12] proposed a novel fault diagnosis method based on integral extension load mean decomposition multiscale entropy and a least squares support vector machine. In reference [
13], the detection of electrical asymmetry in rotors in wind turbine WT doubly fed induction generators (DFIGs) has been investigated using a test rig under three different driving conditions, and then an effective extended Kalman filter (EKF)-based method was proposed to iteratively estimate the fault signature components (FSCs) and track their magnitude.
Artificial Intelligence method
The research method of this type of fault diagnosis method is to analyze one or more types of signals of wind turbines, construct a set of high-dimensional statistical features in the time domain, frequency domain, and time-frequency domain, and fuse the features with machine learning methods. The method then implements dimensionality reduction, classification and visualization analysis, and equipment fault diagnosis.
Reference [
14] proposed a fault detection method for the main bearing of wind turbines based on existing supervisory control and data acquisition data using an artificial neural network. In reference [
15], an artificial neural network and an empirical mode decomposition (EMD)-based condition-monitoring approach using the Simulink fatigue, aerodynamics, structures, and turbulence (FAST) software and the TurbSim software were presented. Reference [
16] proposed a wind turbine fault diagnosis method based on a diagonal spectrum and clustering binary tree support vector machines (SVMs). Reference [
17] proposed a radially uniform (RU) design to sample representative datasets from a large volume of wind turbine data to build accurate data-driven models. Five algorithms, namely neural networks, multivariate adaptive regression splines, support vector machines, k-nearest neighbors, and linear regression, were applied to model the wind turbine power output, drivetrain vibratory acceleration, and tower vibratory acceleration based on training and sampled datasets. Reference [
18] presented an approach for fault diagnosis in wind turbines based on a multi-class fuzzy support vector machine classifier. Reference [
19] investigated a data-driven fault detection and isolation design based on the fusion of several classifiers for a wind turbine benchmark second challenge. The proposed method was robust against different operational conditions and measurement errors. A novel wind turbine weak feature extraction method based on Cross Genetic Algorithm (CGA) optimal Mexican-Hat Wavelet (MHW) is proposed in [
20]. Experimental results showed that the proposed method can not only suppress interruptions due to strong background noise but also can extract weak wind turbine features effectively.
Although there are already some methods available for fault diagnosis in wind turbines, there are still several problems:
(1) Fault “big data” must be handled effectively. Due to the large scale of the wind turbines being monitored, each wind turbine needs more measuring points, and the sampling frequency of each measuring point is high. In addition, data collection from the start of service to the end of life takes a long time, and thus the monitoring system acquires a large amount of data; consequently, health monitoring has entered the era of “big data”. Finding information from these data and efficiently and accurately identifying the health status of wind turbines represent new problems we are currently facing.
(2) There are difficulties in the extraction and selection of features. Large-sized wind turbines are electromechanical devices that operate under variable working conditions. Their operating laws are strongly nonlinear and nonstationary. Because of their complex operating conditions, fault feature information can easily be overwhelmed by environmental and operational noise. Wind turbines are generally installed on the sea or grasslands, where there are high winds. The surrounding environment is complex, and the operation of a wind turbine is typically nonlinear and nonstationary. To solve the problem of nonlinear fault diagnosis in equipment, there is an urgent need to further study the extraction of primitive features that can sufficiently predict the performance of equipment in a short period of time. The optimization of features is the focus of the current research, the goal of which is to reduce the feature dimension of the extraction, reduce the amount of necessary calculations, and improve the accuracy of fault diagnosis. However, the commonly used methods have their limitations. They still have to rely on experience to determine the parameters; therefore, the training speed is slow and the calculation cost is high.
(3) There is a lack of high-precision fault diagnosis methods. The existing fault diagnosis classification methods and models are highly complex in principle and have large numbers of parameters. Some of them require considerable experience to construct and train. Thus, it is difficult to achieve high diagnostic accuracy in practical applications.
Deep learning stems from the field of bionics on a simulated brain system. It is actually a multi-layer sensor neural network that constructs multiple hidden layers. It is also called a deep neural network. Deep learning simulates the learning process of the human brain through deep neural networks and can form knowledge and judgments directly from raw data. These processes are all based on the multi-level abstraction mechanism of the human brain, which eliminates the need for artificial feature extraction and selection. This avoids the complexity and uncertainty associated with traditional feature extraction processes and enhances the intelligence of the recognition process.
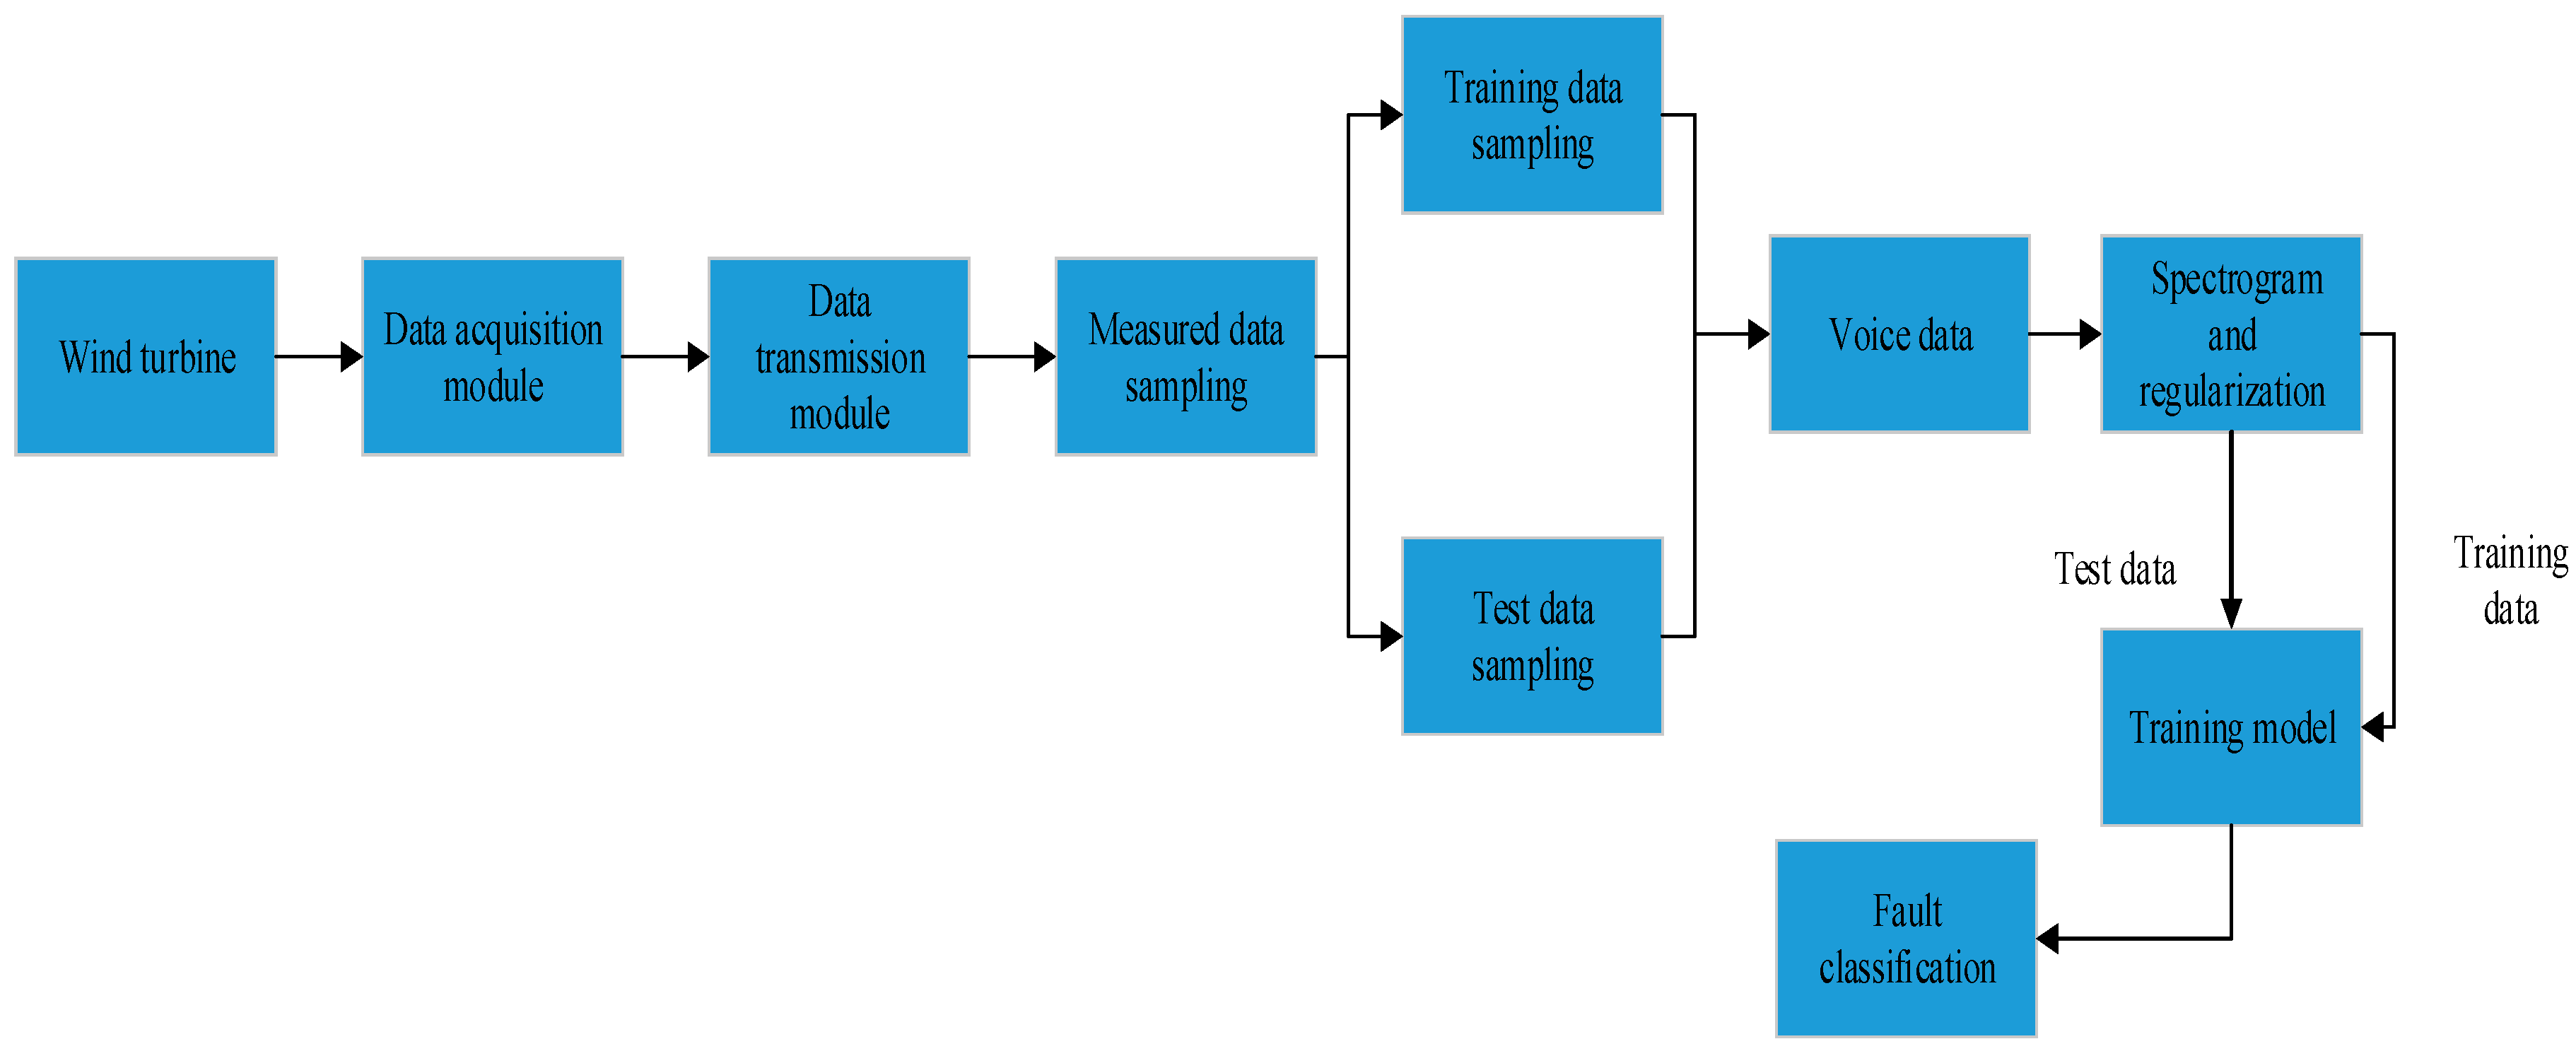
Convolutional neural networks (CNNs) play an important role in deep learning. A CNN is a machine learning model under deep-supervised learning. This paper presents a fault diagnosis method for wind turbine gearboxes based on a convolutional neural network. The introduction of batch normalization reduces the over-fitting phenomenon in the feature extraction process and shortens the training time. The structure of this paper is as follows. In
Section 1, we briefly discuss the spectrum used in this paper.
Section 2,
Section 3 and
Section 4 describe the convolution neural network and batch regularization and analyze the design of our fault diagnosis method.
Section 5 discusses an example of fault diagnosis in wind turbines and gives the results for and analysis of this example. Finally, conclusions are drawn in
Section 6.
1.1. Spectrogram
Speech signals are a typical example of a nonstationary signal. However, the nonstationary nature of speech is caused by the physical motion of the organ through which a person speaks. This process is slower than the velocity of the acoustic vibration. It can be assumed that speech is smooth on the timescale of 10~30 ms. Fourier analysis is a powerful means of analyzing the steady-state characteristics of linear systems and stationary signals. Short-time Fourier analysis, also known as a time-dependent Fourier transform, is a method that can address nonstationary signals using steady-state analysis under short-term stationarity assumptions.
Let the discrete time-domain sampling signal be
, where
is the time-domain sampling point number, and
is the signal length. If the signal is framed, then
is denoted as
, where
is the frame number,
is the time sequence number of the frame synchronization, and
is the frame length (the number of sampling points within one frame).
short-time Fourier transforms are given by:
where
is the Hamming window.
Then, is the discrete Fourier transform used to obtain the short-term amplitude spectrum estimation.
Therefore, the power spectral function is:
where
is a two-dimensional non-negative, real-valued function, which is the Fourier transform of the short-term autocorrelation function of signal
. With
as the abscissa and
as the ordinate, the value of
is expressed as the gray-level composition of the image, which is a phonogram.
and
.
1.2. Pseudo-Color Spectrogram
For pseudo-color mapping on
, a pseudo-color chromatogram with a higher resolution and better visual effects can be obtained. The maximum value
of
is mapped to the normalized level of 1, and the minimum value
is mapped to the normalized level of 0. Then,
is linearly mapped to the level
between 0 and 1. The computer monitor can then display it in pseudo-color mode according to the value of
in the phonogram. To obtain a better display effect, one can select the appropriate reference base value. Then, one can limit the values that are less than the base value to the reference level and map the values greater than the base value linearly to between 0 and 1 normalized color values. The mathematical representation of the color value matrix
is as follows:
and
.
5. Simulation Experiment and Discussion
To further verify the validity of the diagnostic model, this paper tests the 40 groups of wind turbine samples listed in [
21]. Among the 40 groups of samples, each fault condition has 6 samples so that there are 240 sample data points and 8 failure categories.
Table 1 lists some of the sample data.
In this algorithm, the parameter set in each part is as follows:
(1) Compared to other convolutional neural network models, the VGG16 mode [
19] uses convolutional layers of multiple smaller convolution kernels instead of one convolutional core with a larger number of convolutional layers. On the one hand, the parameters can be reduced, and on the other hand, more nonlinear mappings can increase the network’s ability to fit. Therefore, this article uses VGG16 as a training model.
(2) To effectively improve the performance of the convolutional neural network, a relatively high classification accuracy can be obtained with relatively few training samples. In this paper, we will generate a spectrogram for each fault condition. Thus, a total of 40 spectral maps are generated, of which 32 pictures are used for training and the remaining 8 pictures are used for network testing.
(3) The model consists of 13 convolution layers, 3 full connection layers, and 1 output layer. The 13 convolution layers are divided into 5 large convolution layers, and each pair has a pool layer between the elements in it.
(4) The specific settings of the parameters are as follows: the number of training steps is 15,000, the activation function is a ReLU (rectified linear) function, the gradient loss method is the application of the loss function, and the learning rate is 0.01.
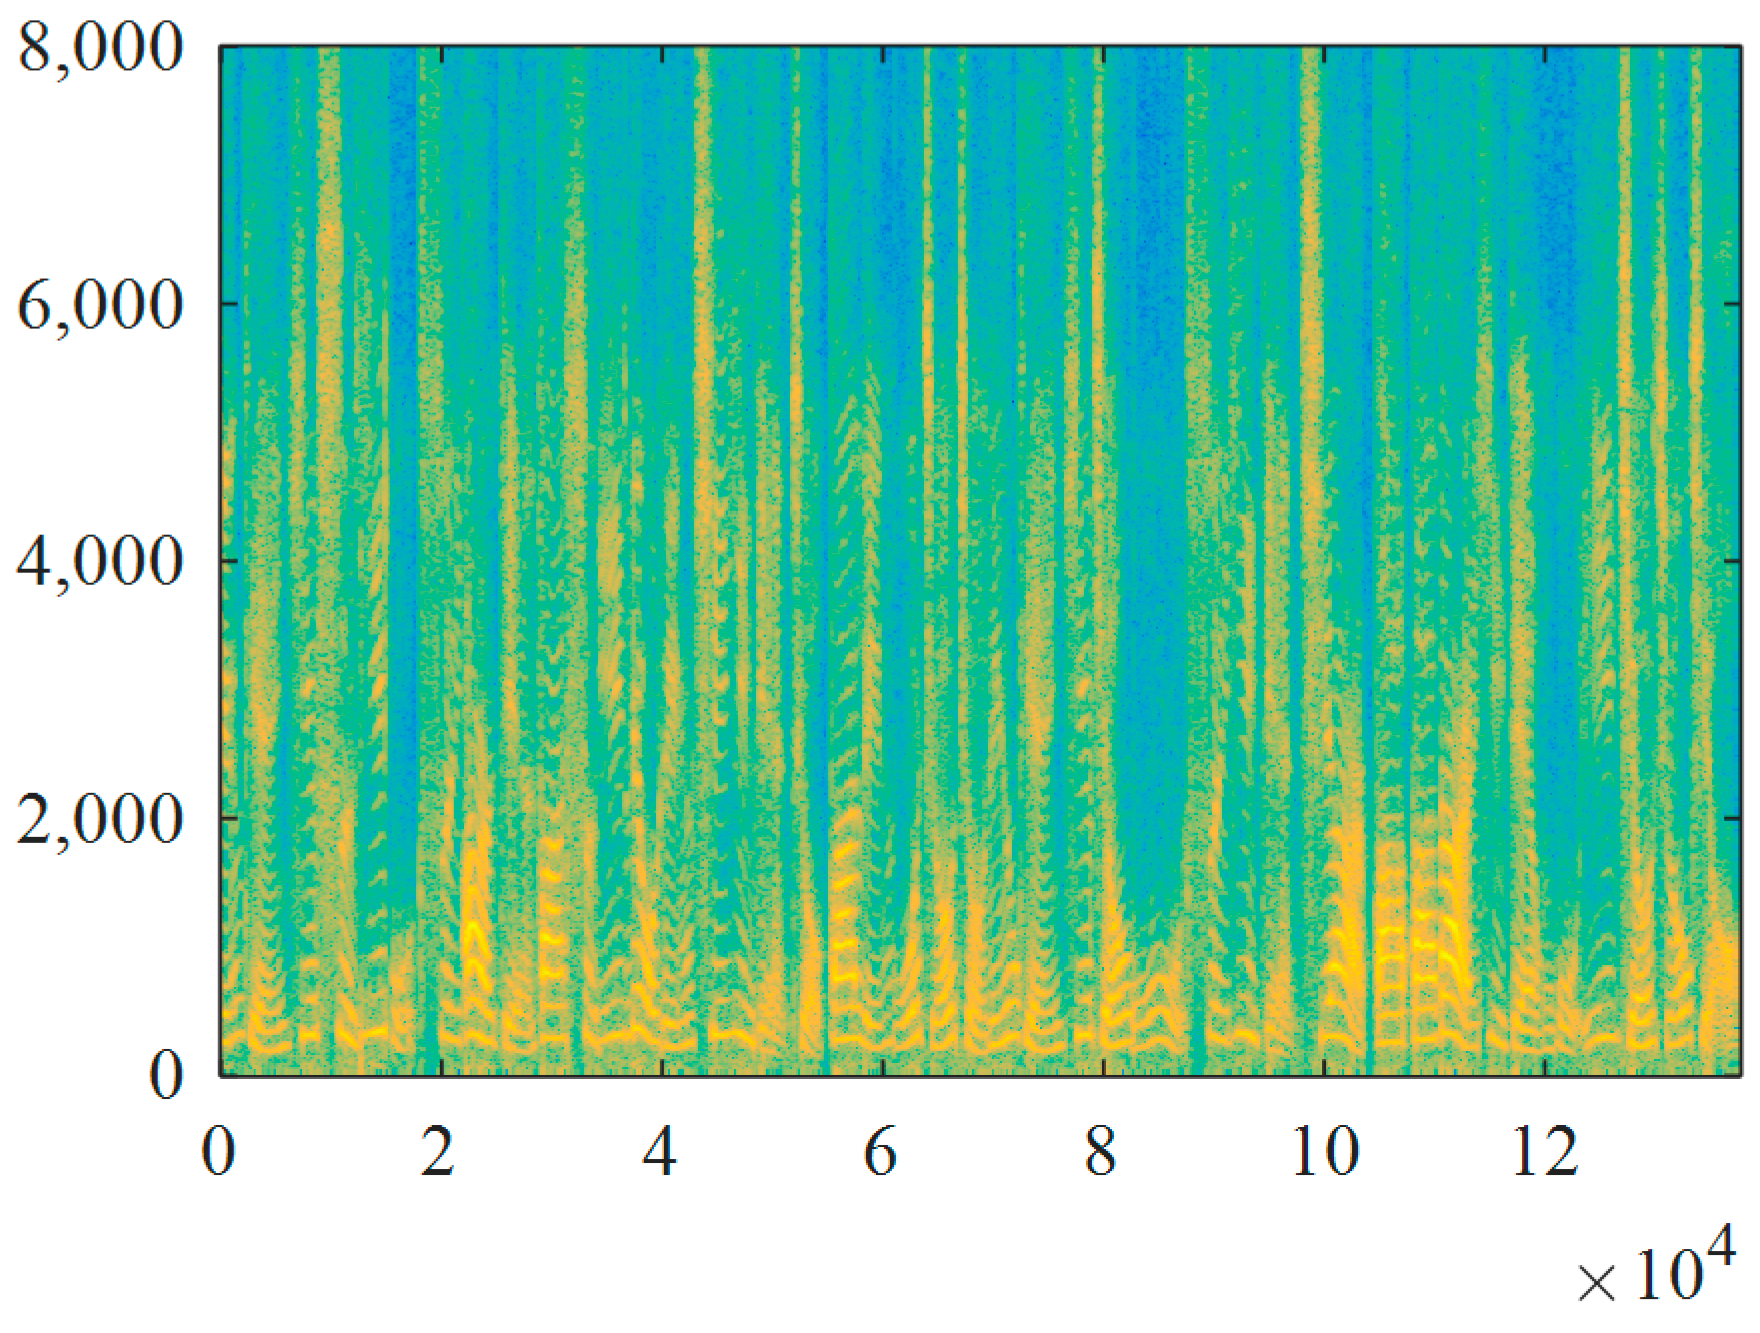
Figure 2 and
Figure 3 show the short-term amplitude spectrum estimation and power spectral function graphs for the 240 samples, respectively.
After the above steps, in order to reduce the training time, 240 samples will generate 40 spectra and pseudo-color chromatograms.
Figure 4 and
Figure 5 show spectrograms and pseudo-color spectra for the following sample data: (−0.14154, 2.841607, 1.980599, −0.19554, −1.72882, −1.51999).
Figure 6 and
Figure 7 show the accuracy and loss function curves of the training and the test data, respectively. From
Figure 6 and
Figure 7, it can be seen that both the accuracy curve and the loss function curve fluctuate little during training and testing. In addition, the convergence speed is fast, and the convergence value is ideal.
This shows that our proposed method, when applied to the 240 groups of wind turbine samples with 8 fault types, has 100% classification accuracy. From
Table 2 [
22], only the classification accuracy of the SVM is close to that of the proposed algorithm, and our algorithm is far more accurate than BPNN, ELM, Fixsize Sequence Extreme Learning Machine (FSSELM), and Incremental Extreme Learning Machine (IELM). This fact illustrates that, although the number of samples is small, the diagnostic accuracy of this method is relatively high. Therefore, the applicability of this algorithm to wind turbine fault diagnosis is very high.
In the above experiment with a small sample, the fault diagnosis correctness rate reached 100%. In order to verify the practicability of this method, we continued to increase the number of samples. As the number of samples in the training set and the test set continue to increase, the results show that the average correctness rate of this method remains high. Since batch regularization has been introduced and each fault condition is represented as a spectrogram, the method has the advantages of a short training time, a fast diagnosis speed, and a low error rate.


