Article

Analysis and Sizing of Power Distribution Architectures Applied to Fuel Cell Based Vehicles

Power Electronics System Group, Universidad Carlos III de Madrid, 28911 Leganes, Spain
*
Author to whom correspondence should be addressed.
Energies 2018, 11(10), 2597; https://doi.org/10.3390/en11102597
Submission received: 7 September 2018 / Revised: 24 September 2018 / Accepted: 26 September 2018 / Published: 29 September 2018
(This article belongs to the Section F: Electrical Engineering)

Abstract

:
The fuel cell based vehicles powertrain is an extensive system that comprises a fuel cell (FC) as the primary energy source, a set of power converters both unidirectional and bidirectional and batteries or supercapacitors as secondary energy sources. Its design is a complex task that affects the mass, volume, cost, efficiency and fuel economy of the vehicle. This paper describes a graphic and straightforward sizing of the secondary energy sources needed to fulfil the vehicle load requirements, as well as the set of equations related to the mass, cost and volume of each one of the power distribution subsystems. Moreover, this paper analysis ten different power distribution architectures to conclude which is the most suitable secondary energy source, the minimum sizing, cost, volume and weight, depending on the amount of power delivered by the fuel cell. Also, a 1.6 kW fuel cell based architecture is implemented and testing. The experimental results confirm the proposed methodology.

1. Introduction

The depletion of the fossil reserves, together with other environmental factors such as global warming and local atmospheric pollution, makes necessary a progressive substitution of conventional vehicles by environmentally friendly vehicles. The fleet growth forecasts indicate that vehicle use will increase in the coming years, the reason why a technological change is needed to assure long-term sustainable mobility.
Prime vehicle manufacturers have begun to move toward a clean and more efficient vehicle. For some time now, they have introduced in the market hybrid vehicles that combine internal combustion engines with batteries, as well as electric vehicles powered only by batteries. In this line of work, there is a strong effort in the sizing and optimisation analysis of the powertrain of this kind of vehicles, looking forward to a cost and fuel economy reduction [1,2,3,4]. Although the electric vehicles global sales are expected to grow by a factor of ten from 2020 to 2030 [5], the required electric grid to recharge these electric vehicles is not extensive enough [5]. This fact implies a severe drawback in the electric vehicle establishment [6], whose integration will affect the electrical distribution network profoundly [7].
The fuel cell (FC) based vehicles are beginning to be considered as a reliable alternative instead of the pure battery vehicles, although several aspects related to the hydrogen storage, hydrogen distribution networks, overall costs reduction, etc., must be improved [8,9]. Honda presented the first mass production fuel cell based vehicle, FCX Clarity, which maximum speed is 160 km/h and its autonomy is over 460 km. Also, Toyota unveiled the Mirai, a mid-sized hydrogen fuel cell car with autonomy over 502 km. On the other hand, Hyundai has developed the ix35 FCEV vehicle in South Korea. Several alliances between the vehicle manufacturers have been established: General Motors and PSA Peugeot-Citroën; Mercedes-Benz, Ford and Nissan; and finally BMW Group and Toyota Motor Corporation. The objective of these alliances is to research the propulsion system of vehicles based on fuel cells and Li-ion batteries [10].
The fuel cell based vehicle propulsion system comprises the fuel cell as the primary energy source, a set of power converters both unidirectional and bidirectional and finally the storage energy devices, usually batteries or supercapacitors. Therefore, depending on the number, location and nature of both the power converter and the energy storage devices, there are multiple possibilities for the power distribution architecture design, even more, if the strategy control and the energy storage from regenerative braking are taken into account [11,12,13,14,15,16]. Additionally, the goal of each power distribution architecture is not only to satisfy the energy and power demand, but also to improve the fuel cell operating features such as the slow dynamic response, the load-dependent output voltage, the unidirectional operation, and the long startup times, among others.
The adequate selection of the power distribution architecture is a complex task that has a substantial impact on the mass, volume, cost, efficiency, hydrogen consumption, etc., of the overall system. Several papers report the study and comparison of different power architectures. The designs based on fuel cells and batteries are studied in [11,14,16,17], those based on fuel cells and supercapacitors are reviewed in [12,18,19,20,21], and finally, the architectures based on fuel cells, batteries and supercapacitors are studied in [13,22,23,24,25,26]. Regarding this last group of papers, [11,18,20] provide a complete revision of different topologies of power distribution architectures; [21,23] supply with a set of sizing programming algorithms; and [19,22,24] approach the comparison of power distribution architectures regarding mass, volume and cost.
However, these works do not gather a complete study and comparison of propulsion systems considering at the same time:
  • A wide variety of possible combinations of secondary energy storage devices (fuel cell and batteries, fuel cell and supercapacitors, fuel cell with both batteries and supercapacitors).
  • An optimal sizing procedure as a function of the maximum power provided by the fuel cell. The optimal sizing procedure presented in this paper is an analytical problem, needless to use any programming technique. The proposed optimal sizing procedure offers a more straightforward graphical solution map, where the most appropriate architecture can be chosen as a function of the maximum power provided by the fuel cell (fuel cell size).
  • All the subsystems of the vehicle powertrain for the sizing optimisation procedure.
This paper presents a comparative analysis of the mass, volume and cost, for a set of nine different power distribution architectures based on the fuel cell, batteries and supercapacitors. The study is performed depending on the maximum power delivered by the fuel cell; this means that the fuel cell size is not predetermined. The power and energy requirements that must be satisfied by the architectures derive from the European driving profile ECE-15 for light vehicles. Additionally, an optimisation procedure is presented to minimise the total mass of the battery and the supercapacitor required to satisfy the load requirements. The result of the optimal sizing procedure is the minimum size of the batteries and supercapacitors, that corresponding to each size of the fuel cell, needed to satisfy the load requirements. Therefore, the designer can select which power distribution architecture is the most suitable for its application, as a function of the fuel cell size (maximum power delivered by the fuel cell). These comparative analyses are focused on the propulsion system, and therefore include the fuel cell, the hydrogen tank, the supercapacitors, the batteries, and finally the power converters. However, the power demand related to auxiliary systems such as air conditioning are not taken into account. The presented analysis aims to identify the main trends in the design of a powertrain from a quantitative point of view. Thus, it can be useful not only for vehicle designers but also from a power electronics point of view. Note that the electric vehicle is an application that can benefit from the modern techniques applied in power conversion (bidirectional converters, modular converters [27,28]). A prior proposal of this analysis and sizing methodology describes in [29].
This paper is organised as follows. Section 2 describes the equations developed for the optimum sizing of the architectures. Section 3 studies the architectures subsystem firstly, and after that, it analyses and compares the complete architectures. Section 4 explains the experimental measurements made to validate the optimal sizing methodology. Finally, Section 5 summarises the conclusions obtained along the paper.

2. Architecture Sizing

The maximum power delivered by the fuel cell, along with the applied driving pattern [30,31,32,33] imposes the energy and power requirements that the secondary energy sources must satisfy. Figure 1 shows the demanded load power profile derived from a light vehicle with a full load mass of 800 kg, when the ECE-15 urban driving cycle for light vehicles is applied, which has a maximum speed of 50 km/h. The frontal vehicle area is 1.7 m2, the wheel radius is 0.27 m and the drag coefficient 0.31. The motor has a nominal power of 4.7 kW and a peak power of 18 kW.
To illustrate the power and energy load requirements calculation, in Figure 1 it has been selected as an example a maximum fuel cell power of 5 kW. Along with the demanded load power profile P(t), the allowed fuel cell maximum power P is shown (5 kW). Therefore, in this case, the fuel cell delivered power, PFC(P,Pmin,t), goes from Pmin toward the maximum fuel cell power 5 kW, representing the most general case. With the objective of avoiding unexpected fuel cell shutdowns, since fuel cells present very long startup times until tens of seconds [34], a minimum fuel cell delivered power Pmin must be considered.
As shown in Figure 1, if the power demanded by the load is higher than the fuel cell maximum power, then the secondary energy sources satisfy the load. On the other hand, if the power demanded by the load is positive and smaller than the fuel cell maximum power, the fuel cell supplied this power. Additionally, the secondary energy sources manage each power injected into the system by the load during the braking periods. Moreover, finally, in case that the power demanded by the load be smaller than Pmin, the not-required fuel cell delivered energy by the load must be stored in the secondary energy sources.
With the aim of optimising the cost and size of the overall system, a procedure has been developed. This procedure calculates the minimum mass of the secondary energy sources as a function of the maximum power provided by the fuel cell, P (W). Additionally, it determines the proper ratio supercapacitor to battery mass. There are three baseline considerations:
  • There are different possibilities to split the power demanded by the load between the fuel cell and the secondary energy sources. However, the presented optimal sizing procedure does not include any control strategy nor power management technique, and therefore the fuel cell could deliver all the power demanded by the load until its maximum value, with the aim of apply classical control loops over the system. It is considered the most general case.
  • The optimal sizing procedure considered the power and the average energy values that the secondary energy sources have to manage, in every cycle, along the complete working day.
  • The optimum designs require that the energy stored in the secondary energy sources must be enough, in each cycle, to cover the energy that the rest of the system demands to it.

2.1. Calculation of the Secondary Energy Sources Minimum Mass

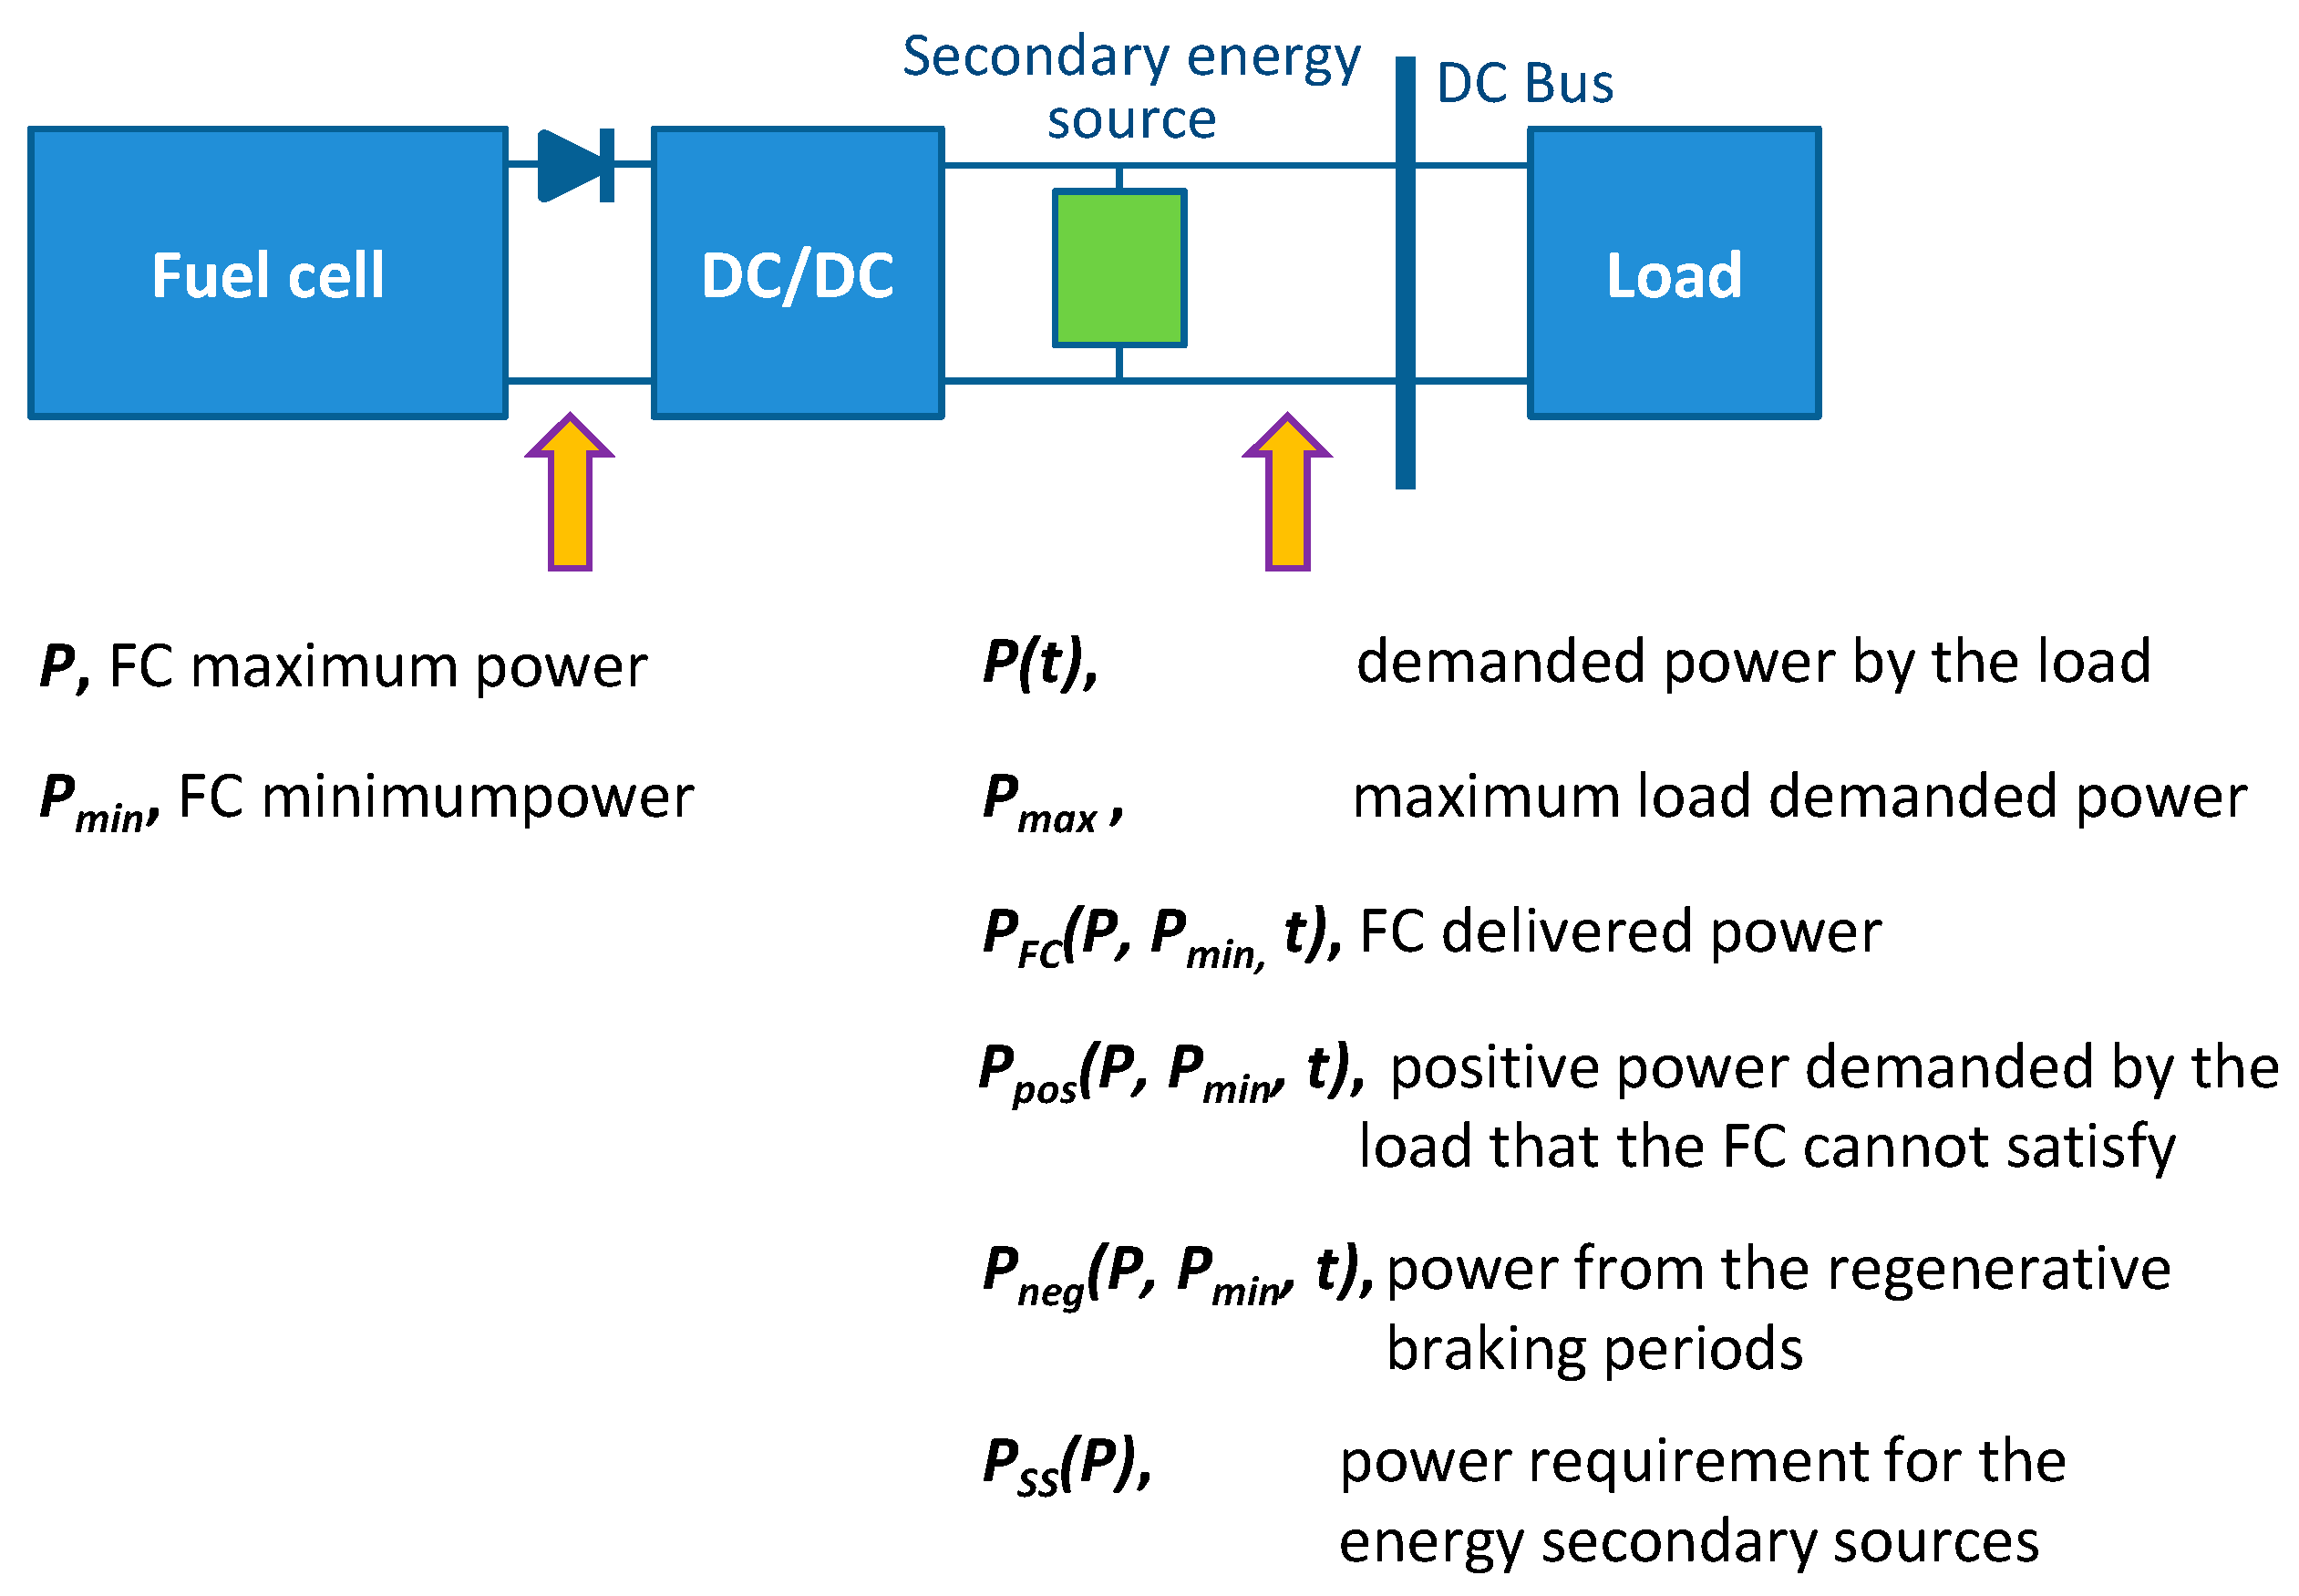
Once the power profile demanded by the load is known, the amount of power and energy that the fuel cell is not able to deliver can be determined, as a function of the maximum power provided by the fuel cell. Figure 2 shows the points within the architecture in which each power definition locates.
The energy delivered by the fuel cell EFC(P,Pmin), where ηuni is the DC-DC power converter efficiency, is calculated from the power demanded by the load P(t) that the fuel cell can satisfy along a working day (1).
P F C ( P , P m i n , t ) = { P ( t ) i f P m i n · η u n i P ( t ) P · η u n i P m i n · η u n i i f P ( t ) P m i n · η u n i P · η u n i i f P ( t ) > P · η u n i  
In order to calculate the energy load requirement ESS(P,Pmin), the first step is to figure out the power demanded by the load that the fuel cell cannot fulfil, Ppos(P,Pmin,t), as well as the power delivered by the load through the rest of the system, during the regenerative braking periods Pneg(P,Pmin,t), (2) and (3).
P p o s ( P , P m i n , t ) = { 0 i f P ( t ) P F C ( P , P m i n , t ) P ( t ) P F C ( P , P m i n , t ) i f P ( t ) > P F C ( P , P m i n , t )  
P n e g ( P , P m i n , t ) = { P F C ( P , P m i n , t ) P ( t ) i f P F C ( P , P m i n , t ) > P ( t ) 0 i f P F C ( P , P m i n , t ) P ( t )  
Next step consists on integrating the Equations (2) and (3) along one single driving cycle, taking into account that tp represent the duration of the cycle in seconds, with the objective of calculating the energy consumed and delivered by the load, (4) and (5) respectively.
E p o s ( P , P m i n ) = 1 3600 · 0 t p P p o s ( P , P m i n , t ) d t  
E n e g ( P , P m i n ) = 1 3600 · 0 t p P n e g ( P , P m i n , t ) d t  
Finally, the energy load requirement ESS(P,Pmin) is defined as the net energy that has to be managed by the secondary energy sources along a single driving cycle, in other words, as the energy demanded by the load that the fuel cell is not able to deliver (4) minus the recovered energy during the braking periods (5). By considering Ndp as the number of times the driving profile is applied, it obtains (6).
E S S ( P , P m i n ) = N d p · ( E p o s ( P , P m i n ) E n e g ( P , P m i n ) )  
It is remarkable that the calculation of both the power load requirement PSS(P) and the energy load requirement ESS(P,Pmin) repeats for each maximum fuel cell power considered, from 0 kW toward the peak power demanded by the load.
Power load requirement PSS(P) defines as the difference between the peak power of the load profile, positive (Pmax) or negative (Pmax_neg), and the fuel cell delivered maximum power P.
P S S ( P ) = { P m a x P · η u n i i f | P m a x _ n e g | < ( P m a x P · η u n i ) | P m a x _ n e g | i f | P m a x _ n e g | > ( P m a x P · η u n i )  
The objective is to calculate the minimum mass of secondary energy sources (batteries and supercapacitors) that satisfies the power load requirement, PSS(P), as well as the energy load requirement, ESS(P,Pmin). The equations system given by (8) and (9) must be solved to calculate the minimum sum of masses of battery and supercapacitor.
m a s s S C ( P ) · η S C · ρ P S C + m a s s B a t ( P ) · η B · ρ P B a t P S S ( P )  
m a s s S C ( P ) · η S C · ρ E S C · Δ S o C S C + m a s s B a t ( P ) · η B · ρ E B a t · Δ S o C B a t E S S ( P , P m i n )  
The supercapacitor and battery masses, ( m a s s S C ( P ) [kg] and   m a s s B a t ( P ) [kg]), are the unknown variables of the equations system. ρ P S C and ρ E S C are the supercapacitor power density (W/kg) and supercapacitor energy density (Wh/kg) respectively. ρ P B a t and ρ E B a t are the battery power density (W/kg) and battery energy density (Wh/kg), ηSC and ηB are the supercapacitor and battery efficiencies respectively, which include the DC-DC power converter efficiency if necessary. Finally, Δ S o C S C and Δ S o C B a t are the supercapacitor and battery maximum state-of-charge increment allowed, which establish the maximum energy quantity delivered by each one of the secondary energy sources.
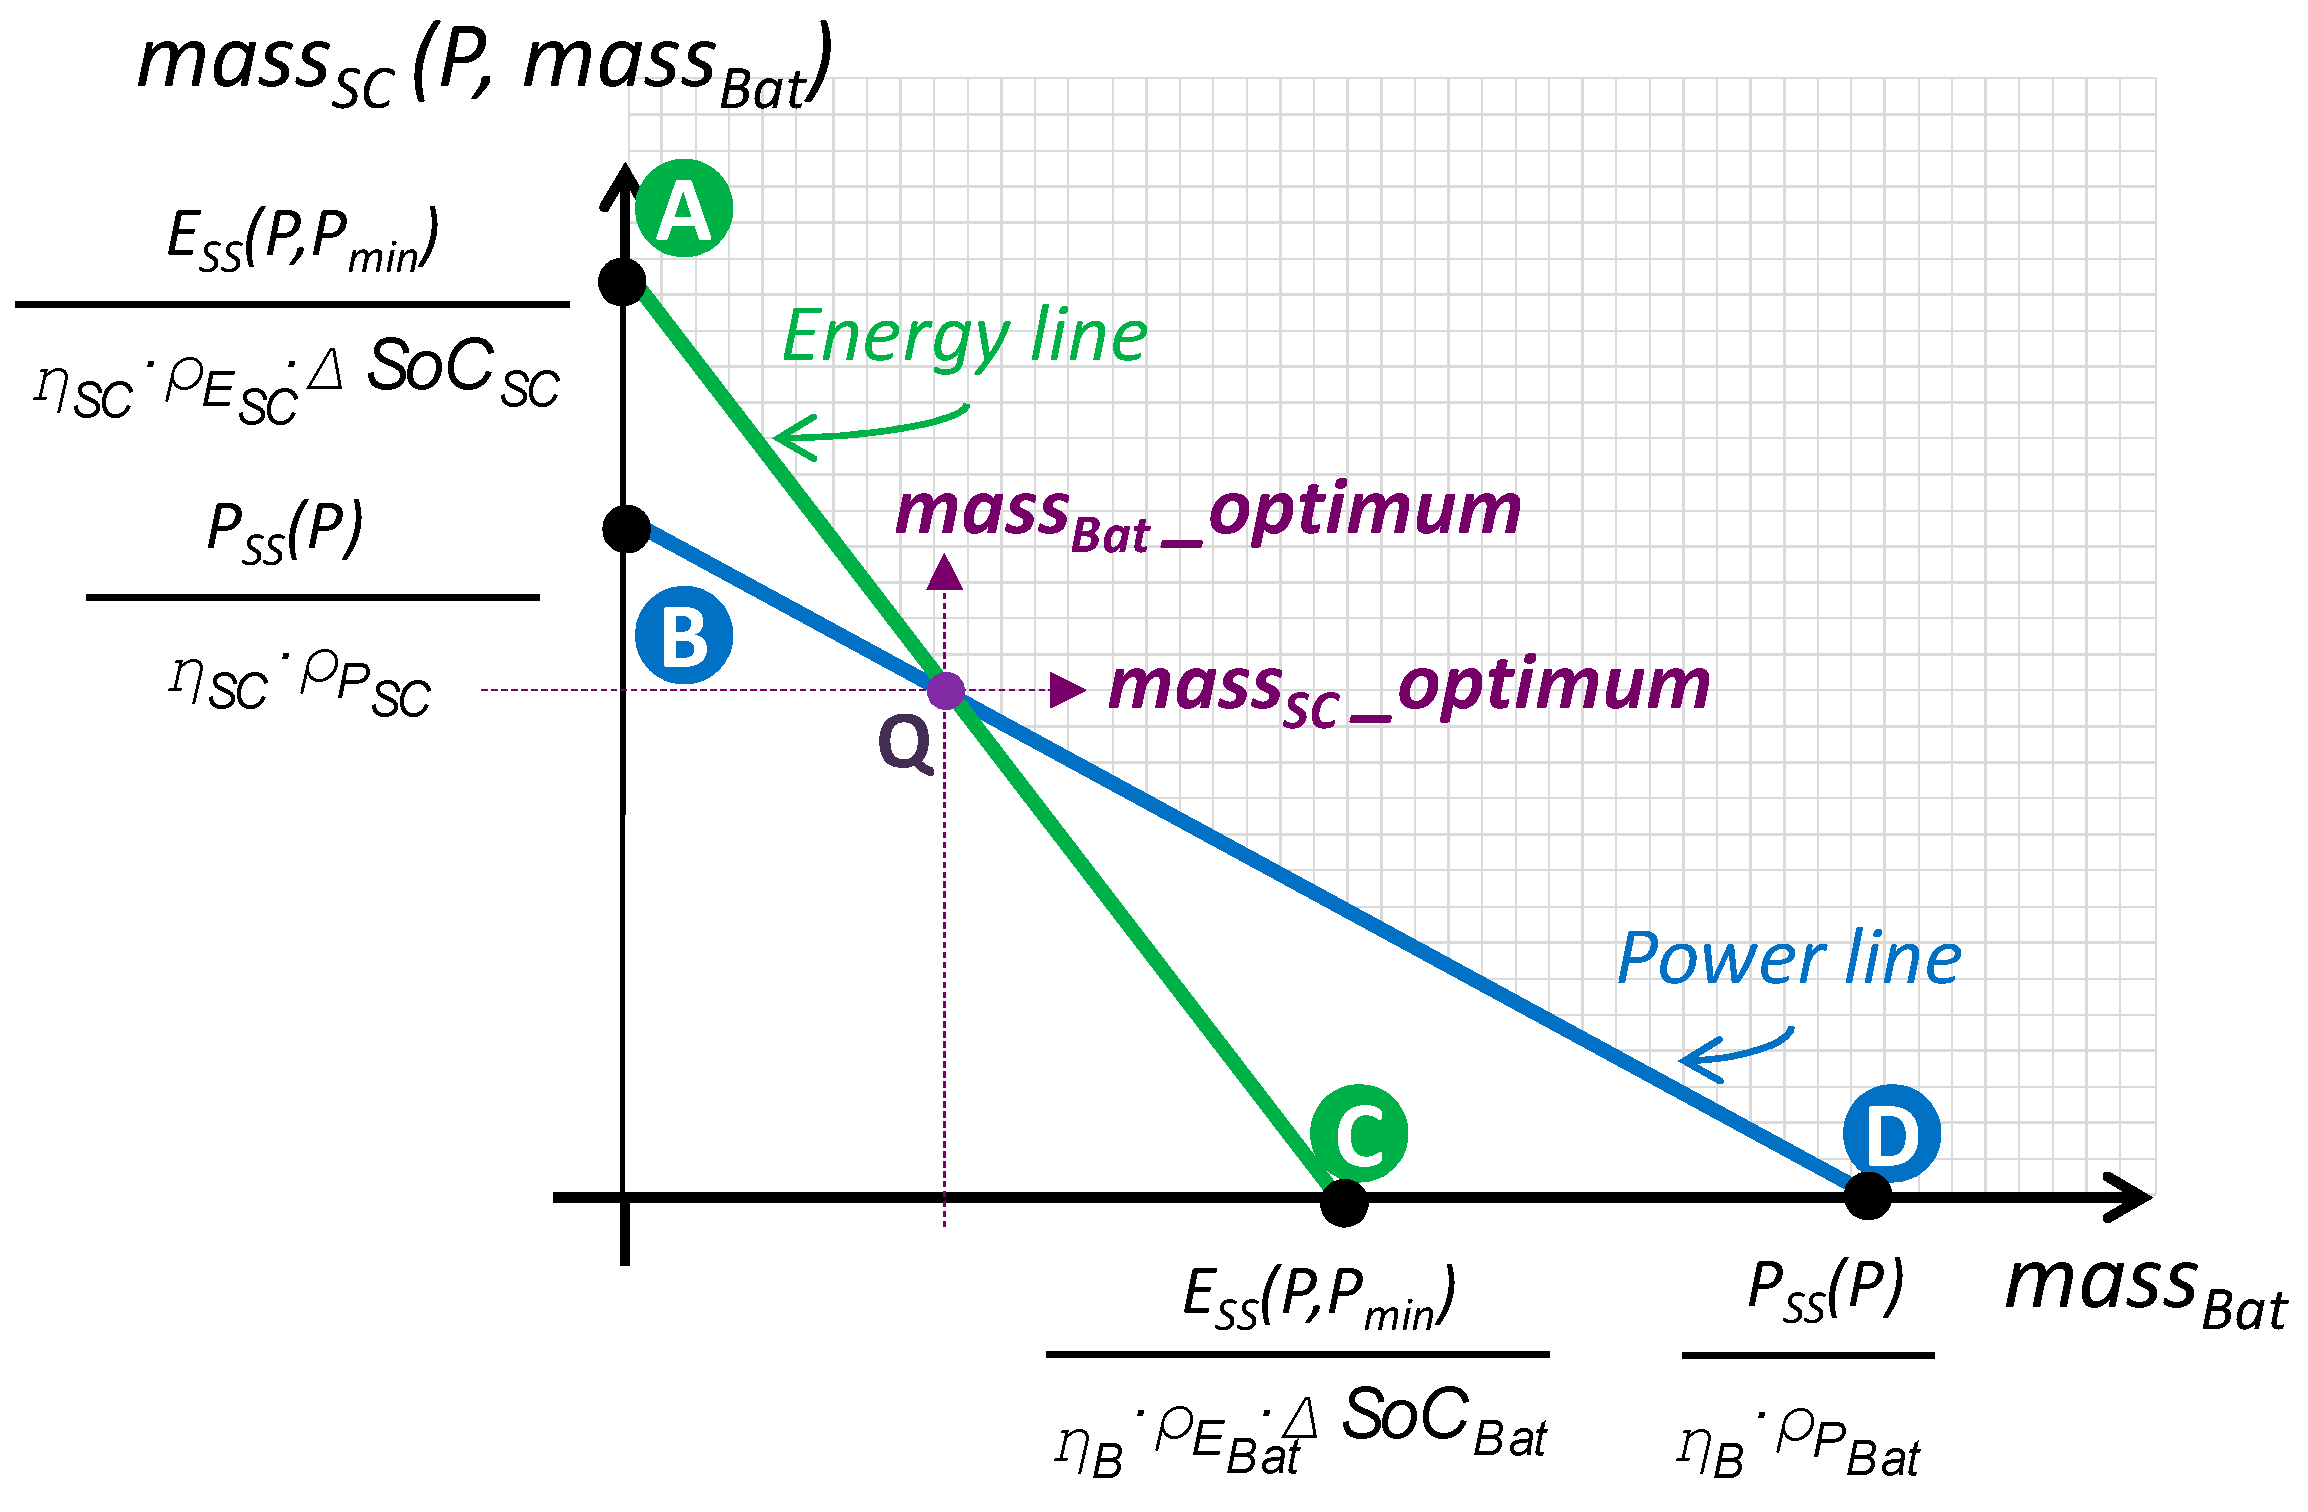
The graphic representation can efficiently delimit the solution map of the equations system (8) and (9). The crossing point between the curves located into the first, second or fourth quadrant of the coordinate axes (battery mass and supercapacitor mass), satisfies the power and energy load requirements simultaneously, ensuring the minimum sum of secondary energy sources masses.
In case the two lines intersect in the first quadrant, see Figure 3, the equations system solution (10) and (11) directly gives the minimum sum of battery mass (kg) and supercapacitor mass (kg).
  m a s s B a t ( P , P m i n   ,   Δ S o C S C , Δ S o C B a t ) = P S S ( P ) · ( ρ E S C · Δ S o C S C ) E S S ( P , P m i n   ) · ρ P S C η B · ρ P B a t · ρ E S C · Δ S o C S C η B · ρ P S C · ρ E B a t · Δ S o C B a t  
  m a s s S C ( P , P m i n   , Δ S o C S C , Δ S o C B a t ) = P S S ( P ) ρ P B a t · m a s s B a t ( P , P m i n   , Δ S o C S C , Δ S o C B a t ) η S C · ρ P S C  
On the contrary, if the intersection of both lines occurs in the second quadrant, as Figure 4 depicts, means that only supercapacitors are recommended to be used as secondary energy source, and the mass quantity value (kg) is given by (12), which corresponds to point B in Figure 4.
  m a s s S C I I ( P ) =   P S S ( P ) η S C · ρ P S C  
Finally, if the crossing point is located in the fourth quadrant, see Figure 5, only batteries must be used as secondary energy sources, and their mass (kg) is calculated using (12), which corresponds to point C in Figure 5.
  m a s s B a t I V   ( P , P m i n   , Δ S o C B a t ) =   E S S ( P , P m i n   ) η B · ρ E B a t · Δ S o C B a t  
Until now, depending on the quadrant of the equations system solution there is a different equation for the supercapacitor mass and the battery mass. With the aim to handle only one equation for each of them, the supercapacitor and battery mass equations (kg) are redefined using piecewise functions (14) and (15), taking into account the relative positions between the power and energy lines (10) to (13).
m B a t ( P , P m i n , Δ S o C B a t , Δ S o C S C ) = { 0   i f   m a s s B a t ( P , P m i n , Δ S o C B a t , Δ S o C S C ) < 0 m a s s B a t ( P , P m i n , Δ S o C B a t , Δ S o C S C )   i f   m a s s B a t ( P , P m i n , Δ S o C B a t , Δ S o C S C ) > 0   y   m a s s S C ( P , P m i n , Δ S o C B a t , Δ S o C S C ) > 0 E S S ( P , P m i n ) η B · ρ E B a t · Δ S o C B a t   i f   m a s s S C ( P , P m i n , Δ S o C B a t , Δ S o C S C ) < 0
m S C a p ( P , P m i n , Δ S o C B a t , Δ S o C S C ) = { 0   i f   m a s s S C ( P , P m i n , Δ S o C B a t , Δ S o C S C ) < 0 m a s s S C ( P , P m i n , Δ S o C B a t , Δ S o C S C )   i f   m a s s B a t ( P , P m i n , Δ S o C B a t , Δ S o C S C ) > 0   y   m a s s S C ( P , P m i n , Δ S o C B a t , Δ S o C S C ) > 0 P S S ( P ) η S C · ρ P S C   i f   m a s s B a t ( P , P m i n , Δ S o C B a t , Δ S o C S C ) < 0
Figure 6 shows the battery and supercapacitor mass evolution when uses the data included in Table 1 (Section 3.1).
Figure 6 shows two different regions, depending on the compliance of the three baseline considerations described above, at the beginning of Section 2. The left region fulfils all consideration, and the right region does not. The right region is due, the recovered energy in the secondary energy sources has to be lower than the delivered energy. Otherwise, the supercapacitor is charged in every cycle up to reach its maximum value. In this state, the supercapacitor cannot receive more energy and then it cannot collaborate in the energy management.
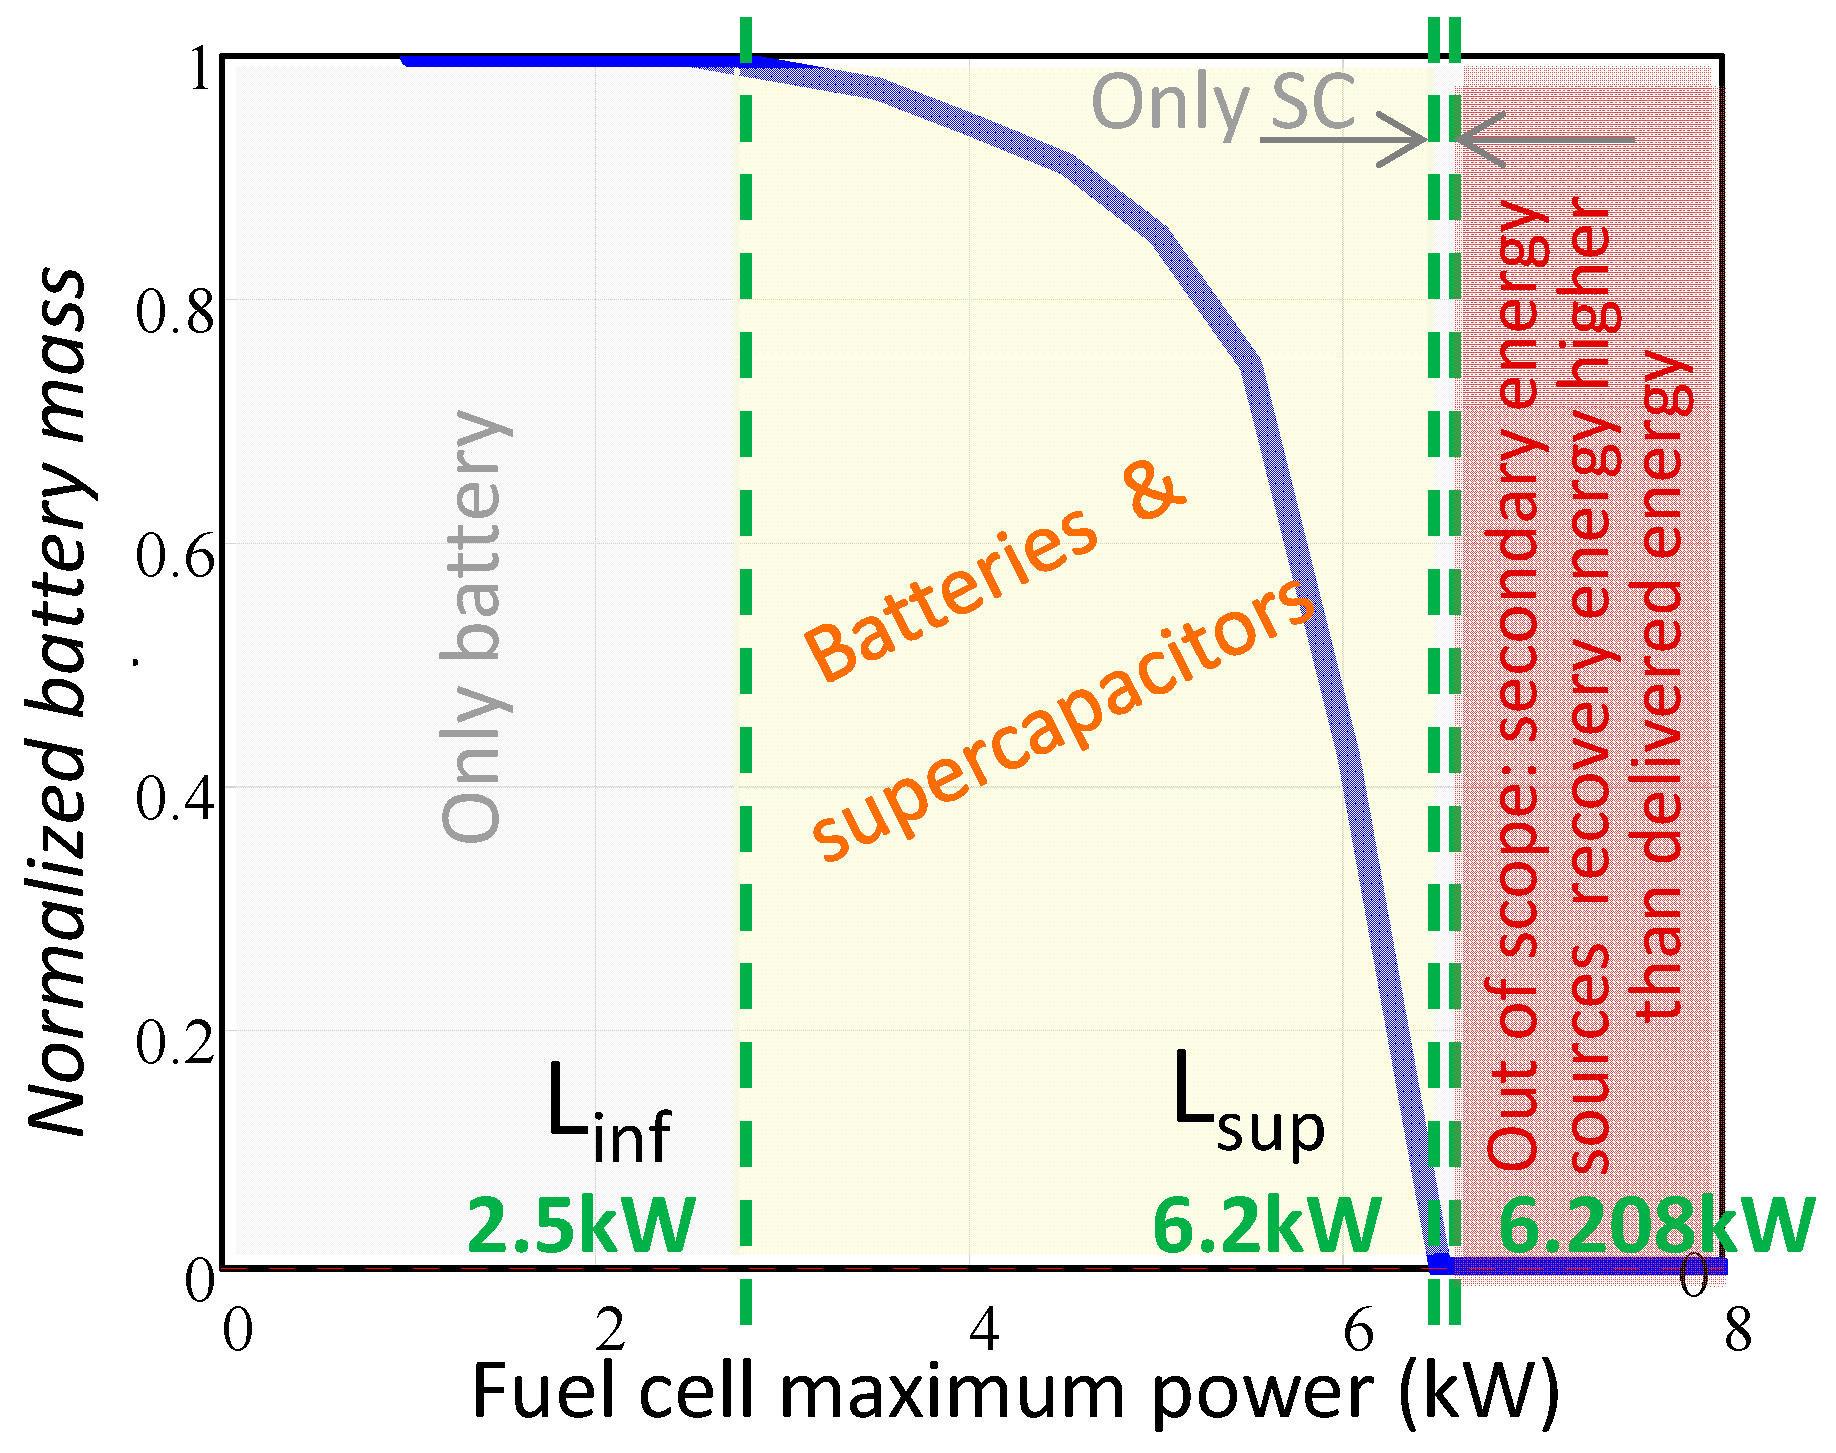
Finally, both the normalised battery mass and the supercapacitor mass are defined in Equation (16) and (17), respectively. These equations allow obtaining both the proper battery and the supercapacitor mass ratio as a function of the fuel cell maximum delivered power.
m B ( P , P m i n ,   Δ S o C S C , Δ S o C B a t ) = m B a t ( P , P m i n ,   Δ S o C S C , Δ S o C B a t ) m B a t ( P , P m i n ,   Δ S o C S C , Δ S o C B a t ) + m S C a p ( P , P m i n ,   Δ S o C S C , Δ S o C B a t )    
m S C ( P , P m i n ,   Δ S o C S C , Δ S o C B a t ) = 1 m B ( P , P m i n ,   Δ S o C S C , Δ S o C B a t )    
Figure 7 shows the evolution of the Equation (16) as a function of the fuel cell maximum power, P, when uses the data shown in Table 1.
Note that the normalised battery mass reaches unity when the supercapacitors mass is zero (equations system (8) and (9) with a solution in the fourth quadrant), and vice versa, the normalised battery mass is zero when the supercapacitors mass is unity (equations system (8) and (9) with a solution in the second quadrant). Regarding the intermediate power range, the minimum secondary sources mass is achieved using together batteries and supercapacitors. Its power range lower limit Linf is determined by the load energy requirement and its power range upper limit Lsup is given by the load power requirement. Numerically, for data in Table 1, the boundaries correspond to 2.5 kW and 6.2 kW respectively. This intermediate range corresponds to the equations system (8) and (9) with a solution in the first quadrant, according to the ratio determined by (15) as depicted in Figure 7. From 6.208 kW onwards, the recovery energy is greater than the delivered energy by the secondary energy sources, and therefore that region is out of the scope of this research work.
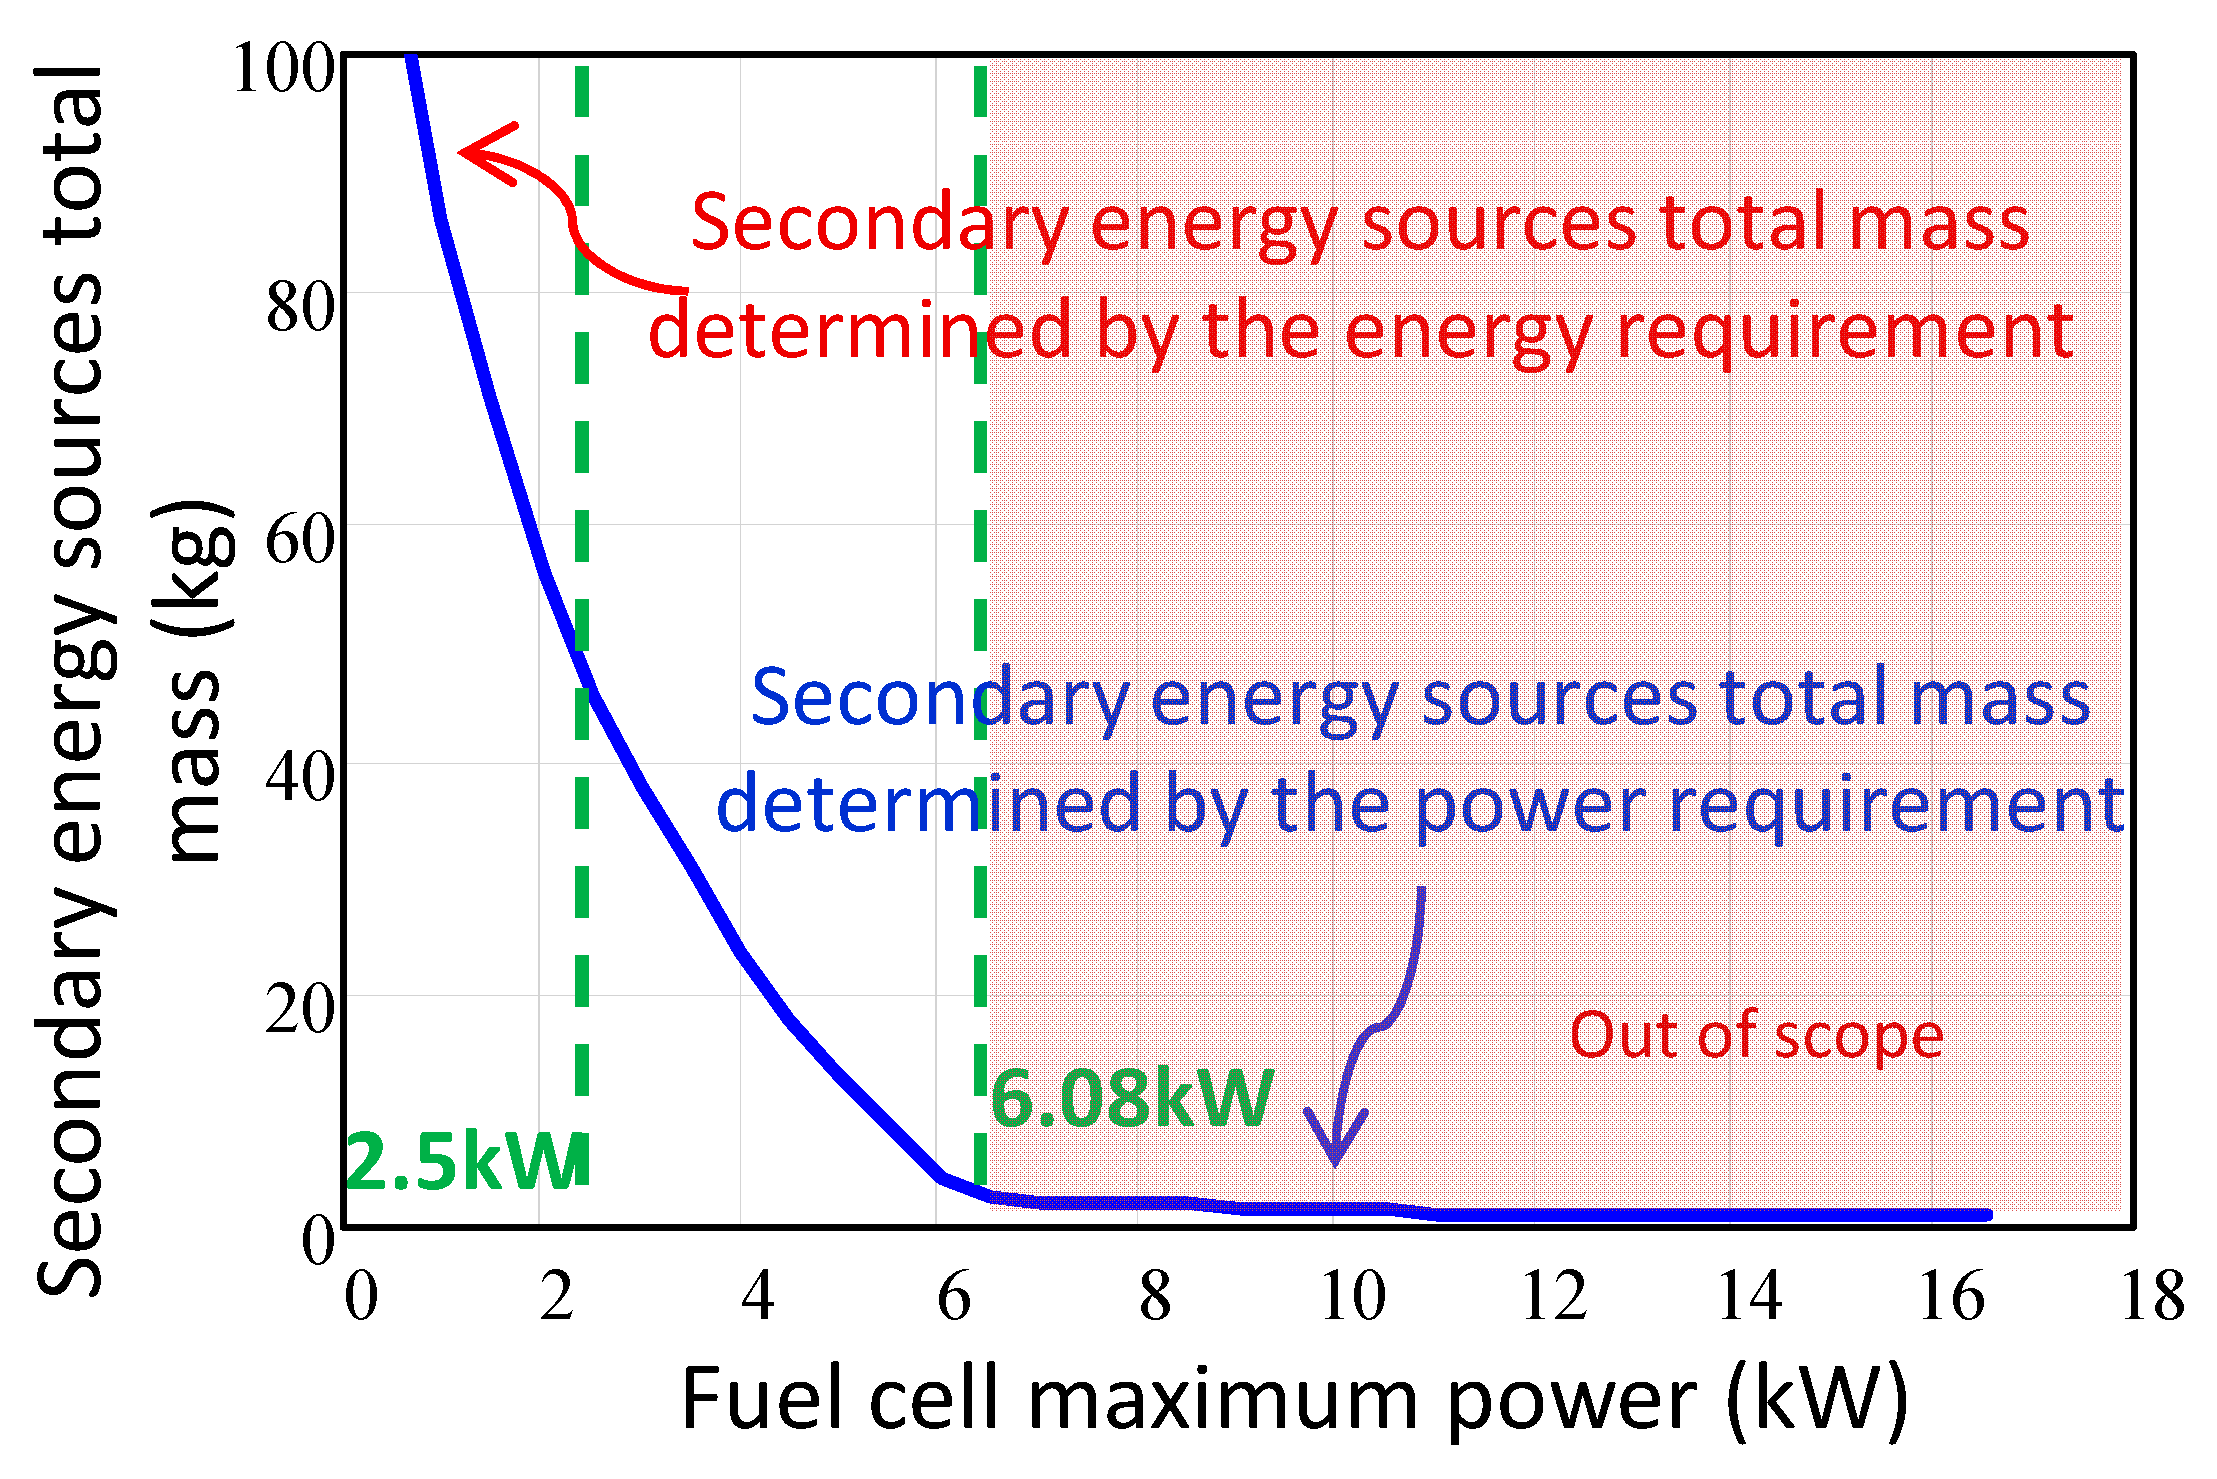
The secondary energy sources total mass (kg) is calculated using the sum of the battery mass and supercapacitor mass, (14) and (15). Figure 8 shows the secondary energy sources total mass as a function of the fuel cell maximum power, P, using the collected data in Table 1. Note that the total mass of each propulsion system includes the fuel cell mass, the hydrogen storage tank mass, the converters mass and the secondary energy sources masses.
Given the power limits described in Figure 7 it can be identified the total mass determined by the load energy requirement, until 2.5 kW, and the total mass defined by the load power requirement, from 6.2 kW until 6.208 kW.

2.2. Battery and Supercapacitor Masses and Cost

The battery mass (kg) and the supercapacitor mass (kg) are calculated from (14) and (15).
The supercapacitor cost (€) is obtained from its energy using (18), where PrSC is the price in €/Wh.
  C o s t S C ( P , P m i n ,   Δ S o C S C , Δ S o C B a t ) =   m S C a p ( P , P m i n ,   Δ S o C S C , Δ S o C B a t ) · ρ E S C · P r S C  
Analogously, the battery cost (€) is determined from its energy using (19), where PrBat is the price in €/Wh.
  C o s t B a t ( P , P m i n ,   Δ S o C S C , Δ S o C B a t ) =   m B a t ( P , P m i n ,   Δ S o C S C , Δ S o C B a t ) · ρ E B a t · P r B a t  

2.3. Fuel Cell Mass and Cost

The fuel cell mass (kg) is due to the hydrogen storage tank mass plus the fuel cell mass itself.
The fuel cell mass depends on its maximum delivered power. The hydrogen storage tank mass has been taken into account since it constitutes the 60% of the total storage system mass and volume [35,36,37,38]. Additionally, its cost is more significant than the rest of the storage system. The hydrogen tank mass calculates using the fuel cell delivered energy, considering the gravimetric density of energy and the fuel cell efficiency.
The fuel cell mass is calculated using Equation (20), where ρ P F C is the fuel cell power density (W/kg), EFC(P,Pmin) is the fuel cell delivered energy, ηFC is the fuel cell efficiency and ρ E k g (Wh/kg) is the energy gravimetric density of the hydrogen storage system, a carbon fiber cylinder at 700 bars.
  M a s s F C ( P ) = P ρ P F C + E F C   ( P , P m i n ,   η F C ) ρ E k g  
The fuel cell delivered energy is defined using (21), taking into account that tp represent the duration of the cycle in seconds:
E F C ( P , P m i n , η F C ) = 1 3600 · 0 t p P F C ( P , P m i n , t ) · 1 η F C · d t  
The fuel cell cost (€) is calculated using (22), where PrFC is the price in €/W, and PrSt is the storage tank price in €/Wh.
C o s t F C ( P ) = P · P r F C + E F C   ( P , P m i n ,   η F C ) · P r S t  

2.4. Power Converters Mass and Cost

The power, the power density, and finally the efficiency determine the power converters mass (kg), such as described in (23).
  M a s s c o n v ( P u n i , i ,   P b i , i ,   k Δ V , i ) = i = 0 n P u n i , i η u n i , i · ρ P u n i , i · k Δ V , i + i = 0 m P b i , i η b i , i · ρ P b i , i · k Δ V , i  
In the previous equation, n and m are the numbers of unidirectional and bidirectional power converters in the propulsion system respectively, ηuni and ηbi are the unidirectional and bidirectional power converter efficiencies respectively, Puni and Pbi are the power managed by each unidirectional and bidirectional power converter, ρ P u n i and ρ P b i are the unidirectional and bidirectional power densities (W/kg), and finally kΔV is a coefficient that penalizes the power converters that operate in a wide range of voltages. Its value is unity for narrow voltage ranges, and 1.2 in case of wide voltage ranges.
The power converters cost (€) is calculated using (24), where Pruni and Prbi, are the unidirectional and bidirectional power converters price in €/W, respectively.
C o s t c o n v ( P u n i , i ,   P b i , j ) = i = 0 n P u n i , i η u n i , i · P r u n i + j = 0 m P b i , j η b i , j · P r b i  

2.5. Propulsion System Mass and Cost

The total mass and cost of the complete power distribution architecture are calculated as the summation of the masses (25) and costs (26) of every subsystem.
  M a s s t o t a l ( P , P m i n ,   Δ S o C S C , Δ S o C B a t P u n i , i , P b i , j , k Δ V , i ) =   m B a t ( P , P m i n ,   Δ S o C S C , Δ S o C B a t ) + m S C a p ( P , P m i n ,   Δ S o C S C , Δ S o C B a t ) + M a s s F C ( P ) + M a s s c o n v ( P u n i , i , P b i , i , k Δ V , i )
  C o s t t o t a l ( P , P m i n ,   Δ S o C S C , Δ S o C B a t P u n i , i , P b i , j ) =   C o s t S C ( P , P m i n ,   Δ S o C S C , Δ S o C B a t ) + C o s t B a t ( P , P m i n ,   Δ S o C S C , Δ S o C B a t ) + C o s t F C ( P ) + C o s t c o n v ( P u n i , i , P b i , j )

2.6. Secondary Energy Source Selection

From the optimised calculation of both the battery and the supercapacitor masses and the results shown in Figure 7 and Figure 8 are obtained the most appropriate use of each kind of secondary energy source. Therefore, for fuel cell maximum power below the lower power limit (in this case 2.5 kW), it is recommended the use of only batteries. For fuel cell maximum power between the lower and upper power limits (in this case 2.5 kW and 6.2 kW respectively), it is suggested to use a combination of batteries and supercapacitors. The most proper ratio between supercapacitors and batteries masses is given by (15). Moreover, finally, for a fuel cell maximum power higher than the upper power limit (in this case 6.2 kW), and lower than 6.208 kW the most suitable option is to use only supercapacitors.

3. Powertrain Analysis

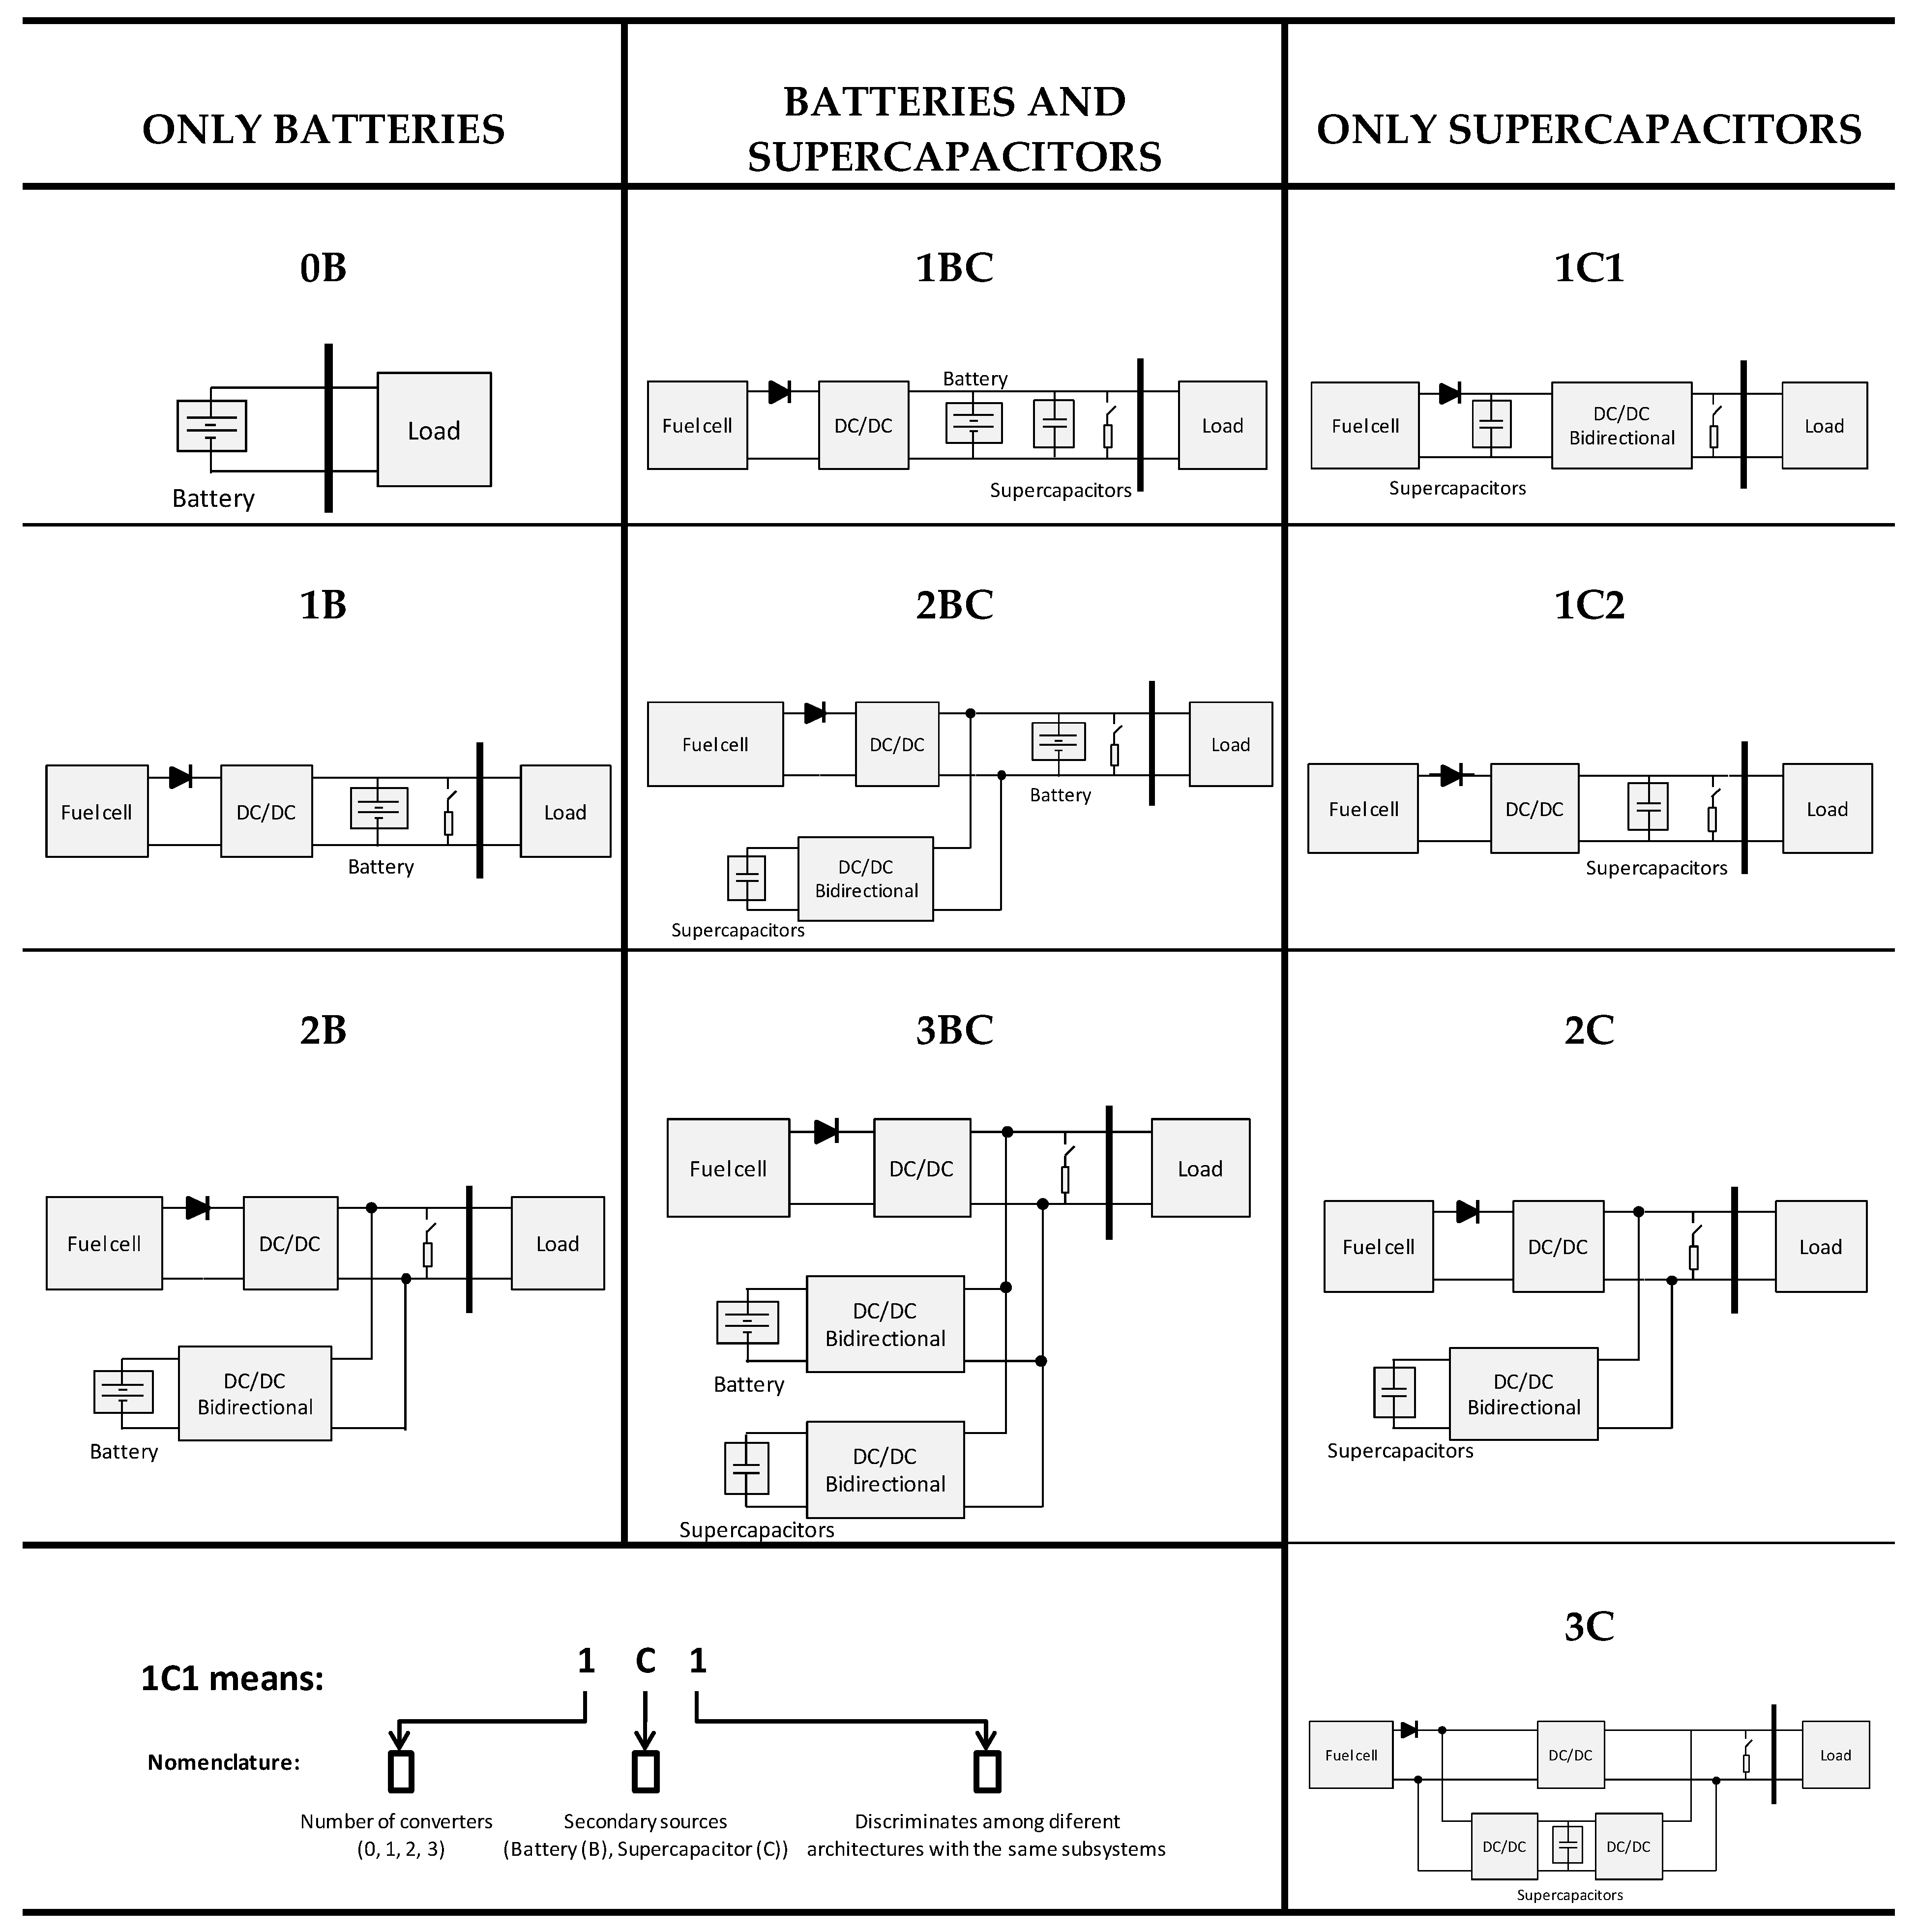
Figure 9 shows the analysed power distribution architectures. It observes that the fuel cell is the primary energy source in the system for all the considered architectures, except for 0B, that does not use a fuel cell.
The different architectures comprise one or more unidirectional or bidirectional power converters and different kind and number of secondary energy sources.
The power distribution architectures have been grouped attending to the secondary energy sources. Therefore, the first column in Figure 9 corresponds to architectures that only implement batteries, the second column corresponds to architectures that implement batteries and supercapacitors, and the third column corresponds to architectures that only implement supercapacitors. Moreover, an additional architecture (0B) with only a battery to supply all the load requirements is included to compare the advantages and drawbacks, regarding mass and cost, between a pure battery vehicle and a fuel cell based vehicle.
The following paragraphs focus on the propulsion systems analysis with manufacturing volumes of more than 500,000 units.

3.1. Architecture Subsystems Analysis

The mass and cost of each one of the subsystems within each power distribution architecture are analysed in the following paragraphs, using the Equations (14)–(24) and their corresponding graphics representations.
Power and energy density data, as well as the price in euros, [37,38,39,40,41,42,43,44,45,46,47], of the DC/DC power converters, supercapacitors, batteries and fuel cell system collects in both, Table 1 and Table 2.

3.1.1. Unidirectional and Bidirectional Power Converters

The power converters mass (23) and cost (24) depend on their power level. Within the analysed architectures distinguishes four different cases:
(a)
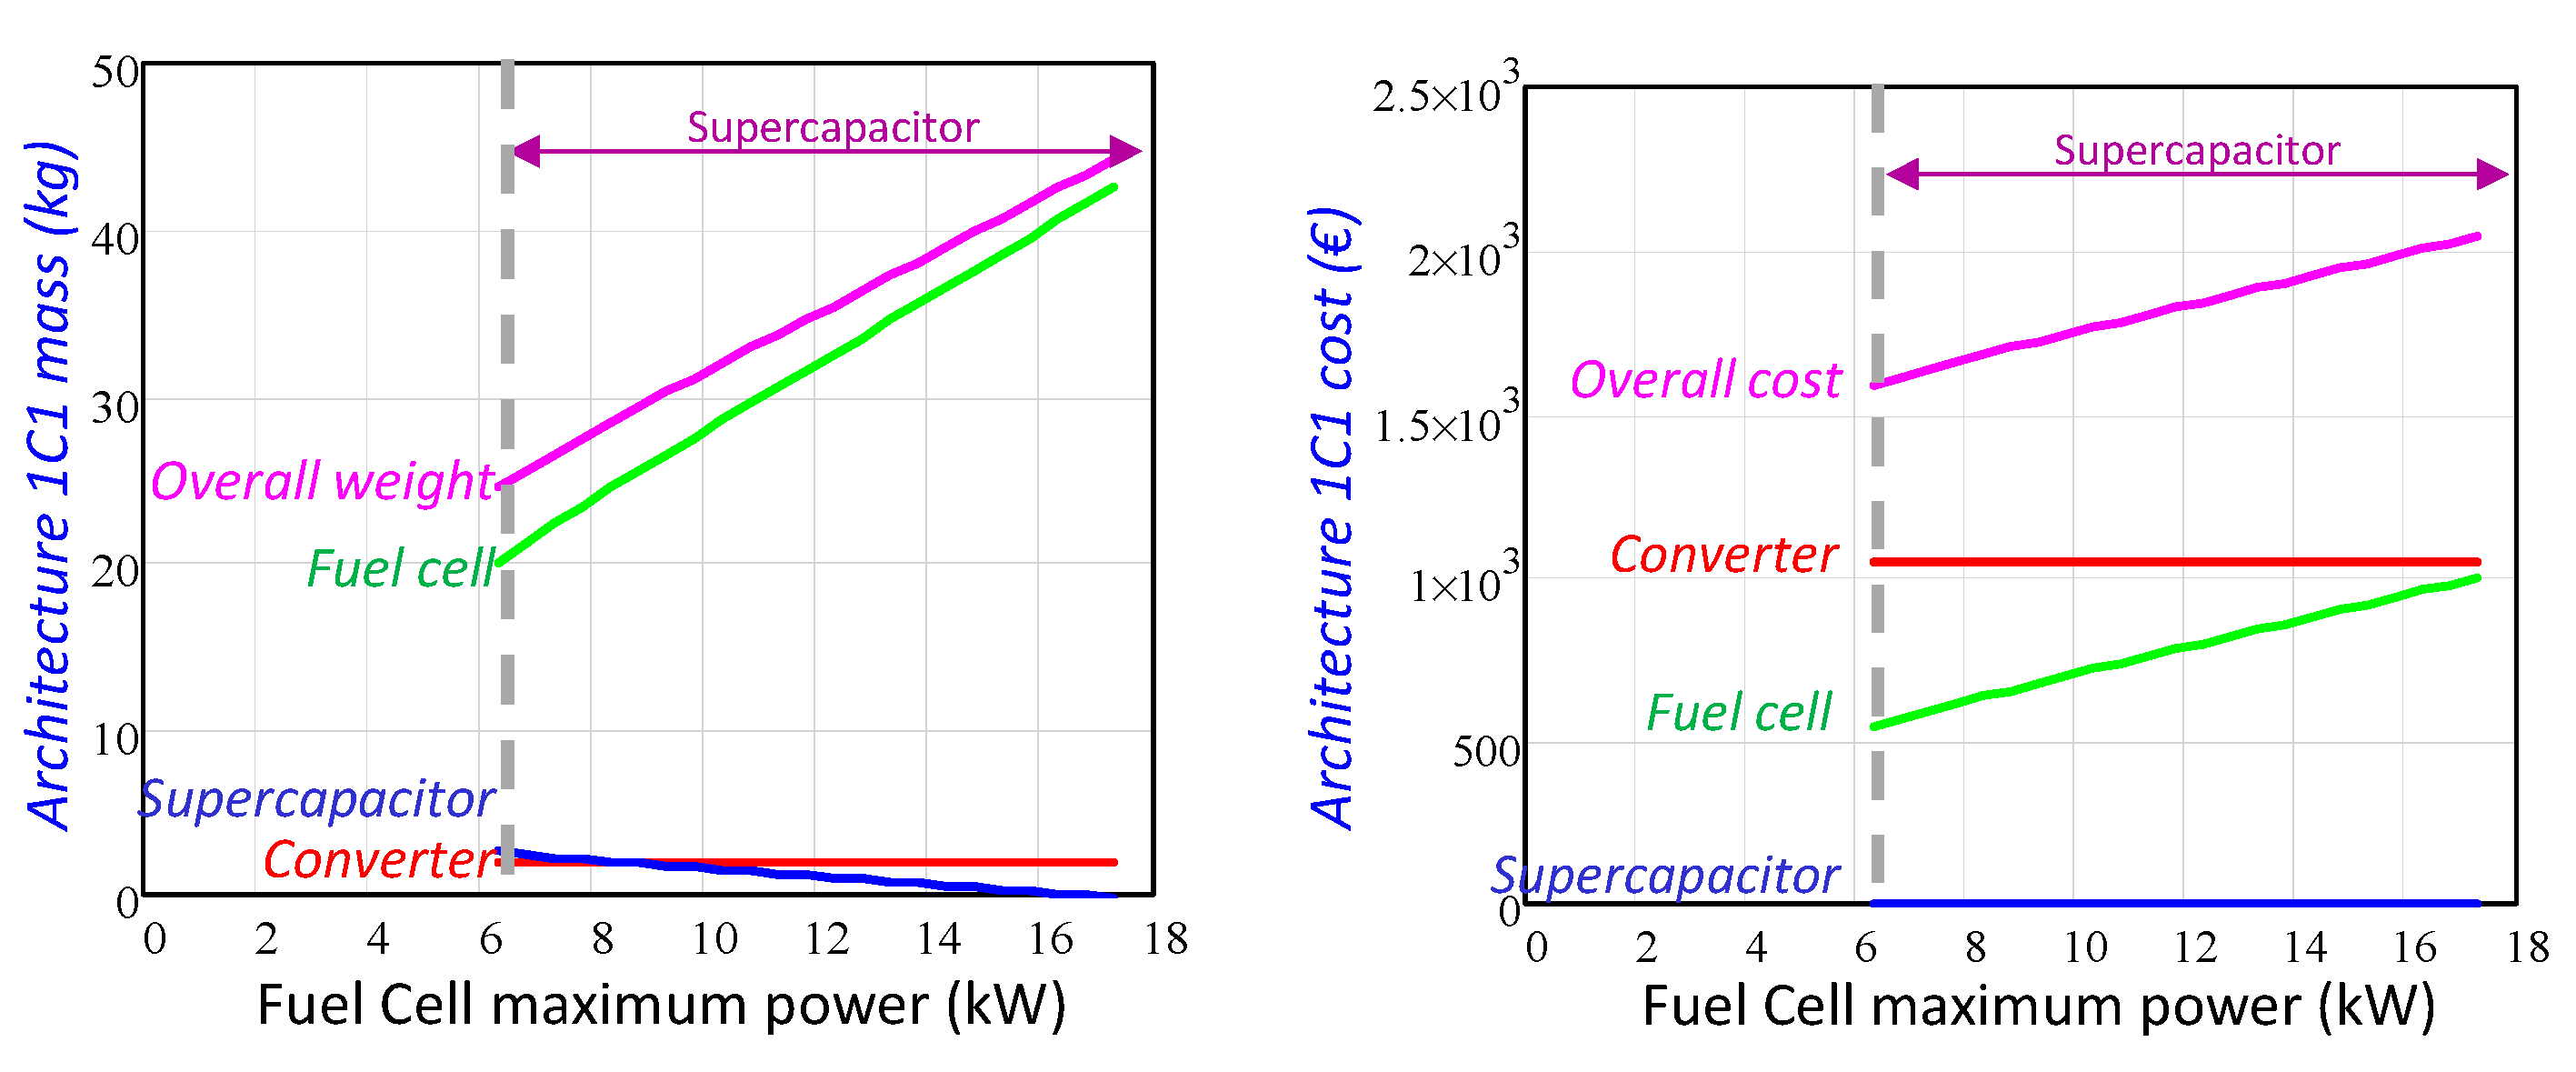
Architectures that implement only a unidirectional power converter, downstream of the fuel cell: 1B, 1C2 and 1BC. In these cases, the power converter mass and cost increases with the fuel cell maximum power, see Figure 10. The architecture 1C1 implements only a power converter, directly connected to the voltage bus. This power converter manages the maximum power since it is connected downstream of the set of supercapacitors. Its mass and cost are fixed independently of the fuel cell maximum power, as Figure 10 depicts.
(b)
The architectures 2B, 2C, 2BC and 3BC implement a unidirectional power converter downstream of the fuel cell, and one or more bidirectional power converters that manage the power difference between the load power requirement and the fuel cell delivered power.
(c)
The power required by the load is provided between all the power converters. Therefore, the power managed by the bidirectional power converters reduces as the maximum power provided by the fuel cell increases. Thus, the bidirectional power converters mass and cost decrease when the fuel cell maximum power increases, see Figure 10.
(d)
Finally, the architecture 3C implements a unidirectional power converter downstream of the fuel cell, another unidirectional power converter connected to the supercapacitors, and a bidirectional power converter that manages twice the energy difference between the load demanded power and the power delivered by the fuel cell. Then, the three power converter global cost and mass decrease as the fuel cell maximum power increases, as Figure 10 depicts.
In rough outlines, due to the cost of the power converters is proportional to their mass, the heaviest and most expensive power converters belong to architecture 3C, followed by the power converters of the architecture 3BC and 1C1. The power converters from architectures 2B, 2C and 2BC are less heavy, and finally, the lightest and cheapest power converters belong to architectures 1B, 1C2 and 1BC.

3.1.2. Batteries

As the power provided by the fuel cell increases, the requirements of the secondary energy sources diminish, and therefore their mass (14) and cost (19).
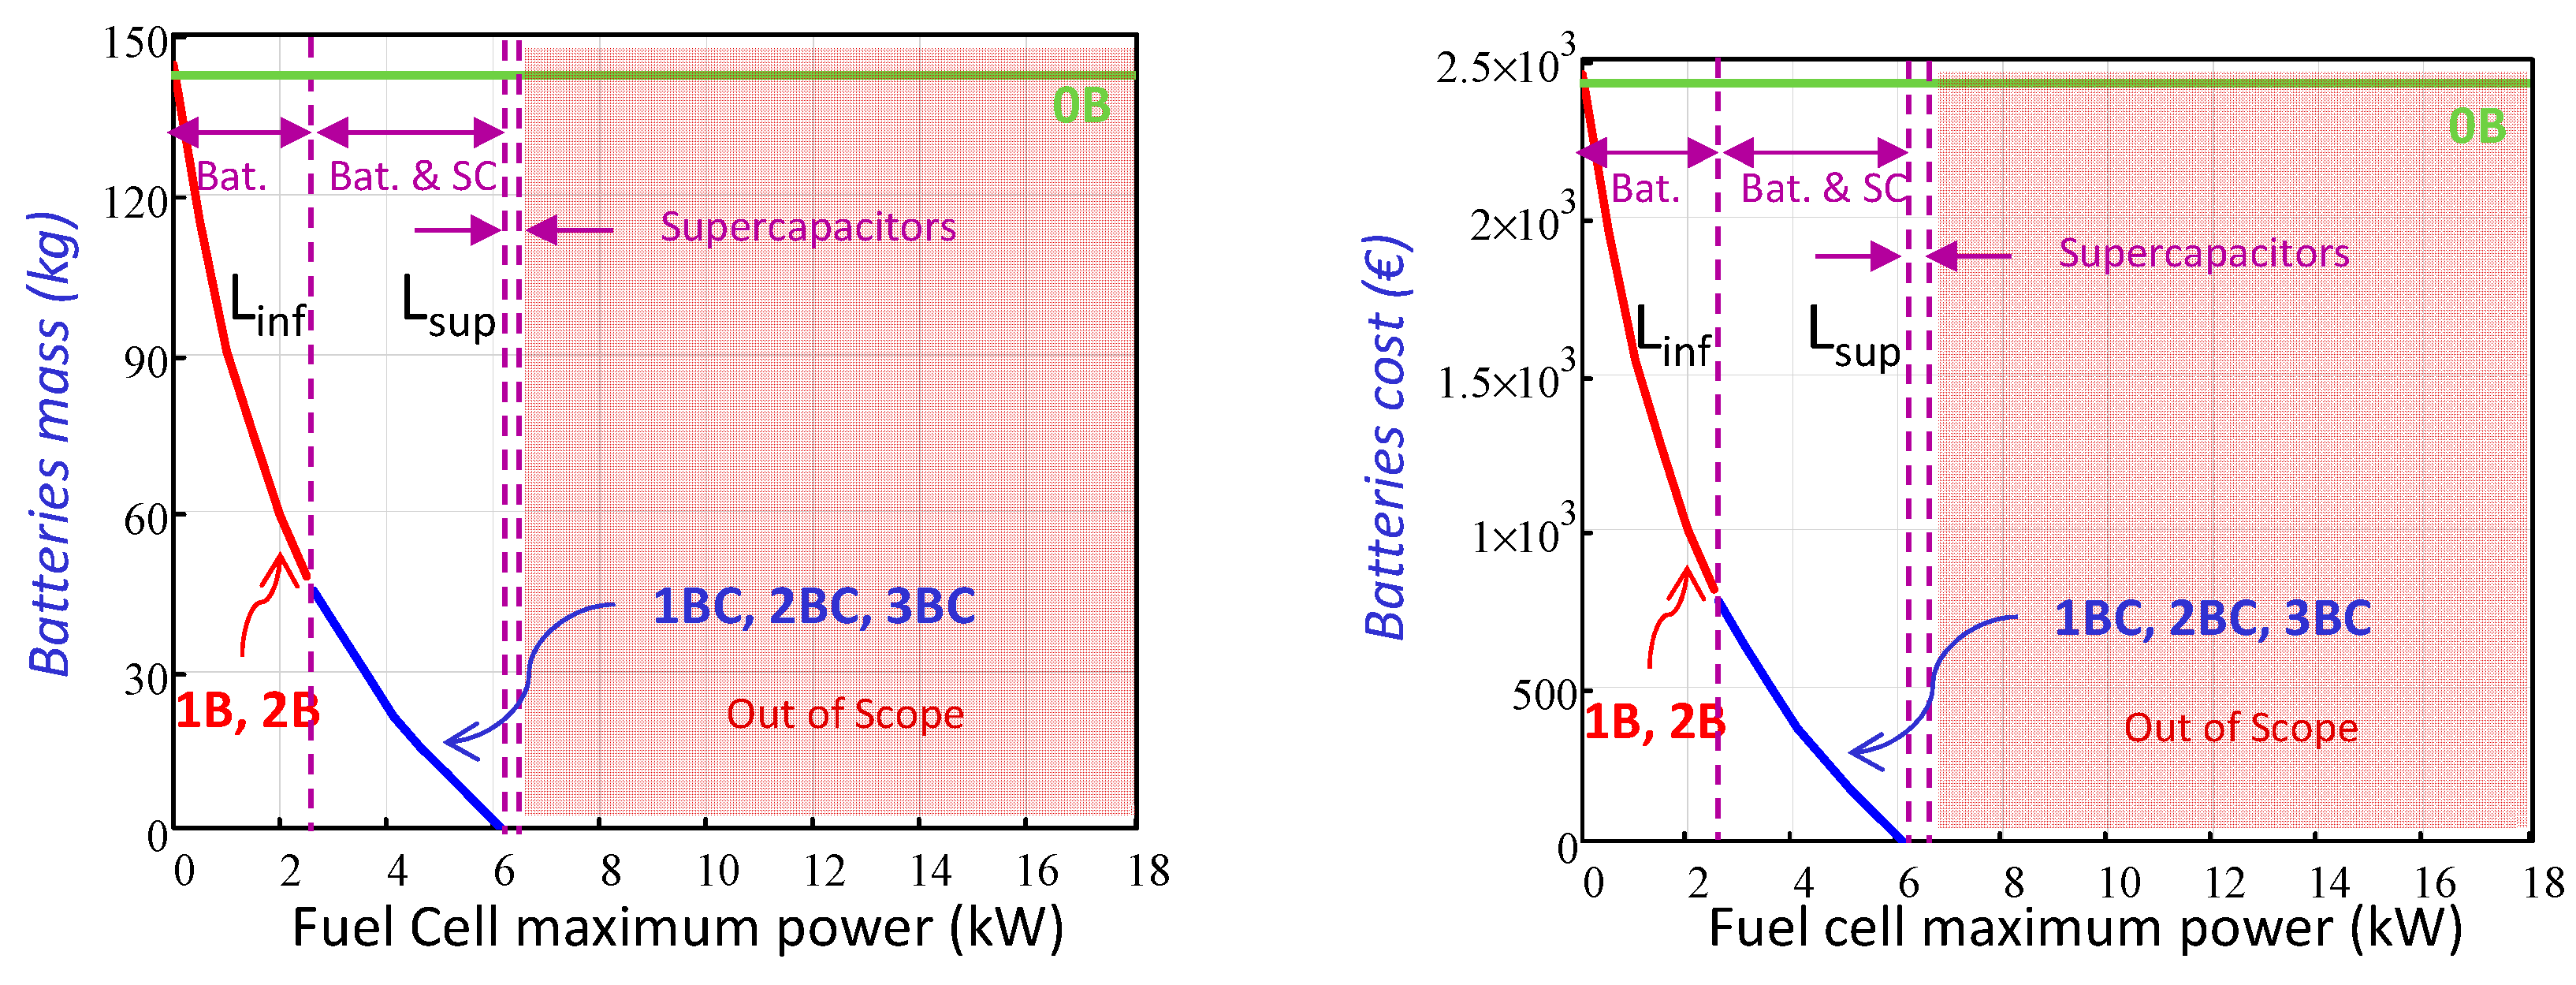
The architecture 0B battery mass is kept constant along the complete power range since it is the only energy source available to supply the maximum power demanded by the load, as depicted in Figure 11.
The state-of-charge (SoC) variation is the same independently of the batteries location within the architecture, ΔSoCBat = 0.75, to protect the batteries life. Hence, the batteries size evolution is the same in all the architectures that only implement batteries as a secondary energy source, 1B and 2B.
Depending on the power delivered by the fuel cell, the batteries mass of the different group of architectures (only batteries, batteries and supercapacitors), presents different and independent evolutions. Please note that Figure 11 includes both power boundaries that define the power range in which each combination of secondary sources is optimum.
Figure 11 shows that the mass and cost of the batteries are the same for those architectures such as 1B, and 2B in the region in which only batteries are recommended. Analogously, the mass and cost of the batteries of architectures 1BC, 2BC and 3BC in the region in which batteries and supercapacitors are recommended, are the same too.
Finally, it observes in Figure 11 a soft transition of both the batteries mass and the cost evolution from the lower power region toward the intermediate power region.

3.1.3. Supercapacitors

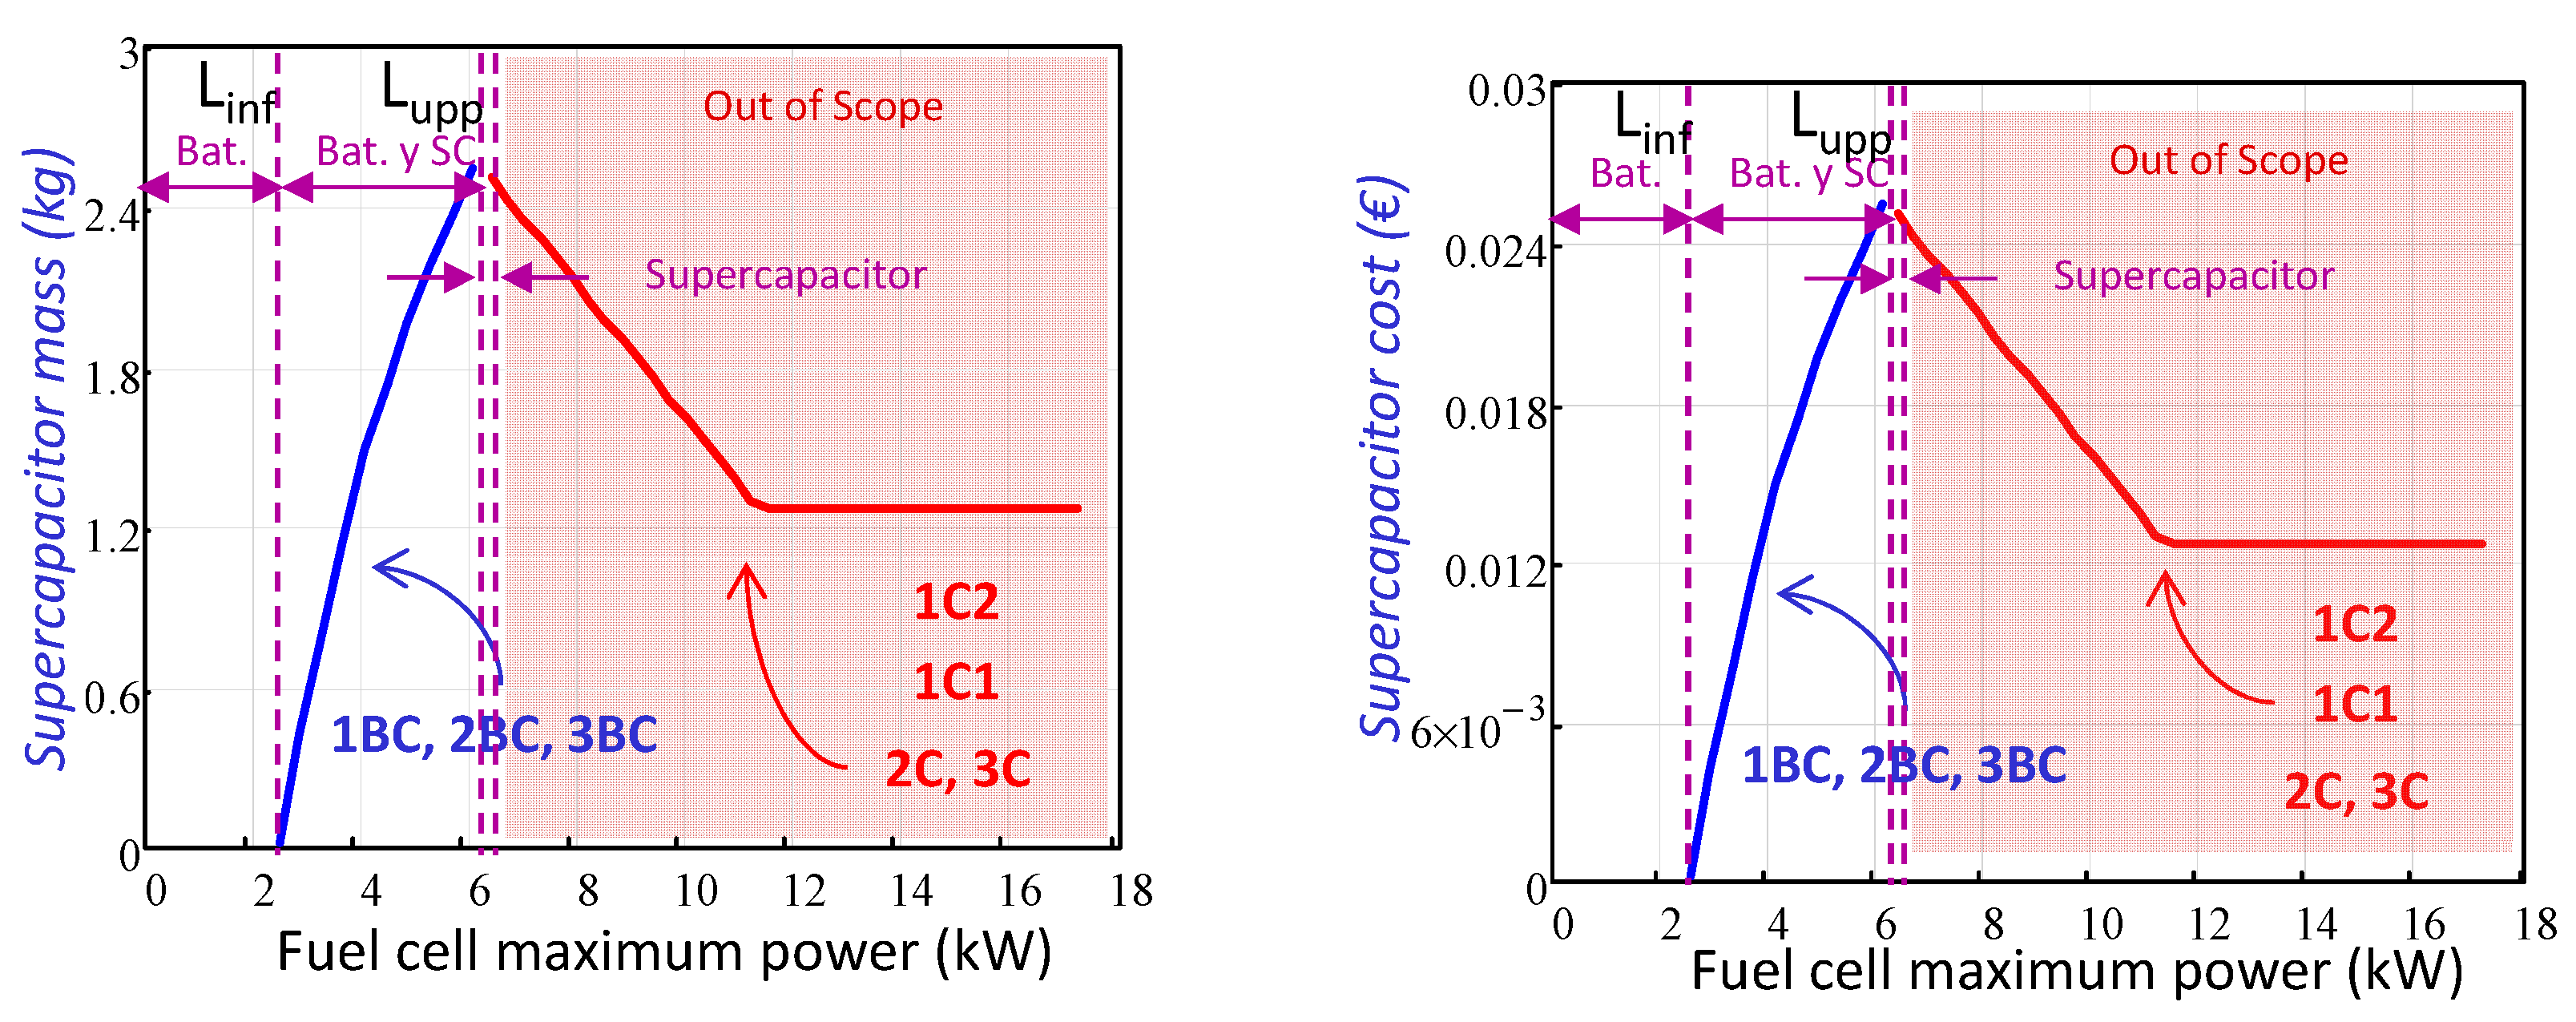
The mass (15) and cost (18) of the supercapacitors is smaller if the fuel cell maximum power increases.
The supercapacitors present different allowed voltage variation, depending on their placement within the architecture. This voltage variation leads to a different maximum state-of-charge for each architecture (27).
Δ S o C = v i 2 v f 2 v i 2  
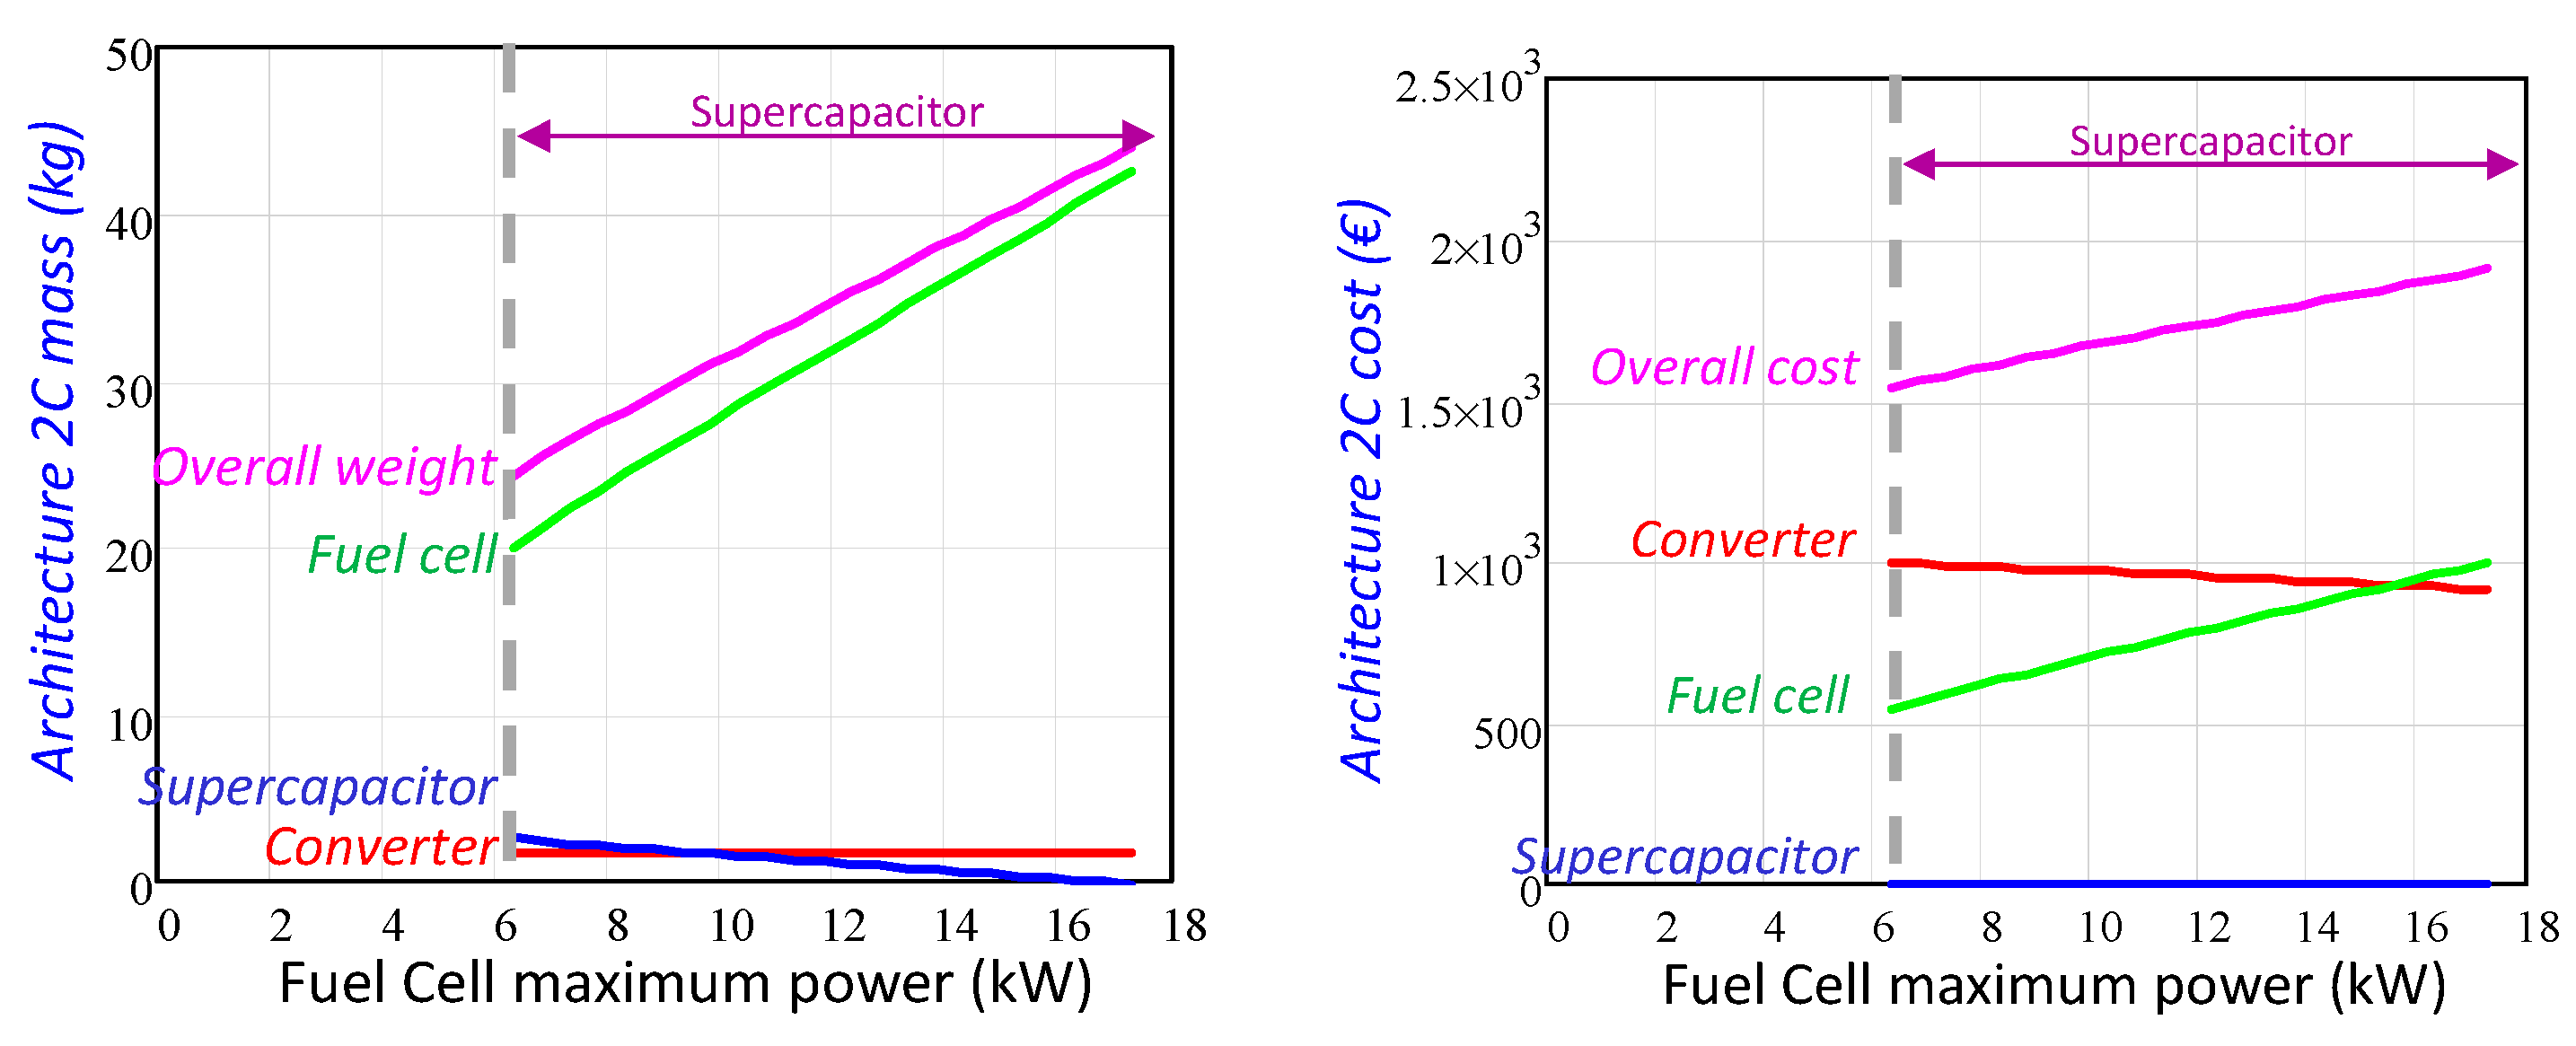
The heaviest supercapacitors belong to architecture 1C2 because they are located directly in parallel with the voltage bus, and therefore their state-of-charge increment is the smallest, only 18.5%, which corresponds with a maximum and minimum voltage of 72 V and 65 V. The following architecture with the heavier supercapacitors is 1C1. Those supercapacitors locate between the fuel cell and the power converter downstream of the fuel cell, so their state-of-charge variation is 49%, corresponding to 43 V and 31 V. Finally, the supercapacitors used in the architectures 2C and 3C are the smallest, since they are connected to the voltage bus using a bidirectional power converter, and so their state-of-charge variation is the biggest, 75%. In this last case, the maximum and minimum voltage values are, respectively, 40 V and 20 V.
Figure 12 shows the supercapacitors mass depending on the delivered maximum power by the fuel cell. In the power range delimited by the lower and upper power limits, the use of batteries and supercapacitors are the best option. In that intermediate power range, the proper ratio between them is given by (16), and as shown in Figure 7, as the fuel cell delivered maximum power increases, the battery mass decreases, see Figure 11, and the supercapacitor mass increases, see Figure 12.
Finally, from the upper power limit onward, the use of only supercapacitors is recommended. Notice that the power and energy load requirements are very low, and they continue decreasing, as the fuel cell maximum power increases. That is the reason why the supercapacitor mass decreases along with the fuel cell maximum power.

3.2. Architectures Global Analysis

Once the behaviour of all the subsystems has been described regarding mass and cost, the overall system mass and cost evolution against the fuel cell delivered maximum power is analysed. For the analysis, the architectures have been classified attending to the kind of secondary energy source: architectures that only use batteries, architectures that use batteries and supercapacitors, and finally architectures that use only supercapacitors.

3.2.1. Architectures with Only Battery as an Auxiliary Power Source

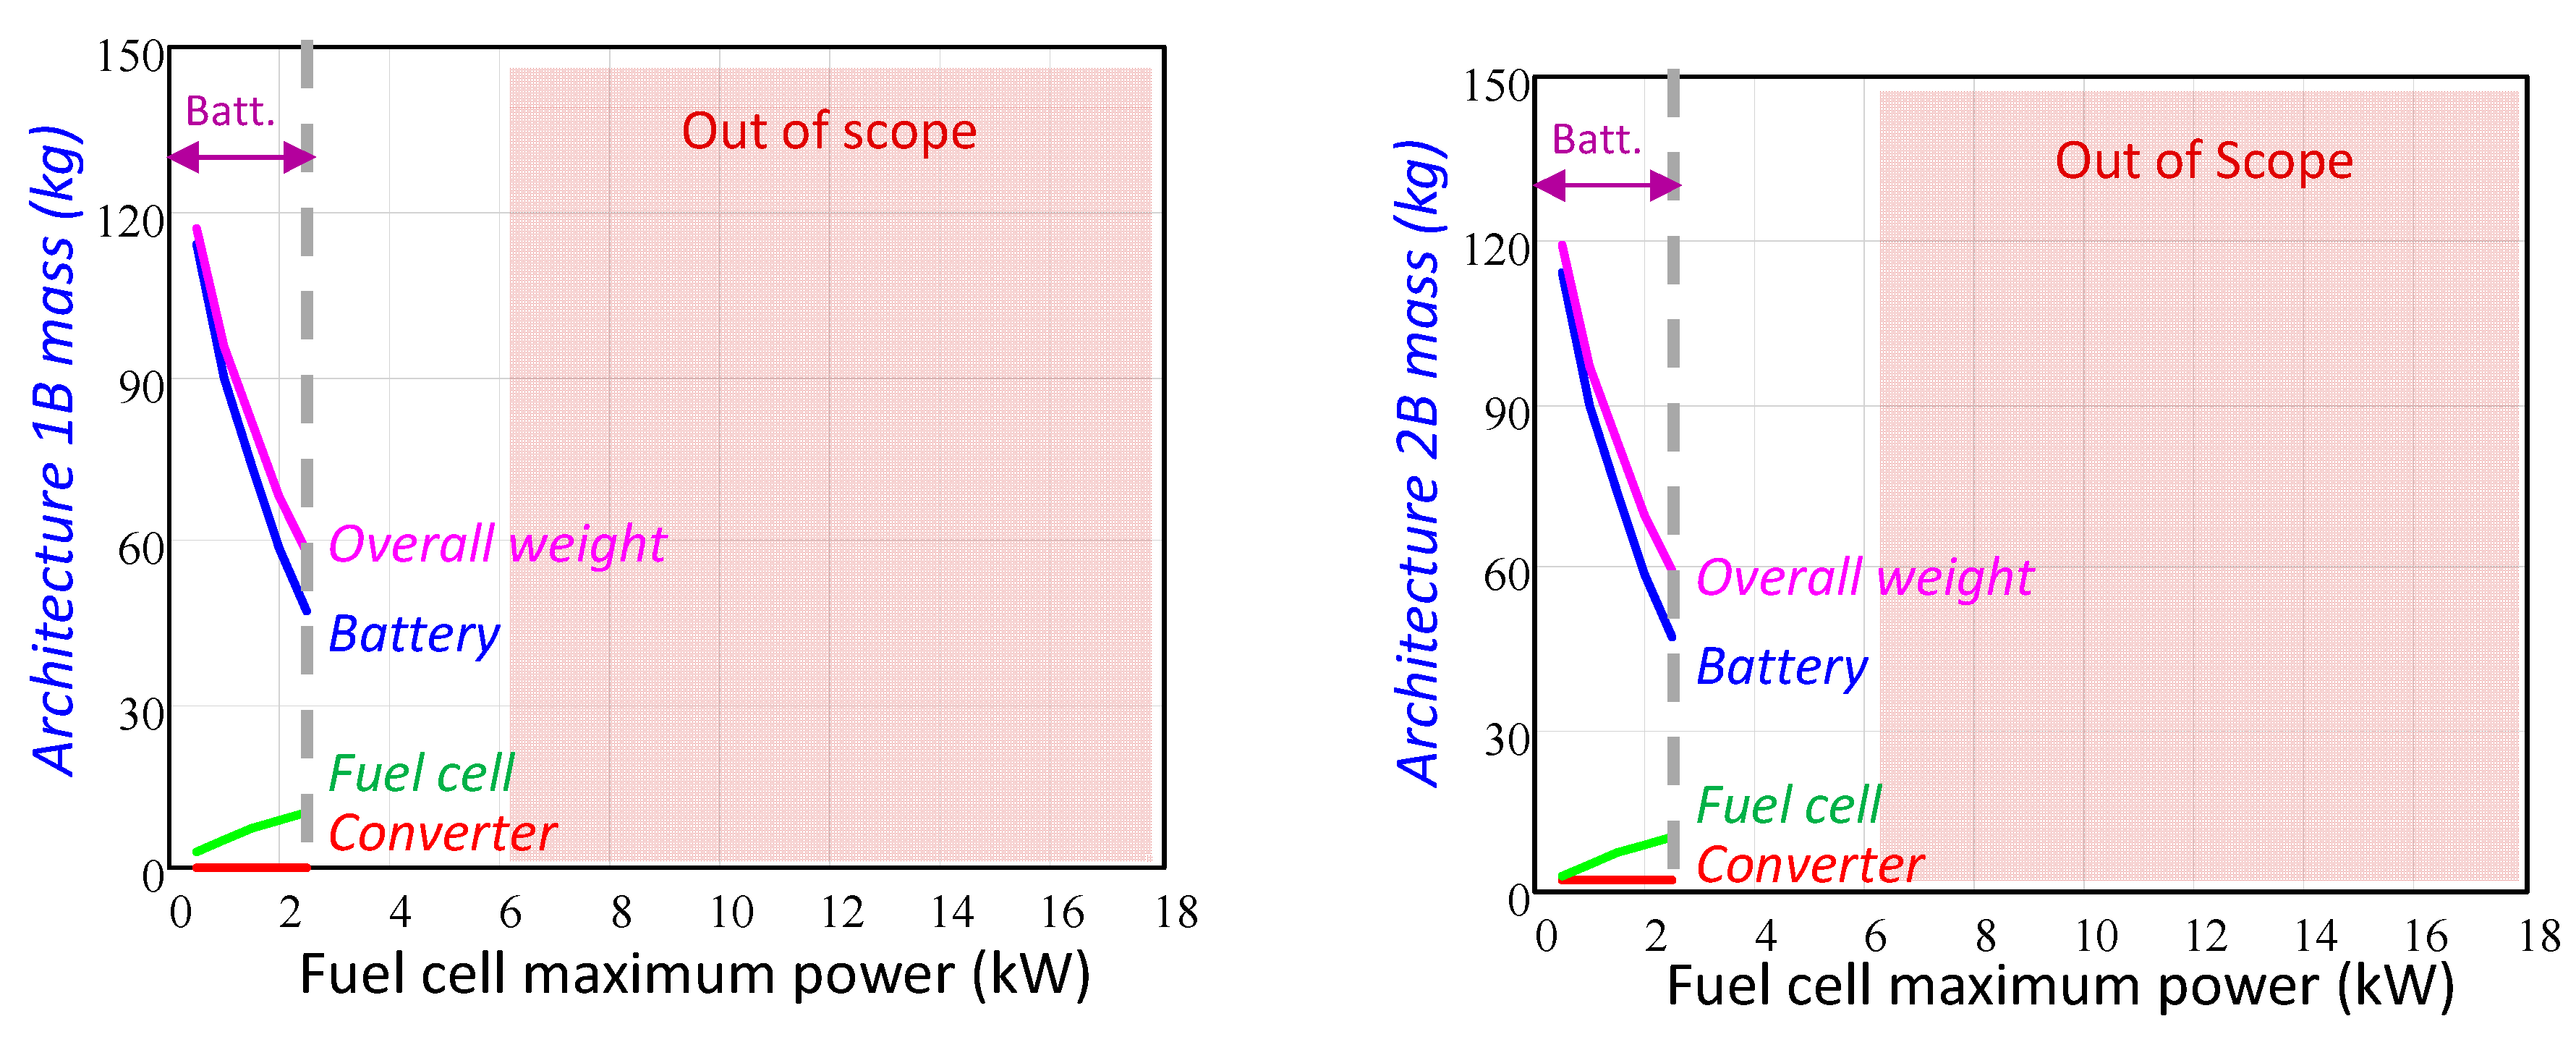
Regarding mass, the power converters of architectures 1B and 2B constitute the less significant contribution to the overall architecture mass, while the mass of the fuel cell and the batteries are the most significant contributions, as depicted in Figure 13. Therefore, although the power converters mass is different since the fuel cell and the batteries are the same in both cases, there is very little difference between the overall mass of architectures 1B and 2B.
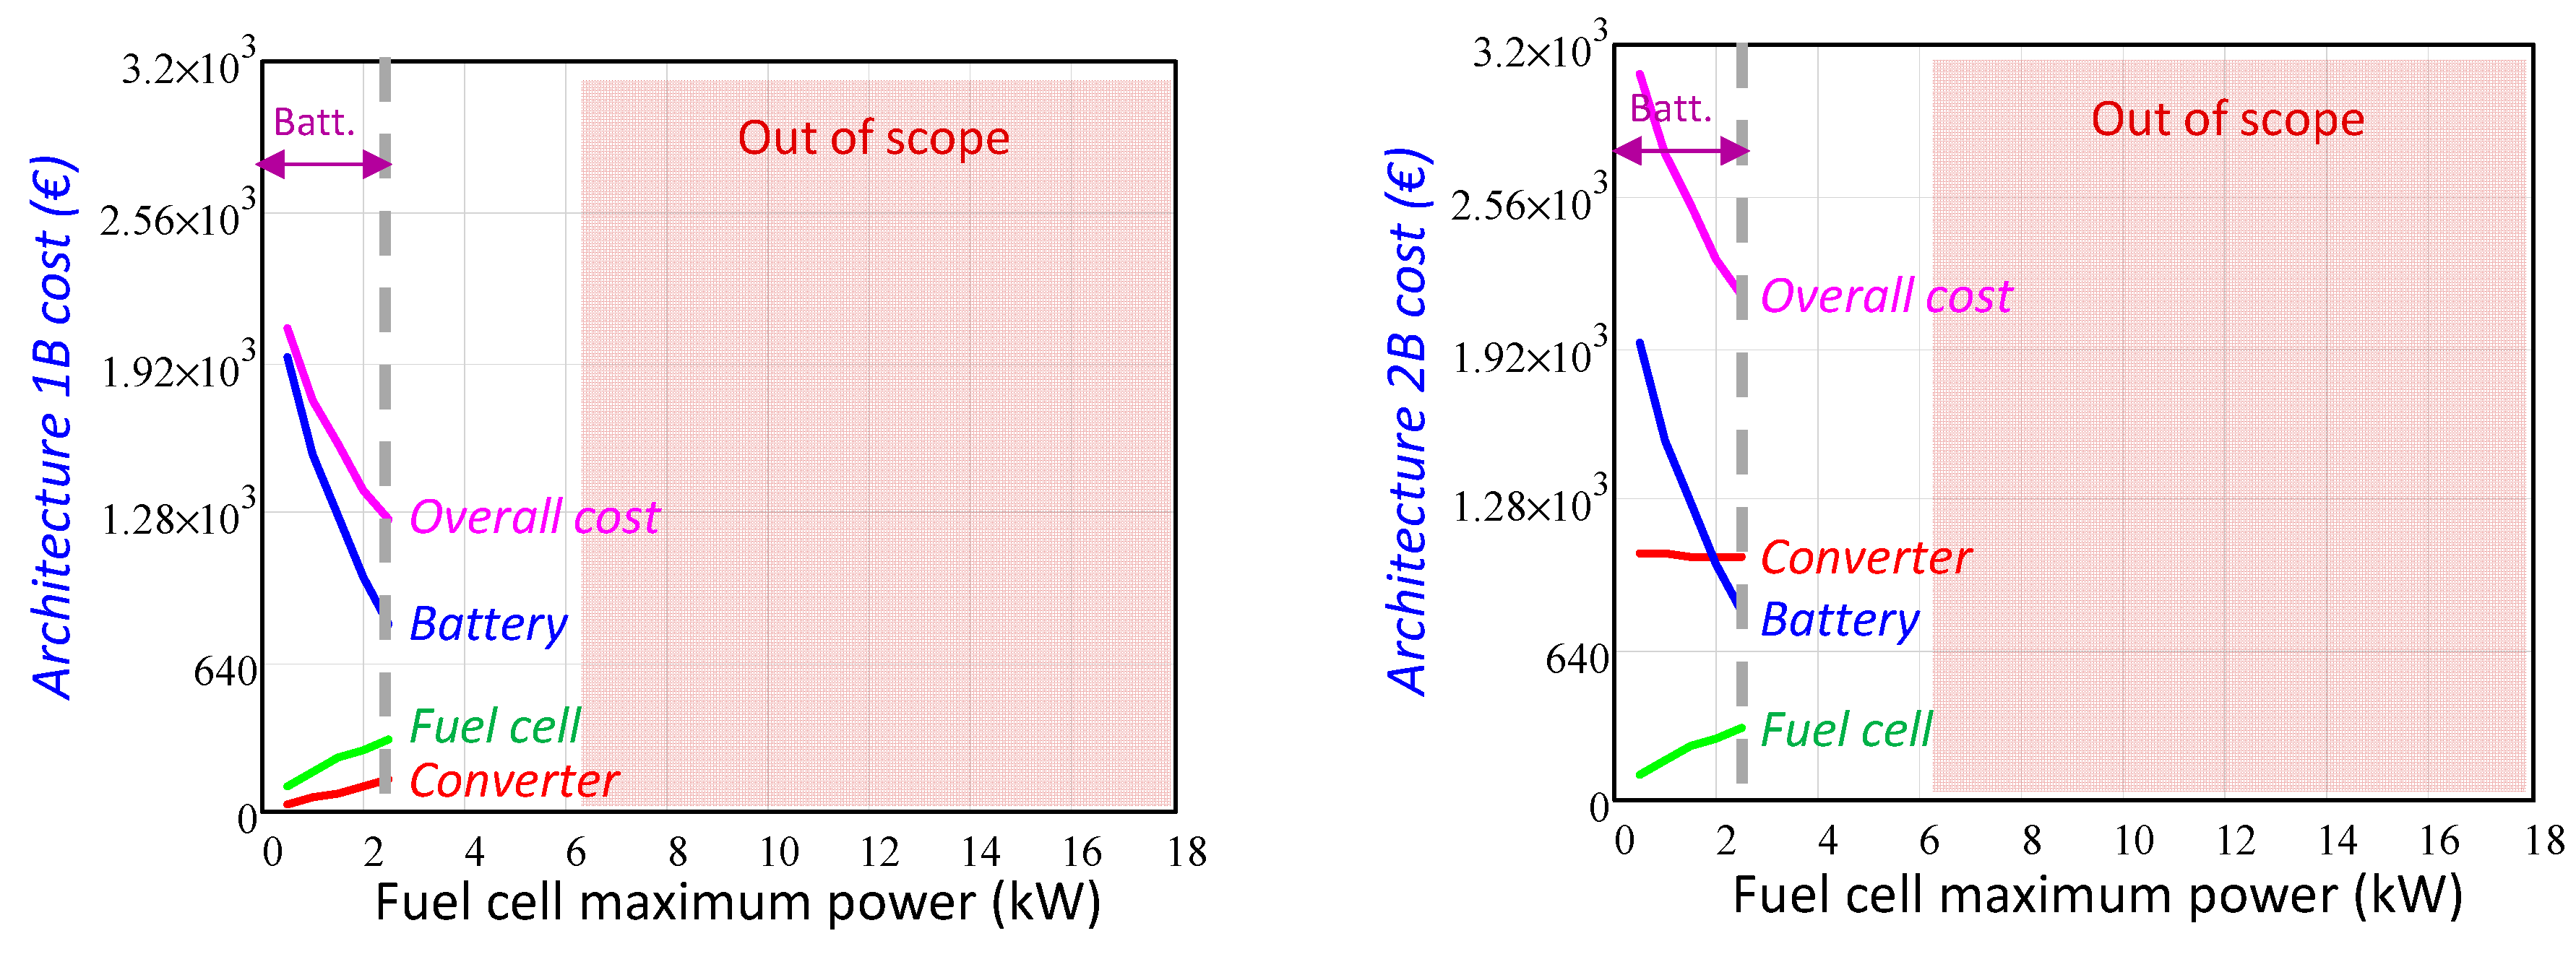
Regarding the overall cost, it depends strongly on the batteries cost, as seen in Figure 14. The architectures 1B and 2B cost evolution decrease as the fuel cell maximum power increases, and therefore both architectures present their minimum cost value at the lower power limit, 2.5 kW in this case. Regarding the cost of the architecture 2B, it presents a more significant cost value due to the second power converter cost.

3.2.2. Architectures with Battery and Supercapacitors as an Auxiliary Power Source

The optimised calculus of the secondary energy sources total-mass determines the energy storage systems behaviour. It is important to remember that the recommended use of architectures that combine both batteries and supercapacitors is in the power range delimited by the lower and upper power range, from 2.5 kW to 6.2 kW.
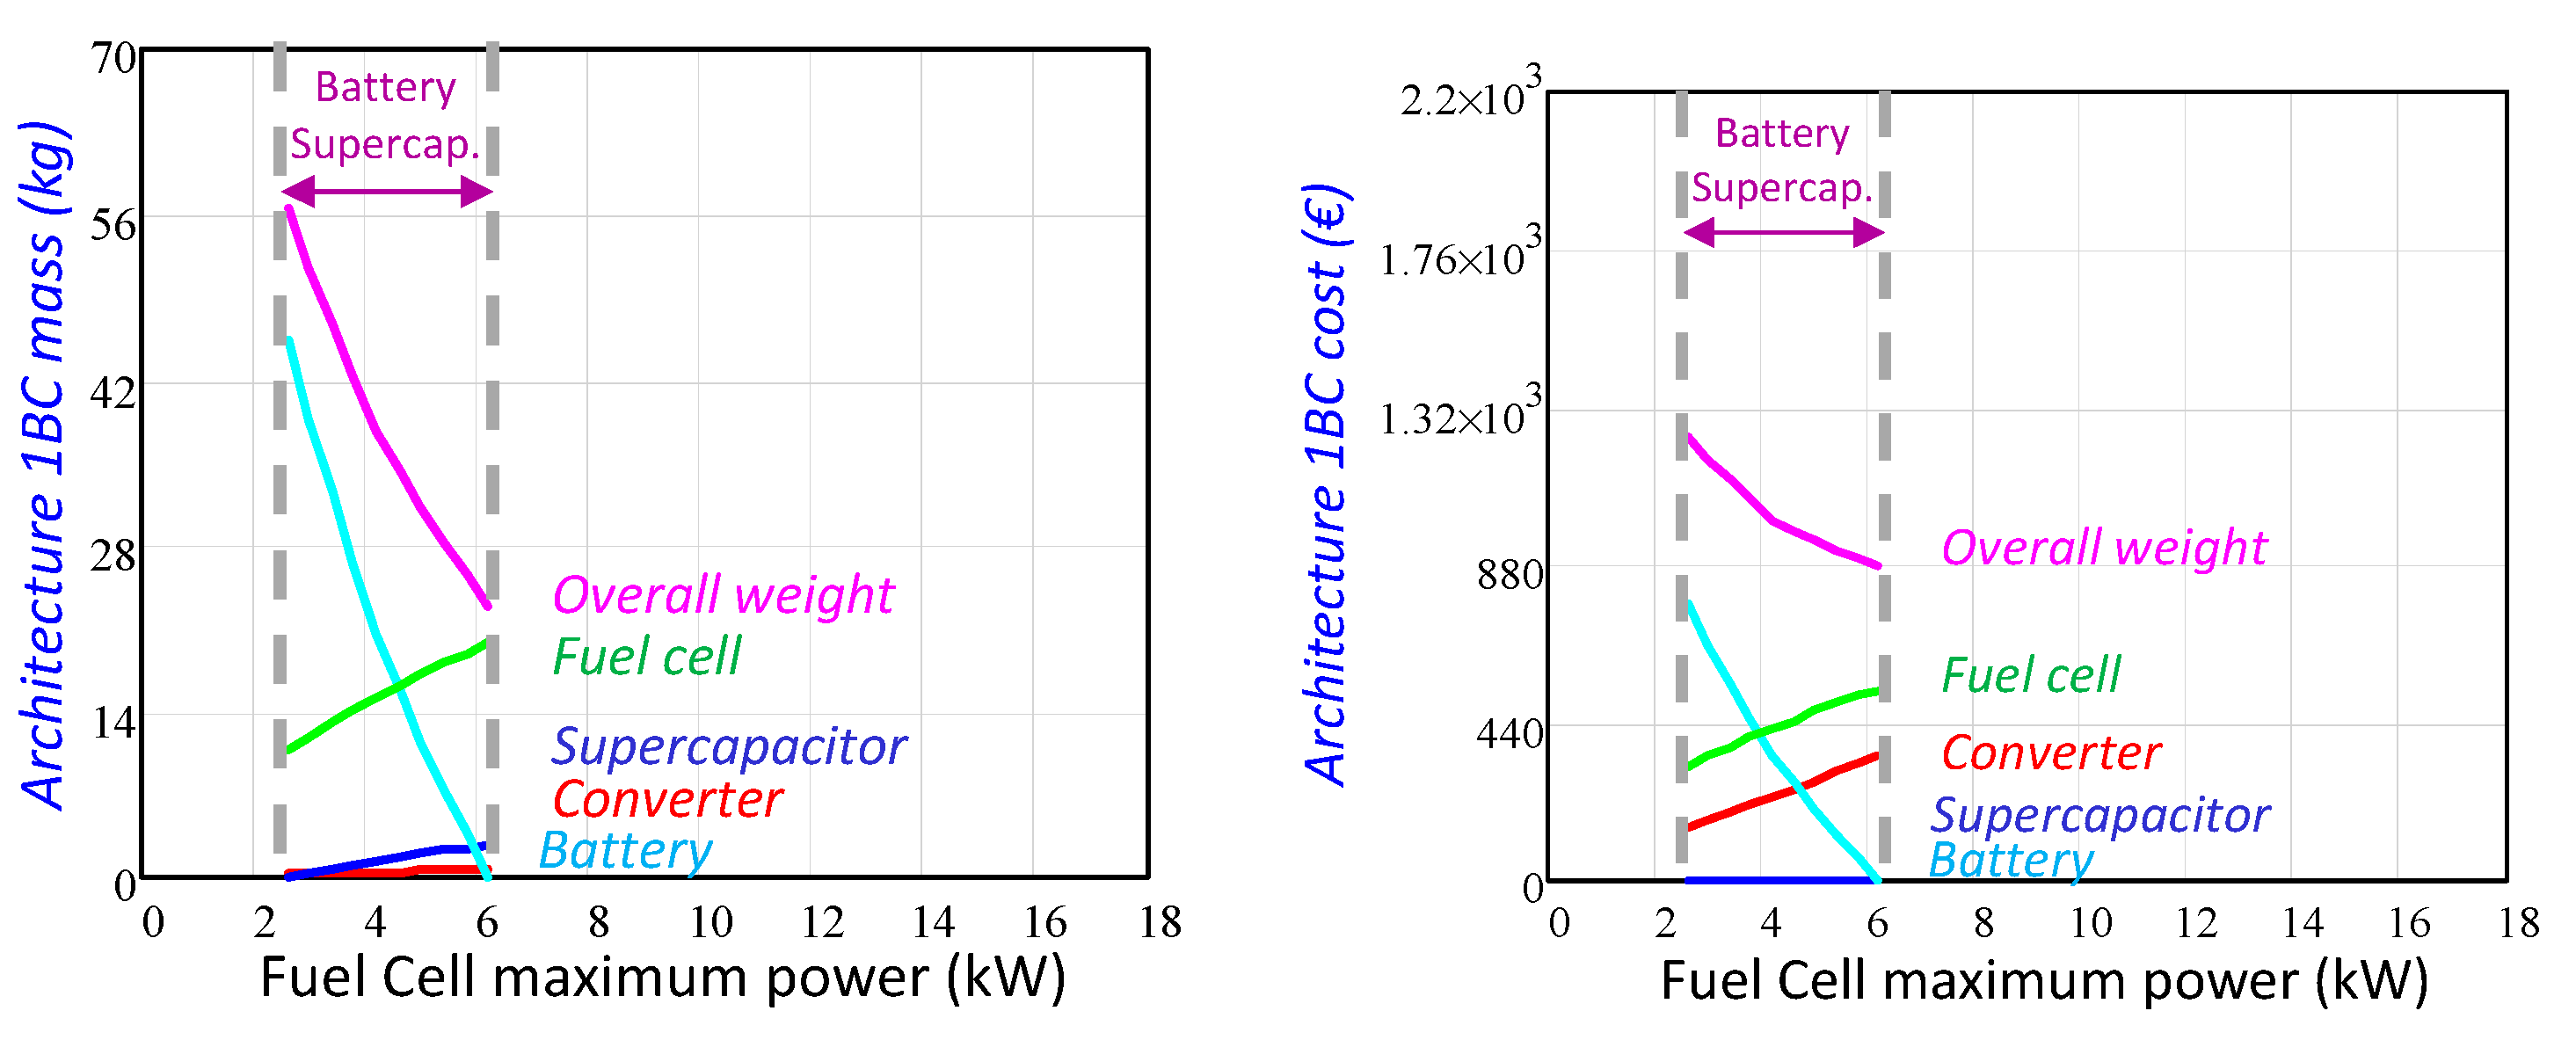
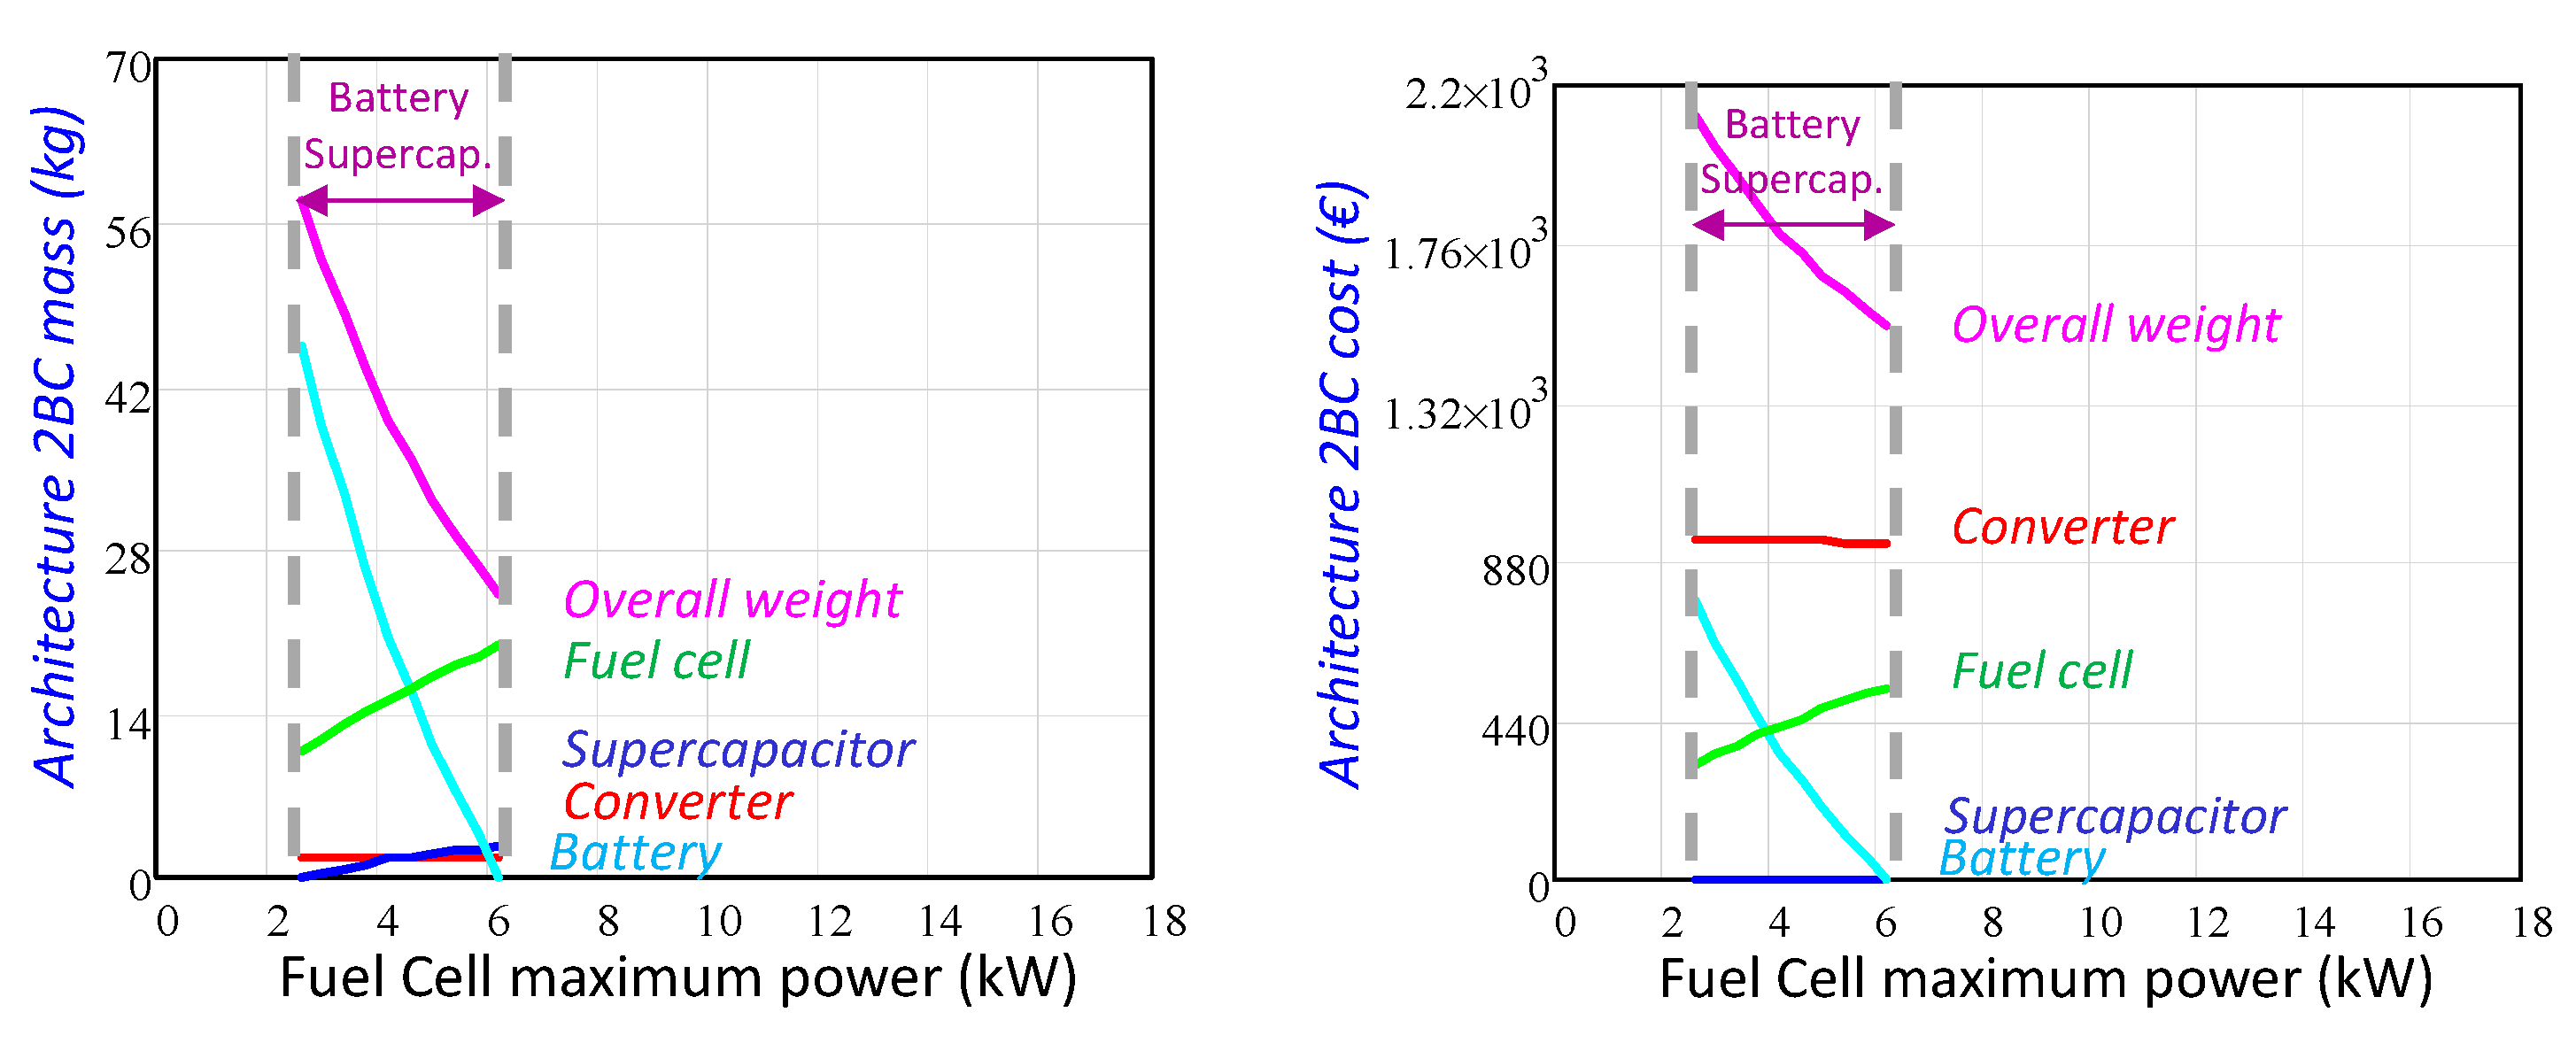
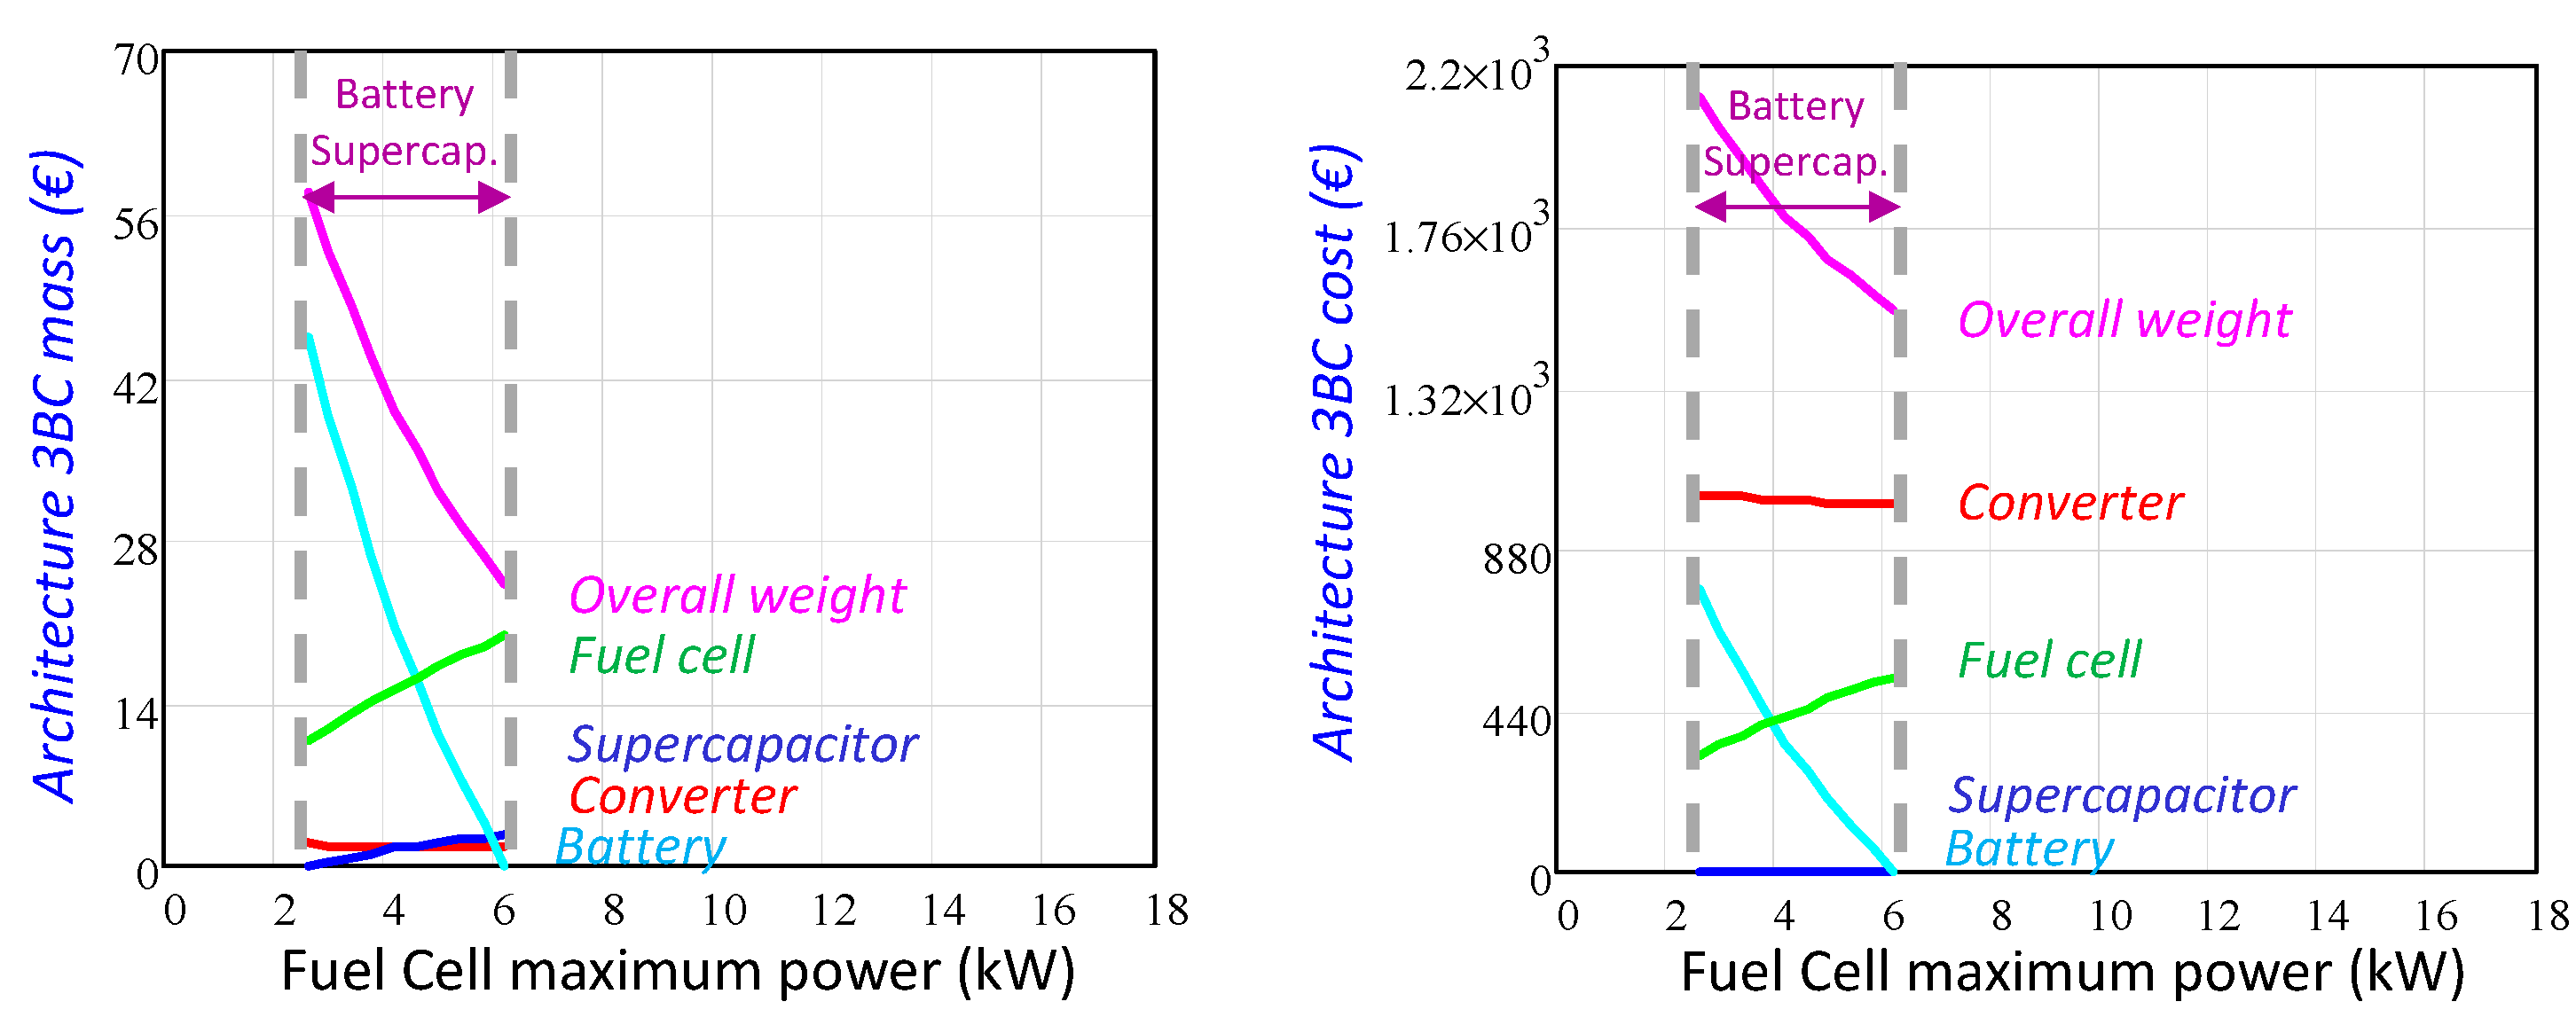
It can be seen in Figure 15, Figure 16 and Figure 17 that the mass evolution of the architectures 1BC, 2BC and 3BC presents their minimum value at the upper power limit; it means a Fuel Cell with 6.2 kW. It is because the fuel cell mass variation is more significant than the mass variation of both secondary energy sources and power converters.
The minimum cost of the architectures 1BC, 2BC and 3BC happen at the upper power limit, 6.2 kW, as depicted in Figure 15, Figure 16 and Figure 17. The main difference between them comes from the number of implemented power converters, since the fuel cell, battery and supercapacitor costs are almost equal. Finally, the architecture 1BC has the lowest cost due to the use of only one power converter.

3.2.3. Architectures with Only Supercapacitors as an Auxiliary Power Source

Along with the fuel cell maximum power, the mass of this kind of architectures depends on the supercapacitor state-of-charge variation, as it can be seen in Figure 18, Figure 19, Figure 20 and Figure 21. However, in the suggested power range of design (6.2 kW–17 kW), the architectures mass is imposed by the fuel cell mass.
Regarding the overall architectures cost, it is strongly dependent on the power converters cost, since the fuel cell cost grows as the fuel cell maximum power increases and it is the same for all the compared architectures, and the cost of the supercapacitors has a minor influence.
As it shows in Figure 18, Figure 19, Figure 20 and Figure 21, the most significant cost-growing slope corresponds to architecture 1C2. Following goes the architecture 1C1, and finally, the architectures 2C and 3C. In this last one (3C) the power converter cost decrement is greater than the fuel cell cost increment, and then the overall cost presents a negative slope as the fuel cell maximum power grows.

3.3. Comparative Analysis of The Architectures

The mass of the propulsion system along with the hydrogen storage tank constitutes the 15–35% of the overall vehicle mass [48].
Thus, given the characteristics of the vehicle considered, the maximum allowed mass of the powertrain is usually between 120 kg and 280 kg. Regarding this limitation, it should be remarked that the mass of all the architectures considered is below the abovementioned limit within their corresponding optimum power design range, as shown in Figure 22. Regarding volume, the evolution of the size of the architectures as a function of the fuel cell maximum power depicts in Figure 22. It is noticed that the volume evolution is analogous to that of the mass.
Figure 22 shows the mass, cost and volume evolution of the ten analysed propulsion systems. The power propulsion architectures associate by attending the nature of their secondary energy sources (batteries, batteries and supercapacitors, and supercapacitors).
In Section 2 A and B, the use of only batteries is suggested for the lower levels of the fuel cell maximum power since the load energy requirement determines the secondary energy sources total mass. Then, the architectures that only implement batteries as a secondary energy source are recommended for power levels below the lower power limit, 2.5 kW.
Analogously, the use of batteries combined with supercapacitors is recommended for the middle range of fuel cell maximum power. In this power range, the total mass of auxiliary sources is determined by both the load power and load energy requirements. Then, the architectures that implement both batteries and supercapacitors are recommended for fuel cell maximum power from the lower power limit, 2.5 kW, until the upper power limit, 6.2 kW.
Finally, the use of only supercapacitors as secondary energy sources is suggested for the higher levels of the fuel cell maximum power, due to the total mass of secondary energy sources is imposed by the load power requirement. Then, the architectures that only implement supercapacitors are recommended for power levels above the upper power limit onwards, 6.2 kW.
In the case of architectures that use only batteries, their minimum mass locates at the lower power limit, 2.5 kW. That mass is lower than the mass of the pure battery vehicle propulsion system 0B. From this group of architectures, 1B is the recommended due to its minimal cost.
The three architectures that combine the use of batteries and supercapacitors present almost the same mass and their minimum value locate at the upper power limit, 6.2 kW. This mass is lower than the minimum mass of the architectures based on the only use of batteries. The most interesting architecture is 1BC, which has a cost lower than the architecture 1B from the previously analysed group.
The supercapacitor based architectures present the minimum mass value at the upper power limit, 6.2 kW. This value is very similar to the minimum mass of the architectures that use batteries and supercapacitors. The cheapest architecture is 1C2, which cost is the lowest among all the considered architectures.
It concludes that the best solution could be the architecture 1BC or 1C2 at the upper power limit 6.2 kW. It is remarkable that these mass, cost and volume values have been obtained attending to the data in Table 1 and Table 2, and therefore, depending on the technology evolution these results are susceptible to change. Finally, this analysis has been carried out considering a light vehicle under urban driving cycle conditions; therefore, if the driving cycle or the vehicle features are different, a new analysis must be performed by applying the same described procedure.

4. Experimental Validation

With the aim of validating experimentally the optimal sizing methodology presented along this paper, the power distribution architecture 1B, shown in Figure 9, has been selected. A laboratory prototype has been developed, applying a scale factor of 1:10 to the load power profile from Figure 1. Therefore, the peak power demanded by the load is 1.6 kW. Applying the sizing methodology presented along this paper, and considering a maximum state-of-charge variation of 40%, the maximum power delivered by the fuel cell is 250 W, the battery capacity is 12 Ah, and the nominal DC bus voltage is 72 V.
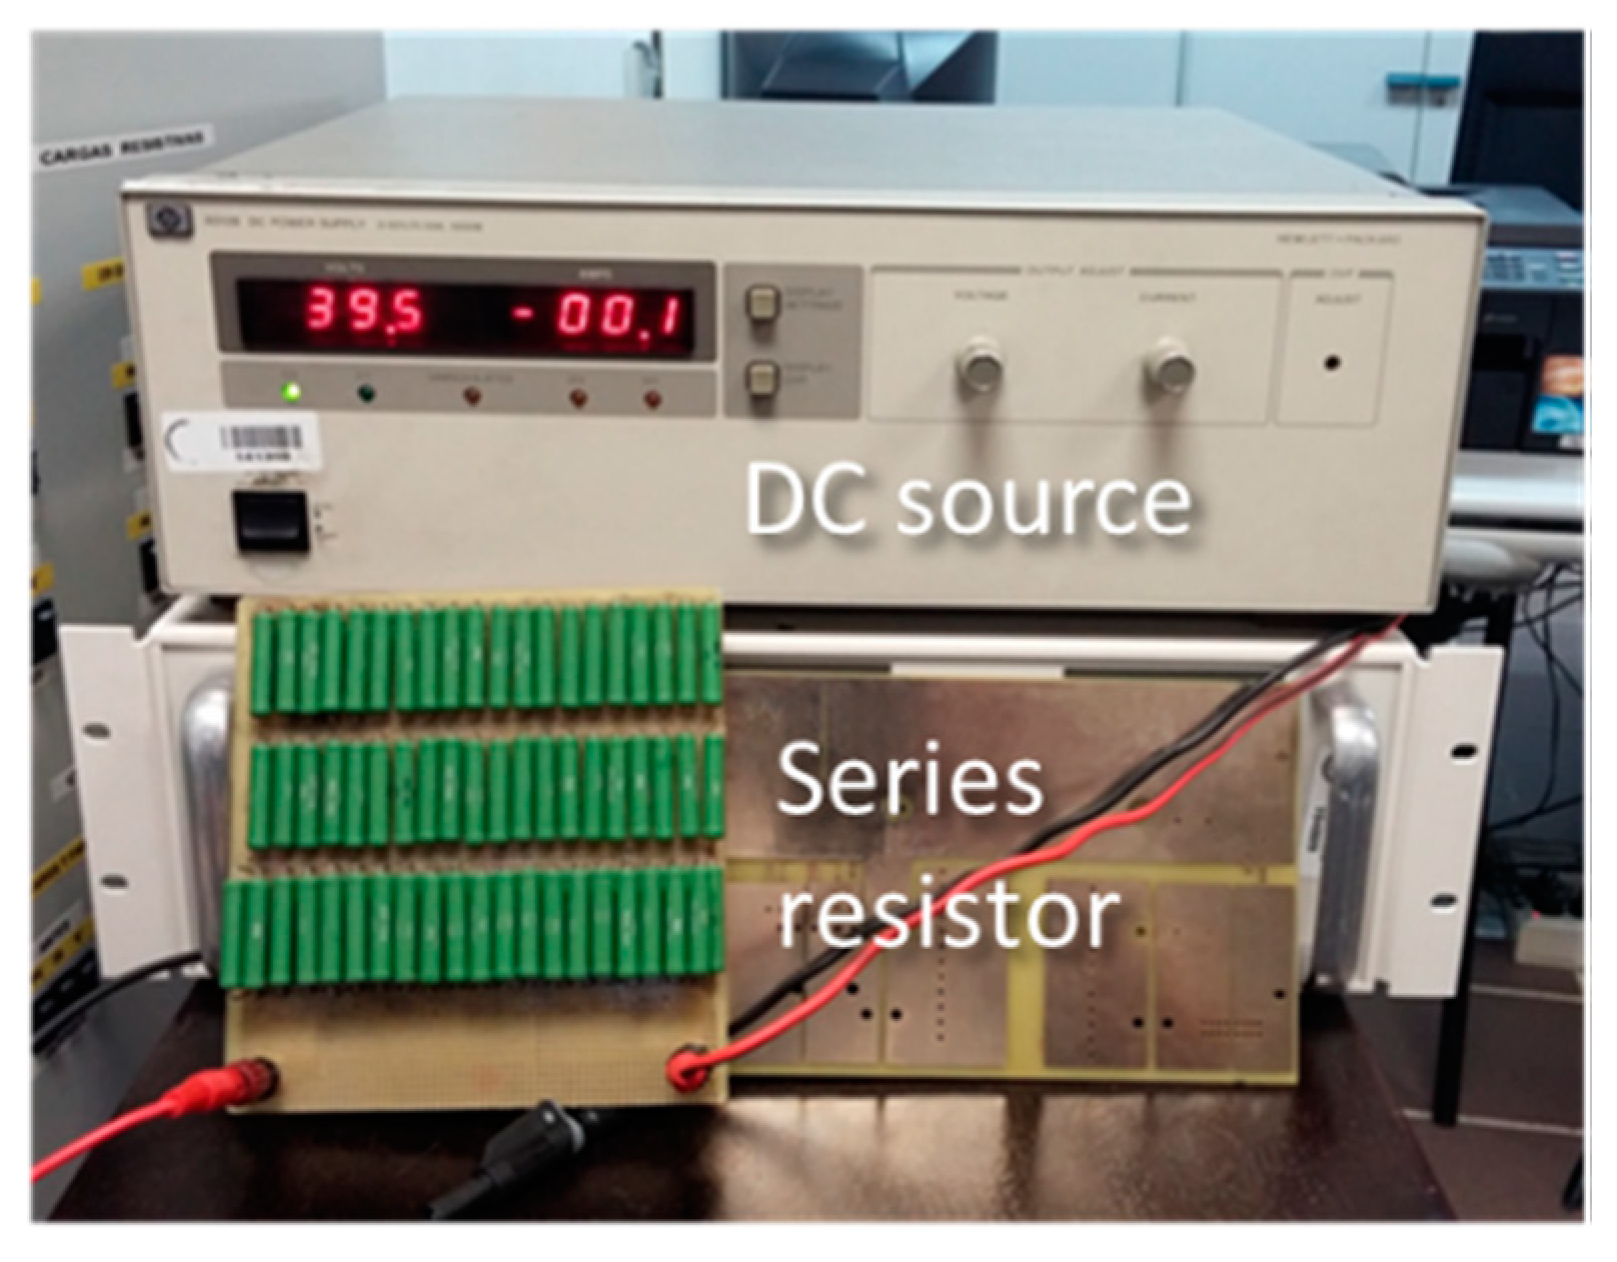
The fuel cell system, corresponding to the fuel cell Nexa Ballard 1.2 kW, has been emulated using the DC source HP 6012B, together with a series resistor of 250 mΩ to reproduce the fuel cell static behaviour, see Figure 23.
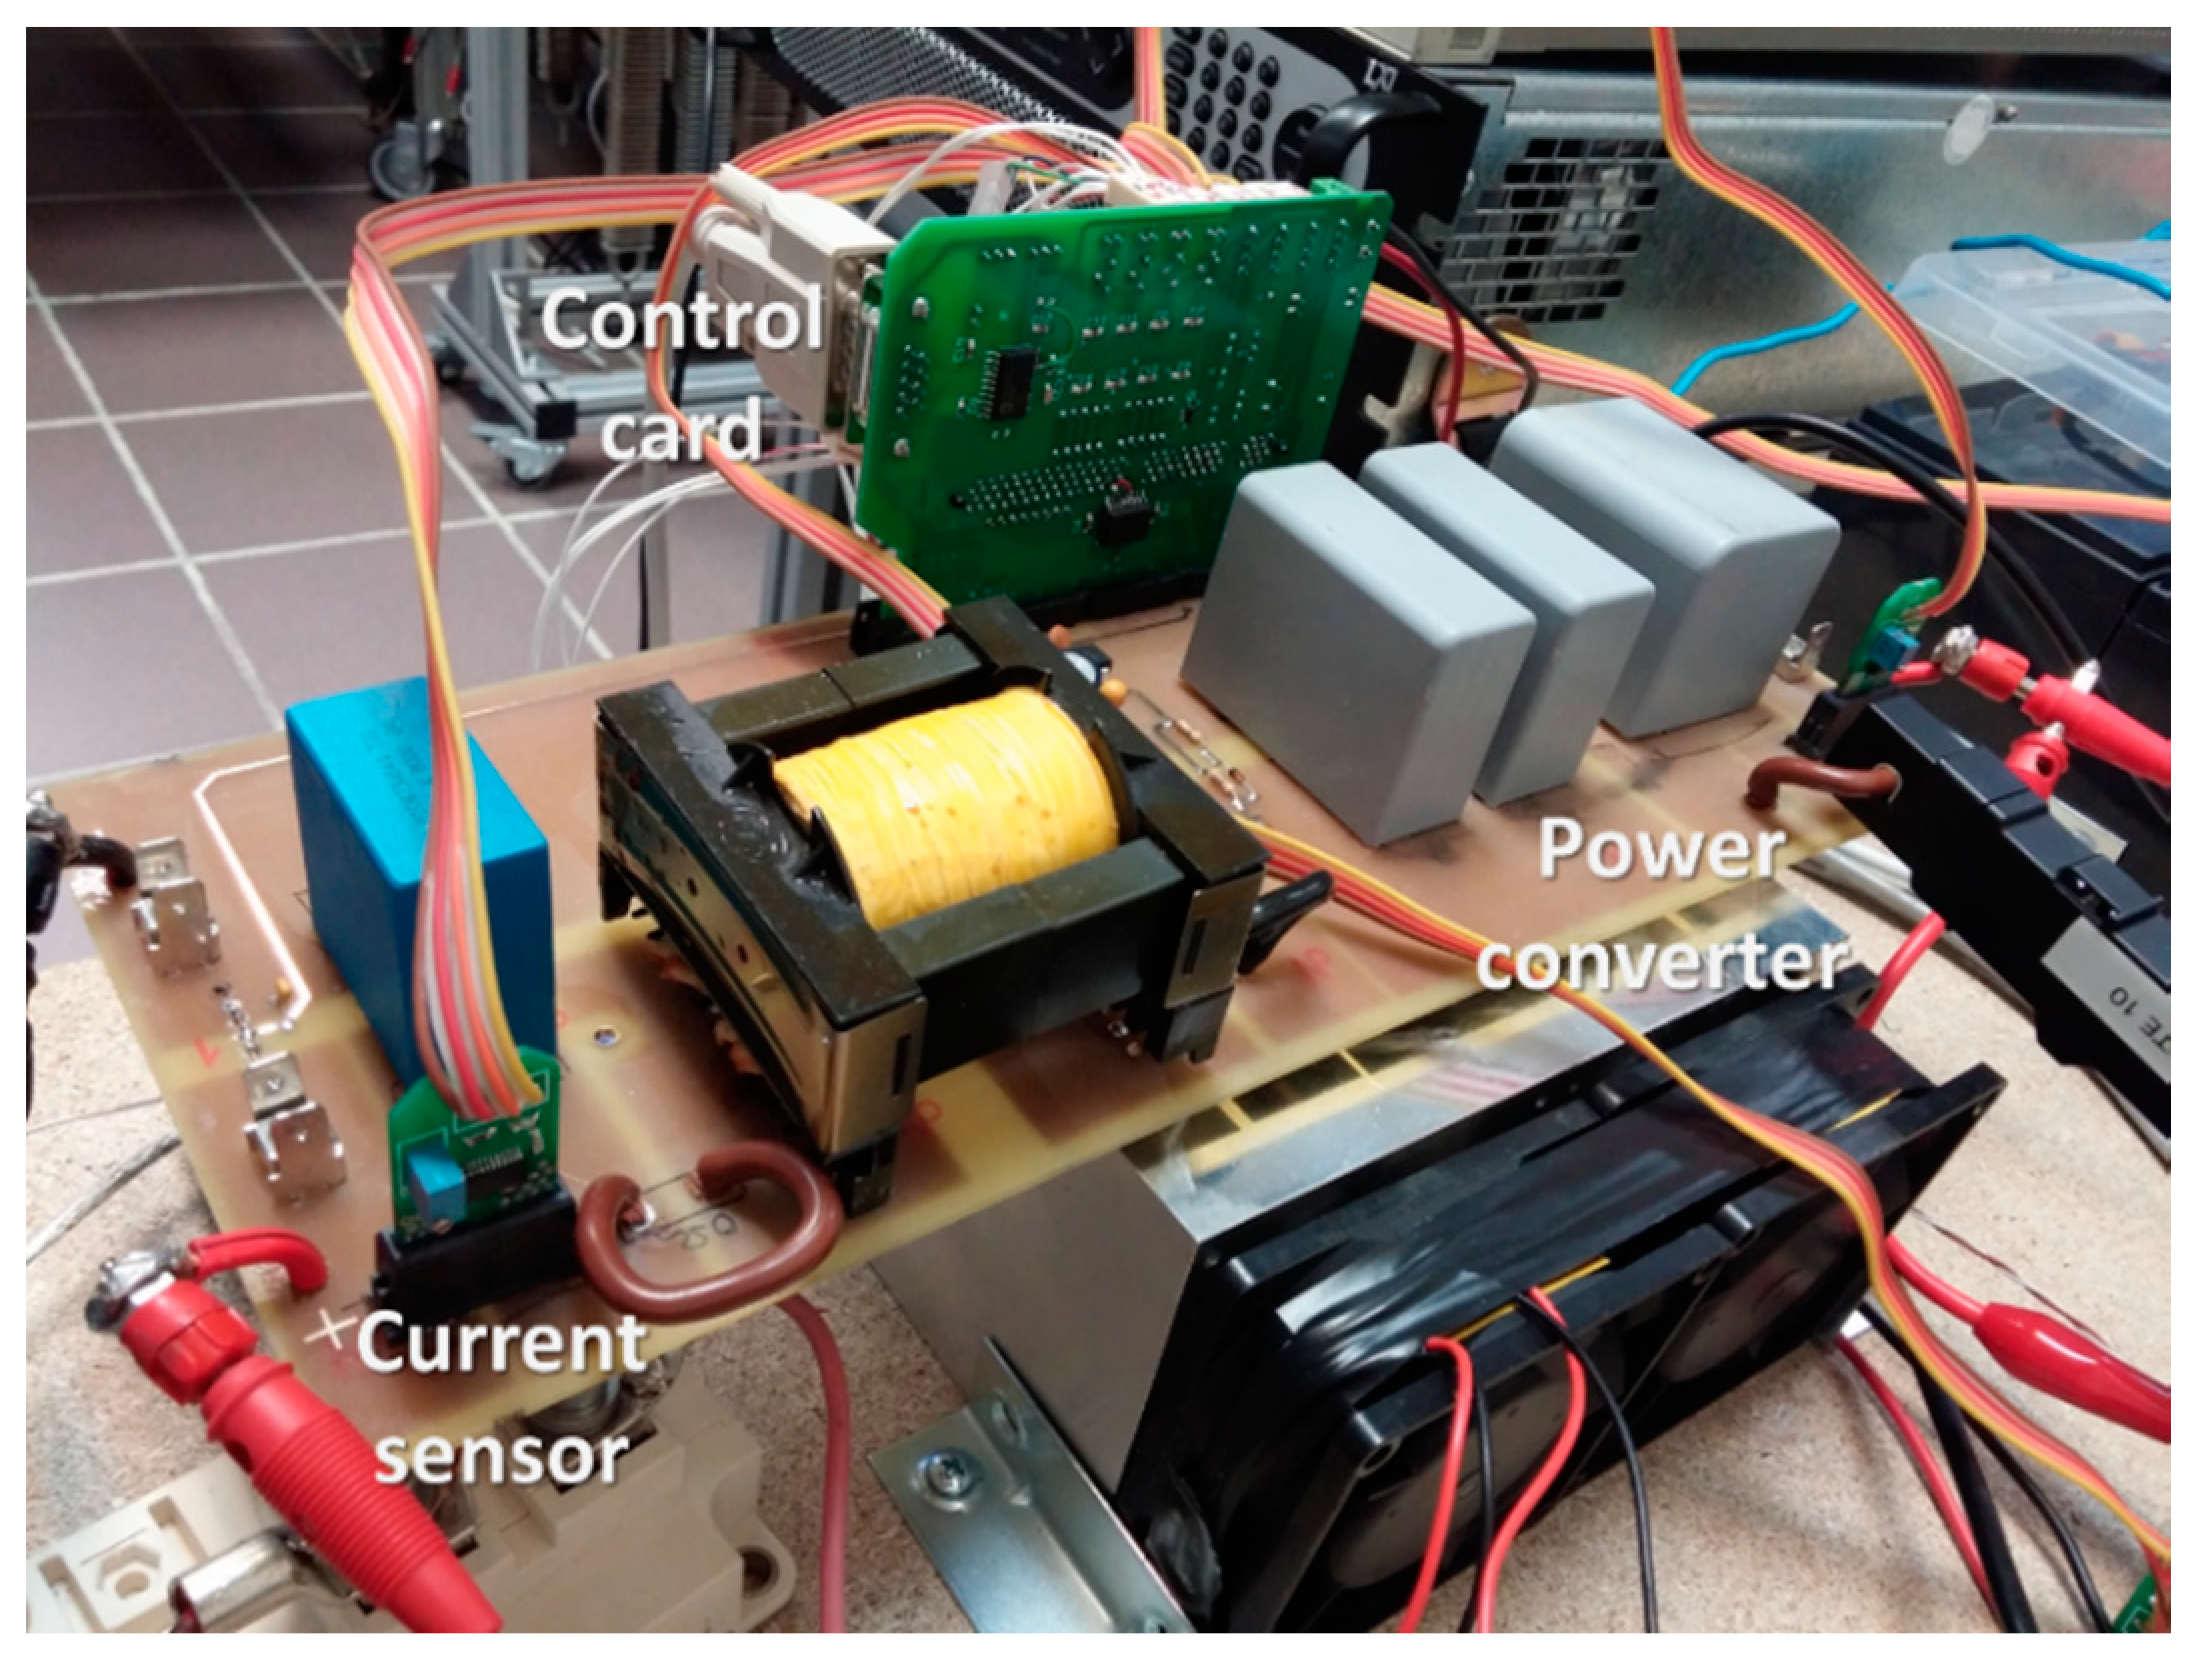
Figure 24 shows the DC-DC power converter with a synchronous buck topology. It shows the input and output sides, as well as the designed control card.
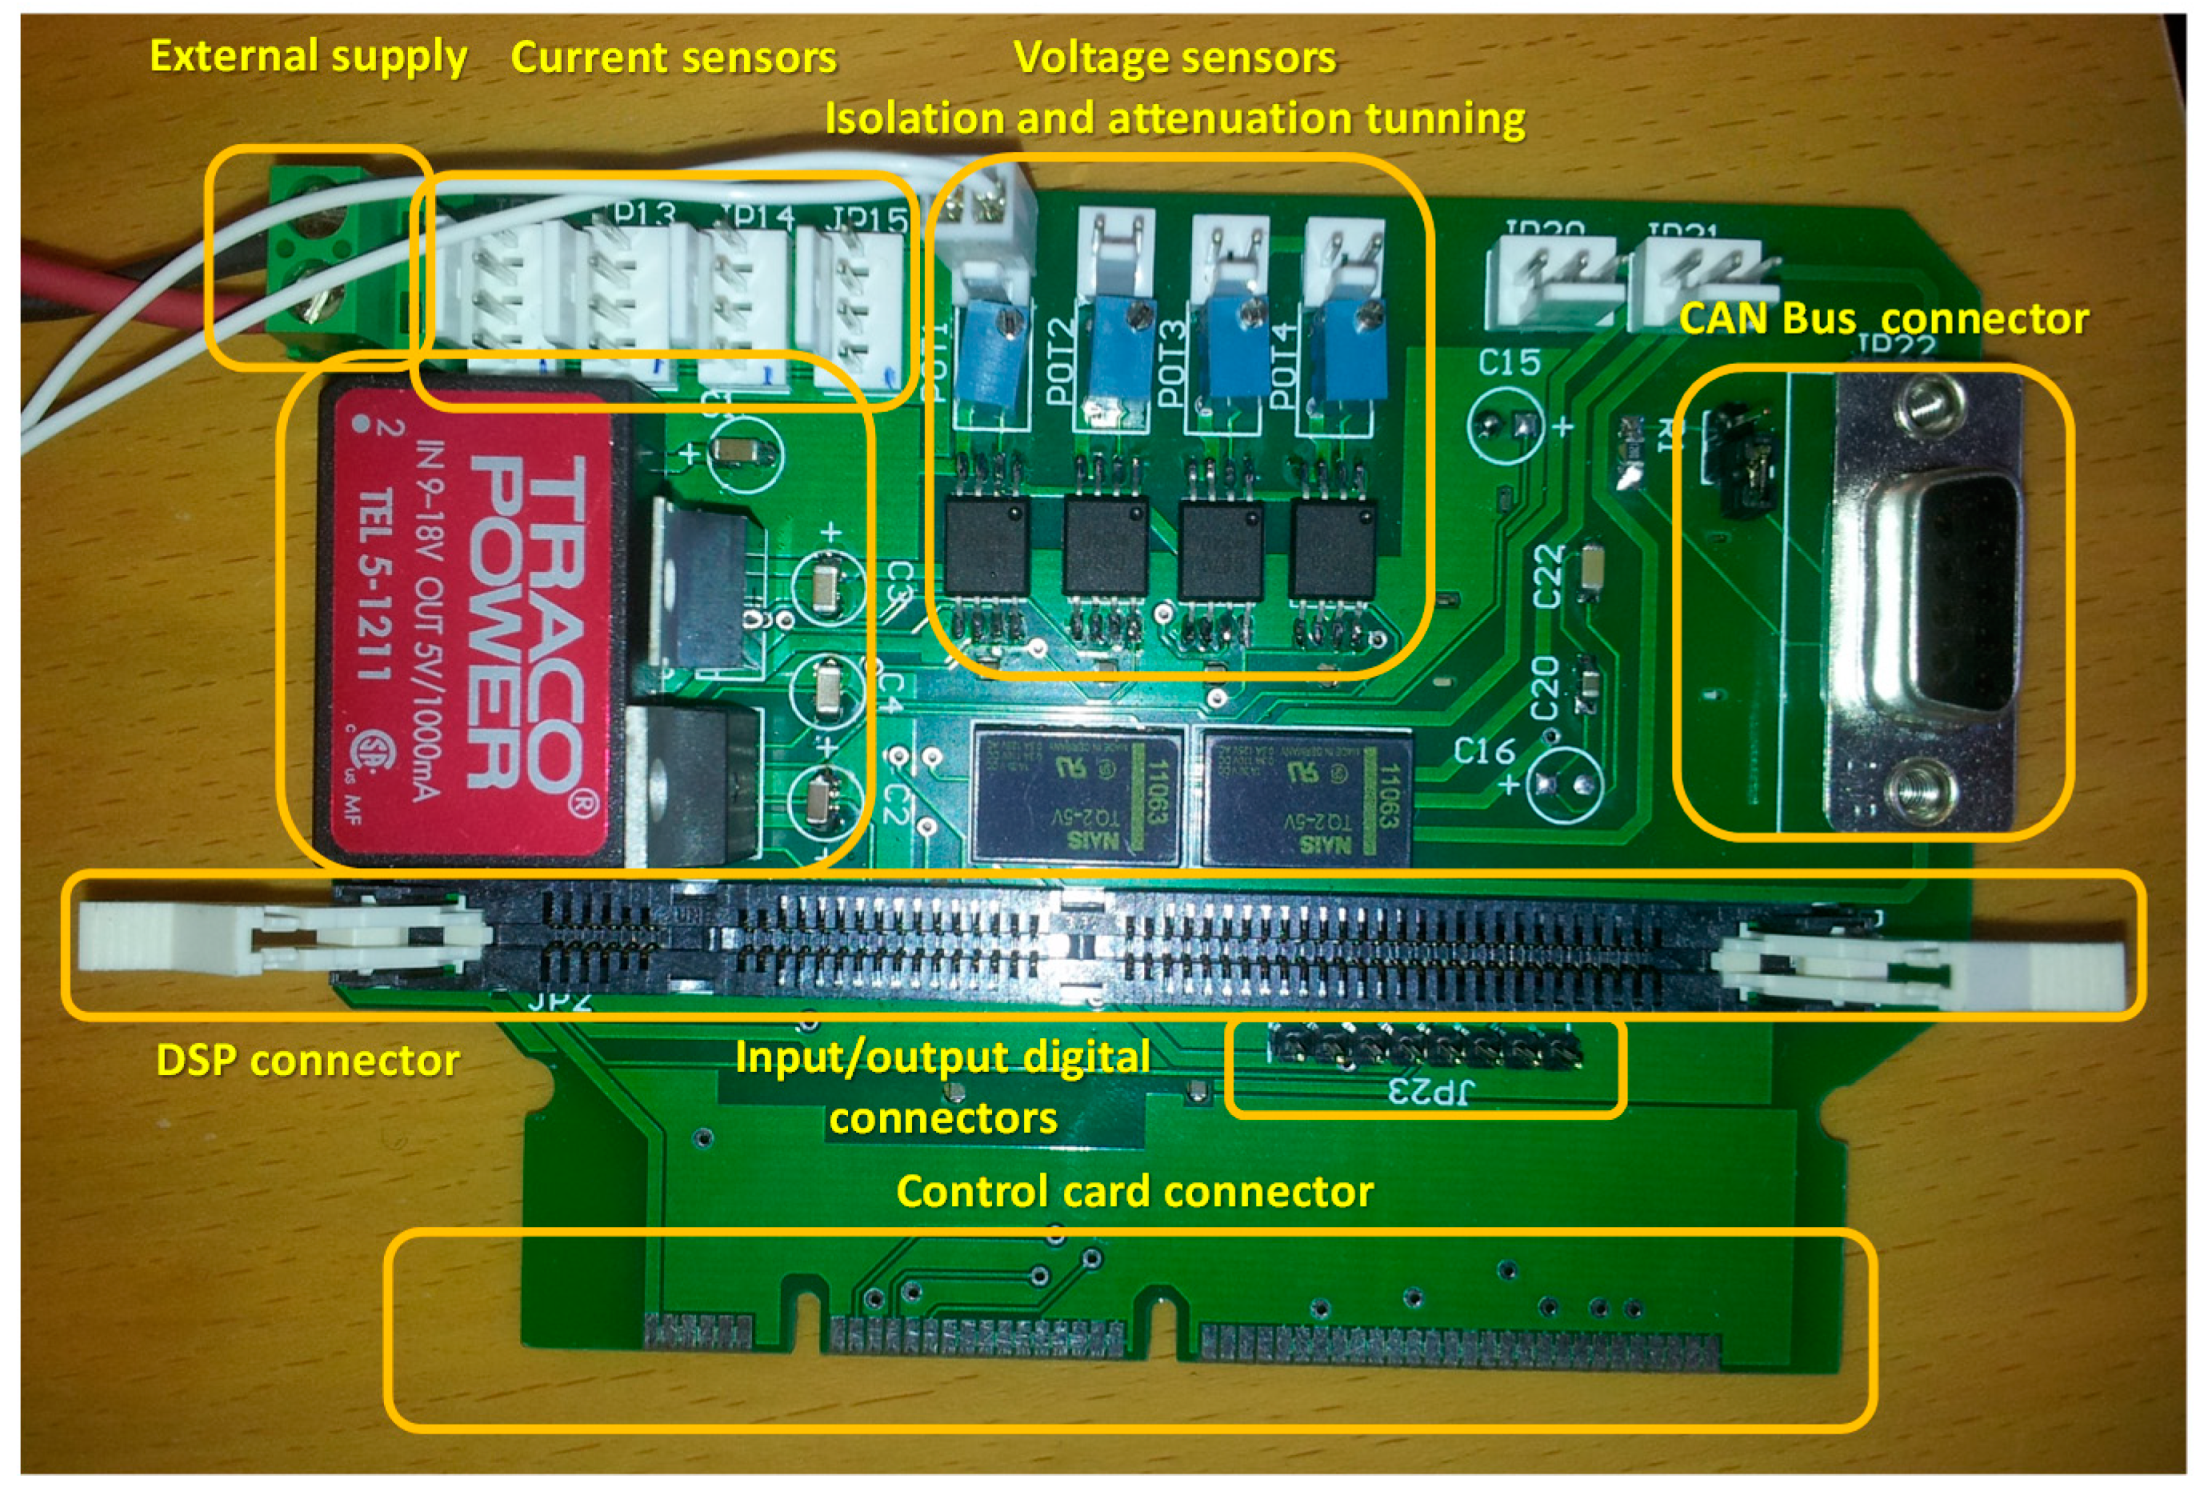
A multipurpose control card is designed and implemented. Since there are a wide variety of power distribution architectures under study, it has been designed a flexible control card that allows not only to manage more than one power converter at the same time but also to measure input and output magnitudes belonging to different power converters. Also, it allows the programming of different control strategies and a different number of current and voltage control loops. Figure 25 shows the designed control card that comprises four voltage sensors and four current sensors; one CAN bus communication channel; two power converter that supplies the control circuit; and finally a digital signal processor (DSP). It has been used the DSP TMS320F28335 from the Delfino family C2000 of Texas Instruments (Texas Instruments, Dallas, TX, USA), that can be easily programmed using the informatics tool MATLAB® SIMULINK® (MathWorks, Natick, MA, USA).
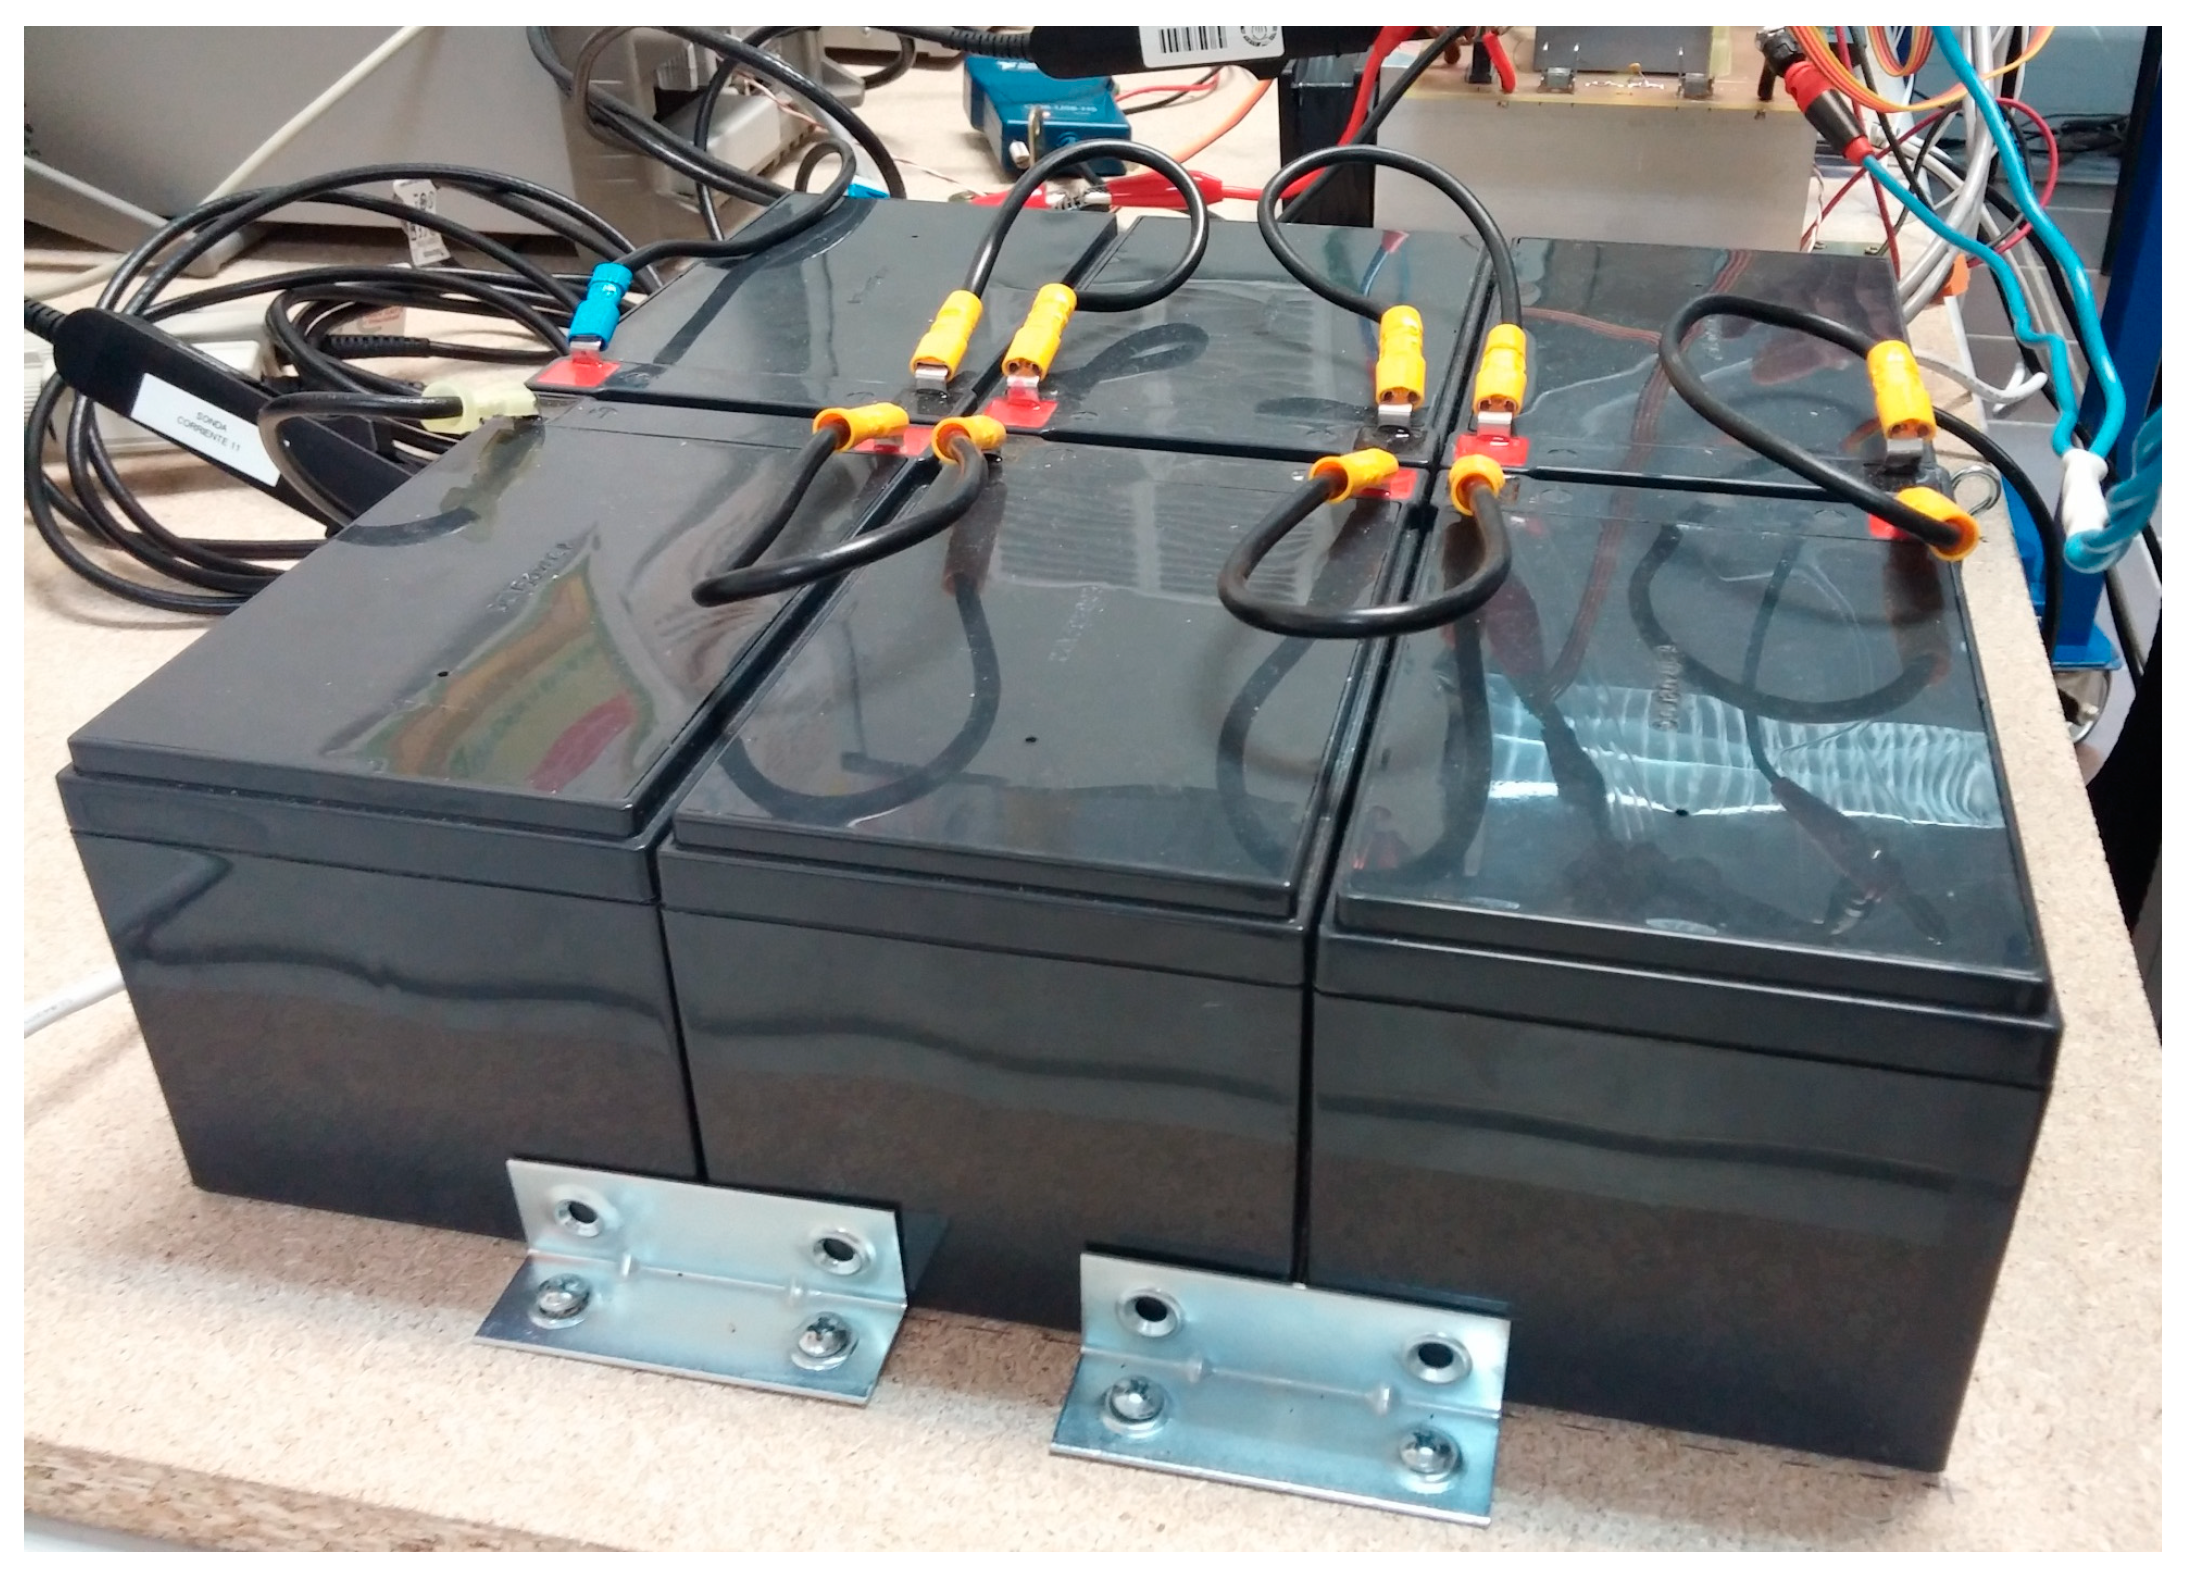
On the other hand, it uses a total of six Lead-Acid batteries LONG WP12-12B (WP12-12B, Taiwan), each one of them with a capacity of 12 Ah, and a nominal voltage of 12 V. With the aim of reach the nominal bus voltage, the six batteries are connected in series, Figure 26.
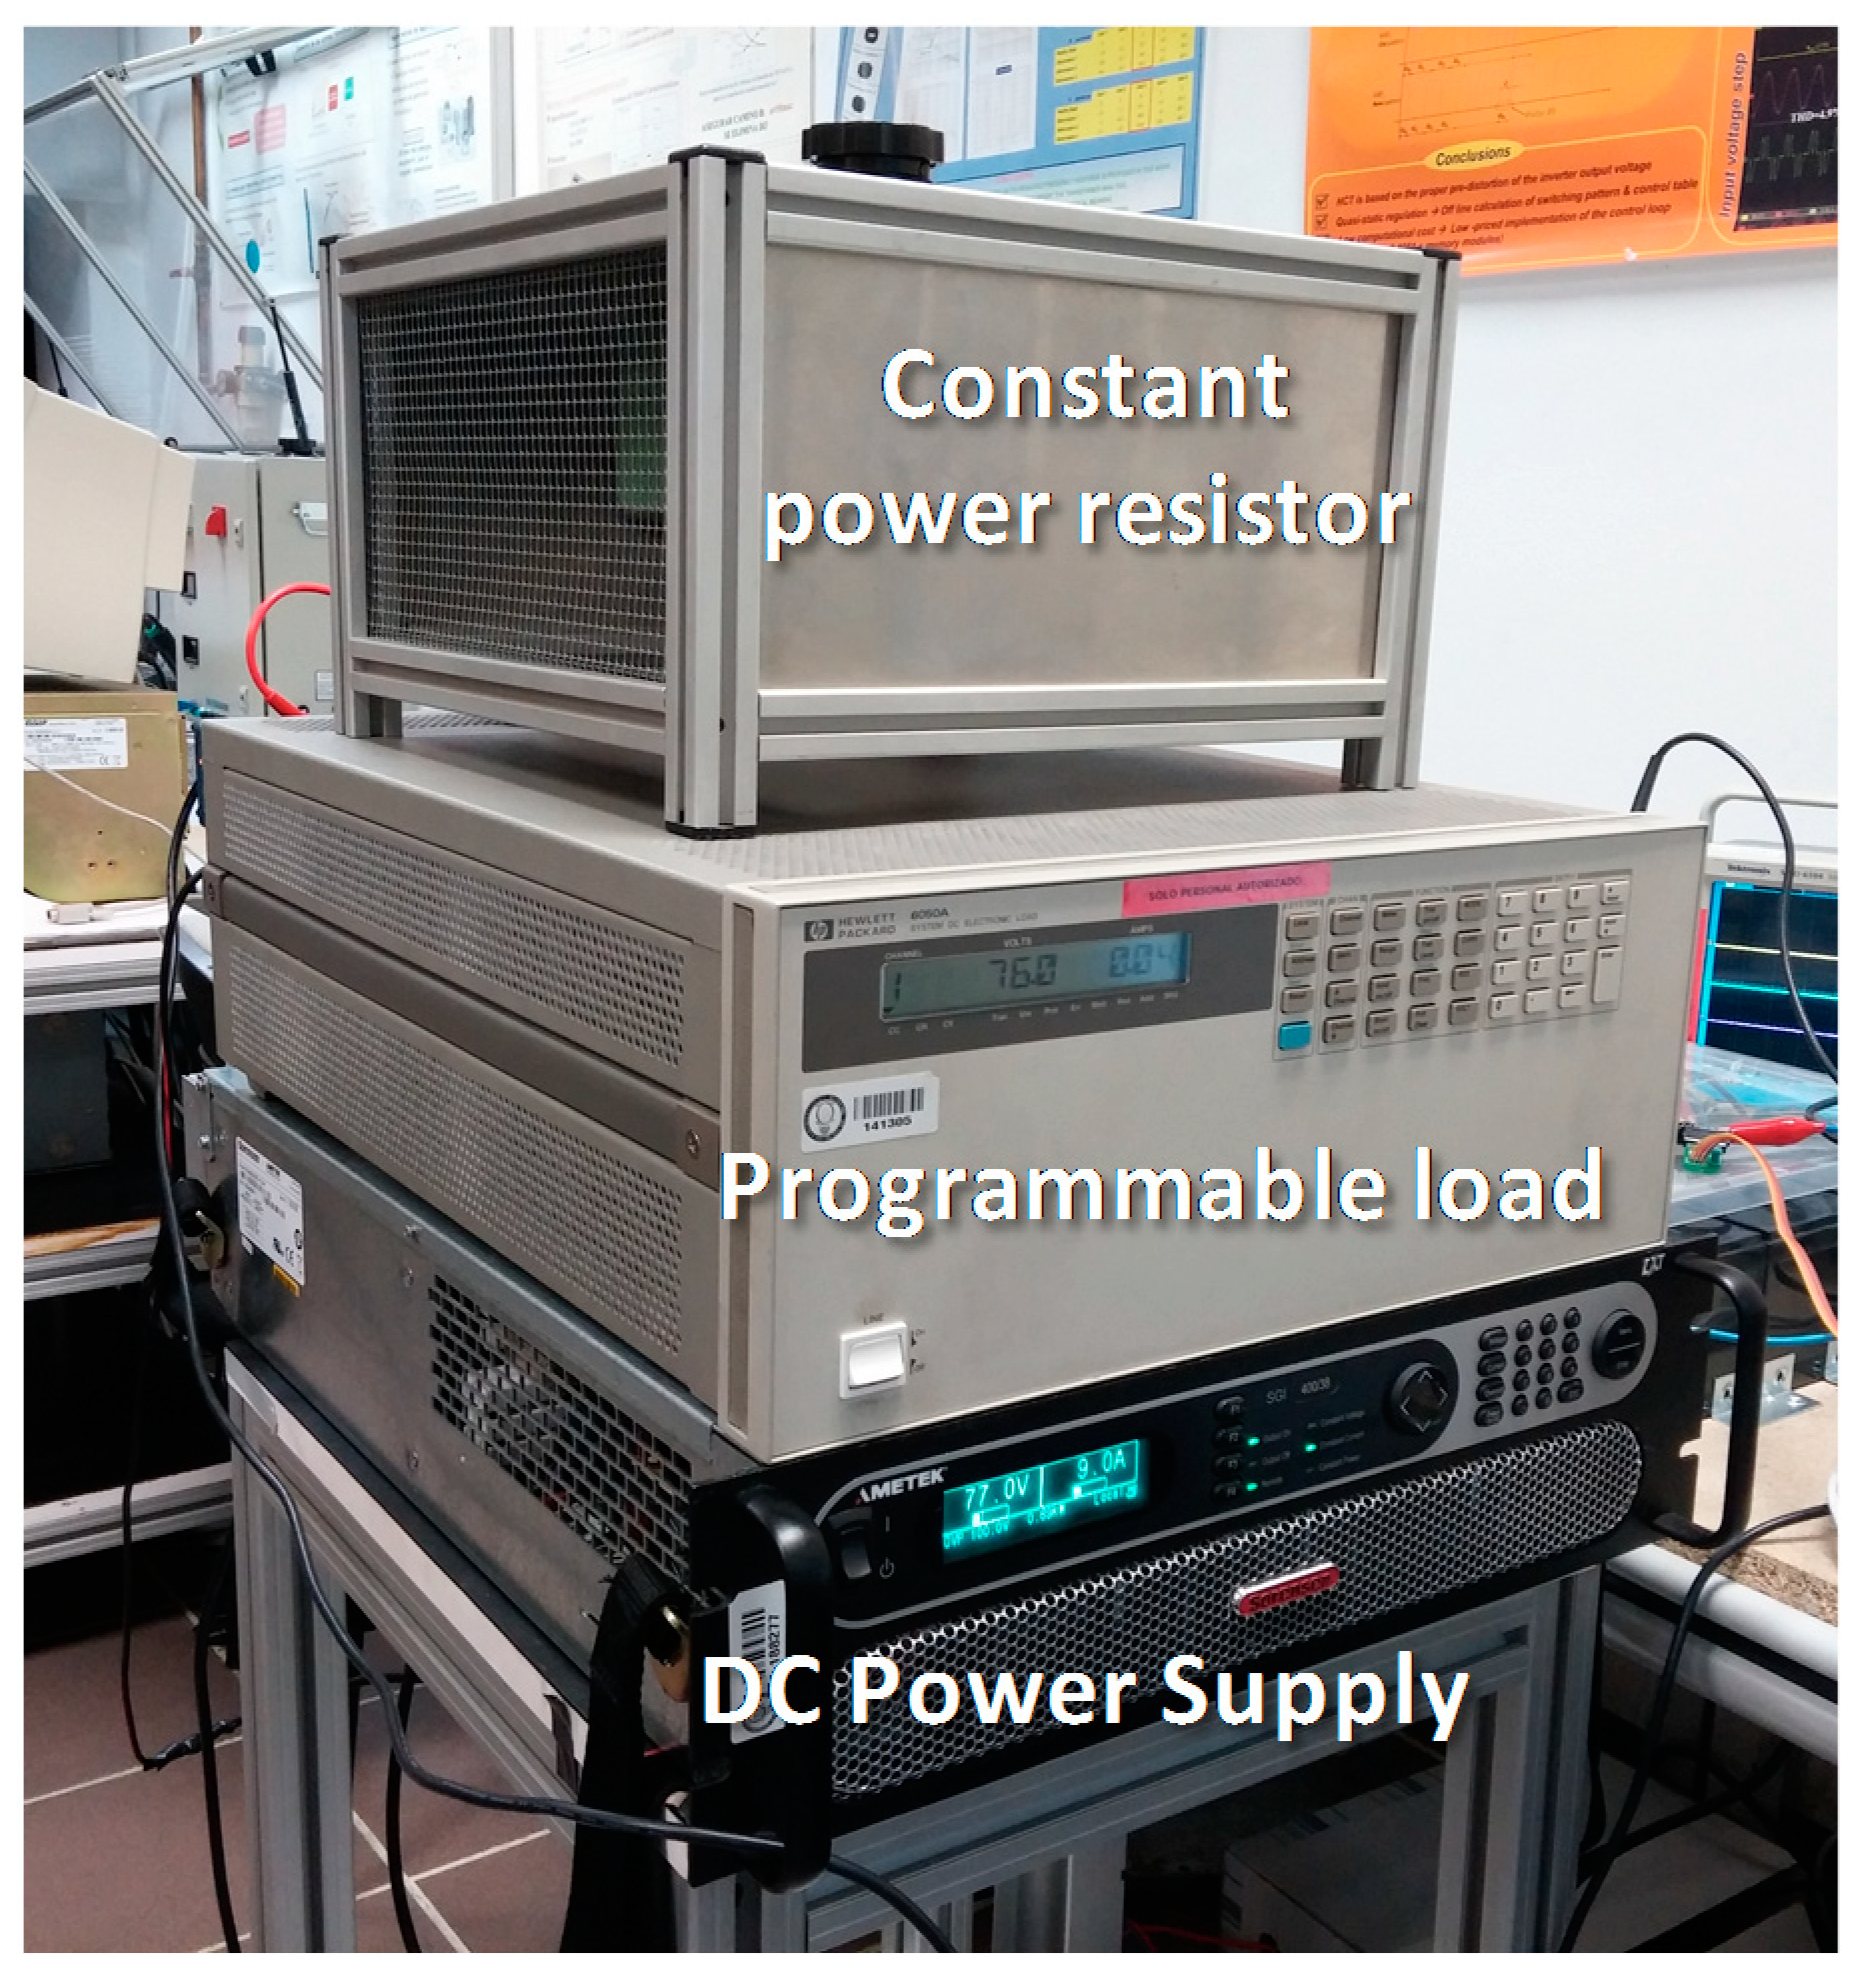
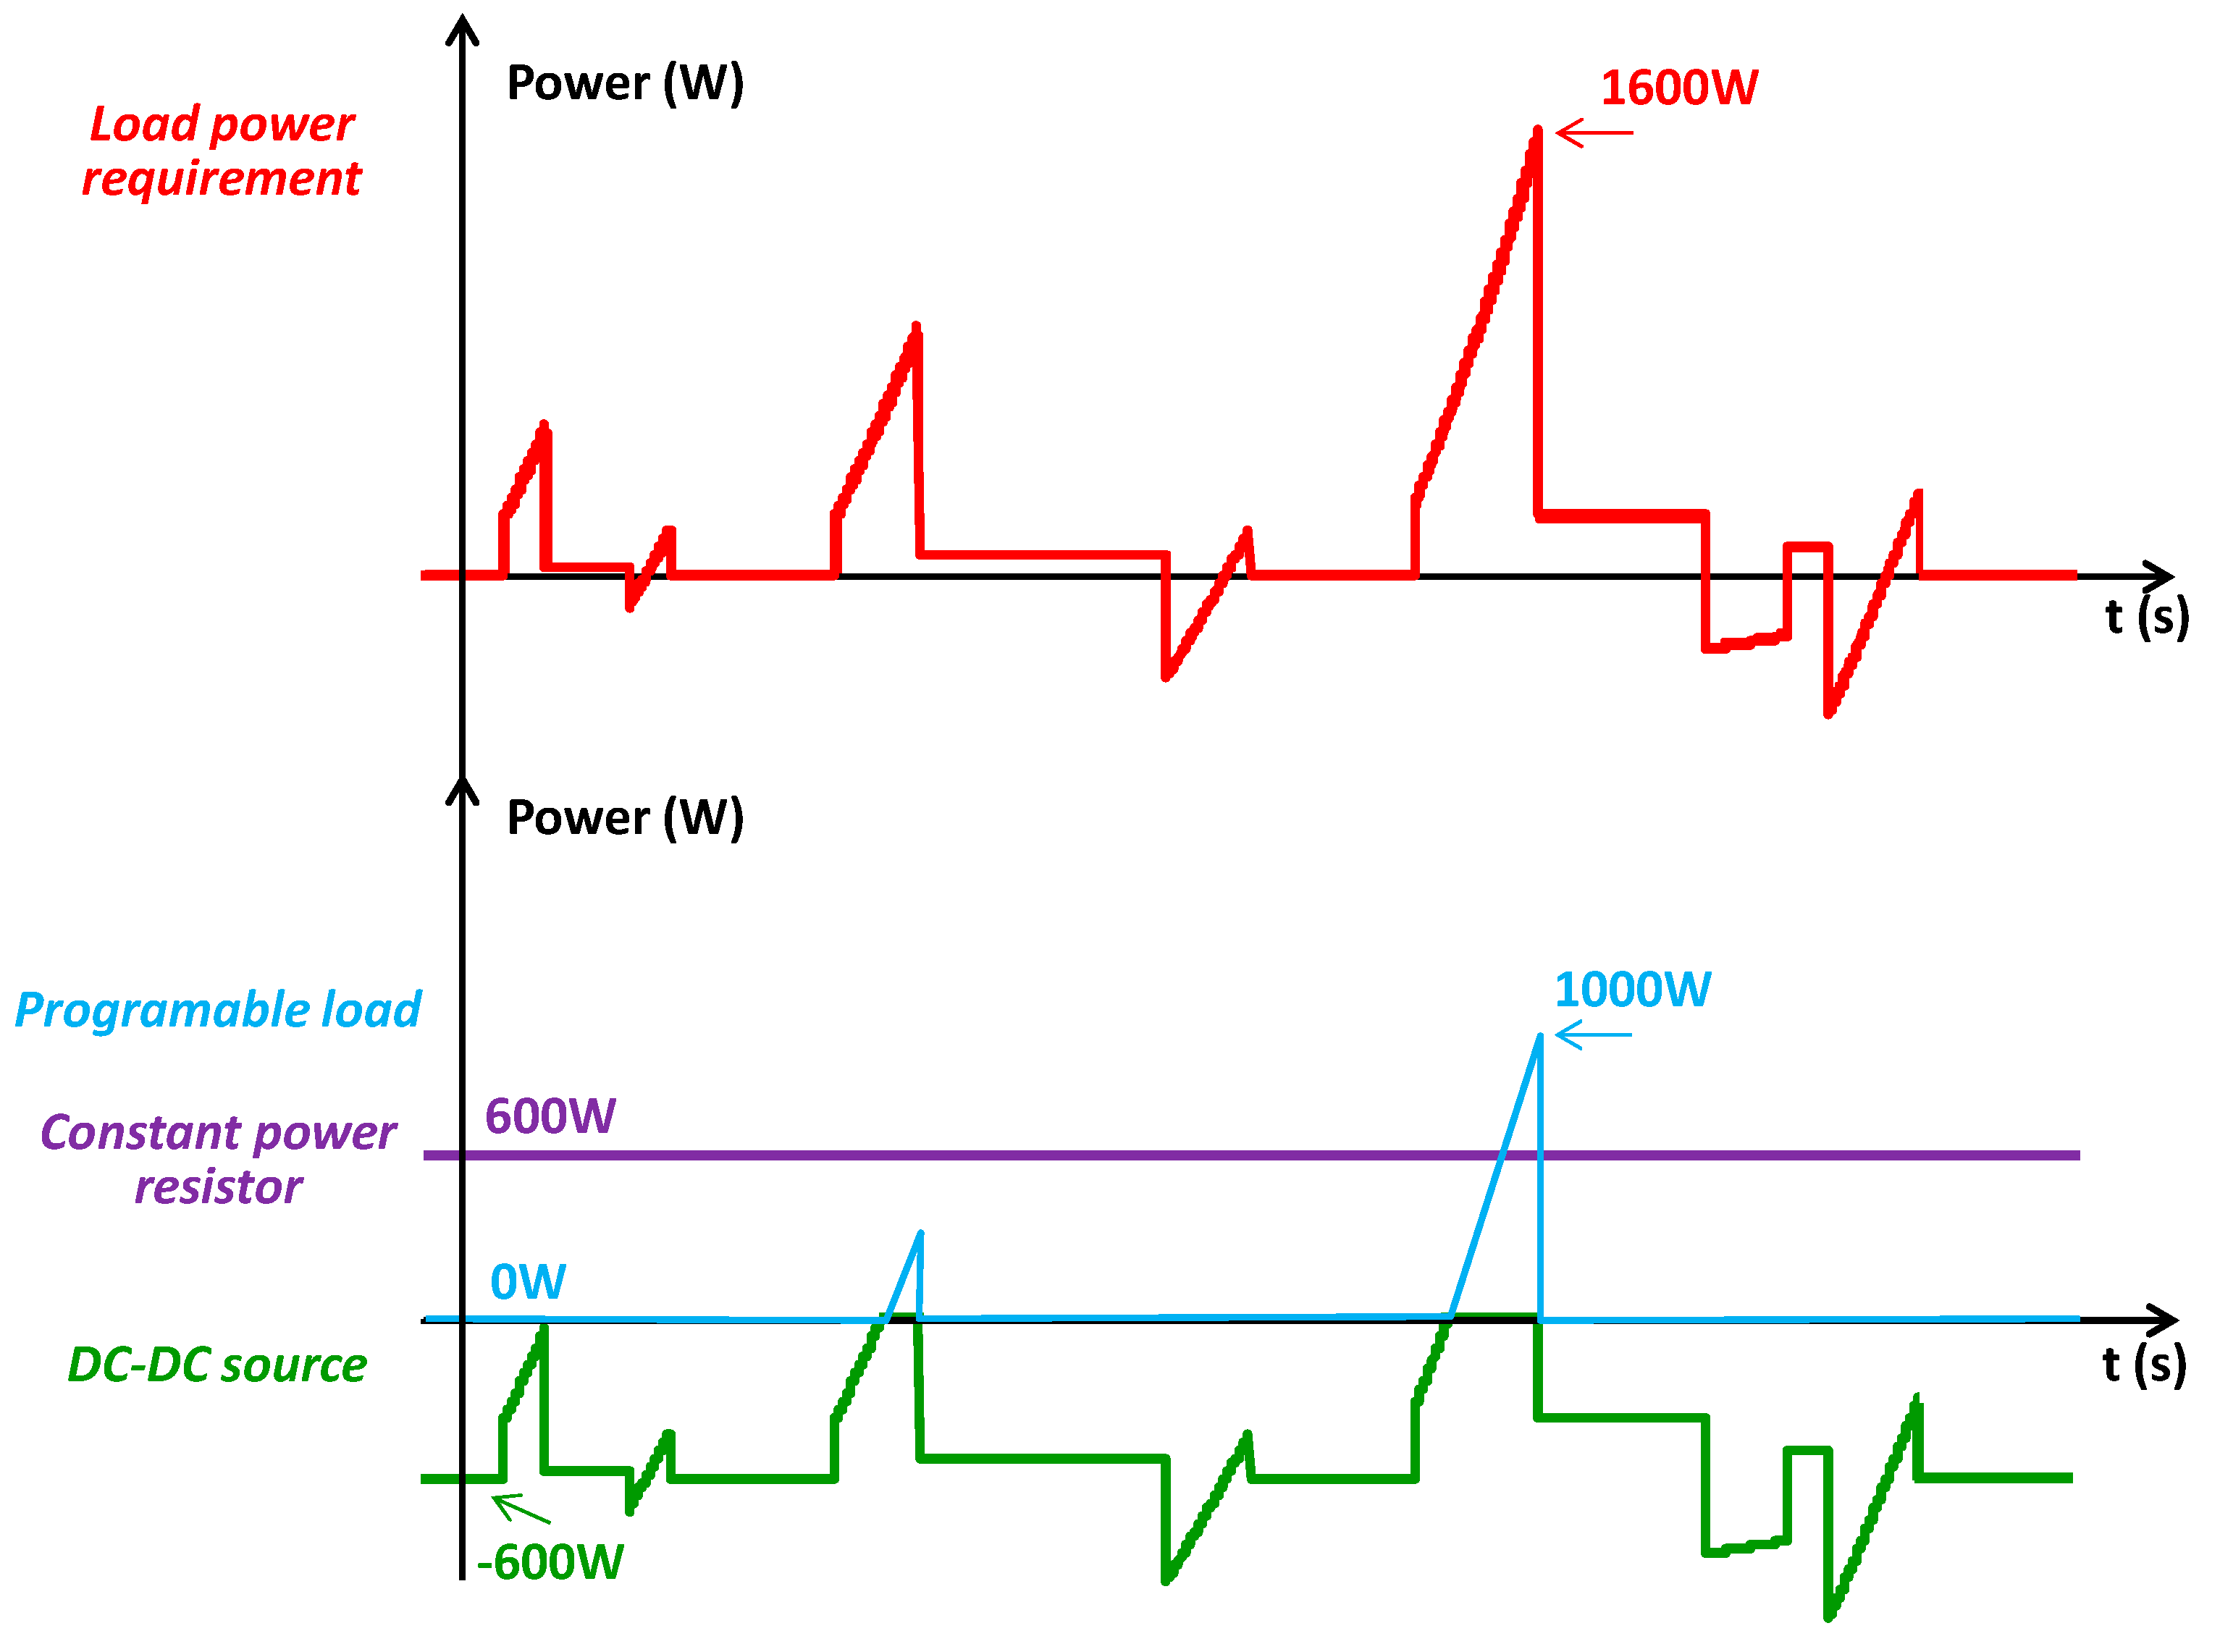
With the aim of applying to the lab prototype the power profile of Figure 1 scaled 1 to 10, it implements a resistor consuming 600 W continuously; a DC programmable load HP 6050A (in order to reproduce the dc motor consuming periods); and finally a DC voltage source SORENSEN (SGI400/38, Berwyn, PA, USA) SGI400/38 (in order to supply energy to the system, and reproduce the regenerative braking periods), see Figure 27. With the objective of synchronising the different equipment that compounds the load power profile, a LabVIEW algorithm has been developed.
Because the load power profile is known, and considering the constant power resistor of 600 W, it can be identified the power profile that must be managed by the programmable load and by the DC-DC source, as depicted in Figure 28.
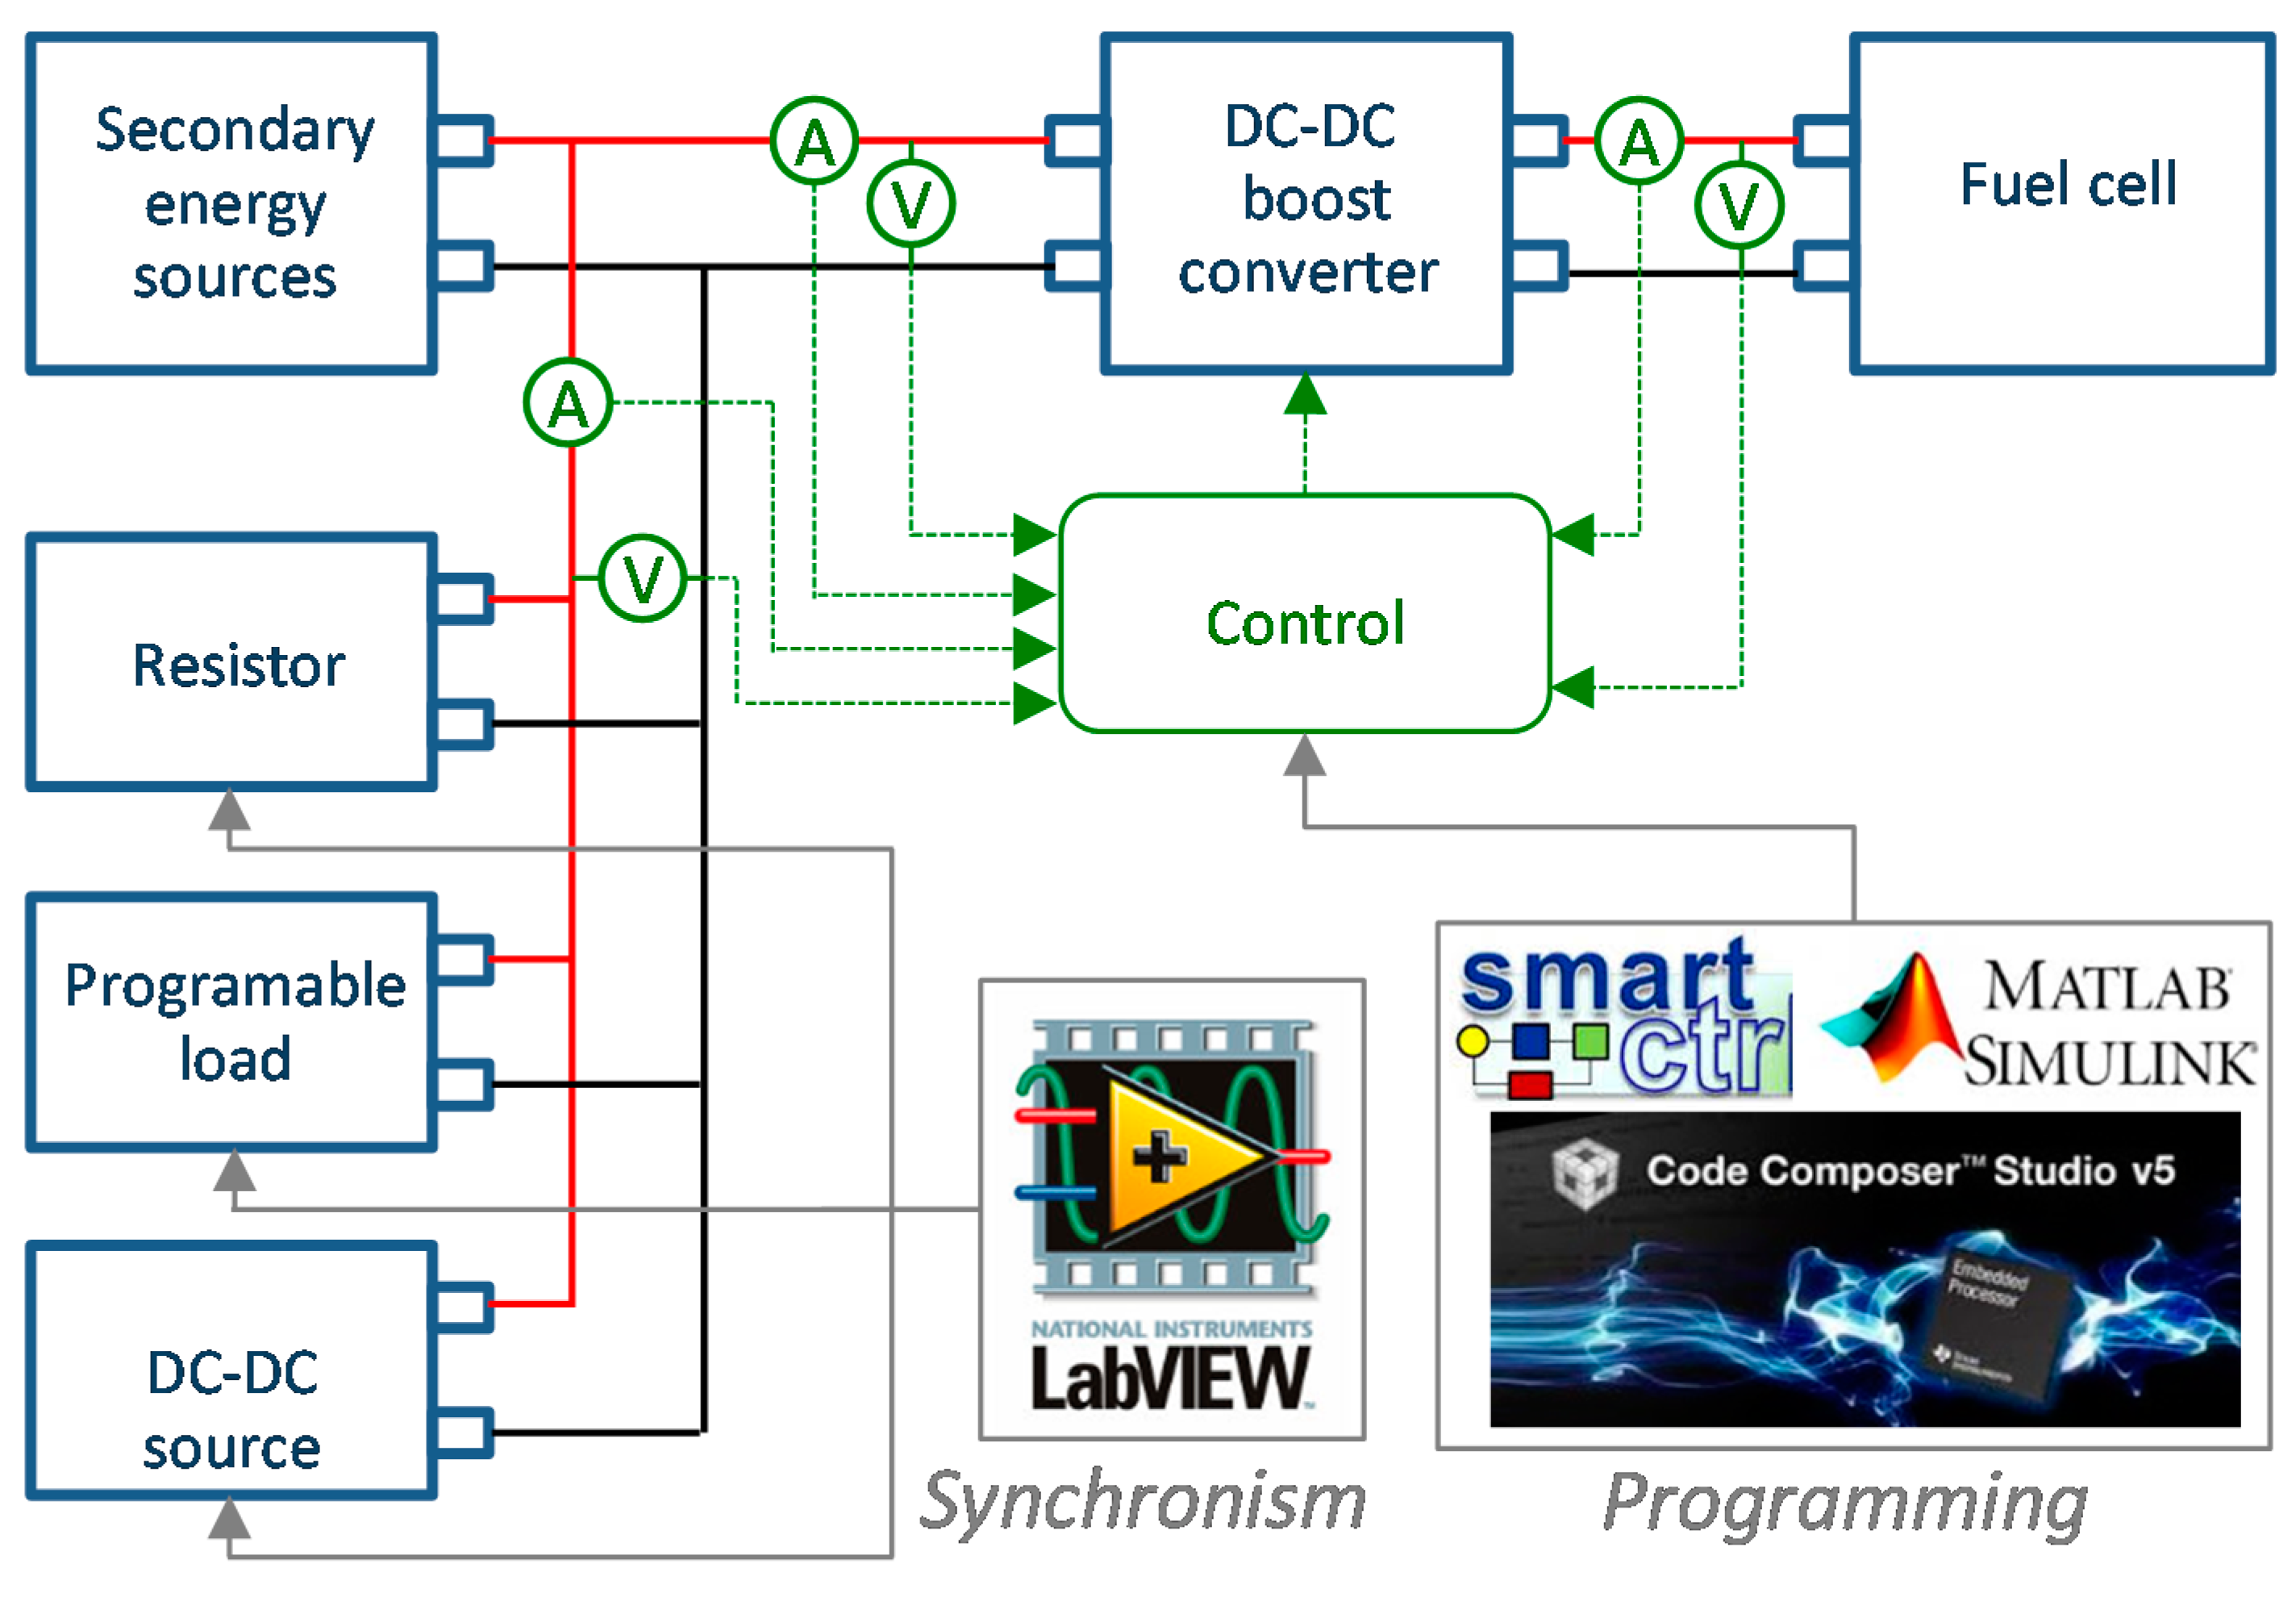
Figure 29 shows the block diagram of the whole system, where it depicts the testing points, as well as the different blocks connections.
With the aim to experimentally validate the sizing procedure, both the measured and the simulated principal magnitudes of the system are compared when a single driving cycle applies to the power distribution system, as shown in Figure 30. In this case, Pmin is equal to zero and the first 181 seconds of the ECE-15 profile has been considered.
It can be seen the very close evolution, in all cases, between the simulated and measured magnitudes. The last graphical representation Figure 30e depicts the relative error between the measured and simulated DC bus voltage. It complies that it keeps below the 4% along the single driving cycle.
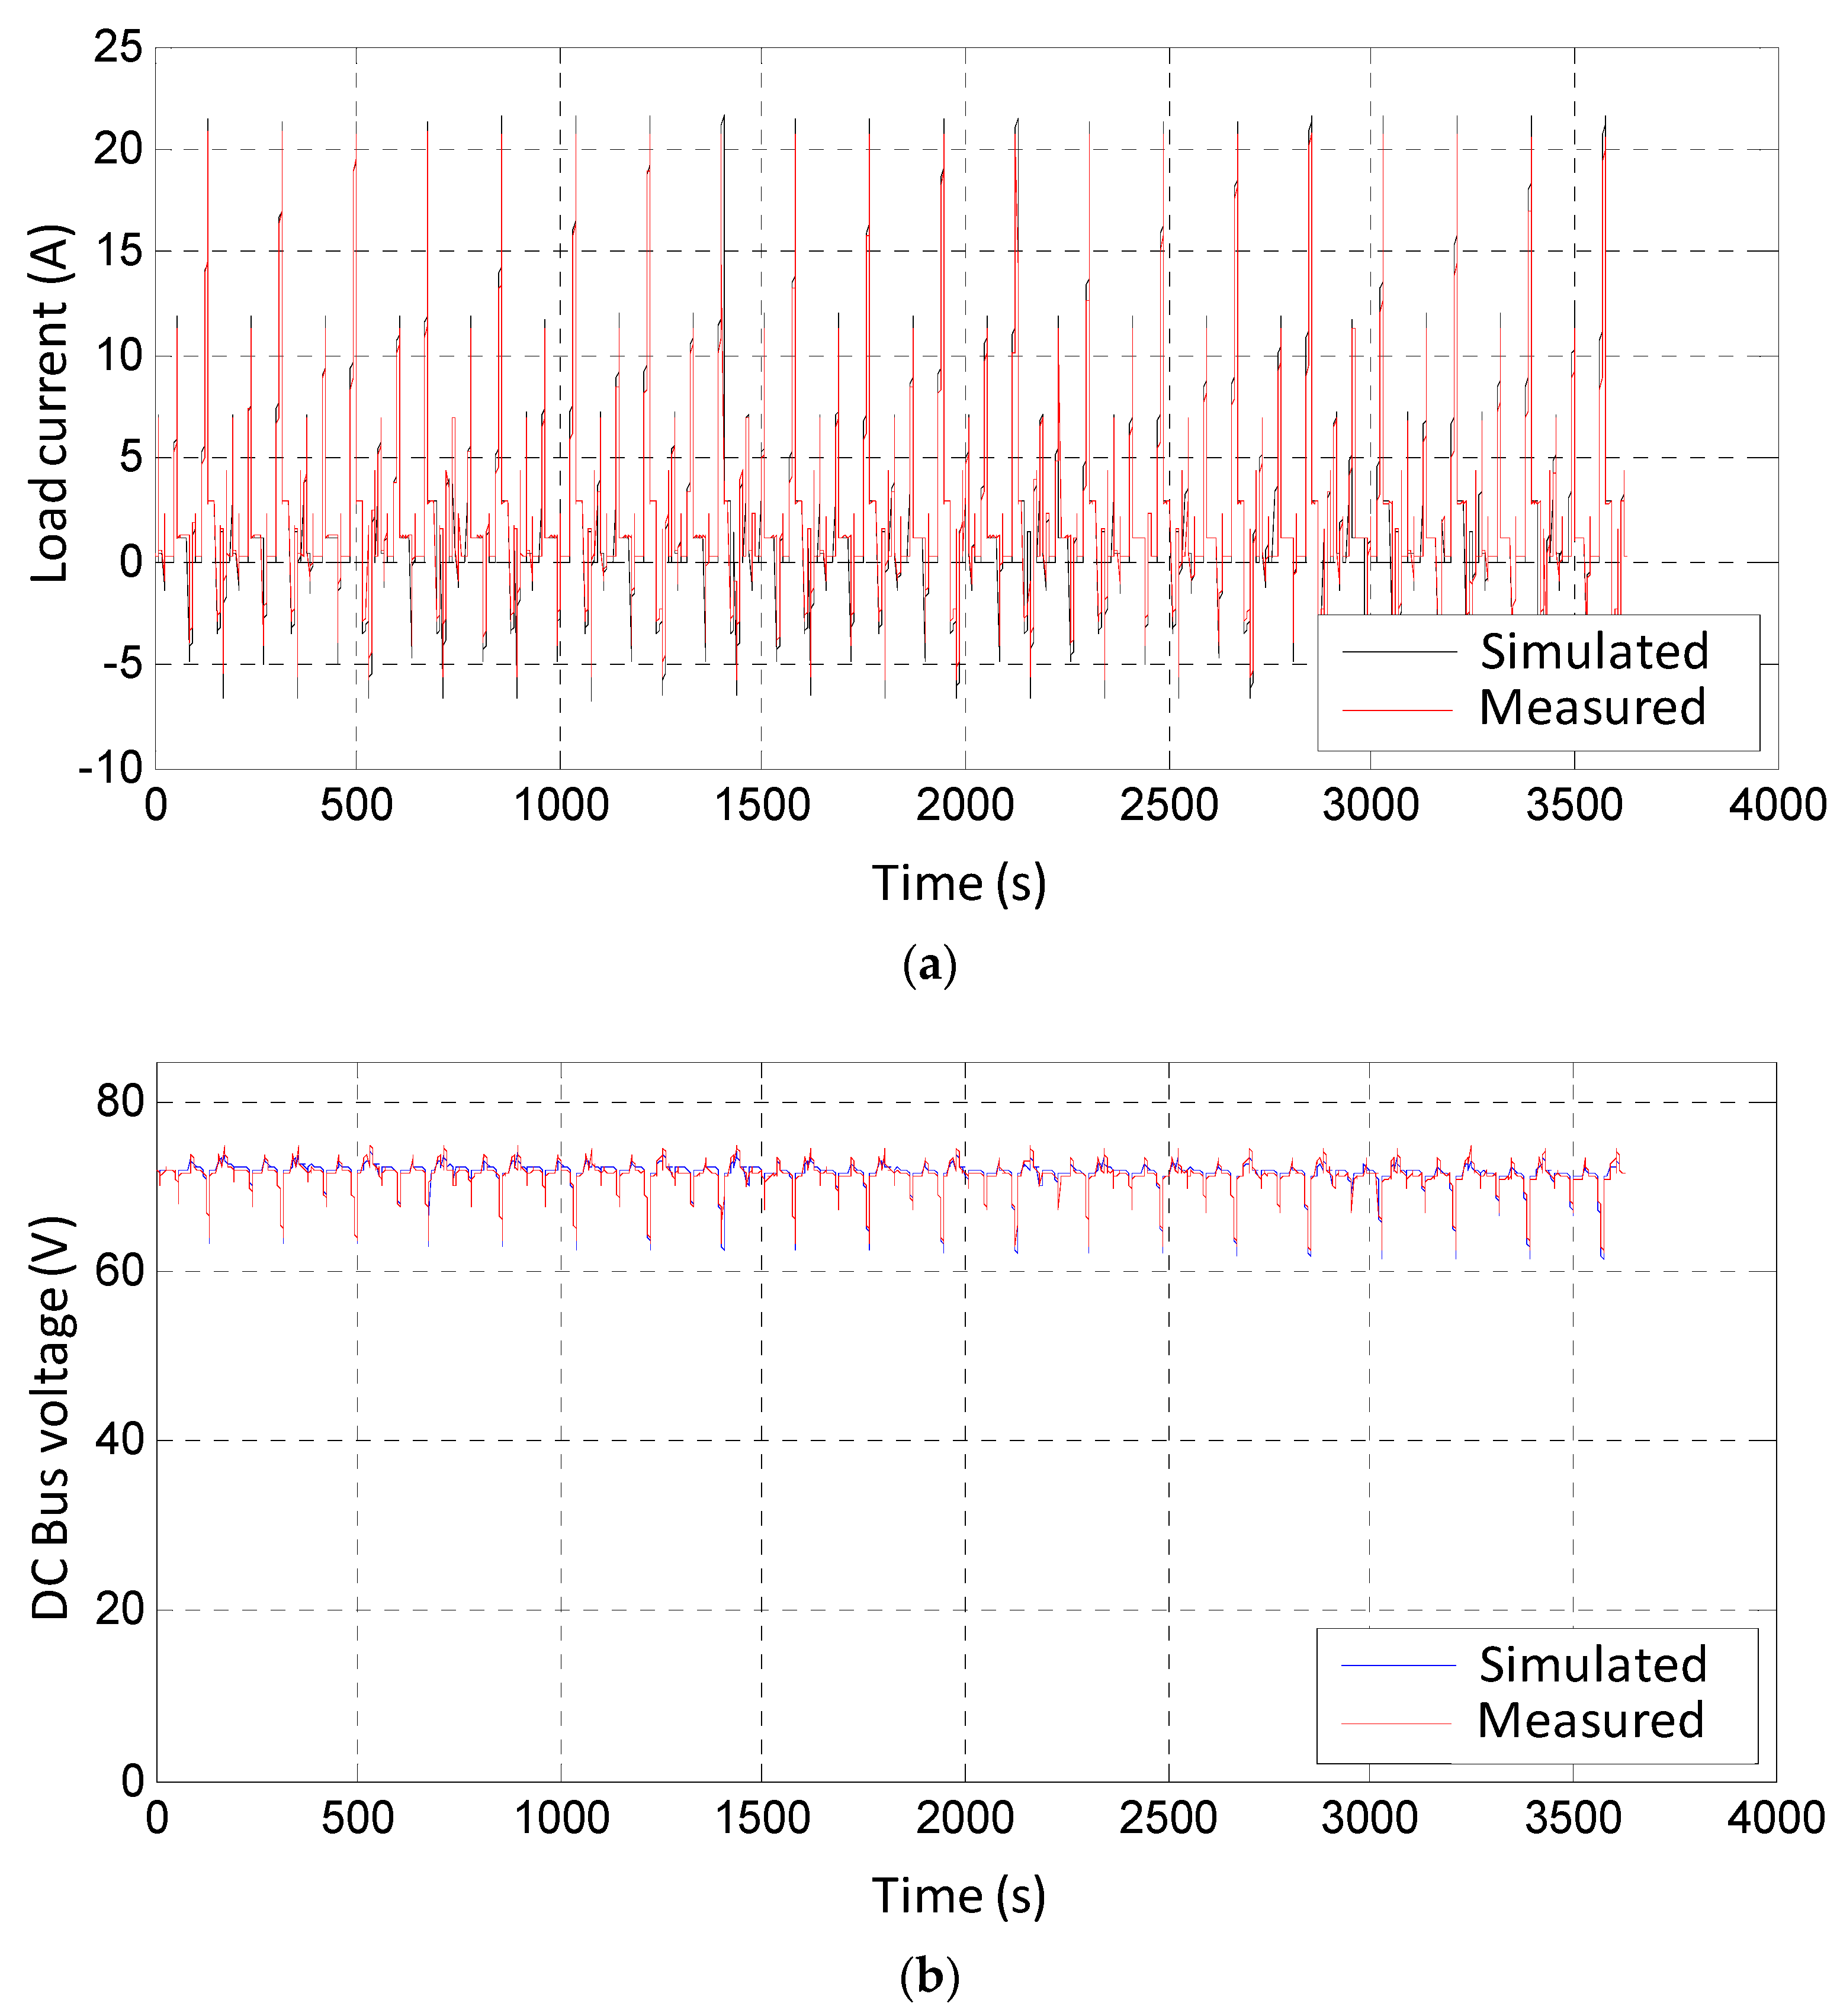
Once the main magnitudes of the system have been experimentally validated, the next test consists of comparing the evolution of both the simulated and measure magnitudes along 20 driving cycles, which means approximately 1 h. Figure 31 shows the demanded load current and the DC bus voltage.
A good accuracy achieves between the simulated and experimentally measured magnitudes.
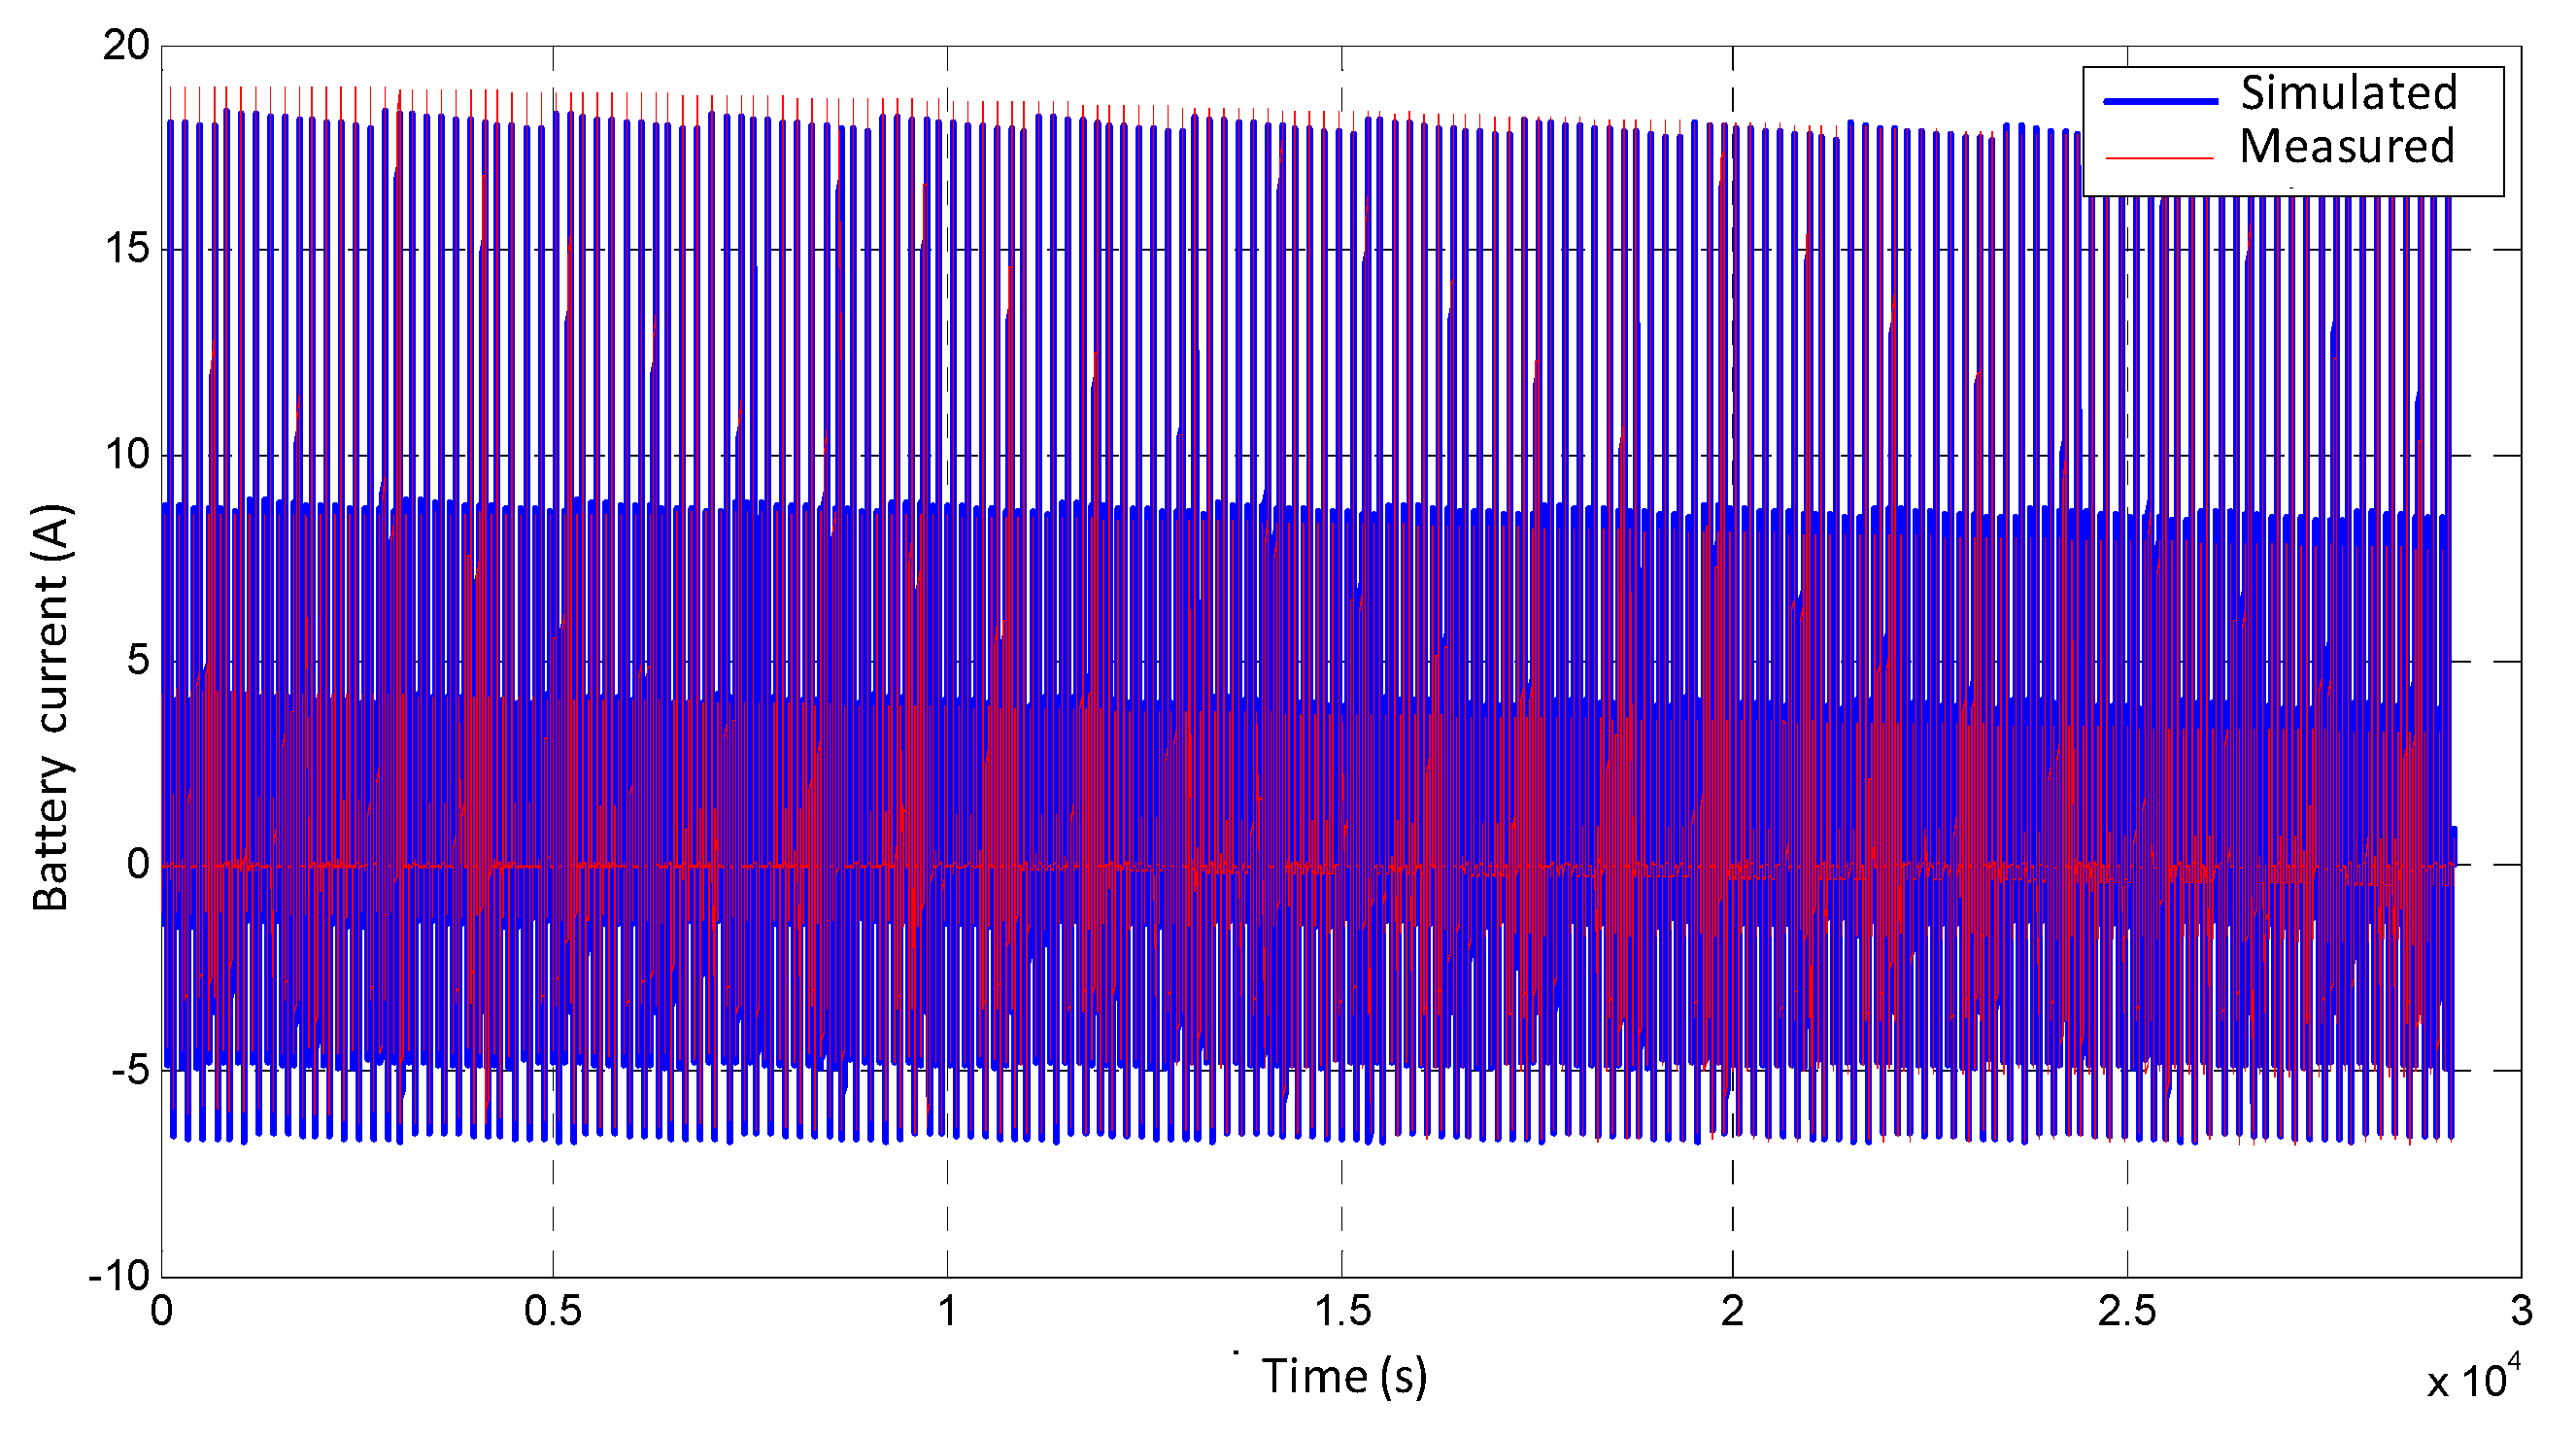
Finally, the European ECE15 single driving cycle is applied 161 times to verify the system behaviour along a working day of 8 h. Figure 32 shows the measured and simulated battery current, and their very close evolution, during all the test, between the lab prototype and simulated model signals. Figure 33 depicts a detail of the first ten driving cycles (first 50 min).
The DC bus voltage is the last analysed magnitude. In Figure 34, it is shown the evolution along an 8 h working day of the measured and simulated DC bus voltage. It observes the very close evolution of both magnitudes. This evolution backs the results obtained for the battery current.
Figure 35 depicts a detail of the last 150 min of the test, in which better observes the accuracy between both magnitudes.
After the experimental validation of the main magnitudes of the power distribution architecture 1B, the presented optimal sizing procedure can be considered experimentally validated. Therefore, this optimal design methodology allows the selection of the most suitable power distribution architecture as a function of the maximum power provided by the fuel cell. Additionally, the optimal sizing procedure gives the minimum mass of secondary energy sources that corresponds with each maximum fuel cell power, needed to fulfil the load requirements.

5. Conclusions

This paper presents a graphic and straightforward calculation of the secondary energy sources sizing needed to satisfy the power and energy requirements of a fuel cell based vehicle. This study and analysis have been applied over a light vehicle when the urban ECE-15 driving cycle applies along a working day of 8 h. Ten different propulsion systems have been analysed, from the mass, volume and cost point of view, depending on the fuel cell maximum power. The result of the analysis allows identifying which kind of power distribution architecture is the most suitable for each fuel cell maximum power range.
The essential idea that summarises the secondary energy sources trend indicates that as the fuel cell delivered maximum power increases, the secondary energy sources mass decreases. A lower and upper power boundary define three different fuel cell maximum power ranges. Depending on the range of fuel cell maximum power considered, the minimisation of the secondary energy sources total mass leads to different optimum solutions:
  • In the low power range, the secondary energy sources total mass is determined by the energy requirement, and then the minimum mass is achieved using only batteries.
  • In the middle power range, the optimum solution regarding mass is based on a combination of batteries and supercapacitors.
  • Finally, in the high power range, the secondary energy sources total mass is imposed by the power requirement, and then the use of only supercapacitors is recommended.
The analysis of the subsystems mass shows that the most significant contribution to battery-based architectures is due to the batteries. The most significant contribution in batteries and supercapacitors based architectures are the batteries and the fuel cell, and finally, the main contribution in the overall mass of supercapacitors-based architectures is the fuel cell.
Concerning the cost, the highest one corresponds to the batteries followed by the power converters. Then, it is desirable to select architectures with the less number of power converters as possible. Therefore, within the analysed architectures, the cheapest architectures are those that use only one unidirectional power converter downstream of the fuel cell. Among these types of architectures, architectures 1BC and 1C2 are recommended at the medium and upper power limit, 6.2 kW.
In the comparative study of architectures, the architecture 0B corresponds to a pure battery vehicle. It should be remarked that the mass and cost of all the power distribution architectures for a fuel cell based vehicle are lower than the mass and cost of the architecture 0B, within their corresponding optimum fuel cell maximum power design range, except the cost of the architecture 3C.
Although the reliability is not an issue analysed in this paper, the number and type of components in each architecture is different, hence the reliability of the whole system is affected. This should be taken into account in the final decision, avoiding, at least, architectures with more than one bidirectional power converter.
Additionally, it has been developed and implemented a lab prototype with a scale factor of 1:10, corresponding to the power distribution architecture 1B, with the objective of performing the experimental validation of the presented optimal sizing methodology.
The working day simulation results imply the sizing procedure is suitable, due to no battery recharge process is established along the 8 h, and the final battery SoC is the designed one. Also, the simulated and measured main magnitudes of the system have been compared: first of all, when a single driving cycle is applied, and after that, along the 8 h working day. In all cases, the very high accuracy between the measured and simulated magnitudes can be observed. As a result, the battery discharge along the working day is the expected one, and therefore, it verifies the optimal sizing procedure.
It is remarkable that the optimal sizing methodology key point is the chance of calculating the minimum secondary energy sources mass, as a function of the maximum power provided by the fuel cell, assuring the power and energy requirements demanded by the load.

Author Contributions

C.R. did theoretical analysis, derivation, system implementation, experimental testing, data processing and wrote the first original draft paper. A.B. was the responsible for funding acquisition, supervision and administration, his contribution was related with the theoretical analysis, data analysis, and the paper reviewing and editing. H.M. collaborated with the implementation of the whole system and the experimental testing. A.L. contributed with theoretical analysis and supervision. I.Q. helped with the derivation and to write a first original draft paper. A.M.-L helped to write the last version of the draft paper.

Funding

This research was funded by the Spanish Ministry of Economy and Competitiveness and ERDF, grant number DPI2014-53685-C2-1-R.

Acknowledgments

This work has been partially supported by the Spanish Ministry of Economy and Competitiveness and FEDER (ERDF), through the research project “Storage and Energy Management for Hybrid Electric Vehicles based on Fuel Cell, Battery and Supercapacitors”—ELECTRICAR-AG—(DPI2014-53685-C2-1-R).

Conflicts of Interest

The authors declare no conflict of interest.

References

  1. Ostadi, A.; Kazerani, M. Optimal Sizing of the Battery Unit in a Plug-in Electric Vehicle (PEV). IEEE Trans. Veh. Technol. 2014, 63, 3077–3084. [Google Scholar] [CrossRef]
  2. Souffran, G.; Miegeville, L.; Guerin, P. Simulation of Real-World Vehicle Missions Using a Stochastic Markov Model for Optimal Powertrain Sizing. IEEE Trans. Veh. Technol. 2014, 61, 3454–3465. [Google Scholar] [CrossRef]
  3. Pourabdollah, M.; Murgovski, N.; Grauers, A.; Egardt, B. Optimal Sizing of a Parallel PHEV Powertrain. IEEE Trans. Veh. Technol. 2013, 62, 2469–2480. [Google Scholar] [CrossRef] [Green Version]
  4. Araujo, R.; de Castro, R.; Pinto, C.; Melo, P.; Freitas, D. Combined Sizing and Energy Management in EVs with Batteries and Supercapacitors. IEEE Trans. Veh. Technol. 2014, 63, 3062–3076. [Google Scholar] [CrossRef]
  5. Global EV Outlook 2018. Available online: https://www.connaissancedesenergies.org/sites/default/files/pdf-actualites/globalevoutlook2018.pdf (accessed on 17 September 2018).
  6. Bakker, S.; Trip, J. Policy options to support the adoption of electric vehicles in the urban environment. Transp. Res. Part D 2013, 25, 18–23. [Google Scholar] [CrossRef]
  7. Shafiee, S.; Fotuhi-Firuzabad, M.; Rastegar, M. Investigating the impacts of plug-in hybrid electric vehicles on power distribution systems. IEEE Trans. Smart Grid 2013, 4, 1351–1360. [Google Scholar] [CrossRef]
  8. Fuel Cells: Toyota Means Business. Available online: https://spectrum.ieee.org/cars-that-think/transportation/advanced-cars/fuel-cells-toyota-means-business- (accessed on 17 September 2018).
  9. Speers, P. Hydrogen Mobility Europe (H2ME): Vehicle and Hydrogen Refuelling Station Deployment Results. World Electr. Veh. J. 2018, 9. [Google Scholar] [CrossRef]
  10. First Mass-Produced Tucson Fuel Cell CUVs Arrive in Southern California. Available online: https://www.hyundai.com/worldwide/en/about-hyundai/news-room/news/hyundai%2527s-first-mass-produced-tucson-fuel-cell-cuvs-arrive-in-southern-california-0000002989 (accessed on 17 September 2018).
  11. Marx, N.; Hissel, D.; Gustin, F.; Boulon, L.; Agbossou, K. On the sizing and energy management of a hybrid multi-stack fuel cell—Battery system for automotive applications. Int. J. Hydrog. Energy 2017, 42, 1518–1526. [Google Scholar] [CrossRef]
  12. Feroldi, D.; Carignano, M. Sizing for fuel cell/supercapacitor hybrid vehicles based on stochastic driving cycles. Appl. Energy 2016, 183, 645–658. [Google Scholar] [CrossRef]
  13. Hu, X.; Johannesson, L.; Murgovski, N.; Egardt, B. Longevity-conscious dimensioning and power management of the hybrid energy storage system in a fuel cell hybrid electric bus. Appl. Energy 2015, 137, 913–924. [Google Scholar] [CrossRef]
  14. Hu, X.; Murgovski, N.; Johannesson, L.M.; Egardt, B. Optimal dimensioning and power management of a fuel cell/battery hybrid bus via convex programming. IEEE ASME Trans. Mechatron. 2015, 20, 457–468. [Google Scholar] [CrossRef]
  15. Xiao, B.; Lu, H.; Wang, H.; Ruan, J.; Zhang, N. Enhanced regenerative braking strategies for electric vehicles: Dynamic performance and potential analysis. Energies 2017, 10. [Google Scholar] [CrossRef]
  16. He, C.; Wang, G.; Gong, Z.; Xing, Z.; Xu, D. A Control Algorithm for the Novel Regenerative–Mechanical Coupled Brake System with by-Wire Based on Multidisciplinary Design Optimization for an Electric Vehicle. Energies 2018, 11, 2322. [Google Scholar] [CrossRef]
  17. Ravey, A.; Member, S.; Watrin, N.; Blunier, B.; Bouquain, D.; Miraoui, A.; Member, S. Energy-Source-Sizing Methodology for Hybrid Fuel Cell Vehicles Based on Statistical Description of Driving Cycles. IEEE Trans. Veh Technol. 2015, 60, 4164–4174. [Google Scholar] [CrossRef]
  18. Hegazy, O.; Van Mierlo, J. Particle swarm optimization for optimal powertrain component sizing and design of fuel cell hybrid electric vehicle. In Proceedings of the International Conference on Optimisation of Electrical and Electronic Equipment, OPTIM, Basov, Romania, 20–22 May 2010; IEEE: Piscataway, NJ, USA, 2010; pp. 601–609. [Google Scholar]
  19. Kamali-Nejad, M.; Azib, T.; Remy, G.; Bethoux, O.; Marchand, C. Optimization of a power electronic structure for hybrid Fuel Cell/Ultracapacitors vehicle. In Proceedings of the 2010 IEEE Vehicle Power and Propulsion Conference, Lille, France, 1–3 September 2010; IEEE: Piscataway, NJ, USA, 2010; pp. 1–6. [Google Scholar]
  20. Cai, Q.; Brett, D.J.L.; Browning, D.; Brandon, N.P. A sizing-design methodology for hybrid fuel cell power systems and its application to an unmanned underwater vehicle. J. Power Sources 2010, 195, 6559–6569. [Google Scholar] [CrossRef]
  21. Rotenberg, D.; Vahidi, A.; Kolmanovsky, I. Ultracapacitor assisted powertrains: Modeling, control, sizing, and the impact on fuel economy. IEEE Trans. Control Syst. Technol. 2011, 19, 576–589. [Google Scholar] [CrossRef]
  22. Hu, X.; Murgovski, N.; Johannesson, L.M.; Egardt, B. Comparison of three electrochemical energy buffers applied to a hybrid bus powertrain with simultaneous optimal sizing and energy management. IEEE Trans. Intell. Trans. Syst. 2014, 15, 1193–1205. [Google Scholar] [CrossRef]
  23. Bubna, P.; Advani, S.G.; Prasad, A.K. Integration of batteries with ultracapacitors for a fuel cell hybrid transit bus. J. Power Sources 2012, 199, 360–366. [Google Scholar] [CrossRef]
  24. Aschilean, I.; Varlam, M.; Culcer, M.; Iliescu, M.; Raceanu, M.; Enache, A.; Filote, C. Hybrid Electric Powertrain with Fuel Cells for a Series Vehicle. Energies 2018, 11, 1294. [Google Scholar] [CrossRef]
  25. Yu, Z.; Zinger, D.; Bose, A. An innovative optimal power allocation strategy for fuel cell, battery and supercapacitor hybrid electric vehicle. J. Power Sources 2011, 196, 2351–2359. [Google Scholar] [CrossRef]
  26. Snoussi, J.; Ben Elghali, S.; Benbouzid, M.; Mimouni, M. Auto-Adaptive Filtering Based Energy Management Strategy for Fuel Cell Hybrid Electric Vehicles. Energies 2018, 11, 2118. [Google Scholar] [CrossRef]
  27. Ruan, X.; Wu, C.; Cheng, L.; Tse, C.K.; Yan, H.; Zhang, T. Control Strategy for Input-Series–Output-Parallel Converters. IEEE Trans. Ind. Electron. 2009, 56, 1174–1185. [Google Scholar] [CrossRef]
  28. Zumel, P.; Ortega, L.; Lazaro, A.; Fernandez, C.; Barrado, A. Control strategy for modular Dual Active Bridge input series output parallel. In Proceedings of the IEEE 14th Workshop on Control and Modeling for Power Electronics (COMPEL), Salt Lake City, UT, USA, 23–26 June 2013; IEEE: Piscataway, NJ, USA, 2013. [Google Scholar] [CrossRef]
  29. Raga, C.; Barrado, A.; Lazaro, A.; Miniguano, H.; Zumel, P.; Sanz, M. Optimal sizing of propulsion systems applied to fuel cell based vehicles. In Proceedings of the IEEE Energy Conversion Congress and Exposition, Pittsburgh, PA, USA, 14–18 September 2014; pp. 4797–4803. [Google Scholar]
  30. Lei, Z.; Cheng, D.; Liu, Y.; Qin, D.; Zhang, Y.; Xie, Q. A dynamic control strategy for hybrid electric vehicles based on parameter optimization for multiple driving cycles and driving pattern recognition. Energies 2017, 10. [Google Scholar] [CrossRef]
  31. Grube, T.; Stolten, D. The Impact of Drive Cycles and Auxiliary Power on Passenger Car Fuel Economy. Energies 2018, 11, 1010. [Google Scholar] [CrossRef]
  32. Cubito, C.; Millo, F.; Boccardo, G.; Di Pierro, G.; Ciuffo, B.; Fontaras, G.; Trentadue, G. Impact of Different Driving Cycles and Operating Conditions on CO2 Emissions and Energy Management Strategies of a Euro-6 Hybrid Electric Vehicle. Energies 2017, 10, 1590. [Google Scholar] [CrossRef]
  33. Kivekäs, K.; Lajunen, A.; Vepsäläinen, J.; Tammi, K. City Bus Powertrain Comparison : Driving Cycle Variation and Passenger Load Sensitivity Analysis. Energies 2018, 17, 1755. [Google Scholar] [CrossRef]
  34. Henao, N.; Kelouwani, S.; Agbossou, K.; Dube, Y. PEMFC low-temperature startup for electric vehicle. In Proceedings of the IEEE Industrial Electronics Society Annual Conference, Montreal, QC, Canada, 25–28 October 2012; pp. 2977–2982. [Google Scholar]
  35. Cost Analysis of Fuel Cell Systems for Transportation. Available online: https://www1.eere.energy.gov/hydrogenandfuelcells/pdfs/tiax_cost_analysis_pres.pdf (accessed on 17 September 2018).
  36. Azkarate, I.; Ezponda, E.; Agote, I. Hidrógeno y Pilas de Combustible: Estado Actual y Perspectiva Inmediata, 1st ed.; Asociación Nacional de Ingenieros del ICAI, Universidad Pontificia Comillas, Eds.; INASMET: Madrid, Spain, 2007; ISBN 978-84-9359050-6-7. [Google Scholar]
  37. Oliver, J.A.; Zumel, P.; Sanz, M.; Raga, C.; Izquierdo, D.; Garcia, O.; Barrado, A.; Prieto, R.; Azcona, R.; Delicado, B.; et al. High level decision methodology for the selection of a fuel cell based power distribution architecture for an aircraft application. In Proceedings of the Energy Conversion Congress and Exposition (ECCE 2009), San Jose, CA, USA, 20–24 September 2009; IEEE: Piscataway, NJ, USA, 2009; pp. 459–464. [Google Scholar]
  38. Kolar, J.W.; Drofenik, U.; Biela, J.; Heldwein, M.L.; Ertl, H.; Friedli, T.; Round, S.D. PWM Converter Power Density Barriers. In Proceedings of the Power Conversion Conference—Nagoya, Nagoya, Japan, 2–5 April 2007; pp. 9–29. [Google Scholar]
  39. Sahay, K.; Dwivedi, B. Design and analysis of supercapacitors energy storage system for energy stabilization of distribution network. Electr. Power Qual. Util. 2009, 15, 25–32. [Google Scholar]
  40. Vazquez, S.; Lukic, S.M.; Galvan, E.; Franquelo, L.G.; Carrasco, J.M. Energy Storage Systems for Transport and GridApplications. IEEE Trans. Ind. Electron. 2010, 57, 3881–3895. [Google Scholar] [CrossRef]
  41. Khaligh, A.; Li, Z. Battery, Ultracapacitor, Fuel Cell, and Hybrid Energy Storage Systems for Electric, Hybrid Electric, Fuel Cell, and Plug-In Hybrid Electric Vehicles: State of the Art. Veh. Technol. IEEE Trans. 2010, 59, 2806–2814. [Google Scholar] [CrossRef]
  42. Ehsani, M.; Gao, Y.; Miller, J.M. Hybrid Electric Vehicles: Architecture and Motor Drives. Pro. IEEE 2007, 95, 719–728. [Google Scholar] [CrossRef]
  43. Miller, J.M. Energy storage system technology challenges facing strong hybrid, plug-in and battery electric vehicles. In Proceedings of the Vehicle Power and Propulsion Conference, Dearborn, MI, USA, 7–10 September 2009; IEEE: Piscataway, NJ, USA, 2009; pp. 4–10. [Google Scholar]
  44. Cost Analysis of PEM Fuel Cell Systems for Transportation. 2005. Available online: https://www.nrel.gov/docs/fy06osti/39104.pdf (accessed on 17 September 2018.).
  45. Targets for Onboard Hydrogen Storage Systems for Light-Duty Vehicles. Available online: https://www1.eere.energy.gov/hydrogenandfuelcells/storage/pdfs/targets_onboard_hydro_storage_explanation.pdf (accessed on 17 September 2018.).
  46. DOE Hydrogen and Fuel Cells Program Record 9017: On-Board Hydrogen Storage Systems—Projected Performance and Cost Parameters. Available online: https://www.hydrogen.energy.gov/pdfs/9017_storage_performance.pdf (accessed on 17 September 2018.).
  47. De Bruijn, F.A. PEM Fuel Cells Durability and Cost. 2009. Available online: https://www.ecn.nl/docs/library/report/2009/l09177.pdf (accessed on 17 September 2018).
  48. Besselink, I.J.M.; van Oorschot, P.F.; Meinders, E.; Nijmeijer, H. Design of an efficient, low mass battery electric vehicle based on a VW Lupo 3L. In Proceedings of the 25th International Battery, Hybrid and Fuel Cell Electric Vehicle Symposium (EVS 25), Shenzen, China, 5–9 November 2010; pp. 32–41. [Google Scholar]
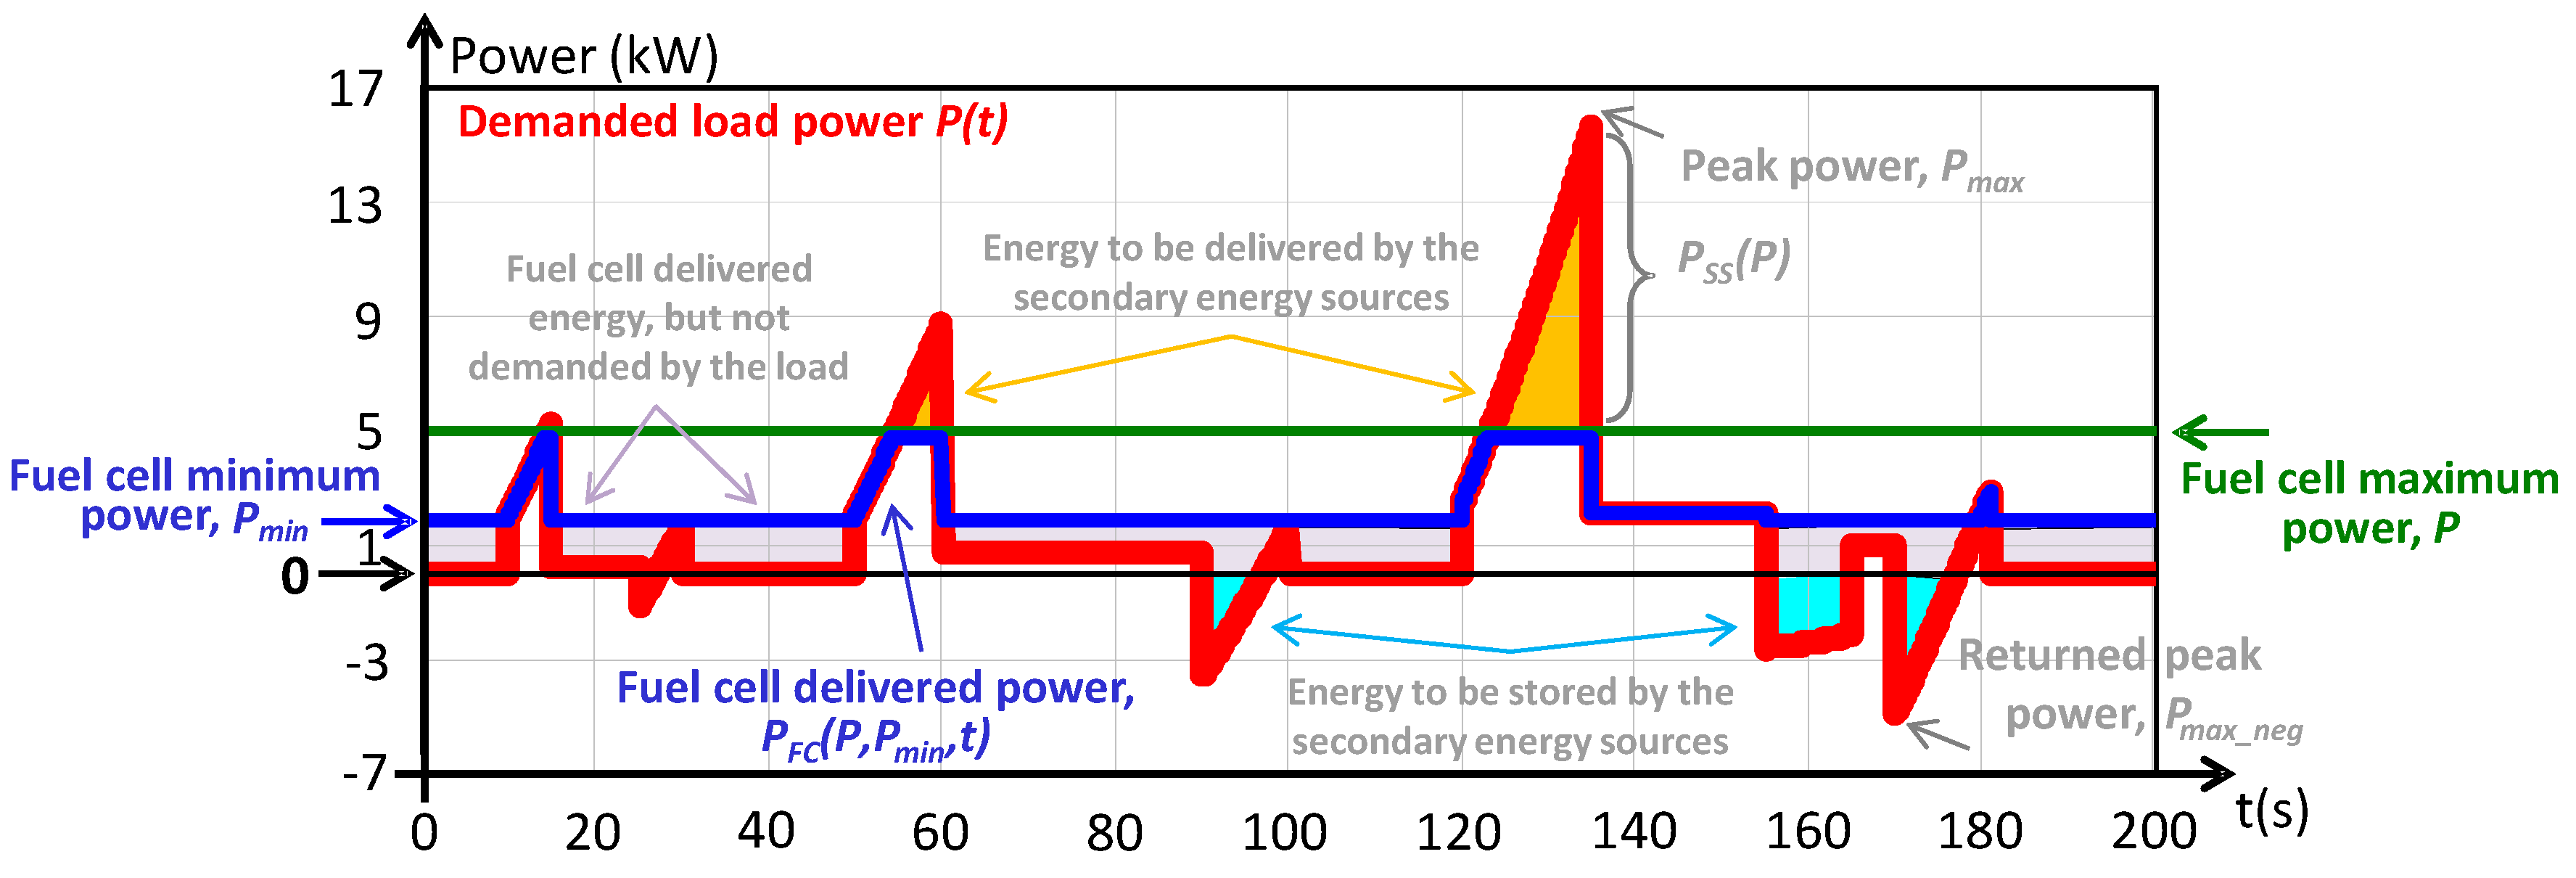
Figure 1. Demanded power by the load during one ECE-15 driving cycle.
Energies 11 02597 g001
Figure 2. Each power definition placement within the power distribution architecture.
Energies 11 02597 g002
Figure 3. Equations system graphic solution in the first quadrant.
Energies 11 02597 g003
Figure 4. Equations system graphic solution in the second quadrant.
Energies 11 02597 g004
Figure 5. Equations system graphic solution in the fourth quadrant.
Energies 11 02597 g005
Figure 6. Equations system graphic solution in the first quadrant.
Energies 11 02597 g006
Figure 7. Normalized battery mass as a function of the fuel cell maximum power.
Energies 11 02597 g007
Figure 8. Secondary energy sources total mass (kg).
Energies 11 02597 g008
Figure 9. Power distribution architectures based on a fuel cell, supercapacitors and batteries.
Energies 11 02597 g009
Figure 10. Power converters mass and cost.
Energies 11 02597 g010
Figure 11. Batteries mass and cost.
Energies 11 02597 g011
Figure 12. Supercapacitors mass and cost.
Energies 11 02597 g012
Figure 13. Architectures 1B and 2B mass.
Energies 11 02597 g013
Figure 14. Architectures 1B and 2B cost.
Energies 11 02597 g014
Figure 15. Architecture 1BC mass and cost.
Energies 11 02597 g015
Figure 16. Architecture 2BC mass and cost.
Energies 11 02597 g016
Figure 17. Architecture 3BC mass and cost.
Energies 11 02597 g017
Figure 18. Architecture 1C1 mass and cost.
Energies 11 02597 g018
Figure 19. Architecture 1C2 mass and cost.
Energies 11 02597 g019
Figure 20. Architecture 2C mass and cost.
Energies 11 02597 g020
Figure 21. Architecture 3C mass and cost.
Energies 11 02597 g021
Figure 22. Architectures mass (kg), volume (l) and cost (€), depending on the fuel cell maximum power.
Energies 11 02597 g022
Figure 23. Fuel cell system emulator.
Energies 11 02597 g023
Figure 24. Control card and DC-DC converter.
Energies 11 02597 g024
Figure 25. Control card.
Energies 11 02597 g025
Figure 26. Batteries set.
Energies 11 02597 g026
Figure 27. Load system emulator.
Energies 11 02597 g027
Figure 28. Load power profile.
Energies 11 02597 g028
Figure 29. Connection block diagram.
Energies 11 02597 g029
Figure 30. Comparison between simulated and measured results of the system main magnitudes: (a) Load current. (b) Battery current. (c) DC-DC power converter output current. (d) Fuel cell output current. (e) DC bus voltage and its relative error.
Energies 11 02597 g030
Figure 31. Simulated and measured results of (a) demanded current by the load and (b) DC bus voltage, during 20 driving cycles.
Energies 11 02597 g031
Figure 32. Experimentally measured and simulated battery current along the 8 h working day.
Energies 11 02597 g032
Figure 33. A detail of the first 10 driving cycles of both the measured and simulated battery current, along an 8 h working day.
Energies 11 02597 g033
Figure 34. Experimentally measured and simulated DC bus voltage along the 8 h working day.
Energies 11 02597 g034
Figure 35. A detail of the last 150 min of both the measured and simulated DC bus voltage along an 8 h working day.
Energies 11 02597 g035
Table 1. Subsystems architectures data [29].
EquipmentValue
Unidirectional power converter   ρ P u n i = 12.5   W / kg
Bidirectional power converter   ρ P b i = 10   W / kg
Supercapacitors   ρ P S C = 4000   W / kg
  ρ E S C = 5   Wh / kg
Batteries (Lithium-Ion)   ρ P B a t = 300   W / kg
  ρ E B a t = 100   Wh / kg
Fuel cell   ρ P F C = 500   W / kg
H2 storage system gravimetric capacity 4800 g H2/g
ρ E k g = 1600   Wh / kg
H2 storage system volumetric capacity25.6 g H2/L
850 Wh/l
Fuel cell efficiencyηFC = 0.6
Unidirectional power converter efficiencyηuni = 0.95
Bidirectional power converter efficiencyηbi = 0.9
Supercapacitor efficiencyηsc= 0.95
Battery efficiencyηB= 0.95
Table 2. Subsystems architectures price for production of 500,000 units [29].
EquipmentValue
Fuel cellPrPC = 0.2 €/W
H2 storage systemPrst =0.24 €/Wh
Unidirectional power converterPruni = 0.056 €/W
Bidirectional power converterPrbi = 0.067 €/W
SupercapacitorsPrsc = 2 × 10⁻³ €/Wh
BatteriesPrBat = 170 × 10−3 €/Wh