Article

Effect of Intermediate Principal Stress on the Strength, Deformation, and Permeability of Sandstone

1
State Key Laboratory of Coal Mine Disaster Dynamics and Control, Chongqing University, Chongqing 400030, China
2
College of Resource and Environmental Sciences, Chongqing University, Chongqing 400030, China
3
State Key Laboratory of Coal Resources and Safe Mining, China University of Mining and Technology, Xuzhou 221116, China
4
Deep Earth Energy Research Laboratory, Department of Civil Engineering, Monash University, Melbourne, VIC 3800, Australia
*
Author to whom correspondence should be addressed.
Energies 2018, 11(10), 2694; https://doi.org/10.3390/en11102694
Submission received: 4 September 2018 / Revised: 17 September 2018 / Accepted: 25 September 2018 / Published: 10 October 2018

Abstract

:
Although the mechanical behaviors and flow aspects of sandstone have been previously investigated, studies of the effect of the intermediate principal stress (σ2) on the strength, deformation, and permeability of sandstone are lacking. In this work, the mechanical behaviors and permeability of sandstone under true triaxial stress conditions were investigated using a newly developed true triaxial geophysical apparatus. The experimental results showed that with increasing σ2, the peak strength, octahedral effective normal stress, and octahedral effective shear stress of the sandstone increased, and the rate of increase decreased. This is because a larger intermediate principal stress coefficient b has an inhibitory effect on rock strength. In our study, as the ratio of σ2/σ3 increased, the specimen entered compressive strain in the σ2 direction during the first stress drop. The stress and strain path deviations occur during rock failure. The amount of deviation increased as the σ2 increased before the peak stress. This phenomenon indicates that elastic mechanics are not suitable for understanding this sandstone rock during its failure. The permeability evolution of the sandstone under true triaxial stress conditions was measured and analyzed to investigate the effect of σ2. During the complete true triaxial stress-strain experiments, the variation we found in gas seepage velocity could be divided into two stages. Before the first pressure drop, the gas seepage velocity was mainly affected by volume strain. After the first pressure drop, the seepage velocity was affected by the deviator strain, which can change the seepage channels.

1. Introduction

Minerals and energy are often found in deep rock formations and are generally in a complex, high-stress state. During the process of mineral and energy development, the stress state of the rock mass is changed, and fractures in the rock begin to germinate and develop. The fracture distribution under different stress states directly affects the mining process, particularly during the oil, gas, and geothermal recovery processes [1,2]. Triaxial experiments have been widely conducted to investigate the geomechanical and fluid flow behaviors of rocks under different stress conditions, which are of vital importance in evaluating the performance and efficiency of energy exploitation. Traditional triaxial experiments have been generally conducted under conventional triaxial stress (σ2 = σ3) conditions, ignoring the effects of σ2 on the geomechanical properties and permeability of rocks.
Although many strength criteria for rocks have been proposed in previous research, most strength criteria have ignored the influence of the intermediate principal stress (σ2) and cannot reliably predict the true strength characteristics of rocks [3,4]. Hence, studies have been conducted to investigate the effects of σ2 during recent years. Colmenares et al. compared several failure criteria to publish true triaxial experimental data [5]. Haimson conducted several true triaxial experiments on crystalline rocks and summarized the effects of σ2 on brittle rocks [6]. Yang conducted true triaxial experiments on concrete and found that its strength changed with increasing σ2 [7]. Chang et al. proposed a criterion that involved fitting the curves of several true triaxial experimental data [8]. Mogi developed the first true triaxial apparatus for rock and proposed a complete true triaxial strength criterion based on his experimental data [9,10]. Following his pioneering work, other laboratories have developed true triaxial apparatuses and have proposed true triaxial strength criteria [11,12,13,14]. Meanwhile, researchers have also found that the peak strength, deformation, and ductility of rock are all affected by the intermediate principal [15,16,17]. Pan et al.’s research showed that a critical value of σ2 exists. Below this value, in their experiments σ2 had a positive effect on the peak strength, while above this critical stress, the peak strength was negatively affected [18]. Phueakphum et al. found that σ2 significantly affects the tensile strength of rock [19]. Yin et al. used a self-developed true triaxial apparatus to investigate the rock failure mechanism along different stress paths [20]. The results showed that rock strength and deformation are highly dependent on the stress path. Haimson and Rudnicki found that the internal friction angles of rocks are not constant under different σ2 values [21,22]. The internal friction angle of their samples increased with the increasing intermediate principal stress coefficient.
The permeability of rocks is also affected by σ2 [23]. The directional transport characteristics and pore volume change in sandstone under true triaxial stress were studied by Al-Harthy et al. [24]. An advanced true triaxial apparatus with seismic and resistivity sensors was developed that can evaluate rock permeability properties and fracture delineations [25,26,27]. Li et al. developed a new geophysical type of equipment with which they investigated shale permeability under true triaxial stress states [28,29].
Therefore, σ2 plays an important role in rock strength, deformation, and permeability. This work presents strength, deformation, and permeability measurements of sandstone under true triaxial stress conditions using the newly-developed, multi-functional, true triaxial geophysical (TTG) apparatus [28]. The results were used to investigate the geomechanical and fluid flow behavior of the sandstone under true triaxial stress conditions.

2. Instruments Used and Methodology

2.1. Experimental Apparatus

A new multi-functional true triaxial geophysical (TTG) apparatus was self-developed by Chongqing University. Research on the mechanical properties and permeability of rock under a true triaxial stress state can be achieved using this apparatus.
Photographs and schematic diagrams of the apparatus are shown in Figure 1. There is a fluid channel in the loading plate that is in direct contact with the sample. To seal the gas fluid in the sample, a series of measures was taken. The four faces of the sample were covered with silicone rubber, and the sample was encased in heat-shrink tubing. A sealing oil with a pressure higher than that of the gas was also applied in order to contain the gas in the sample. The sealing structure is shown in Figure 1.

2.2. Experimental Scheme

The failure experiments were conducted under different stress conditions (see Table 1). During the loading process, load σ1 had a constant displacement rate of 0.001 mm/s, while σ2 and σ3 remained at a constant stress. The gas (CH4) injection pressure = 1 MPa, and the gas outlet valve opened to the atmosphere. Three-dimensional (3-D) strain and the outlet flow rate were continuously recorded during the experiments.

2.3. Specimen Preparation for the True-Triaxial Experiment

The sandstone specimens used in the testing were collected from outcrops in the Chayuan district of Chongqing, in the Sichuan basin in southwest China. The bulk density of this rock is 2290 kg/m3. The Brunauer-Emmett-Teller (BET) surface area is the area per gram of the sandstone. It was measured by the ASAP2010 apparatus and showed a value of 3.05 m2/g. The uniaxial compression test showed that the rock strength was 56.43 MPa. The samples showed a Young’s modulus of 5.17 GPa and a Poisson’s ratio of 0.33. The sandstone samples were ground to 100 × 100 × 100 mm3 cubes using a programmable grinding machine. Each cube was ground with an accuracy of 5 μm flatness on each face and opposite side parallelism. Figure 2 shows photographs of the specimens and the computed tomography (CT) scan images. The photographs of the raw rock samples are on the left side of Figure 2 and the finished rock specimens are shown in the middle. The CT scan images of the finished samples are shown on the right. The CT images of the cubic (upper) and sliced (below) samples show the homogeneity of this rock. Figure 3 shows scanning electron microscope (SEM) images of the sandstone. It can be seen from the scanning electron microscope (SEM) images that the diameter of the particles is approximately 0.13 mm, that of a medium-fine sandstone, and there are many pores in the particles.

3. Results and Discussion

3.1. Effect of Intermediate Principal Stress on Rock Strength

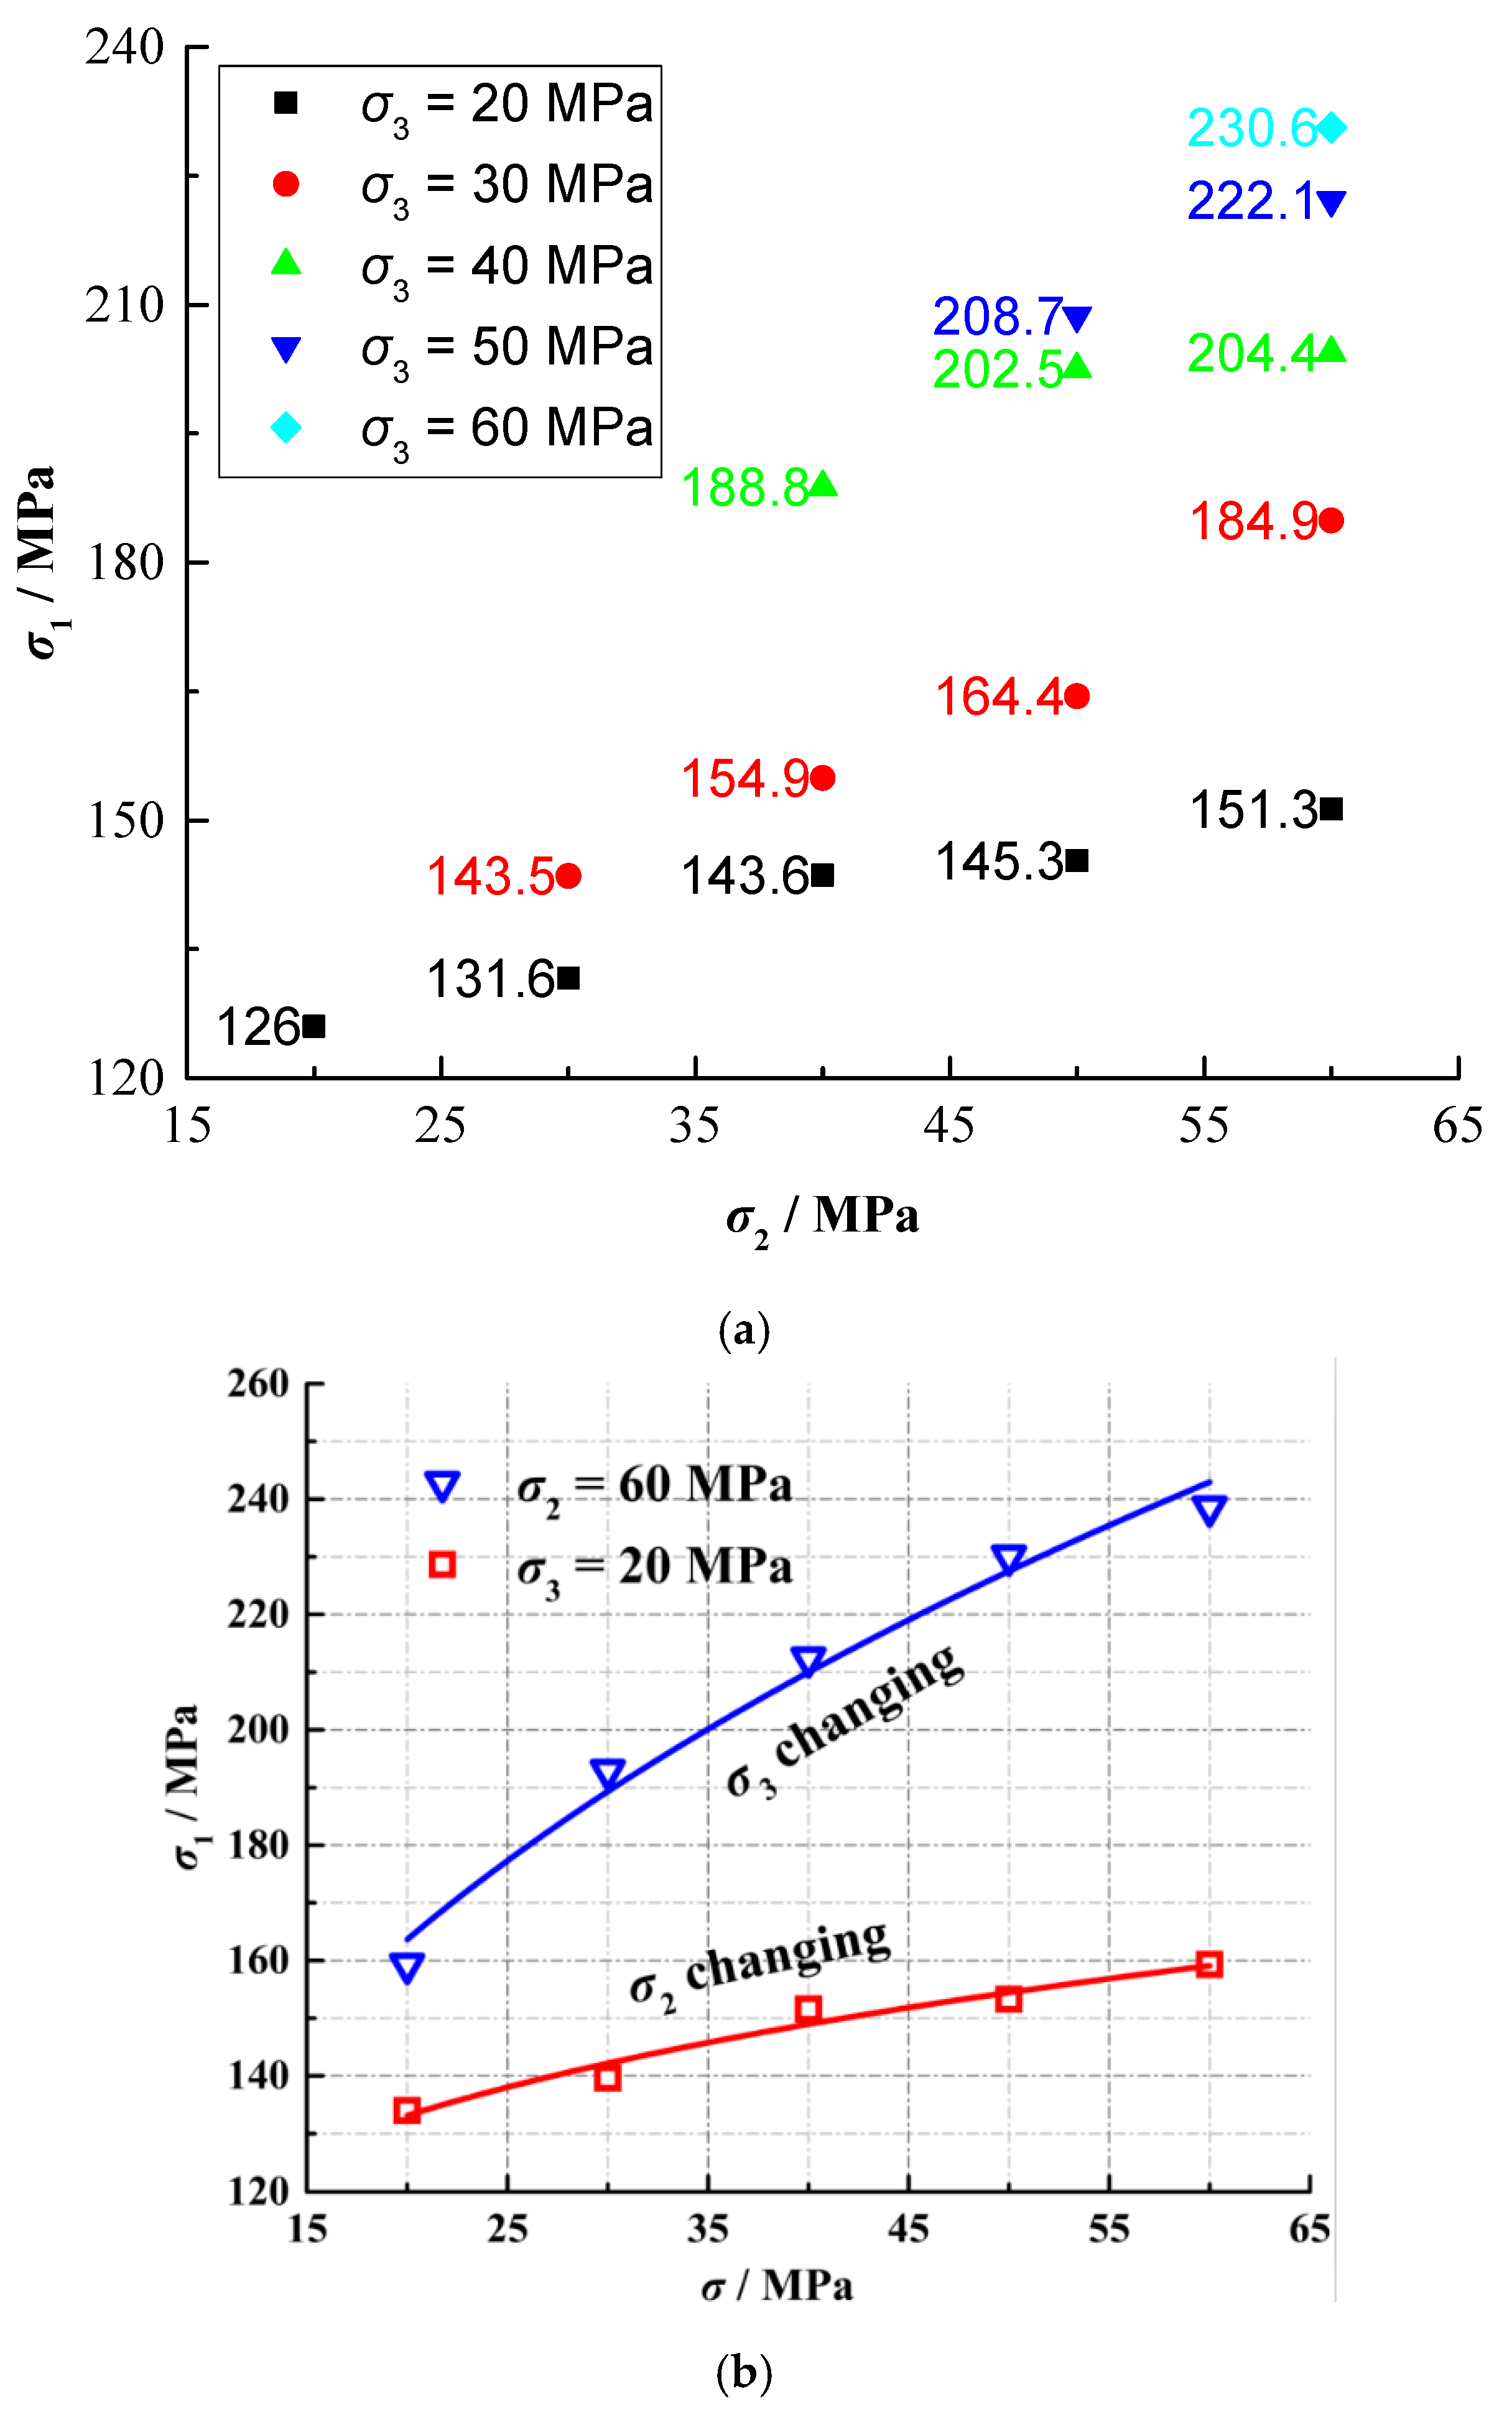
The peak strengths of the sandstone are shown in Figure 4a; the strength of the sandstone increased with increasing σ2 and σ3 for all specimens. As seen in Figure 4b, σ3 produced a greater increase in rock strength compared to σ2. It can be concluded that σ3 plays a more important role in enhancing rock strength than σ2, indicating that if a constant mean stress state is applied, the rock has a lower peak strength when there is a greater ratio of σ2 to σ3.
As is known, b is a parameter that can reflect the relationship of three principal stresses. It determines the direction of deviatoric stress in the cylindrical coordinate system. Thus, parameter b can affect the deviatoric strain and rock failure model. b decreases when σ3 increases, and increases when σ2 increases. Thus, considering the variation in b, the rock strength always increases under a smaller b stress state when the same increment of σ2 or σ3 is added. For example, in our experiment under the stress state of σ3 = 40 MPa and σ2 = 590 MPa, by increasing σ3 from 40 MPa to 50 MPa, the rock strength increased by 6.2 MPa. At the same time, b was reduced from 0.06 to 0. When σ2 increased from 40 MPa to 50 MPa, b increased from 0.06 to 0.12 and the increase in rock strength was only 1.9 MPa. Therefore, it is apparent that for the same amount of increase in σ2 or σ3, the difference in the impact on rock strength was mainly caused by the variation in b. Increasing σ2 and σ3 by the same amount had a greater influence on rock strength under a lesser b stress state than a greater one. Therefore, the influence of σ2 and σ3 on rock strength was mainly caused by b.
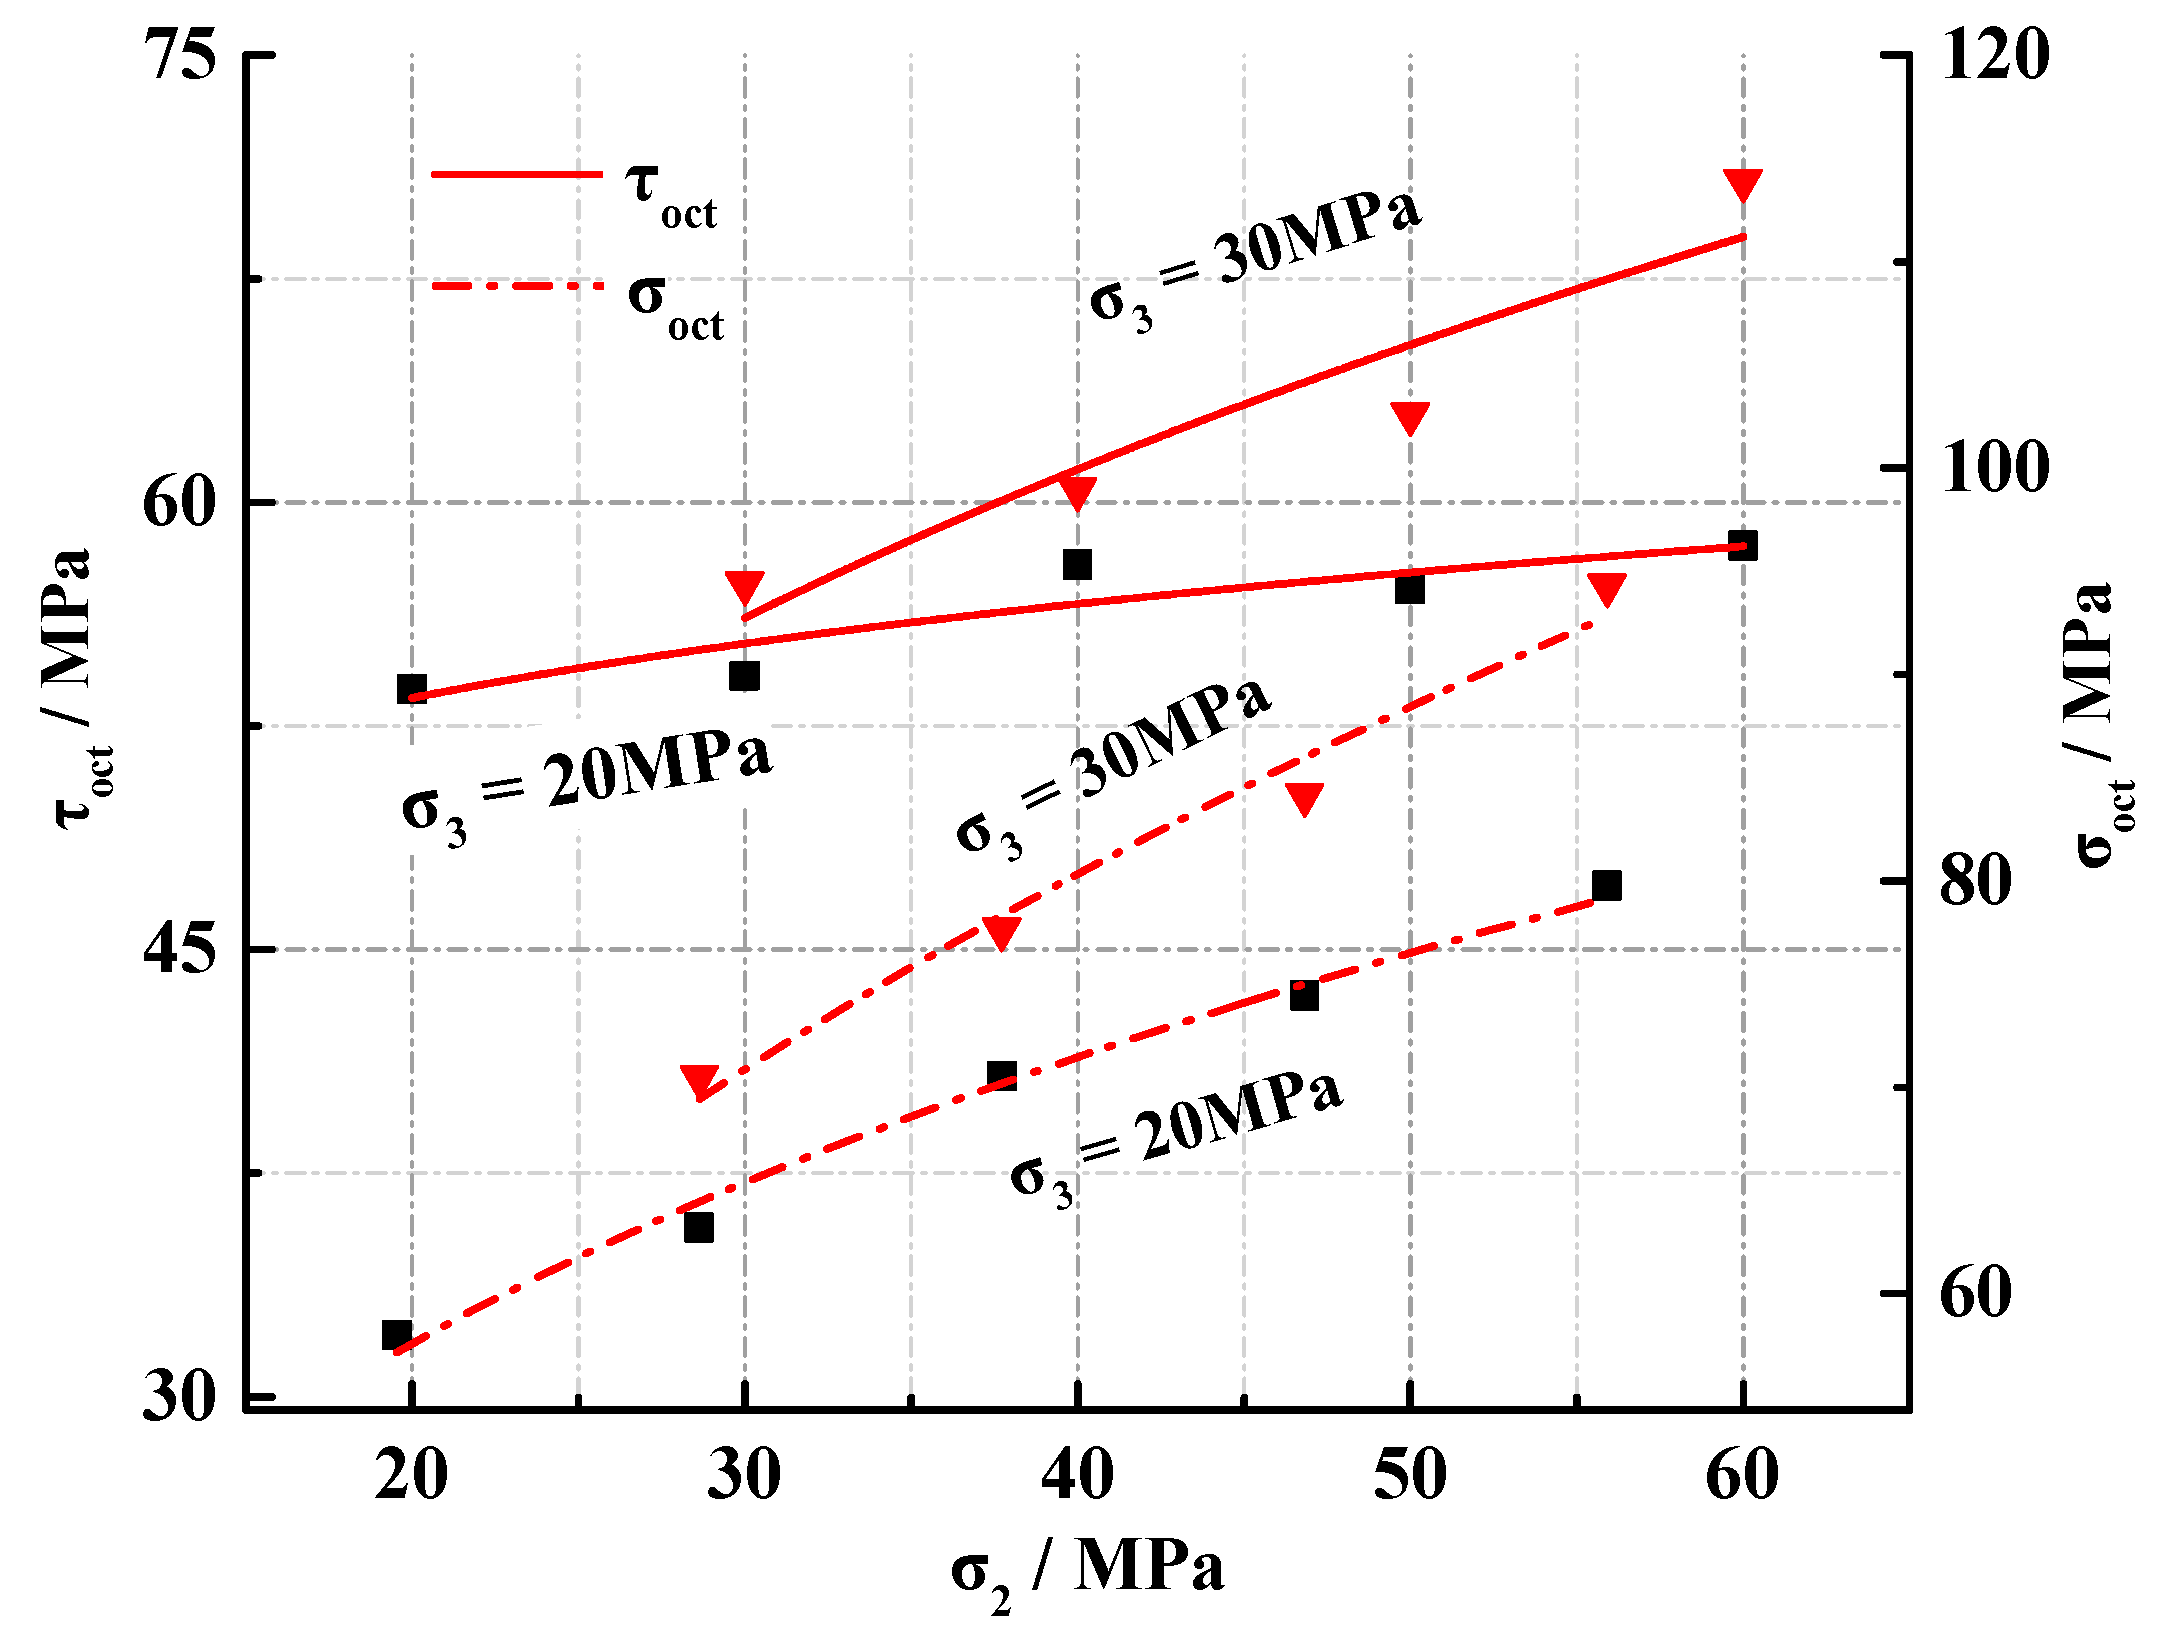
The octahedral shear stress τ o c t = 1 3 ( σ 1 σ 2 ) 2 + ( σ 1 σ 3 ) 2 + ( σ 2 σ 3 ) 2 and the octahedral effective normal stress σ o c t = 1 3 ( σ 1 + σ 2 + σ 3 ) are important mechanical parameters for many materials. The octahedral shear stress and octahedral effective normal stress represent two basic parameters of the cylindrical coordinate system. The normal stress can only cause a volume change and shear stress can only cause a shape change. Thus, many scholars use these two parameters in their strength criteria, such as the Mogi criterion [30] and the Drucker and Prager (D-P) strength criterion [31]. Figure 5 shows that with increasing σ2, the τoct and σoct of the sandstone increased at a reducing rate. In addition, the growth attenuation rate of τoct and σoct increased with increasing σ2. The growth attenuation rate was smaller under σ3 = 30 MPa than when σ3 = 20 MPa. These phenomena were still caused by the intermediate principal stress coefficient b. As previously mentioned, when σ3 is small, as σ2 increases, the rate of the increase in b is more rapid, which inhibits the continued growth of σ1. Therefore, the growth rate of the volume and deviatoric stresses was slow under a high b stress state. With increasing σ2, the τoct and σoct of our samples increased at a reducing rate.
It can be seen that during the true triaxial experiment, the intermediate principal stress coefficient b played an important role in rock strength increase. At the same time, the increase in σ2 not only caused an increase in the hydrostatic stress, but also a change in the intermediate principal stress coefficient b. Therefore, the change in rock strength caused by the change in σ2 under different σ3 values can be understood as the combinatory effect of the hydrostatic and intermediate principal stress coefficients. Thus, it was necessary to further study the influence of hydrostatic stress and b on rock strength under true triaxial stress conditions.

3.2. Effect of Intermediate Principal Stress on Rock Deformation

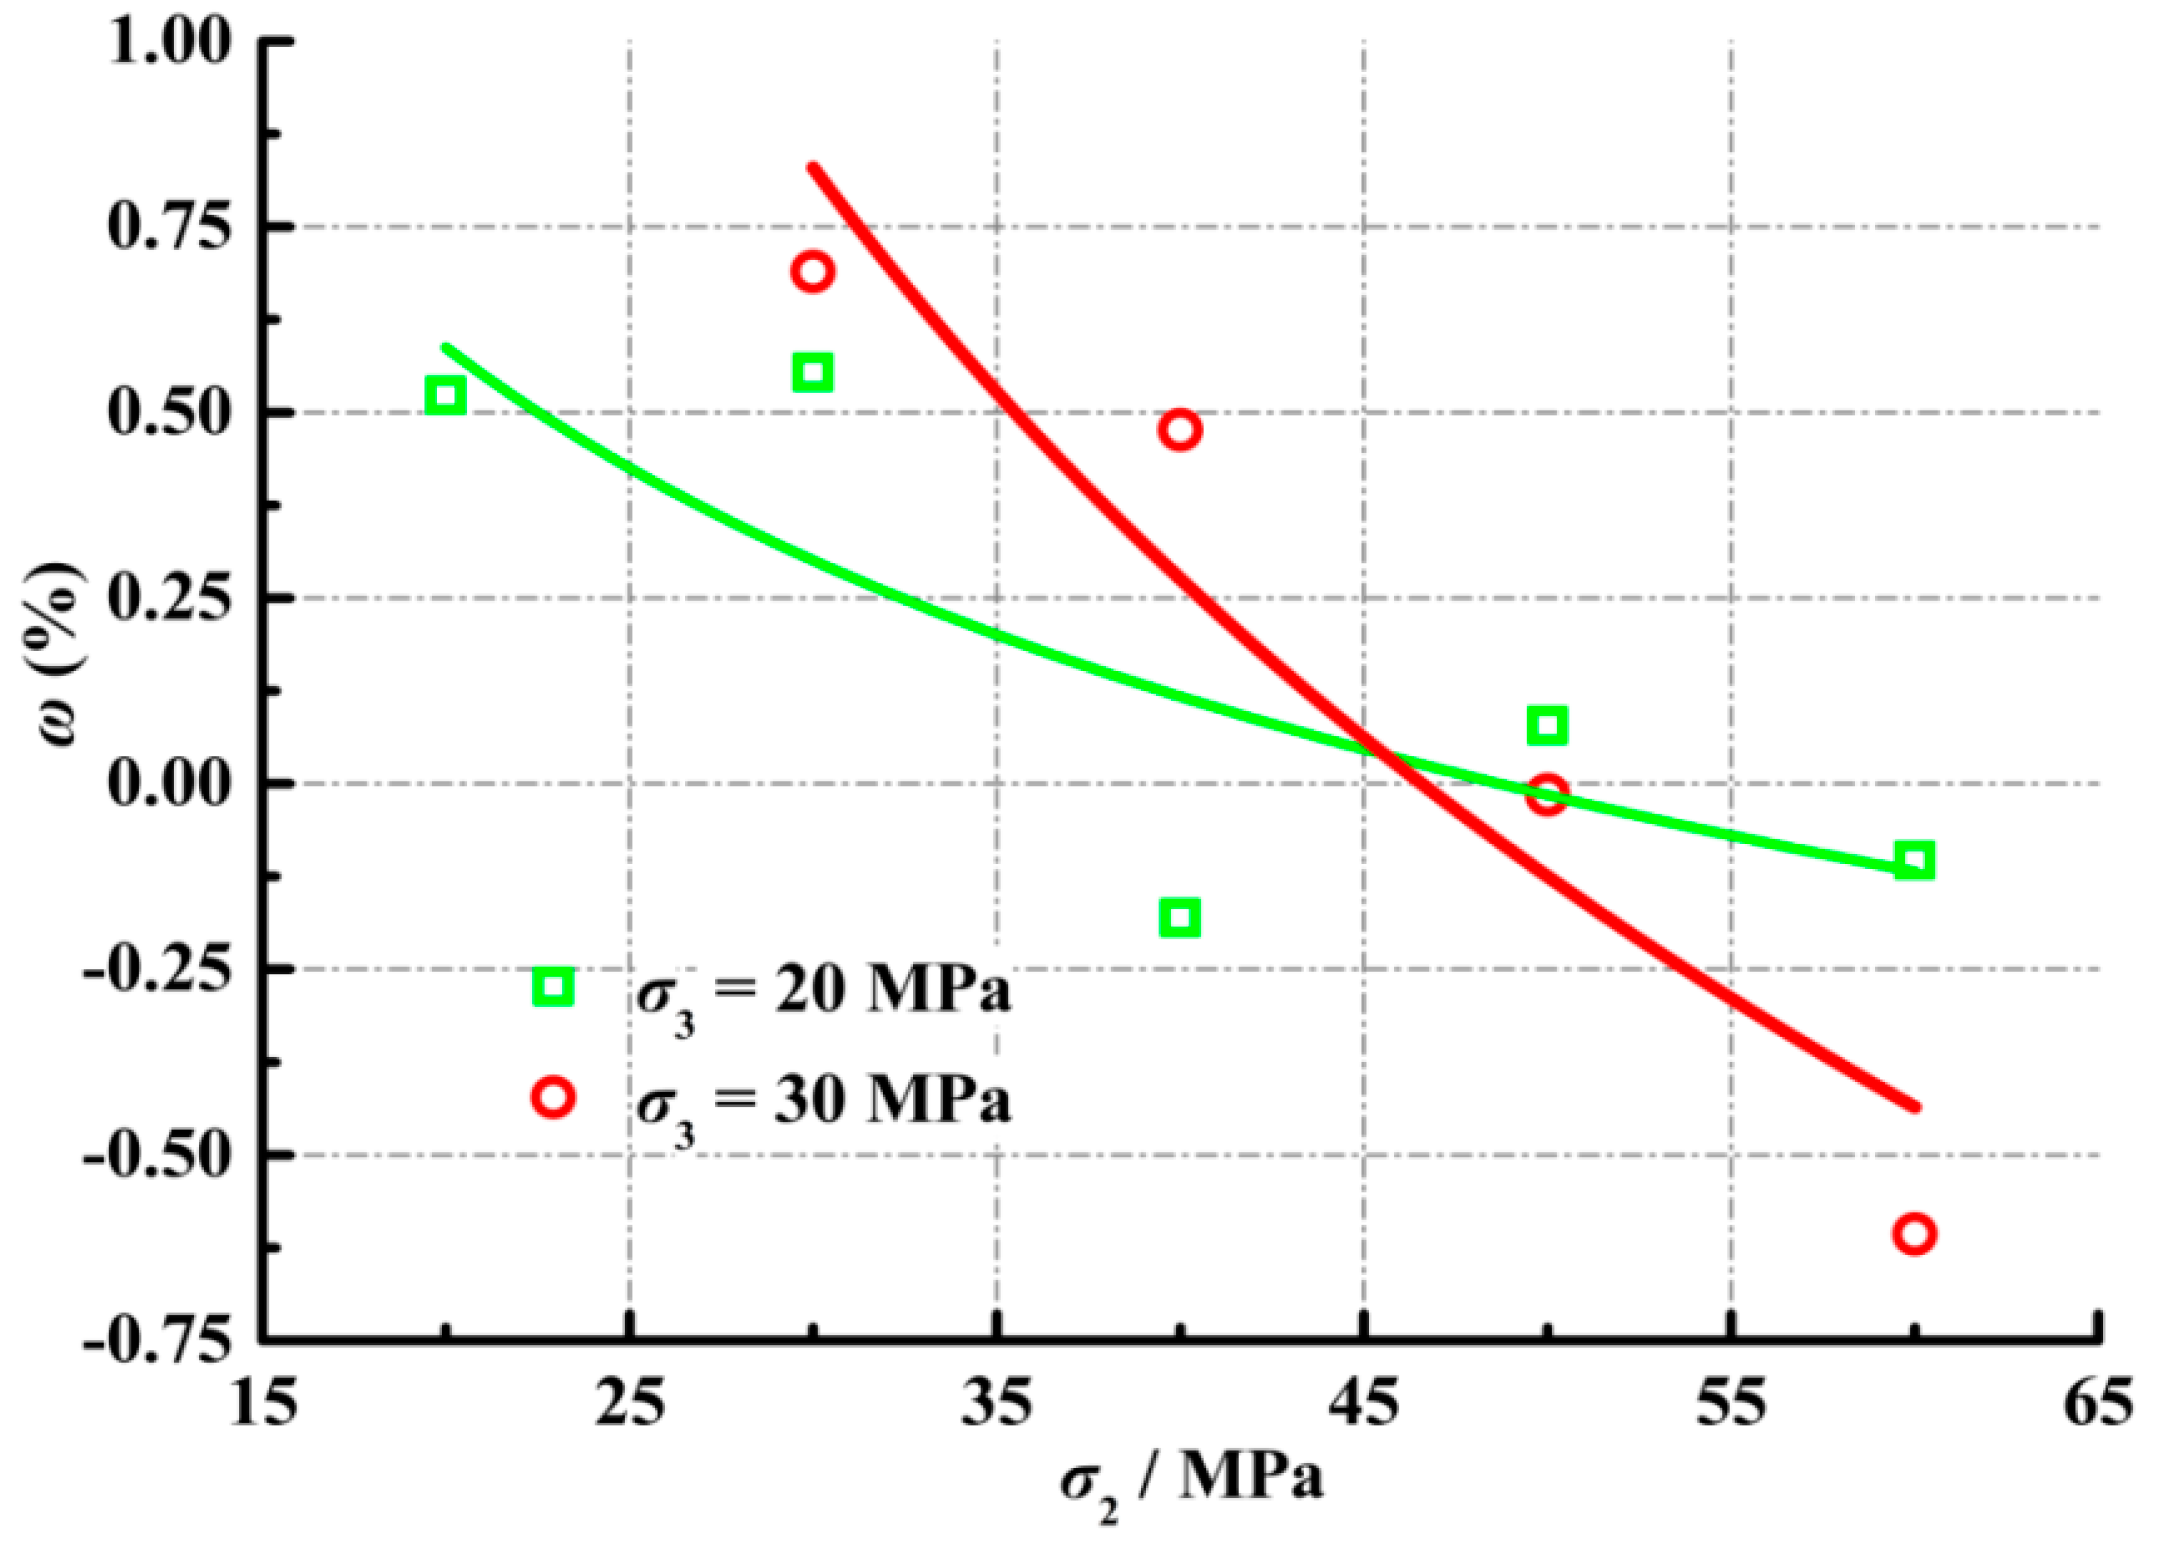
The post-peak deformation of rock is an important issue in understanding the mechanism of underground dynamic disasters. It shows how rock energy is released. We defined the deformation during the first stress drop as Δε, which is shown in Figure 6. ε2 is defined as the strain in the σ2 direction at the peak stress σ1. It can be affected not only by the amount of σ2, but also by the parameter b. It can act as a benchmark for studying the post-peak deformation in the σ2 direction. The ratio of Δε and ε2 is defined as ω. Figure 7 shows the relationship between ω and σ2. As shown in Figure 7, when σ2 was relatively low, the sandstone specimen was still expanding in the σ2 direction during the first stress drop stage. As the ratio of σ2/σ3 increased, the specimen entered compressive strain in the σ2 direction during the first stress drop, in which the compression exponentially increased with the increasing stress ratio.

3.3. Effect of Intermediate Principal Stress on the Transport Properties of the Sandstone

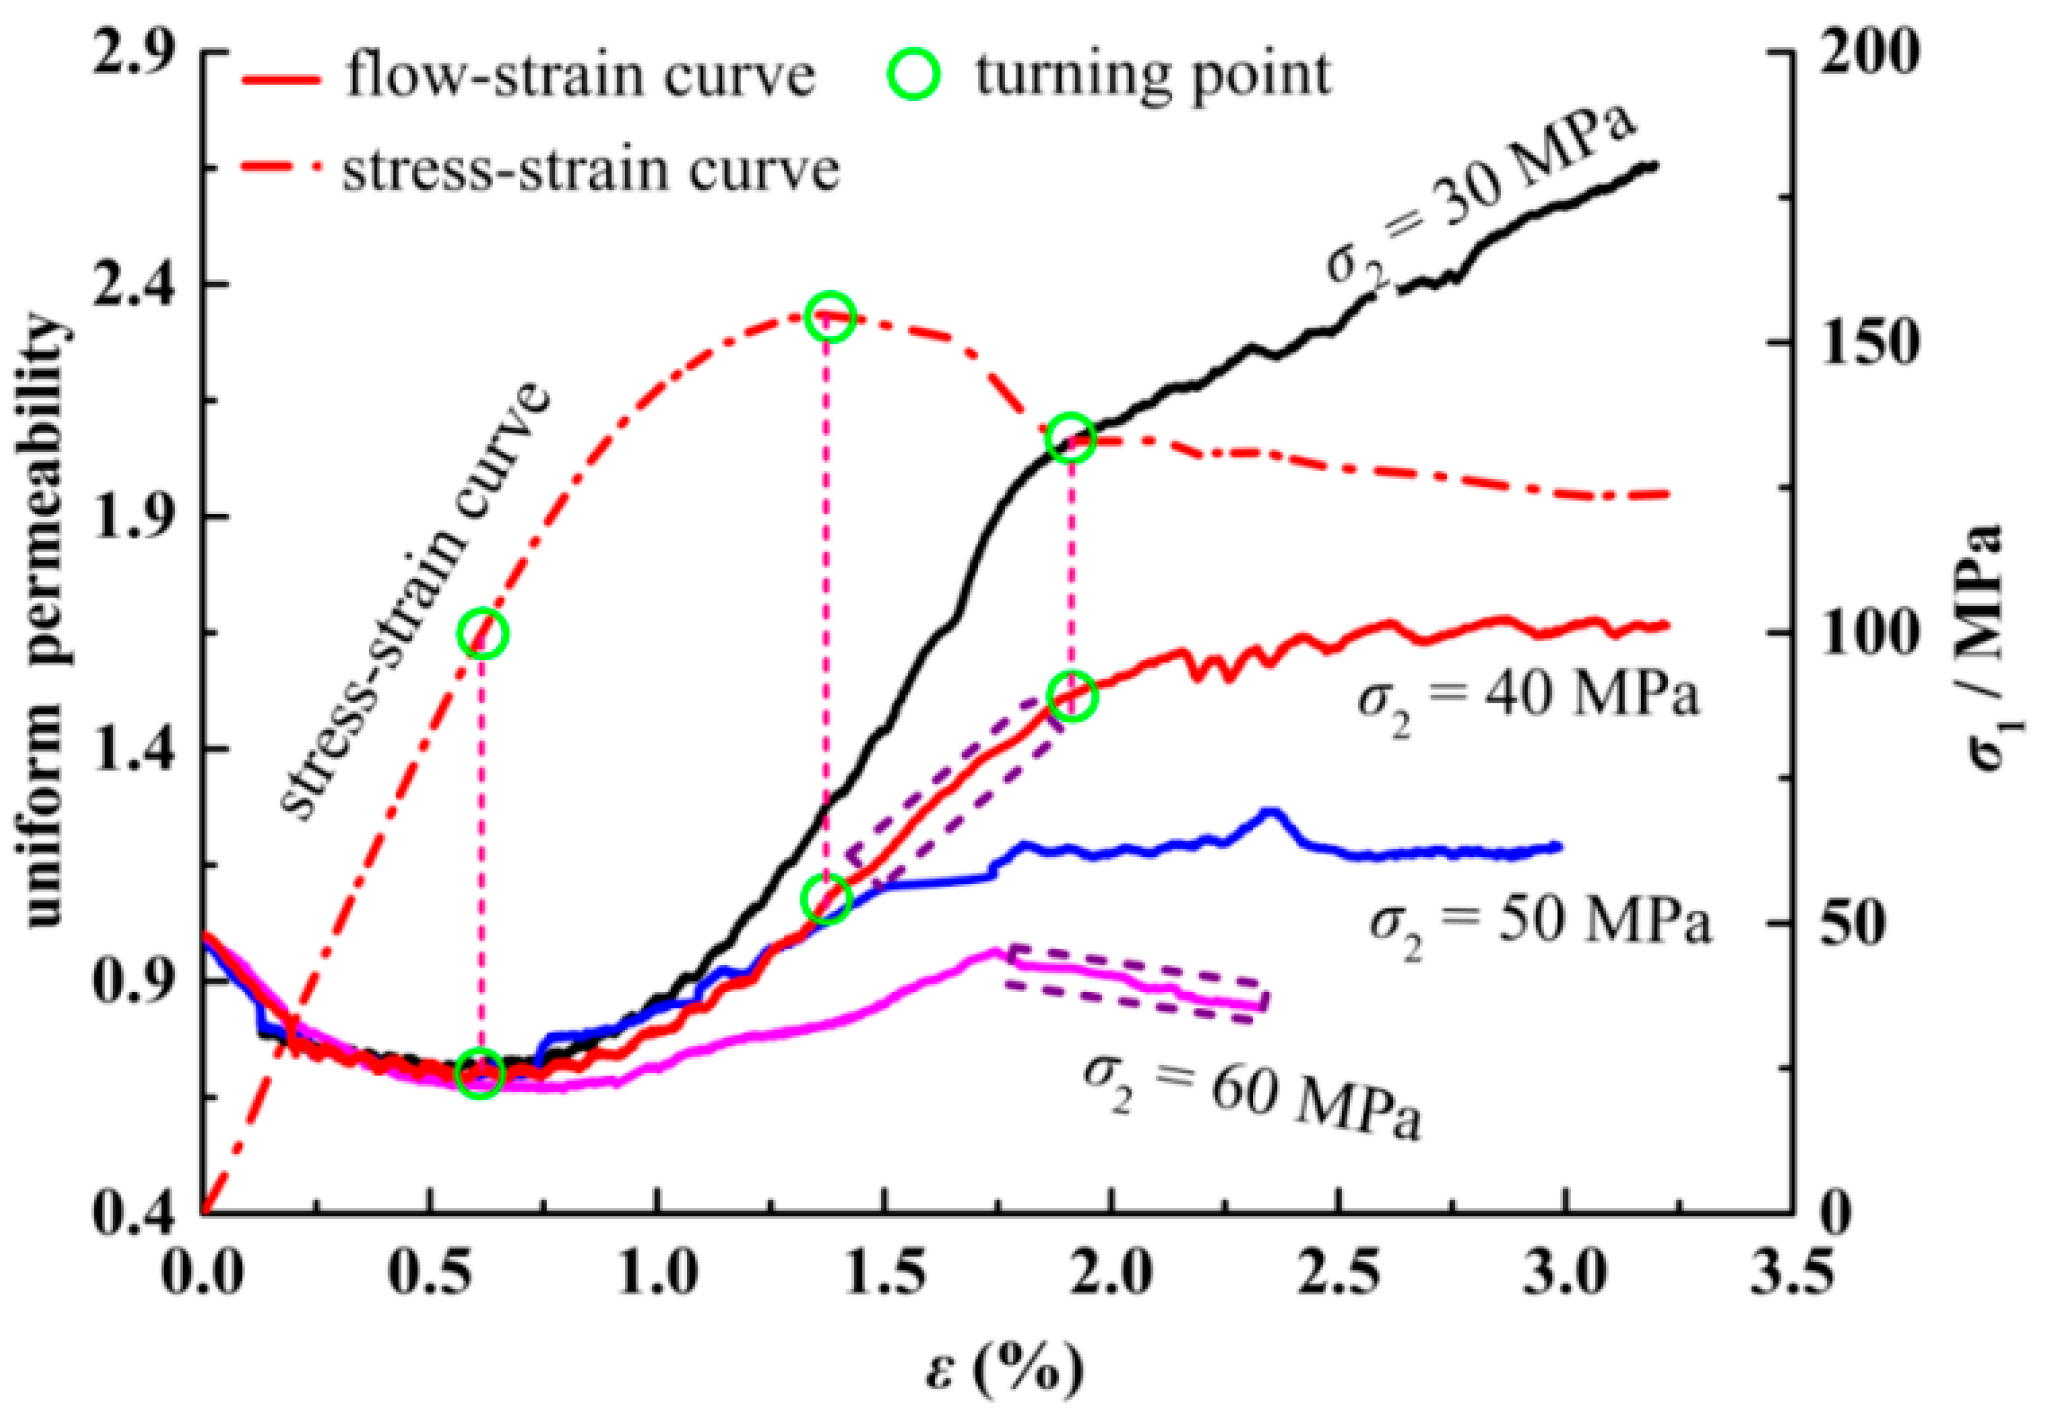
Figure 8 shows the relationship between permeability, σ1, and ε1. Considering the differing initial permeability of the sandstone, a uniform permeability was used to analyze the influence of σ2 on the permeability of the sandstone.
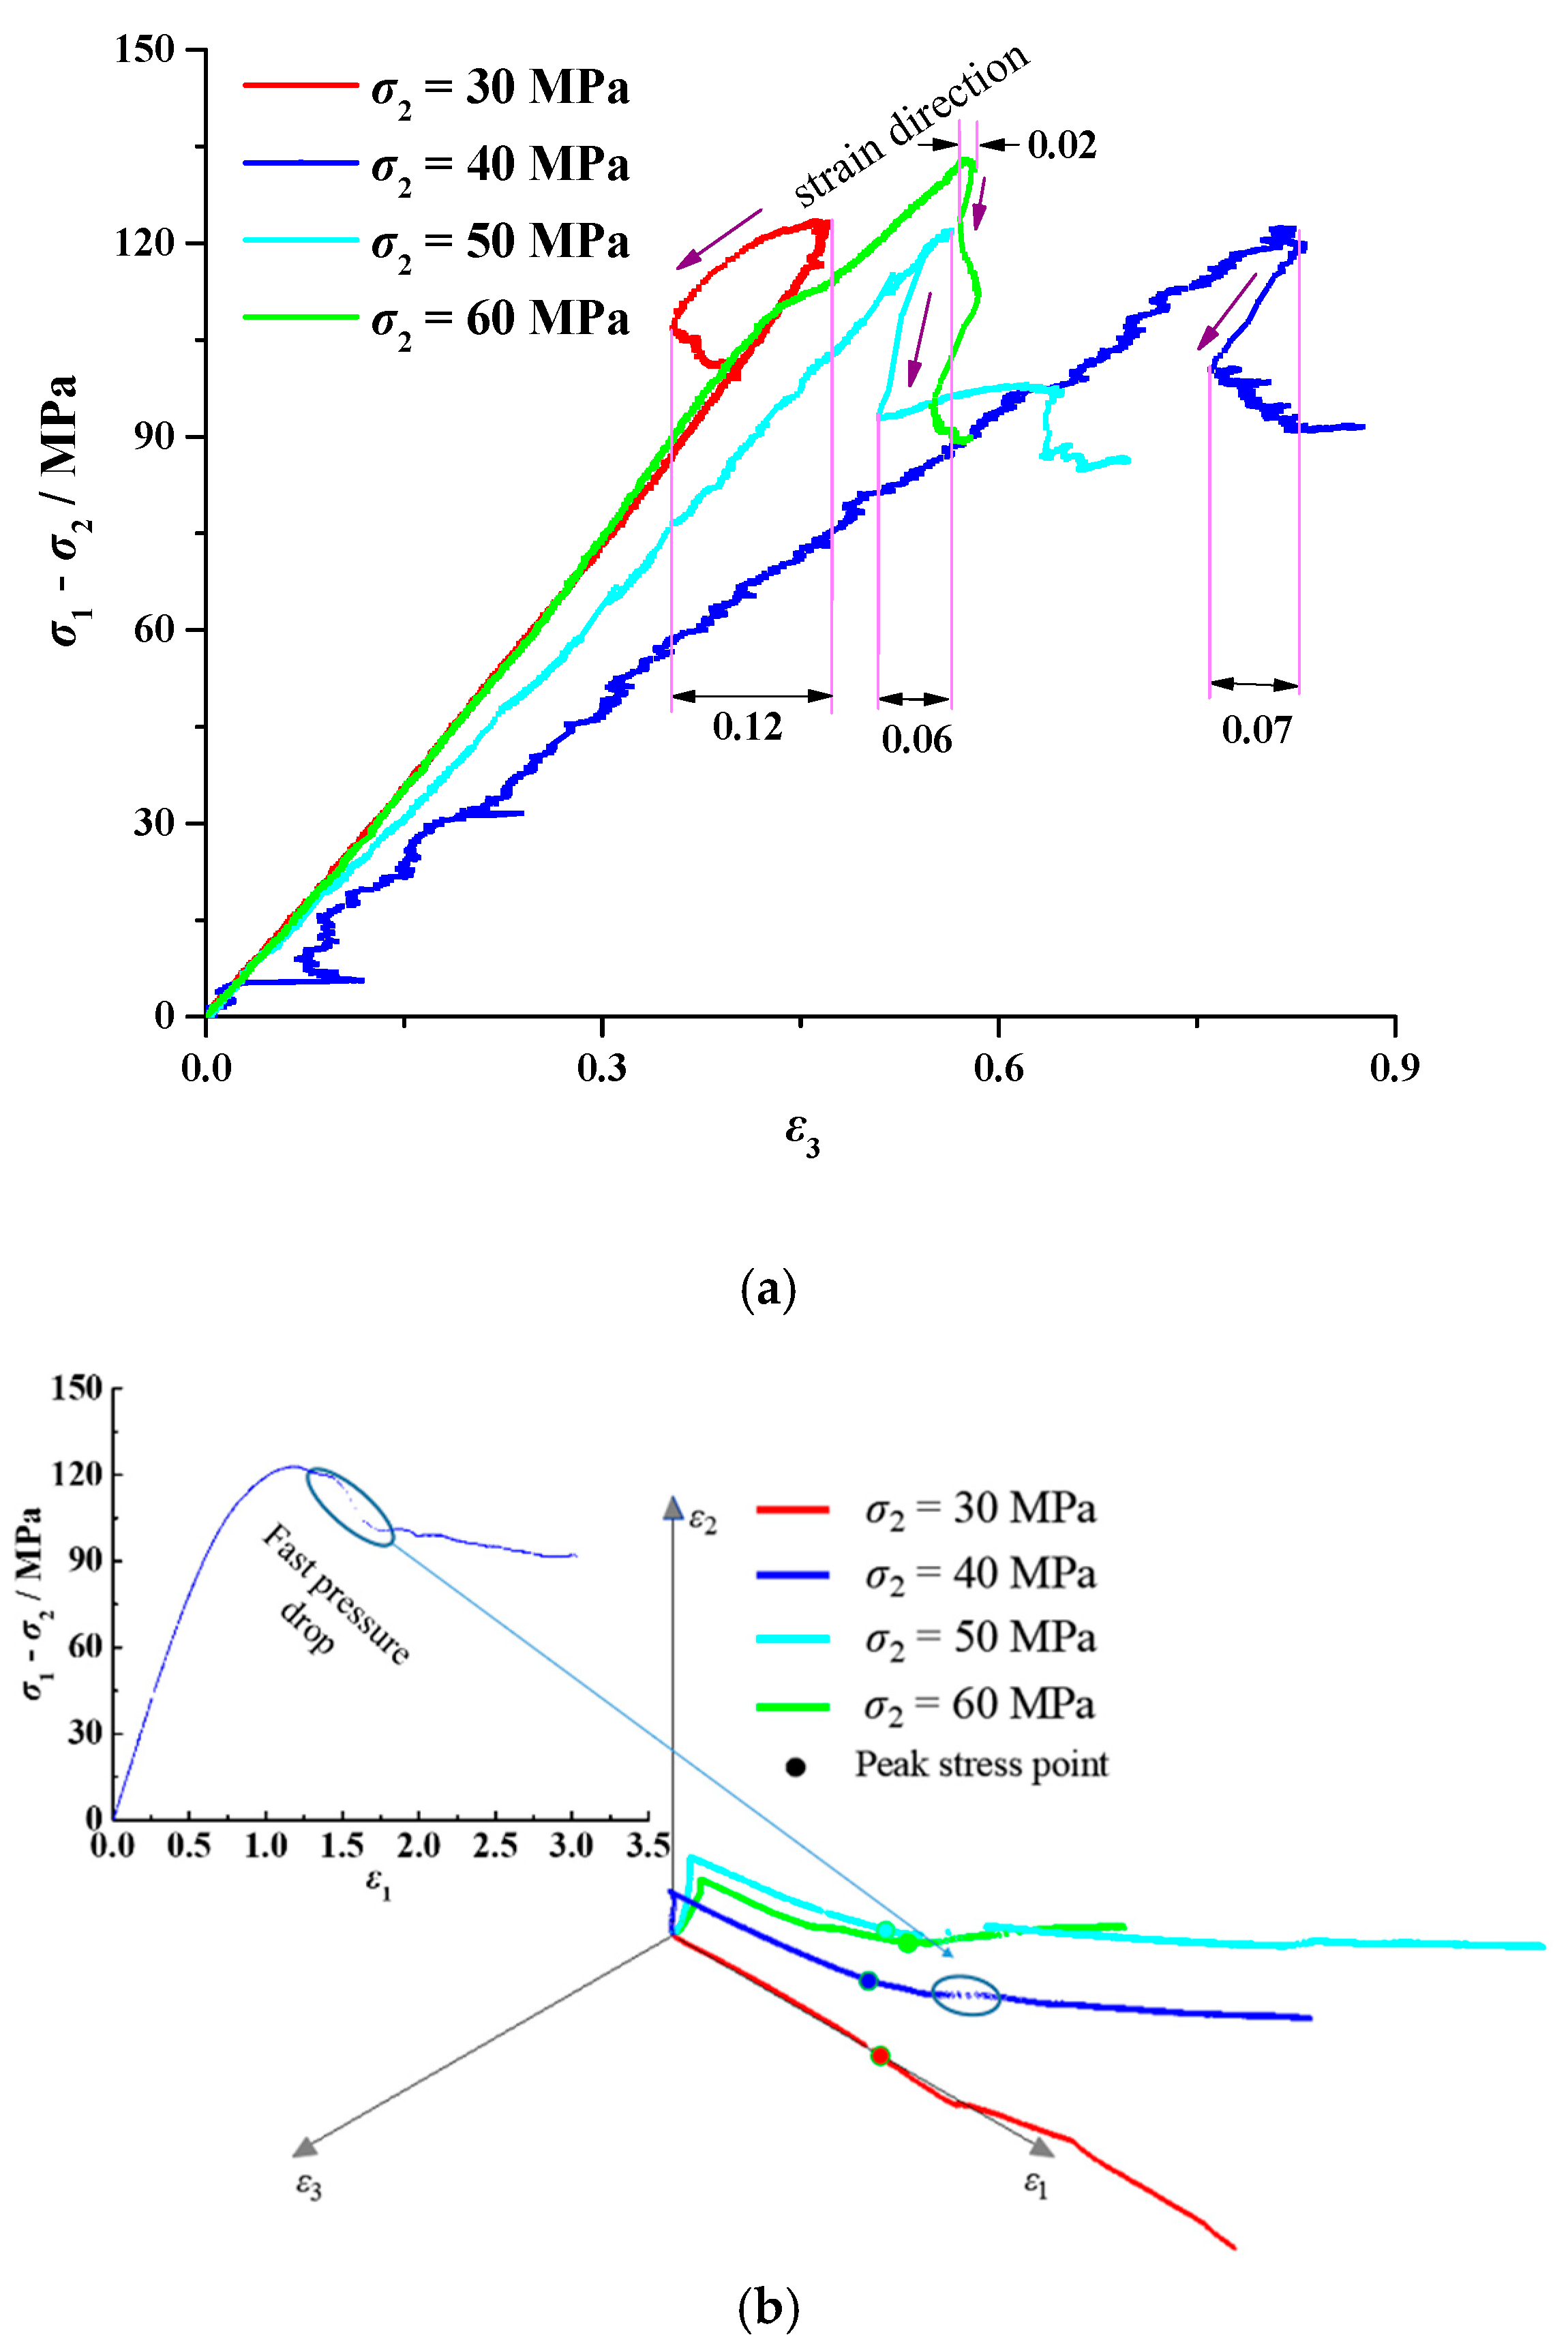
The permeability at first gradually decreased with increasing σ1. The permeability reached a minimum value when the rock reached the turning point from the elastic stage to the plastic stage. During the first stage, the main factor affecting the gas flow velocity was the frictional resistance. Therefore, as the rock volume stress increased, the internal fractures and pores continuously reduced. As a result, the rock penetration rate continuously reduced. During the plastic stage, the permeability slowly increased with increasing σ1 because of the micro-cracks produced in the internal rock structure. During the later plastic stage, the permeability rapidly increased because of the micro-cracks connecting and gradually forming macro-cracks. After the sandstone reached its peak strength, fractures occurred in the sandstone and the permeability entered into a linear increasing stage, related to the first stress drop (see Figure 6). After the first stress drop, the permeability entered another linearly increasing stage. During the first stress drop, crack propagation processes formed many new seepage channels in the sandstone, and hence the permeability steadily increased. As shown in Figure 9a, during the first pressure drop, the volume strain of the rock expanded under all stress states. However, the expansion decreased with the increase in the intermediate principal stress, which was 0.12, 0.07, 0.06 and 0.02, respectively. Stress and strain deviation occurred obviously during this stage. This is among the reasons why the fluid flow velocity changed with the variation in σ2 during this stage.
After the first stress drop, the permeability increased more slowly. A friction effect on the rupture surface might explain this difference. The fracture surface was polished in the following loading procedures, which hindered the permeability increase. At the same time, the rock continued to be compressed after the first pressure drop. However, there was no obvious correlation between the amount of compression and seepage velocity. During this stage, the flow of the fluid was mainly controlled by the deviatoric strain. The deformation of the rock was mainly due to the deviatoric strain. As shown in Figure 9a, there were one or two pressure drops after the first, and each pressure drop was accompanied by a change in the direction of the deviatoric strain and the characteristics of the seepage velocity. As shown in Figure 9b, the direction of the strain at an intermediate principal stress of 40 MPa and 50 MPa was very similar. In addition, the pattern of the flow rate changes was also very similar, as shown in Figure 8. The change in the partial strain caused a change in the internal fissure channel of the rock, which in turn caused a change in the permeation rate.
After the first pressure drop, the flow inside the rock was more inclined to fissure flow. During this process, the main factors affecting gas flow were inertial resistance and frictional resistance. Therefore, the seepage rate after the peak showed a certain volatility. Thus, gas permeation in sandstone rock can be divided into two periods during the rock damage process. Before the first pressure drop, the gas seepage velocity is mainly affected by volume strain. Rock bulk expansion always leads to an increasing gas seepage velocity. After the first pressure drop, gas flows through cracks in the rocks. Thus, the seepage velocity is affected by the deviator strain, which can change the seepage channels.
Thus, in the geothermal mining process, under the same fluid pressure conditions, the flow velocity of the fluid will be affected by the rock failure morphology and strain path.

4. Conclusions

A series of experiments was conducted to investigate the effect of σ2 on the strength, deformation, and permeability of sandstone. From the analysis of the extensive experimental data, we can draw the following conclusions:
(1)
The peak strength, octahedral shear stress, and octahedral effective normal stress of the sandstone increased with increasing σ2. However, the rate of increase decreased with increasing σ2. This is because the relatively high intermediate principal stress coefficient b has an inhibitory effect on rock strength.
(2)
As the ratio of σ2/σ3 increased, the specimen entered compressive strain in the σ2 direction during the first stress drop, when the compression exponentially increased with the increasing stress ratio.
(3)
Stress and strain deviation occurred during the loading period. This phenomenon indicates that elastic mechanics are not suitable for analyzing this sandstone rock from a macro view.
(4)
During the complete true triaxial stress–strain experiments, the variation in gas seepage velocity could be divided into two stages. Before the first pressure drop, the gas seepage velocity was mainly affected by volume strain. After the first pressure drop, the seepage velocity was affected by the deviator strain, which can change the seepage channels.

Author Contributions

M.L. and G.Y. designed the research. Z.S., M.L. and P.G.R. performed the calculations and wrote the manuscript. Z.S., D.Z. and C.L. performed the experiments.

Funding

This study was funded by the National Natural Science Foundation of China (51434003, 51874053, 51804049), the Graduate Scientific Research and Innovation Foundation of Chongqing (CYB16030) and the Research Fund of the State Key Laboratory of Coal Resources and Safe Mining, China University of Mining and Technology (SKLCRSM18KF026). The APC was funded by the National Natural Science Foundation of China (51434003).

Conflicts of Interest

The authors declare no competing financial interests.

Symbols

σ1Maximum principal stress
σ2Intermediate principal stress
σ3Minimum principal stress
bIntermediate principal stress coefficient, b = σ 2 σ 3 σ 1 σ 3
σoctOctahedral normal stress
τoctOctahedral shear stress
ΔεDeformation during the first stress drop
ωΔε/ε2

References

  1. Bagalkot, N.; Zare, A.; Kumar, G. Influence of Fracture Heterogeneity Using Linear Congruential Generator (LCG) on the Thermal Front Propagation in a Single Geothermal Fracture-Rock Matrix System. Energies 2018, 11, 916. [Google Scholar] [CrossRef]
  2. Li, Q.; Lu, Y.; Ge, Z.; Zhou, Z.; Zheng, J.; Xiao, S. A New Tree-Type Fracturing Method for Stimulating Coal Seam Gas Reservoirs. Energies 2017, 10, 1388. [Google Scholar] [CrossRef]
  3. Hoek, E.; Brown, E.T. Empirical strength criterion for rock masses. J. Geotech. Geoenviron. Eng. 1980, 106, 1013–1035. [Google Scholar]
  4. Yin, G.; Li, M.; Wang, J.G.; Xu, J.; Li, W. Mechanical behavior and permeability evolution of gas infiltrated coals during protective layer mining. Int. J. Rock Mech. Min. Sci. 2015, 80, 292–301. [Google Scholar] [CrossRef]
  5. Colmenares, L.B.; Zoback, M.D. A statistical evaluation of intact rock failure criteria constrained by polyaxial test data for five different rocks. Int. J. Rock Mech. Min. Sci. 2002, 39, 695–729. [Google Scholar] [CrossRef]
  6. Haimson, B. True Triaxial Stresses and the Brittle Fracture of Rock. Pure Appl. Geophys. 2006, 163, 1101–1130. [Google Scholar] [CrossRef]
  7. Yang, J.-H.; Liu, H.-D. True triaxial experimental study on rock strength and deformation. J. North China Inst. Water Conserv. Hydroelectr. Power. 2007, 28, 66–68. [Google Scholar]
  8. Chang, C.; Haimson, B. A Failure Criterion for Rocks Based on True Triaxial Testing. Rock Mech. Rock Eng. 2012, 45, 1007–1010. [Google Scholar] [CrossRef] [Green Version]
  9. Mogi, K. Effect of the intermediate principal stress on rock failure. J. Geophys. Res. 1967, 72, 5117–5131. [Google Scholar] [CrossRef]
  10. Mogi, K. Fracture and flow of rocks under high triaxial compression. J. Geophys. Res. Atmos. 1971, 76, 1255–1269. [Google Scholar] [CrossRef]
  11. Wiebols, G.A.; Cook, N.G.W. Energy Criterion for the Strength of Rock in Polyaxial Compression. Int. J. Rock Mech. Min. Sci. 1968, 5, 529–549. [Google Scholar] [CrossRef]
  12. Zhou, S. A Program to Model the Initial Shape and Extent of Borehole Breakout; Pergamon Press, Inc.: New York, NY, USA, 1994; pp. 1143–1160. [Google Scholar]
  13. Zheng, Y.; Deng, S. Failure Probability Model considering the Effect of Intermediate Principal Stress on Rock Strength. Math. Prob. Eng. 2015, 2015, 960973. [Google Scholar] [CrossRef]
  14. Haimson, B.; Chang, C. A new true triaxial cell for testing mechanical properties of rock, and its use to determine rock strength and deformability of Westerly granite. Int. J. Rock Mech. Min. Sci. 2000, 37, 285–296. [Google Scholar] [CrossRef]
  15. Zongyuan, M.; Jianhong, L.; Faning, D. Effect of intermediate principal stress on strength of soft rock under complex stress states. J. Cent. South Univ. 2014, 21, 1583–1593. [Google Scholar]
  16. Zheng, Y.; Deng, S.; Le, V.; Sun, Y. Micro-Mechanism of the Intermediate Principal Stress Effect on the Strength of Granular Materials. In Proceedings of the Soil Behavior and Geomechanics, Shanghai, China, 26–28 May 2014; pp. 465–475. [Google Scholar]
  17. Rodriguez, N.M.; Lade, P.V. True Triaxial Tests on Cross-Anisotropic Deposits of Fine Nevada Sand. Int. J. Geomech. 2014, 13, 779–793. [Google Scholar] [CrossRef]
  18. Pan, P.Z.; Feng, X.T.; Hudson, J.A. The influence of the intermediate principal stress on rock failure behaviour: A numerical study. Eng. Geol. 2012, 124, 109–118. [Google Scholar] [CrossRef]
  19. Phueakphum, D.; Fuenkajorn, K.; Walsri, C. Effects of intermediate principal stress on tensile strength of rocks. Int. J. Fract. 2013, 181, 163–175. [Google Scholar] [CrossRef]
  20. Yin, G.; Li, H.; Xian, X.; Xu, J. The experimental study of the influence of engineering stress changes on strength characteristics of rocks. Chin. J. Geotech. Eng. 1987, 9, 20–28. [Google Scholar]
  21. Haimson, B.; Rudnicki, J. The intermediate principal stress effect on faulting and fault orientation. EGU Gen. Assem. 2010, 12, 2070. [Google Scholar]
  22. Haimson, B.; Rudnicki, J.W. The effect of the intermediate principal stress on fault formation and fault angle in siltstone. J. Struct. Geol. 2010, 32, 1701–1711. [Google Scholar] [CrossRef]
  23. Chen, Y.; Xu, J.; Peng, S.; Yan, F.; Fan, C. A Gas–Solid–Liquid Coupling Model of Coal Seams and the Optimization of Gas Drainage Boreholes. Energies 2018, 11, 560. [Google Scholar] [CrossRef]
  24. Al-Harthy, S.S.; Jing, X.D.; Marsden, J.R.; Dennis, J.W. Petrophysical Properties of Sandstones Under True Triaxial Stresses I: Directional Transport Characteristics and Pore Volume Change. In Proceedings of the SPE Asia Pacific Improved Oil Recovery Conference, Kuala Lumpur, Malaysia, 25–26 October 1999; pp. 357–372. [Google Scholar]
  25. Nasseri, M.H.B.; Goodfellow, S.D.; Lombos, L.; Young, R.P. 3-D transport and acoustic properties of Fontainebleau sandstone during true-triaxial deformation experiments. Int. J. Rock Mech. Min. Sci. 2014, 69, 1–18. [Google Scholar] [CrossRef]
  26. Goodfellow, S.D.; Tisato, N.; Ghofranitabari, M.; Nasseri, M.H.B.; Young, R.P. Attenuation Properties of Fontainebleau Sandstone During True-Triaxial Deformation using Active and Passive Ultrasonics. Rock Mech. Rock Eng. 2015, 48, 2551–2566. [Google Scholar] [CrossRef]
  27. Lombos, L.; Roberts, D.W.; King, M.S. Design and development of integrated true triaxial testing system. In True Triaxial Testing of Rocks; Taylor and Francis Group: London, UK, 2013; Chapter 3. [Google Scholar]
  28. Li, M.; Yin, G.; Xu, J.; Li, W.; Song, Z.; Jiang, C. A novel true triaxial apparatus to study the geomechanical and fluid flow aspects of energy exploitations in geological formations. Rock Mech. Rock Eng. 2016, 49, 4647–4659. [Google Scholar] [CrossRef]
  29. Li, M.; Yin, G.; Xu, J.; Cao, J.; Song, Z. Permeability evolution of shale under anisotropic true triaxial stress conditions. Int. J. Coal Geol. 2016, 165, 142–148. [Google Scholar] [CrossRef]
  30. Mogi, K. Experimental Rock Mechanics; Taylor and Francis Group: London, UK, 2007. [Google Scholar]
  31. Drucker, D.C.; Prager, W. Soil mechanics and plastic analysis or limit design. Q. Appl. Math. 1952, 10, 157–165. [Google Scholar] [CrossRef] [Green Version]
Figure 1. Photograph of the true triaxial geophysical apparatus and schematic diagrams.
Energies 11 02694 g001
Figure 2. Photographs of sandstone specimens and computed tomography (CT) scan images. (a) raw rock sample’ (b) finished rock specimens; (c) finished sample CT images of cube (upper) and slice (below).
Energies 11 02694 g002
Figure 3. Scanning electron microscope (SEM) images of the sandstone.
Energies 11 02694 g003
Figure 4. Relationship between strength and σ2 and σ3. (a) Strength results under different σ2 and σ3 values; (b) different variation patterns in rock strength with changing σ2 and σ3.
Energies 11 02694 g004
Figure 5. Relationships between τoct, σoct, and σ2.
Energies 11 02694 g005
Figure 6. Definition of Δε and ε2.
Energies 11 02694 g006
Figure 7. Relationship between ω and σ2.
Energies 11 02694 g007
Figure 8. Relationship between permeability, σ1, and ε1.
Energies 11 02694 g008
Figure 9. Rock deformation characteristics under different stress states. (a) Variation in the volume strain under different σ2 values when σ3 = 30 MPa; (b) deviator strain under different σ2 values when σ3 = 30 MPa.
Energies 11 02694 g009
Table 1. Stress conditions.
Serial Numberσ2/MPaσ3/MPaDisplacement Rate
M-120200.001 mm/s
M-230200.001 mm/s
M-340200.001 mm/s
M-450200.001 mm/s
M-560200.001 mm/s
M-630300.001 mm/s
M-740300.001 mm/s
M-850300.001 mm/s
M-960300.001 mm/s
M-1040400.001 mm/s
M-1150400.001 mm/s
M-1260400.001 mm/s
M-1350500.001 mm/s
M-1460500.001 mm/s
M-1560600.001 mm/s