A Review of the Energy Performance and Life-Cycle Assessment of Building-Integrated Photovoltaic (BIPV) Systems

Renewable Energy Research Group (RERG), Department of Building Services Engineering, The Hong Kong Polytechnic University, Hong Kong, China
*
Author to whom correspondence should be addressed.
Energies 2018, 11(11), 3157; https://doi.org/10.3390/en11113157
Submission received: 7 October 2018
/
Revised: 27 October 2018
/
Accepted: 9 November 2018
/
Published: 14 November 2018
(This article belongs to the Special Issue 10 Years Energies - Horizon 2028)
Abstract
:Building integrated photovoltaic (BIPV) technology provides an aesthetical, economic, and technical solution for electricity self-sufficiency in buildings. As one of the most promising technologies for solar energy harvesting in urban areas, BIPV technology provides multiple benefits for buildings, including power generation from renewable energy resources, the replacement of traditional wall cladding, daytime lighting, heating/cooling load reduction, etc. This paper systematically reviews the progress of recent research on the electrical, thermal, optical, and overall energy performances of BIPV systems. Furthermore, based on the literature review on the energy payback time and the greenhouse-gas emission of various BIPV technologies, the research progress of the life-cycle assessment of BIPV systems is also discussed. It is anticipated that the review results can provide meaningful reference and support for the research and development of BIPV technology.
1. Introduction
With the rapid development of the society and the economy, the excessive consumption of fossil fuels has brought on great challenges such as those of energy shortages, environmental damage, and climate change. Renewable energy resources may be the most probable alternative in order to avoid future energy and environmental crises. Therefore, new opportunities are created to develop renewable energy utilization technology in order to meet the energy requirements of the future as well as to mitigate the related environmental problems.
Of all the previously available renewable energy resources, solar energy is considered an inexhaustible resource and the cleanest and the most abundant one [1]. The power of the sun that reaches the earth was estimated to be approximately 1.8 × 10¹¹ MW, which is so much larger than the world’s energy demand [2]. To make effective use of solar energy, various technologies have been developed, for example, solar lighting technology, solar thermal technology, solar thermal power technology, solar photovoltaic (PV) technology, solar hydrogen production technology, etc.
Solar PV technology is a promising way to harness solar power as it generates electrical power on-site directly from solar radiation through the photovoltaic effect of the employed solar cells. In the past few decades, PV applications have shifted from using small PV cells to large-scale grid-connected PV systems. As reported, more than 90% of existing PV systems belong to this type [3]. Recently, building-integrated photovoltaic (BIPV) technology has become an emerging research hotspot of solar PV technology. BIPV technology refers to the PV utilization method that uses PV cells to substitute traditional building materials by integrating them into building envelopes, such as roofs, windows, façades, balcony, skylights, etc. For the application of PV technology in buildings, PV modules are increasingly integrated into new buildings as façades or roof construction materials or into existing buildings for retrofitting [2]. The main advantage of BIPV systems over non-integrated PV systems is that the integrated BIPV components always carry out multi-functions including thermal insulation, noise prevention, being weatherproof, privacy protection, on-site electricity production, as well as offsetting the system initial costs. With so many advantages, BIPV is expected to be the most promising future energy system in the urban environment.
The global BIPV market experienced fast growth in recent years. As reported by Transparency Market Research, the annual global BIPV installation is predicted to be 1152.3 MWp in 2019, with a Compounded Annual Growth Rate (CAGR) of 18.7%, compared with the 343.1 MWp in 2012 [4]. NanoMarkets [5] also predicted that the BIPV market would increase from 3 billion dollars in 2015 to over 9 billion dollars by the end of 2019, and further, to over 26 billion dollars by the end of 2022. Tabakovic et al. [6] reported the status and outlook of global BIPV installations from 2014 to 2020 by region. As illustrated in Table 1, the global installation was estimated to be 2.3 GW in 2015, while the market was only 1.5 GW in 2014, thus, the increasing rate almost reaches 50%. Europe, Asia, and the U.S. played a dominant role in the global BIPV market in the past few decades. In 2015, about 41.7% of the BIPV market was occupied by Europe. With an average global CAGR of 39% during 2014–2020, the annual global BIPV installation in 2020 is anticipated to be 11 GW. Obviously, in the future, the BIPV market will grow fast due to the intensive demand for building sector construction and refurbishment.
Moreover, in order to promote BIPV research and development, many incentive policies have been developed in different countries. Germany formulated and implemented “The Thousand Solar Roofs Program” in 1995. This was the first support scheme for BIPV installations. Later, the program was granted in 1999. The total installed BIPV capacity increased to 435 MW by the end of 2003 with the financial support of this program. The U.S. government launched the “Ten Million Solar Roofs Program” in 2010 in order to promote BIPV applications. A total of 250 million dollars had been invested for PV roof installations since 2012 and the budget is projected to increase to 100 GW by 2021. The Chinese government also developed a series of policies to promote BIPV development, such as “enforcement advice for promoting solar energy applications in buildings” and “interim procedures for financial subsidies of the golden sun program” launched in 2009. With the financial support of these programs, the cumulative PV installation capacity of China increased from 300 MW in 2009 to 17,800 MW in 2013. Moreover, in the 13th Five-Year plan, the Chinese government set a goal for BIPV applications: the total installed BIPV capacity is expected to grow to 50 GW, which may occupy 33% of the total PV market by the end of 2020.
In recent years, BIPV has been developing rapidly and it has become increasingly attractive for future research and application due to advances in technology, the reduced cost of PV materials, and the increase in governments’ incentive policies for renewable energy technologies. The objective of this paper is to conduct a broad literature review on the progress of previous research on the optical, thermal, electrical, and overall energy performances of BIPV systems and to discuss some issues associated with the energy and environmental benefits of BIPV systems in terms of the energy payback time (EPBT) and greenhouse gas emissions (GHGEs). Through this literature review, the multiple benefits of BIPV technology can be identified and the prospect of the development on this technology could be demonstrated. The review results can provide meaningful reference and support for the research and development of BIPV technology.
2. BIPV Definition and BIPV Advantages
Essentially, BIPV refers to the integration of PV materials into building envelopes, therefore, providing it with multiple functions such as to act as part of the building structures by replacing traditional building materials and to produce electricity on-site. In this form, the PV modules can be easily blended into building envelopes, including roofs, windows, façades, balconies, or skylights during the design stage. Thus, BIPV technologies are quite suitable to be applied to new buildings. Another application for BIPV is to add PV modules on existing buildings envelopes, named building-applied photovoltaic (BAPV) systems, and can be conveniently retrofitted onto old buildings. After years of application and practice, BIPV has demonstrated its potential to be a multifunctional and effective building energy technology that can bring many advantages to buildings. Firstly, the PV materials are capable of producing electricity directly from sunlight. Integrating PV elements into buildings allows buildings to achieve self-sufficiency in terms of electricity. The electricity produced can be partially or fully used to balance the electrical requirements of the indoor energy systems, thus, mitigating the power supply pressures of traditional power grids, and further reducing the fossil fuel consumption and greenhouse gas emissions. In fact, BIPV shows a high level of innovation and potential to realize green or zero-energy buildings in the future.
When compared with conventional building materials, another distinctive attribute of BIPV is its appearance. Until now, BIPV has been recommended as a promising compromise between building energy and building aesthetics. There are various types of PV modules that can be integrated into building envelopes, providing a great opportunity for innovative architectural design and making future buildings more aesthetically appealing. Despite being an energy producer, PV modules can act as either opaque roof/wall/shading-devices or as semi-transparent window/façade/skylight components. Moreover, some modules can be flexible, colorful, and visually arresting, thus, responding to the imagination of architects or designers in order to create various visual effects, as well as make buildings environmentally friendly.
Additionally, BIPV can bring some other advantages to a building. For instance, in summer, adding PV modules to building envelopes can help to reduce the heat gain by preventing the envelopes from being directly exposed to solar radiation, thus effectively reducing the indoor cooling load. Reserving an air channel between the PV modules and the external envelopes of a building may benefit from the air circulation in the channel by decreasing the operating temperature of the PV modules, which provides an effective method to increase the PV modules’ energy efficiency.
From an overall point of view, incorporating PV technologies into buildings not only introduces an on-site electricity producing opportunity, but it also brings about some additional advantages related to architectural aesthetics and energy efficiency aspects. Compared to conventional buildings, this PV integrated buildings provide better natural lighting, enhanced thermal comfort, reduced energy consumption, and it is also aesthetically pleasing. BIPV broadens the road to architectural design and energy conservation for future buildings.
3. PV Materials and PV Cells
In PV technology, the photovoltaic effect plays a key role in producing electricity from solar radiation. Various semiconductor materials can be used in PV cell fabrication, including silicon-based materials, non-silicon based materials, and a number of advanced materials. Among these semiconductor materials, silicon is the main material for PV cell production. PV cells fabricated from silicon materials have been proved to be reliable in solar PV fields. Silicon-based PV technologies can be grouped into three types: monocrystalline silicon (m-Si or mono-Si), polycrystalline silicon (poly-Si or multi-Si), and thin-film amorphous silicon (a-Si) [7]. Silicon technology now occupies approximately 80% of the PV market. Among the silicon-based PV cells, monocrystalline ones are usually black or gray in color and have higher efficiencies and higher prices since they are made from pure monocrystalline silicon. Polycrystalline PV cells are fabricated from ingots of multi-crystalline silicon. They can be easily manufactured with multi-colored shining blue tones. They are cheaper but are less effective. In amorphous silicon PV cells, a thin un-crystallized silicon layer is attached to the substrate, which causes the cell to be relatively thin. The color of the amorphous silicon cells is reddish-brown or black. The power efficiencies of these silicon-based PV cells are very different from each other. For monocrystalline cells, the efficiency ranges between 16% and 24%. The efficiency of polycrystalline cells varies in the range of 14–18%. For these two cells, the power per unit varies between 75 and 155 Wp/m2. As for amorphous silicon cells, the efficiency varies from 4% to 10%, and the power per unit area is typically 40–65 Wp/m2 [8].
Besides silicon-based PV cells, various innovative types of PV cells are still being developed or are being improved continuously in order to improve the power efficiency, as well as to reduce the manufacturing, operating, and maintenance costs of PV cells. The existing PV technologies can be generally classified into three generations according to their technical attributes [9]. Figure 1 illustrates the three generations of existing PV cells.
Si wafer technology is the basic technology used for first-generation PV cells. The monocrystalline and polycrystalline silicon PV cells are part of this generation. These cells universally have a single-junction structure. The theoretically highest efficiency of this structure is 33%. Generally, first-generation PV cells last longer and have a higher efficiency than other PV cells. However, their manufacturing process costs are higher both in terms of energy consumption and labor, and their performance easily degrades at higher temperature conditions. First-generation cells are currently the most efficient and the most widely used cells amongst all the three generations.
Second-generation PV cells are still single-junction devices, but compared to the first generation cells, their manufacturing cost consumption in terms of semiconductor material is significantly lower. Second-generation PV cells are usually manufactured by thin-film PV technology. Compared to the first-generation cells, they are usually made of very thin layers of semiconductor materials. The manufacturing processes of these cells are simple and consume fewer materials so they cost less than the first generation cells. By using fewer semiconductor materials, their efficiencies are lower when compared to silicon-based first-generation cells. There are mainly three types of cells in this generation, including amorphous silicon, CdTe, and CIGS. Together, they occupy approximately 20% of the total PV market. CdTe PV cells benefit from having the lowest manufacturing cost among all the current thin-film technologies. The efficiency of CdTe cells varies from 9.4% to 13.8%. CIS and CIGS are the most suitable materials for thin-film PV technology and their efficiency is typically 11–18.7% [10]. The color of non-silicon-based thin-film cells is often dark gray to black.
The principal goal of third-generation PV cells is to produce high-efficiency devices that still use thin-film technology in second-generation PV cells. These cells aim to make solar PV technology more efficient and less expensive by using a variety of new materials like solar inks, nanotubes, organic dyes, conductive plastics, etc. Most of the research and development work on third-generation PV technology are now being conducted in laboratory conditions by research groups in universities or companies. Therefore, most of these technologies are still commercially unavailable.
Presently, although the research and development attempts at reducing the cost and improving the efficiency of PV cells are being worked on regarding various PV technologies by researchers from all over the world, unfortunately, the majority of PV markets are currently covered by the first- and second-generation PV cells.
4. PV Modules Suitable for Building Integration
The PV cell is a basic component of PV electricity generation. However, a single solar cell cannot produce sufficient power for related applications. Therefore, PV cells are connected to each other in series to achieve a greater power generation capacity. The connected cells are deposited between transparent or opaque covers for protection. This packaged series of cells are known as PV modules. PV modules can be designed with various power outputs by assembling solar cells with different numbers, sizes, and materials. The standard PV module’s top layers are transparent and are usually made from hardened or tempered glass in order to protect the internal PV cells from ambient and severe weather conditions. PV modules are usually sealed using Tedlar or glass at the backside. Additionally, a frame made of aluminum or another material is necessary to ensure the mechanical stability of the PV modules for mounting and fixing. Conventionally, the PV modules are designed and manufactured for outdoor electricity generation, but not all these technologies are suitable for being integrated or incorporated in building envelopes since their functionalities as envelope elements are generally overlooked by PV module manufacturers. BIPV modules should be able to satisfy some essential requirements when considering their properties of being mechanically stable, fire resistant, providing sound and thermal insulation, etc. There are several options for the integration of PV modules into buildings, including roofs, walls, windows, and shadings.
Standard PV modules are commonly used in BIPV applications, especially for existing building retrofitting. However, the frame has impeded their convenient and elegant integration into building envelopes. To overcome this shortage of standard PV modules, with the development in the past few decades, various types of PV module technologies are now available in the PV market, including PV modules, PV laminates, PV tiles, etc. PV laminates were developed by omitting the frame of PV modules, while PV tiles were designed especially for roof application. All these PV modules can be fabricated as opaque or semitransparent materials. For PV modules or PV laminates fabricated from mono- or poly-crystalline silicon technologies, the light transmission can be regulated by controlling the cell spacing. Opaque modules or laminates can be obtained when a non-transparent back-sheet is used in the encapsulation. For thin-film PV modules, during fabrication, thin layers of semiconductor materials are deposited on glass, plastic, or metal films, which makes the modules range from being semi-transparent to light.
In accordance with the existing PV module technologies, there are various solutions for the integration of PV into buildings. Moreover, the applicability of the current PV modules shows a great diversity from each other when they are integrated into sloped roofs, flat roofs, walls, windows, and shading systems. Standard PV modules with a rigid frame and non-transparent back-sheet are quite suitable for application in sloped roofs, but have a poor applicability in flat roofs, walls, windows, and shading systems. Standard PV laminates are suitable for roofs, walls, and shading systems, but cannot be used for windows. Glass PV modules with different transparencies enjoy a low application suitability for roofs, but are beneficial for application in walls, façades, and shading systems. PV roofing modules are quite suitable for roofs and shading systems. Additionally, end-users can order custom-designed modules for different BIPV systems before constructing these systems.
5. Classifications of the BIPV Systems
BIPV systems can be roughly classified according to the energy supply, the storage modes, the integrating modes, and the module types. According to the power supply and storage modes, there are two types: the grid-connected type and the stand-alone type. The former is usually connected to a utility grid that serves as a storage component in the BIPV system and ensures the system’s stability and reliability. The latter type, on the other hand, employs batteries for surplus power storage. The battery also helps to ensure the stable power supply for the fluctuating power generation. In stand-alone BIPV systems, a supplementary generator is usually necessary for power supply in extreme weather conditions.
According to the integration pattern, BIPV systems could be roughly classified as building-integrated systems and building-applied PV systems. The former is suitable for new buildings by substituting conventional building materials with PV modules, while the latter is easily applied to existing buildings by adding PV modules to some parts of their envelopes. Additionally, if the PV modules are removed in these cases, the buildings can still run normally. There are many alternatives for PV integration in buildings, including roof integration or mounting, façade integration or attachments, windows, sunshade integrations, rain-screen integrations, and integration into atrium/skylights, claddings, railings, etc. In the current BIPV market, about 80% of BIPV systems are based on roof integrations, while the rest (20%) are based on façade integrations.
According to the module shape, BIPV systems can be categorized as rigid-module-based BIPV systems and flexible-module-based BIPV systems. The former is built by rigid BIPV modules, while the latter is built by flexible BIPV modules. Rigid BIPV modules can be manufactured from all PV technologies available by employing a rigid back-sheet or rigid substructures such as plastic, glass, or metal sheets. Flexible BIPV modules can be fabricated from most emerging technologies including perovskite-PV technology, dye-sensitized PV technology, organic PV technology, and all thin-film technologies, including CIGS, CdTe, amorphous silicon, etc. The substructure of flexible PV modules can be polymer films or metal sheetings.
According to their optical properties, BIPV systems can be classified as opaque systems and semi-transparent systems. The former often refers to BIPV systems implemented on opaque building envelopes (roofs or walls), where PV modules are added onto. No sunlight is allowed to pass through the system into the indoor environment. Semi-transparent BIPV systems can be built in see-through building envelope components, such as façades, windows, atriums, skylights, etc. In semi-transparent BIPV systems, conventional glazing materials are replaced by semi-transparent PV modules. As a result, electricity is produced in these components. In the meantime, the daytime lighting function of these components is retained.
6. Performances of BIPV Systems
BIPV systems act as part of exterior building envelopes and produce electricity on-site. Therefore, the power output and thermal impacts are the most noteworthy aspects of BIPV performance. Moreover, for semi-transparent BIPV systems, daytime lighting is another important advantage to the building. Thus, to examine a semi-transparent BIPV system’s overall energy performance, the optical performance, thermal performance, and power performance should all be taken into account. This section firstly reviews the latest research outcomes of the power and thermal performance of BIPV systems and then discusses the optical and overall performance of semi-transparent BIPV systems.
6.1. Power Performance of BIPV Systems
The electricity generation potential of a BIPV system is decided by the conversion efficiency of the PV module employed. As mentioned above, up to present, various types of PV technology can be used for the PV module fabrication. The National Renewable Energy Laboratory reported the efficiencies of various PV technologies from laboratories, universities, and companies, including multifunction PVs, single-junction GaAs, crystalline silicon, thin-film, and other emerging PV technologies, as shown in Figure 2 [11]. In the BIPV field, the most-used PV modules are based on silicon technology and some other emerging thin-film technologies like CdTe and CIGS. Seen from the figure, the highest efficiencies of single crystalline, multi-crystalline, thin-film crystalline, CdTe, and CIGS PV cells have grown up to 27.6%, 21.9%, 21.2%, 22.1%, 22.6%, respectively, by 2017. Theoretically, a higher electricity generation rate can be achieved when PV modules with higher efficiency rates are employed in BIPV systems.
Besides the module efficiency, some other parameters determined by the installation can also influence the power output of a BIPV system. Song et al. [12] experimentally and numerically investigated the electricity generation of a thin-film BIPV system under different solar incidence angles and various azimuths, as shown in Figure 3. Their research results indicated that the system facing the south and installed with the slope of 30° produced the maximum amount of electricity. Moreover, when compared with the vertically installed PV module, the 30° installed module increased the electricity generation by 250%. Yoon et al. [13] carried out an analysis of the long-term performance of a BIPV window by using amorphous silicon PV modules in Korea. After monitoring it for 2 years, they found that the electricity generation per unit was 580.5 kWh/year. By changing the installation parameters like the shading and the azimuth, the electricity output can be improved by up to 47%. Ng et al. [14] pointed out that when the diffuse solar radiation was taken into account, semi-transparent BIPV systems with an orientation that cannot receive direct solar radiation might also be able to provide an acceptable electrical performance. Therefore, the system orientation can also affect a BIPV system’s electricity output.
The operating temperature is another important factor influencing the power performance of BIPV systems based on monocrystalline or polycrystalline silicon-based PV technologies. Park et al. [15] confirmed that a 1 °C increase in the operating temperature of a c-Si PV module resulted in power decreases of 0.52% and 0.48% in real outdoor conditions and in standard test conditions, respectively. The property of the glass of the PV modules had a significant effect on the operating temperature, therefore, it is clear that it can have a considerable effect on the electricity generation. Yoon et al. [16] experimentally tested the annual surface temperature variations of an amorphous silicon window under different inclinations. Their test results concluded that the vertical window’s surface temperature improved significantly in the winter seasons, while the surface temperature of the horizontal and inclined windows decreased considerably in the summer condition. When compared with a conventional window, the inner surface temperature of the BIPV window was 2 °C higher during the nighttime in winter and 1 °C lower during the daytime in summer. They also pointed out that adding air ducts behind the PV modules could effectively reduce the operating temperature. Fossa et al. [17] set up an experimental apparatus to find the optimal integration method of PV modules into building envelopes for achieving the best conversion efficiency as well as to harvest the thermal energy as much as possible and to develop a new correlation for the natural convection along the vertical PV surfaces. Their experimental results confirmed that an optimized air cavity thickness and heating configuration could significantly reduce the surface temperatures and improve the conversion efficiency. Gan [18] performed a CFD simulation to study the effect of adding a backside air gap on the PV module’s electrical performance. The results indicated that a 12–16 cm air gap could greatly reduce the overheating problem and increase the electricity generation. Ritzen et al. [19] compared the electrical performances of ventilated and non-ventilated PV rooftops. The test results showed that when operated in The Netherlands, the power output of the ventilated PV rooftop was 2.6% higher than that of the non-ventilated type.
Charron et al. [20] theoretically studied the factors that influenced the performance of double-skin PV façades. The results showed that by using an optimized design, the overall thermal-electric efficiency of the double-skin PV façades could be higher than 60%. Tian et al. [21] performed an experimental research study to examine the electrical performance of DSSC modules for building integration. The test results indicated that the incident angle had a limited effect on the DSSC conversion efficiency. The performance of the DSSCs in the BIPV applications was easily affected by solar irradiance and ambient temperature. Ordenes et al. [22] evaluated the potential of BIPV technologies in different cities in Brazil. The simulation results from Energyplus indicated that for BIPV buildings, the PV system produced more electricity than the requirement by about 30%.
Through the above analysis, the BIPV systems’ electrical performance can be influenced by many designs and installation parameters, as well as by the PV module properties, including the module efficiency, shading effect, incident and azimuth angles, orientation, etc. Table 2 summarizes some major research outcomes of the BIPV systems’ electrical performance.
6.1.1. Electricity Generation Capacity of BIPV Systems in Buildings
Successful operations and promising electricity yields of existing BIPV systems would be an incentive for improving the public awareness and clients’ confidence of BIPV technology. Globally, there are a large number of successfully implemented BIPV projects. In China, BIPV has been recognized as a key factor in solving energy and environmental problems in the urban environment. The China BIPV Application Committee reported outstanding BIPV projects in recent years [23]. Table 3 summarizes the location, integration mode, active area, PV power, and the electricity yield of some newly developed large-scale BIPV projects in China. The electricity generation capacities of the BIPV projects illustrated in this table show a great diversity that is dependent on their building scale and active area. The active area of the PV modules varies from 1000 m2 to 82,000 m2. Accordingly, the rated electricity generation capacity ranges between 102.5 kWp and 10670 kWp. Obviously, BIPV brings great potential for modern buildings in terms of on-site electricity production. The experiences and skills accumulated in these BIPV systems can not only provide technical support for the design and construction of new BIPV systems, but can also strengthen the confidence of designers and investors in this technology.
6.1.2. BIPV Electricity Generation Potential of a City or a Country
With the development of the building sector, the building area has been becoming bigger and bigger. Therefore, the potential area available for BIPV applications is becoming increasingly attractive. Investigations on the electricity potential of BIPVs in a city or a country will be supportive for promoting BIPV applications.
You and Yang [24] preliminarily evaluated the available BIPV area and the corresponding electricity potential in Hong Kong. They concluded that from the point of view of the available area, the vertical surfaces enjoyed more potential for BIPV applications in Hong Kong due to there being a large number of high-rise buildings in this city. However, the roof-mounted PV modules with a slope of 22.3° could achieve a much higher electricity generation capacity than the walls. The calculated results indicated that the power generation potentials for the South, East, and West walls were almost the same, while the unit roof-mounted PV module produced 87% more electricity than the wall-integrated module. Taking all the potential areas of the roof and walls as a whole, a BIPV based on these areas can produce approximately 10.5 TWh electricity, which could satisfy about 35% of the total electricity requirements of Hong Kong in that year.
Similarly, the International Energy Agency [25] also reported the electricity potential of BIPV for some of its member countries. Through the evaluation of the available roof and façade areas of residential, agriculture, industrial, commercial areas, and those of other buildings in some of the member countries of IEA, such as Australia, Austria, United Kingdom, United States, etc., the corresponding electricity generation potentials and the potential-consumption ratios of the roof and façade areas in these countries were predicted. Table 4 shows the results.
Seen from the table, the available areas of these countries vary a lot, mainly due to their land areas, economic levels, architectural spaces, and shapes. Accordingly, the solar electricity potentials show a great difference in these countries. The United States has the greatest solar electricity potential and, if all the potential areas were used for installing BIPVs, the electricity produced could fulfill up to 57.8% of the total electricity requirement recorded in 1998. Japan also enjoys a high electricity generation capacity of potential BIPVs. However, owing to its high electricity demand, the potential-consumption ratio is only 14.5%. Nevertheless, in each country, the potential capacity of BIPV can balance a great proportion of the total electricity requirement.
Peng and Lu [26] evaluated the available roof area for rooftop PV systems, as well as the electricity generation potential in Hong Kong. As a result, the available roof area was estimated to be 54 km2. Accordingly, the total power output of potential rooftop PV systems was estimated to be 5.97 GWp and the electricity yield potential was evaluated as 5981 GWh, which was 14.2% of the annual electricity use by Hong Kong in 2011. Later, they reported the available roof and façade area, as well as the electricity generation potential in Hong Kong. They concluded that the available roof and façade areas of the residential, commercial, industrial, public housing, government, and school buildings are 40.4 km2 and 15.15 km2, respectively. Accordingly, the annual electricity potentials of the available roof and façade area for BIPV are 8494.8 GWh and 3148 GWh.
Defaix et al. [27] reported the electricity generation potential for BIPV in typical European Union members. They concluded that the BIPV electricity generation potential in the EU-27 was estimated to be 951 GWp. The annual electricity yield was calculated to be about 840 TWh, which could meet around 22% of the total electricity demand of Europe in 2030.
Thus, through the above discussions, the potential capacity of the BIPV electricity generation for a city or a country is quite huge and can contribute a lot to satisfying the regional electricity requirements. As a result, promoting BIPV applications would be a great help for the future production and supply of electricity.
6.2. The Thermal Performance of BIPV Systems
In BIPV systems, the shading effect of PV modules can significantly reduce the heat gain through external envelopes, thus, greatly affecting the heating or cooling load and further reducing the energy requirements of indoor air-conditioning systems. Therefore, thermal performance is another research hotspot for BIPV systems. Many researchers investigated the benefit of implementing BIPV systems by reducing the indoor thermal energy requirements.
Peng et al. [28] experimentally investigated the thermal performance of a newly designed double-skin PV façade, as presented in Figure 4. The results indicated that the ventilated operation mode achieved the lowest solar heat gain coefficient, while a better effect of heat loss prevention could be produced by the non-ventilated operation mode. Peng et al. [29] also examined the annual thermal property of a multi-layer PV façade. Through numerical investigation, the heat loss and heat gain of this system in winter were found to be 32% and 69% lower than conventional walls and the heat gain through this south-facing façade in summer was 51% lower than that of a conventional wall.
Yang et al. [30] examined the suitability of PV walls for different climate regions of China, mainly focusing on its thermal performance. Their simulation results showed that by substituting a conventional wall with a PV wall, the cooling load could be cut down by 33–50% in different regions. Ji et al. [31] investigated the dynamic thermal property of a PV wall system designed for the Hong Kong climate. The results demonstrated that the proposed system was effective in reducing the total heat gain by 53–59.2% during the summer period, compared to normal external walls.
Chow et al. [32] comparatively studied the thermal performance of four different PV window systems. The results demonstrated that the single-glazed PV window and naturally ventilating PV window were beneficial in reducing the cooling energy consumption by 26% and 61%, respectively, compared to normal absorptive-glazed windows on a typical summer day. Later, a numerical study revealed that applying single-glazed PV and naturally ventilating double-glazed PV to all the external façades of an office room in Hong Kong could effectively reduce the cooling electricity need by 23% and 28%, respectively [33]. He et al. [34] also pointed out that reserving an air gap in the PV window could effectively cut down the total heat gain by 78.3 W.
Wang et al. [35] compared the thermal performance of four rooftop PV systems. The numerical results revealed that the ventilated PV roof enjoyed a higher power efficiency and lower cooling load. Therefore, it was more appropriate for summer applications, while the non-ventilated PV roof was more suitable to be used in winter since it helped to reduce the heating load.
Fung et al. [36] experimentally investigated the thermal property of a semi-transparent PV module. Their test results demonstrated that the coverage area of the solar cells greatly affected the total solar heat gain, while the module thickness had quite a weak influence on the heat transfer through the module. Similar conclusions were arrived at by Wong et al. [37] in their simulation-based research on the application of semitransparent m-Si PV modules with a 50% transmittance in residential buildings in the five climate regions of Japan.
Double-glazed PV structures with an internal air gap may help to improve their thermal performance greatly. The movement of air in the air gap takes away the accumulated heat produced along with the PV effect, thus, reducing the operating temperature and electricity generation efficiency. Han et al. [38] introduced a numerical study on the heat transfer within a double-glazed PV window. Two-dimensional simulations indicated that the radiative heat transfer could be greatly reduced using an air gap with Low-E coatings on the inner surface. Han et al. [39] also pointed out that the air gap with a thickness between 6 cm and 8 cm achieves the best thermal performance for this PV window. Table 5 presents some outstanding research outcomes on the thermal performance of BIPV systems.
6.3. The Optical Performance of Semi-Transparent BIPV Systems
Semi-transparent PV technologies have been proven to be a promising alternative for PV integration in buildings [40,41,42] since they provide the functions of electricity production, indoor thermal load reduction, and daytime lighting for buildings. The transmittance of traditional glazing used in see-through building envelopes is usually 55–90% [43]. Though using semitransparent or translucent PV technologies in building envelopes reduces the light transmission rate when compared to traditional glazing technologies, it provides electricity generation and sun shading functions in building façades. In semi-transparent BIPV systems, the optical performance is always linked to PV glazing technologies, which use PV glazing to replace conventional glazing materials in façades, windows, atriums, skylights, etc. PV glazing can be fabricated from various PV cells, including crystalline or amorphous silicon solar cells and some emerging PV cell technologies in the third-generation, like organic and dye-sensitized PV cells.
Crystalline silicon (c-Si) PV technologies are nowadays the most mature PV technology. There are a number of articles in the literature focusing on the application of semi-transparent c-Si PV in buildings for the purpose of replacing traditional glazing materials and producing electricity on-site. C-Si PV cells are typically opaque. Therefore, in order to fabricate semitransparent c-Si PV modules, the PV cells should be arranged in such a way as to be separate from each other. Increasing the coverage area of the PV cells may result in a larger generation of electricity and a lower heat gain, but the daylighting would weaken due to the shading effect of the PV cells in the semi-transparent modules. On the contrary, a smaller coverage area leads to greater light transmittances, larger heat gains, and a lower generation of electricity. Using semi-transparent PV modules to replace traditional glazing provide one with an opportunity for electricity generation and a better thermal performance, but leads to compromises in lighting and external scenery. Hence, when designing and fabricating semi-transparent c-Si PV modules, the optimization on the overall performance should be performed by simulation in advance [44]. Additionally, the optical performance of semi-transparent PV technology greatly influences the operating temperature, thus, further affecting the generation of electricity and the indoor thermal load.
To improve the daylighting performance without sacrificing the electricity generation efficiency, the research and development of solar cells have been directed to semi-transparent thin-film PV technologies (such as a-Si, CIGS, CdTe, etc.). Thin-film PV modules with a light transmittance of 50% are already available in the PV market. These semi-transparent thin-film PV cells provide a more homogeneous daylighting performance compared to silicon-based semi-transparent PV cells. However, from the overall point of view, the energy conversion efficiency of thin-film technologies is generally lower. Moreover, there is always an increasing interest in developing low-cost semi-transparent PV technologies [45,46,47,48]. Nowadays, the unique characteristics of dye-sensitized and organic PV technologies, including having a low fabrication cost, a low material consumption, a simple manufacturing process, being sensitive to sunlight, and being easy to be used for large-scale applications, make them highly suitable for fabricating semi-transparent PV modules [48,49,50,51,52].
For semi-transparent BIPV systems, their optical properties are closely related to the electrical performance, the thermal performance, and the residents’ visual experience. Generally, semi-transparent PV modules’ transparency directly influences the energy requirements of lighting, heating, and cooling. For instance, an excessive light transmission will lead to a larger solar heat gain and a lower lighting energy requirement. Thus, a balanced solution should be determined for transparency. An outstanding feature of the thin-film based semi-transparent PV technology is that thin-film PV modules bring a better aesthetic and visual experience to the residents compared to c-Si transparent PV modules [44].
A series of studies have been performed to evaluate the optical performances of c-Si-based and thin-film-based semi-transparent PV technologies. For c-Si PV technology, the transmittance of BIPV systems mainly relies on the ratio of the PV cell area to the total glazing or panel area. Jiang et al. [53] investigated the effect of the solar cell coverage ratio on the property of a PV Trombe wall. The results verified that a higher coverage ratio resulted in a larger generation of electrical and a higher overall efficiency, but achieved a lower thermal efficiency and indoor temperature. Miyazaki et al. [44] numerically studied the effect of transmittance and the window-to-wall ratio on the performance of double-glazed PV windows. The results revealed that the best overall performance could be achieved when the transmittance was 40% and the window-to-wall ratio was 50%. In this case, the room’s electricity demand could be cut down by 55%. Yun et al. [54] found that both the window-to-wall ratio and the room depth could affect the performance of a ventilated semi-transparent PV façade. They pointed out that the PV cell area should be optimized by considering the combined effect of the window-to-wall ratio and room depth. Xu et al. [55] performed a comparative study on the optimal PV cell coverage ratio for semi-transparent PV systems in central China. The results verified that the PV electricity conversion efficiency decreased as the PV cell coverage ratio increased. With the increasing PV cell coverage ratio, the indoor daylight illuminance decreased linearly and the electricity consumption increased. Under the climatic conditions of central China, the increasing PV cell coverage ratio resulted in decreases in the heating and cooling electricity consumption. The overall energy demand of an office building could be reduced by 13% when an optimized BIPV façade was employed, as shown in Figure 5.
For thin-film based BIPV systems, Yoon et al. [56] evaluated the interaction between the efficiency and transparency of DSSC solar cells. They pointed out that a higher module efficiency did not always bring a higher overall efficiency for the window since the transparency greatly influenced the thermal and optical performance. Kang [57] employed the WINDOW software to investigate the optical performance of DSSC windows. The results indicated that the TiO2 thickness greatly influenced the transmittance and absorption of the module, but that the reflectance was not affected. For the DSSC windows, the red-type DSSC had a higher capacity in light transmission and the green type was more beneficial for cooling the load reduction. According to the research results of López et al. [58], the PV modules that were integrated into the window could greatly reduce the daylighting perception. Meanwhile, the PV module’s shading effect could mitigate the overheating problem for indoor environments. Olivieri et al. [59] tested the transparency variation of a PV module under different outdoor conditions. They pointed out that a high level of SHGC diversity occurred when the PV module was located in different environmental conditions. The transparency not only influenced the thermal performance, but also affected the power conversion efficiency. Table 6 illustrates some of the research outcomes on the optical performance of semi-transparent BIPV systems.
6.4. The Overall Energy Performance and Energy-Saving Potential of Semi-Transparent BIPV Systems
As aforementioned, semi-transparent BIPV systems provide multiple benefits to buildings, including on-site electricity generation, thermal load reduction, and artificial daylighting. Accordingly, when evaluating the overall performance of semi-transparent BIPV systems, three parts should be taken into account: the (a) electrical performance, (b) the optical performance, (c) and the thermal performance [60,61].
In References [62,63,64,65], a comprehensive simulation model in the EnergyPlus software was developed to simulate the overall performance of BIPV systems. The sub-models included the thermal balance model, the daylighting model, and the power generation model. The heat balance method in EnergyPlus was used to obtain the cooling loads of a reference BIPV room. According to the law of energy conservation, the solar energy absorbed by the PV component is converted into both electricity and heat. The ‘Integrated Surface Outside Face’ was adopted for determining the cell temperature of the semi-transparent PV component so as to couple the heat transfer and energy balance. The daylighting model in EnergyPlus was employed to simulate the daylighting performance of the semi-transparent PV component and to examine its influence on the light energy use. After the determination of the final daylight illuminance value, an insufficient amount of illuminance would be supplied by electric lighting in order to meet the daylighting requirements. To predict the power generation of the semi-transparent PV component, the Sandia Array Performance Model (SAPM) was adopted due to its versatility and accuracy for different types of solar cells, particularly for the thin-film PV modules. Additionally, since SAPM is empirically based, a series of indoor and outdoor tests were carried out to determine the basic parameters of the employed PV module required by SAPM. After obtaining the simulation results of each model, the overall energy performance values of different windows were able to be investigated. The flowchart of the modeling approach is shown in Figure 6.
Investigations on semi-transparent BIPV systems’ overall performance can only be traced in some articles in the literature based on experimental or numerical studies. Lu and Law [60] proposed a new methodology to study the overall energy performance of a single-glazed semi-transparent PV window. They concluded that by using the proposed PV window, the total heat gain of an office building in Hong Kong was reduced by about 65% and that the annual electricity saving potential was 900–1300 kWh in a typical year, depending on the type of indoor HVAC system used, compared to conventional clear glass windows.
Peng et al. [65] experimentally studied the thermal and power performances of a double-skin semi-transparent PV façade with different operation modes. The tested results showed that the electricity generation under the ventilated mode was greater than that under the non-ventilated mode by 3%, in accordance with the lower operating temperature. The non-ventilated mode achieved a solar heat gain coefficient of 0.12 and a U-value of 4.6, while the ventilated mode had values of 0.1 and 3.4, respectively. Therefore, the ventilated mode performed better in improving the electricity output and reducing the solar heat gain, while a better thermal insulation performance was achieved by the non-ventilated mode. Later in 2016, Peng et al. [62] numerically examined the overall performance of this PV system. The simulation results indicated that using a south-facing PV-DSF in an office at Berkeley helped to save the net electricity use by about 50%. The system was able to generate 65 kWh/m2 of electricity yearly and to cut down the net electricity demand of the room to 54.5 kWh/m2, as illustrated in Figure 7.
Wang et al. [63] proposed a new PV insulating glass unit made by semi-transparent a-Si PV modules and investigated its overall performance. The new unit’s energy-saving potentials were found to be 10.7% and 25.3%, respectively, when compared to commonly used single-layer Low-E glass and clear glass windows. Later in 2017, Wang et al. [64] compared the new PV unit’s comprehensive performance with a PV double-skin façade. The new PV unit had a higher energy-saving potential, but a lower conversion efficiency. Zhang et al. [61] numerically studied the performance indicators of a semi-transparent PV window. The southwest orientation was the most suitable for the electricity generation of the proposed window. Furthermore, the proposed window system was able to cut down the net electricity demand by 16% and 18%, compared to conventional double-glazed windows and single-layer clear glass windows.
The energy-saving potential of the semi-transparent BIPV systems is another research hotspot. Bahaj [66] found that PV windows made of thin-film PV modules could be an effective way to reduce heat gains in climate regions with large cooling requirements. The cooling load was able to be reduced by up to 31% during a one-year operation. Radhi [67] numerically investigated the energy performance of a vertical PV façade. The use of the PV module greatly improved the thermal performance of the exterior envelope. Using this PV façade system, the building’s total operational energy demand was able to be cut down by 1.1–2.2% due to the reduction of heat gains. In addition, the energy payback time can be reduced by 10 years when the energy-saving potential is taken into account. An energy-saving potential of 16.7–41.3% was achieved in Singapore by different BIPV technologies with a window-to-wall ratio of 70–100% [14]. In Reference [37], the research results showed that when compared to standard BIPV roofs, semi-transparent c-Si PV windows were able to save the HVAC energy demand by about 5.3%. The total heat gain over one-year can be reduced by 65% compared to clear glass windows. Didone et al. [68] performed a simulation research to investigate the energy-saving potential of different window systems. The numerical results indicated that PV windows provided the best overall energy performance compared to all other window systems. Li et al. [69] pointed out that the thermal and optical performances of PV systems contribute to a major part of the overall energy performance.
Chow et al. [33] employed the ESP-r software to model the operational conditions of different window systems. They concluded that the annual cooling electricity demand could be reduced by 23% and 28%, respectively, by single- and double-glazed PV windows in Hong Kong. Moreover, the cooling energy demand in summer could be reduced by 26% and 61%, compared to normal absorptive-glazed windows [32]. A semi-transparent PV window with a transparency of 11.7% helps to save up to 12% of the annual energy consumption, while a ventilated PV window with a transparency of 0.45–0.55 saves up to 55% of the annual energy use [70]. Olivieri et al. [71] numerically compared the performances of five semi-transparent PV systems with various window-to-wall ratios and with different transparencies. The energy-saving potential for semi-transparent PV solutions with a window-to-wall ratio less than 22% was lower than 5.5%, and the semi-transparent solutions with the window-to-wall ratio larger than 33% were able to save 18–59% of the net energy consumption. Liao [72] investigated the overall energy performance of a-Si PV semi-transparent glazing with different transmittances. The results revealed that PV glazing greatly reduced the energy consumption in cooling compared to regular glazing. Table 7 summarizes some of the research outcomes on the analysis of the overall energy performance of semi-transparent BIPV systems.
7. Life-Cycle Assessment (LCA) of PV Systems
Nowadays, PV technology has been generally recognized as the cleanest power generating technology, but there are still arguments that PV technologies may consume additional energy during their life cycles. For instance, energy may be consumed during the production, processing, and purification of raw PV materials; in the fabrication of PV modules and other system components; in the establishment, operation, and maintenance of PV systems; and in the dismantling, disposal, and recycling of the system components [1]. People may doubt whether the energy produced during their life cycle can balance the total energy consumption in their entire life. Therefore, a life-cycle assessment (LCA) considering both the total investment and total system production during the lifetime is helpful to evaluate the life-cycle performance of PV systems [73].
The International Energy Agency reported the guidelines for a PV system LCA recommended by the International Organization of Standardization [74]. These guidelines could be summarized as three main steps: (1) identifying the technical specifications and characteristics of PV systems; (2) specifying the modeling approaches of an LCA of PV system; (3) reporting and sharing the LCA results of PV systems. The energy payback time (EPBT) and the greenhouse-gas emissions (GHGEs) are the recommended and most frequently used indicators for the LCA of PV systems. EPBT is the required period in which the PV system achieves an electricity balance, i.e., the system generates the same amount of electricity as the electricity consumed over its lifetime. EPBT can definitely point out whether a PV system can achieve a net energy gain over its lifetime and, if so, to what extent [73]. Compared with conventional power systems, PV systems offer a great potential for mitigating GHGEs. Therefore, the GHGEs of PV systems during their life cycle are considered as another evaluation indicator for the LCA of PV systems. In the LCA of PV systems, GHGEs—including CO2, CH4, N2O, chlorofluorocarbons, etc.—are converted into their equivalent amount of CO2 over a time horizon of 100 years [73].
For PV systems, the calculation equations of the EPBT and GHGE rate can be usually presented as follows:
where, Einput is the primary energy input of the PV module during its life cycle, which includes the energy requirements in the manufacturing, transportation, installation, operation, and maintenance of the module as well as in the decommissioning or recycling of the module (MJ); EBOS,E is the energy requirements of the balance of system (BOS) components, which include support structures, cabling, electronic and electrical components, inverters, and batteries (for a stand-alone system) (MJ); Eoutput is the annual primary energy savings due to the electricity generation by the PV system, (MJ).
where, GHGErate is the GHGErate of the per unit electric power generated by a PV system (g CO2-eq./kWh); GHGEtotal is the total amount of GHGE throughout the life cycle (g CO2-eq.); ELCA-output is the total electric power generated by the PV system during its life cycle (kWh); GHGEPV and GHGEBOS are the total GHG emission with respect to the PV modules and BOS components, respectively.
7.1. The LCA of BIPV Systems
Although the emphasis of this paper is in BIPV technology, to the best of our knowledge, there were very limited discussions that could be found focusing on the LCA of BIPV systems. Lamnatou et al. [75] developed a multiple life-cycle impact assessment method to investigate the life-cycle properties of a building-integrated concentrating photovoltaic (BICPV) system, as illustrated in Figure 8. The results showed that with regard to the PBTs, taking into account both the configurations with and without reflective films, Barcelona presented the lowest ReCiPe and Eco-indicator-99 PBTs ranging from 3.6 to 5.8 years. On the other hand, Exeter and Dublin showed PBTs from 3.7 to 7.8 years. Regarding the two configurations, the findings based on multiple approaches verify that reflective films considerably improved the eco-profile of the reference system.
Menoufi et al. [76] conducted an LCA study of a BICPV scheme at the University of Lleida (Spain). The results demonstrated the significantly low environmental impact of using CPV technology, where the CPV system represented only 10% of the total impact of the BICPV scheme. In addition, it was shown that replacing the BICPV scheme with a BIPV one caused an increment in the corresponding environmental impact by about 13.5%, where the impact of the PV system was about 2.35 times that of the impact of the CPV one.
Ng et al. [77] examined the environmental and economic performance of the life cycle of commercially available semi-transparent BIPV modules for a window application under the tropical conditions of Singapore. Energy simulations were adopted to conduct a life cycle assessment to determine long-term performance in terms of energy and carbon emissions, as well as cost considerations. The EPBT and EROEI for the modules ranged from 0.68 to 1.98 and from 11.72 to 34.49, respectively. After considering government subsidies, some modules cost lower than conventional windows, while half of the remaining modules achieved payback periods of 1.1–13.1 years.
Li et al. [78] conducted an LCA study for a novel asymmetric lens-walled compound parabolic concentrator integration with PV (aCPC-PV) in China. The LCA results showed that the primary energy demand of the aCPC-PV module was 12.2 MJ/Wp; the EPBTs of the aCPC-PV module were 2.82–4.74 years for the installation in five cities in China, which were 0.2–0.3 years lower than that of the PV module with the same DC output. Considering the fact that the lifespan of the CPV system is 25 years or more, which is much larger than the EPBT of the aCPC-PV module, it is practical and economical to install aCPC-PV modules on the buildings in China.
Bizzarri and Morini [79] used the LCA methodology to investigate the energy and environmental impact of a BIPV roof. The results reveal that a PV roof system could bring both energy and environmental benefits even in areas characterized by medium values of insolation. It was demonstrated that the embodied energy consumed during the manufacturing phases was normally recovered after a few years of operation. On the contrary, the economic payback time was always higher than the energy payback time.
Lu and Yang [80] reported the investigation results of the EPBT and greenhouse-gas payback time (GPBT) of a rooftop BIPV system (grid-connected) in Hong Kong. The EPBT of the PV system was 7.3 years, and the GPBT was estimated to be 5.2 years by considering the fuel mixture composition of local power stations. This paper also discussed the EPBTs for different orientations, ranging from 7.1 years (optimal orientation) to 20.0 years (west-facing vertical PV façade). The results showed that the ‘sustainability’ of a PV system was affected by its installation orientation and location.
Perez and Fthenakis [81] performed a thorough LCA for environmental impact-analyses of façade-integrated PV systems based on the detailed bills of material and construction data directly from the designers, architects, and manufacturers in the supply chain of the Solaire’s BIPV array in New York City. The findings indicated that replacing an alternative cladding system by a BIPV façade system had a competitive EPBT of 3.8 years. BIPV offered a distinct advantage when it replaced the structural units, thus avoiding the cost, embodied energy, and corresponding emissions.
Belussi et al. [82] conducted an LCA study to quantify the potential environmental impact of a newly developed ceramic BIPV module. The results indicated that the environmental impact of the BIPV module took on values comparable to conventional photovoltaic systems, both in terms of emissions and consumption of resources.
Baumann et al. [83] quantitatively compared the main environmental impacts of two selected PV power systems: a ground-based 1 MWp system in Toledo (Spain) and a 40 kWp building integrated façade in Newcastle upon Tyne (NE England) using the LCA methodology. The results of the LCA showed that façade atmospheric emissions were the priority impacts with respect to the assessed PV power systems. Comparing Si wafer systems, the CO2 emissions were 88 t/GWh for the Toledo PV plant and 143 t/GWh for the BIPV façade. If the façade had used electrodeposited CdTe, the CO2 emissions would have fallen to about 50 t/GWh.
Hammond et al. [84] performed an energy analysis, environmental LCA, and economic analysis to study the performance of a domestic BIPV system. The energy analysis determined that the system paid back its embodied energy in just 4.5 years. Environmental LCA revealed that over the lifetime of the BIPV system, the impacts from production were offset by the electricity generated (the avoided impacts) to provide a net environmental benefit. The financial analysis considered the householder’s perspective in contrast to the cost-benefit analysis, which considered a societal perspective.
Wu et al. [85] investigated the economic benefits of building-integrated photovoltaics (BIPV) facilities and equipment by analyzing the net present values (NPV) and a payback period of the BIPV façade of a shopping mall in Taiwan over its lifecycle. The NPV and payback period analysis both indicated that the BIPV façade in the case study reached its breakeven point within 10 years of payback period and within 16 years of NPV during a life cycle of 20 years.
Jayathissa et al. [86] investigated the environmental impact of a dynamic and adaptive BIPV system. The results indicated that the environmental impact of the dynamic BIPV system was 50% higher than a static system and that dynamic BIPV systems could be preferable when the shading effects were included.
Agrawal and Tiwari [87] developed a thermodynamic model to determine the energy, exergy, and life-cycle costs of a BIPV system. The results indicated that although the mono-crystalline BIPV system was more suitable for residential consumers from the viewpoint of the energy and exergy efficiencies, the amorphous silicon BIPV system was found to be more economical. The energy and exergy efficiencies of the amorphous silicon BIPV system were found to be 33.54% and 7.13%, respectively, under the composite climatic conditions prevailing in New Delhi.
Tripathy et al. [88] presented a Life-cycle Cost Analysis (LCCA) of Building Integrated Photovoltaic thermal (BIPVT) systems with reference to Indian weather conditions. The cost of the energy produced by the system ranged between 1.61 and 3.61 US$/kWh depending on the climatic conditions of the place. The EPBT of the system was found to range between 7.30 years and 16.9 years, which was lower than the expected service life of the modules. Both LCCA and EPBT were increased because of the shadow effect but these values were decreased due to the airflow through the duct.
Table 8 summarizes the main research outcomes on the LCA of BIPV systems.
7.2. The LCA of Different Types of PV Modules
Through the above literature review, we can see that the LCA research of BIPV systems is still at the beginning stage. Therefore, the research results in this subject are very limited and only a few investigations can be found in the existing literature. To figure out the life-cycle benefits of BIPV technologies, the LCA should be focusing on the future. Currently, a series of LCAs have been performed for different types of PV modules and the outcomes of these investigations can be treated as reference sources for the life-cycle performance of BIPV technologies.
Peng et al. [89] conducted a thorough review of the LCA studies of the five common photovoltaic (PV) systems, i.e., mono-crystalline (mono-Si), multi-crystalline (multi-Si), amorphous silicon (a-Si), CdTe thin-film (CdTe), CIS thin-film (CIS), and some advanced PV systems. The results showed that among the five common PV systems, the CdTe PV system had the best environmental performance in terms of EPBT and the GHGE rate due to its low life-cycle energy requirements and relatively high conversion efficiency. The mono-Si PV system demonstrated the worst performance because of its high energy-intensity during the production process. The EPBT and GHGE rate of the thin-film PV systems were within the range of 0.75–3.5 years and 10.5–50 g CO2-eq./kWh; the EPBT of mono-Si PV systems ranged from 1.7 to 2.7 years with a GHGE rate within the range of 29–45 g CO2-eq./kWh, as illustrated in Figure 9.
Hammond et al. [90] utilized the energy analysis, environmental LCA, financial analysis, and economic cost-benefit analysis (CBA) to estimate the performance of a 2.1 kWp domestic PV system located in Southern England. The energy analysis revealed a short energy payback period of just 4.5 years in contrast to an expected 25-year lifetime.
Ito et al. [91] compared the economic and environmental impacts of five types of 100 MW Very Large-Scale Photovoltaic Power Generation (VLS-PV) Systems. It was found that the EPT was 1.5–2.5 years and that the CO2 emission rate was 9–16 g-C/kWh. The generation cost was 11–12 US Cent/kWh on using the 2 USD/W PV modules and 19–20 US Cent/kWh on using the 4 USD/W PV module price.
Raugei et al. [92] reported the LCA results of the CdTe and CIS photovoltaic modules. Overall, the results clearly showed a very promising picture for thin-film technologies, which were found to be characterized by favorable environmental impact indicators in spite of their still comparatively lower efficiencies.
Pacca et al. [93] performed the LCA of different PV technologies and systems. For the baseline scenario, the EPBT for the PVL136 and KC120 were 3.2 and 7.5 years, respectively. When the expected future conversion efficiencies were tested, the EPBT was 1.6 and 5.7 years for the PVL136 and the KC120, respectively. The CO2 emissions for the PVL136 and the KC120 were 34.3 and 72.4 g of CO2/kWh, respectively.
Battisti et al. [94] carried out an LCA to derive the complete and extended energy and environmental profile of a conventional multi-crystalline PV system located in Rome (Italy). The environmental payback time of all the configurations was lower than their expected lifetime (3–4 years vs. 15–30 years).
Held et al. [95] updated the LCA results. Their results indicated that depending on the installation location in Europe, the corresponding GHGEs of PV power for ground-mounted power plants were between 19 and 30 g CO2-equiv./kWh and between 0.7 and 1.1 years in terms of EBPT.
Table 9 illustrates the previous studies on LCA of various PV systems, including the mono-Si, multi-Si, a-Si, CdTe, and CIGS PV systems, in terms of the EPBT and GHGE rate.
The LCA results were found to be considerably different for mono-Si PV systems. The EPBT ranged between 1.7 and 12.1 years, and the GHGE rate varied between 29 and 55 g CO2-eq./kWh. The EPBT and the GHGE rate of multi-Si PV systems varied in the region of 1.7–6.0 years and that of 12–111 g CO2-eq./kWh, respectively. For thin-film PV systems—including a-Si, CdTe, and CIS—the EPBT and the GHGE rate varied in the range of 0.7–5.52 years and the range of 10.5–50 g CO2-eq./kWh, respectively. The a-Si system had the longest EPBT, while CdTe enjoyed the shortest EPBT and the lowest GHGE rate.
Seen from the table, the LCA results by different researchers vary a lot. The reason for this may be that the EPBT and the GHGE rate of a PV system are influenced by various factors including the solar radiation level, installation location, climate conditions, and other parameters that affect the system’s electricity output. Generally, though there are horizontal contrasts between these PV systems, the present mono-Si PVs have the highest EPBT and GHGE rates in their lifetime, while thin-film PVs have the lowest EPBT value. It is expected that new emerging technologies may provide the potential for developing PV materials with a higher efficiency and lower cost, thus, helping to promote PV systems with lower EPBT and GHGE rates.
8. Barriers and Strategies for BIPV Development
The development of BIPV has been ongoing for a long period in the past few decades, but this technology has not yet been applied in the large-scale. Currently, the most widely adopted PV systems are of the roof-mounted type. There are many barriers and challenges to overcome [114], including:
- Policy barriers: lack of government support;
- Perception barriers: poor public understanding;
- Economic barriers: the high cost of BIPV modules, the high cost of design and construction;
- Technical barrier: lack of standards, low power efficiency, poor power reliability.
To promote BIPV applications, governments, manufacturers, professionals, community groups, clients, and end users should accept their share of responsibility [114]. Governments should propose and enact various policies, including financial policies, research and development policies, and educational policies in order to reduce the cost of BIPV and to improve public awareness by promoting BIPV implementation [115]. Manufacturers should increase their investments in the research and development of high-efficiency and low-cost PV material and products [87]. Improving the knowledge professionals on BIPV can reduce the design, construction, and maintenance costs of BIPV systems [116]. Designers and architects need to improve their design skills and installers and site engineers need to improve their construction skills. PV workers and technicians need to acquire PV system maintenance, repair, and replacement skills. Communities can put in the effort by showing the benefits of BIPV and the importance of BIPVs in the national energy structure [116]. End users should improve their perceptions and knowledge of BIPV [117]. Moreover, for all the above-mentioned stakeholders, collaborations and a close cooperation relationship between them would be extremely advantageous in promoting BIPV applications.
9. Summary
In recent years, BIPV has been developing rapidly due to advances in technology, the cost reduction in PV materials, and an increase in governments’ incentive policies for renewable energy technologies. Herewith, this paper systematically reviews the recent research progress of the electrical, thermal, optical, and overall energy performances, as well as the status of the EPBT and GHGEs of BIPV systems. Through this literature review, the multiple benefits of BIPV can be identified and the prospect of the development of this technology can be demonstrated. The review results can not only provide reference and support for the research and development of BIPV, but it can also strengthen the confidence of designers and investors in this technology.
The biggest advantage of BIPV is that the integration of PV modules brings a high on-site electricity production potential for modern buildings. The review results on the electricity generation potential of BIPV in buildings, cities, and countries confirms that promoting BIPV applications would be a great help for the future production and supply of regional electricity demands. BIPV also brings about some by-produced advantages related to architectural aesthetics and energy efficiency aspects compared to conventional buildings, i.e., indoor thermal load reduction and daylighting provision. Moreover, for BIPV systems, their electrical, thermal, and optical properties are always closely related to each other. Generally, PV modules’ transparency directly influences the electricity production and the energy requirements of lighting, heating, and cooling. The excessive light transmission will lead to a larger solar heat gain, a lower power output, and a lower lighting energy requirement. Therefore, before designing a BIPV system, a balanced solution of the PV module should be determined for the optimal combination of the electrical, thermal, and optical properties. The LCA of BIPV systems and various PV modules confirms the environmental and economic performance life cycle of BIPV technologies.
Although BIPV currently enjoys multiple advantages, this technology has not yet achieved large-scale application. Numerous barriers hinder the development and application of this technology, including policy barriers, perception barriers, economic barriers, and technology barriers. Additionally, there are still some research weaknesses in the application of BIPV: (1) the LCA of typical BIPV systems is still limited, therefore, the long-term environmental impacts are not clearly identified; (2) the electricity generation efficiency is still very low, therefore, further research and development are still needed for the development of new PV materials and high-efficiency PV modules; (3) the initial investment of a BIPV system is still high, therefore, new and low-cost integration methods should be developed in the future.
New technologies and products with a higher efficiency and lower cost are important for energy and economic payback time reduction for BIPV applications. All the stakeholders including the governments, manufacturers, professionals, communities, and end-users should put in the effort to promote BIPV applications. With a high efficiency; low-cost products; improved skills in system design, construction, operation, and maintenance; a better social awareness of the lifecycle costs and benefits; and the common effort of all the stakeholders, BIPV is expected to have a bright future in building energy self-sufficiency and global energy production and supply.
Author Contributions
All the authors actively participated in the elementary related research, papers selection, literature survey, discussions, and state of the art review of this paper.
Funding
This research was supported by The Hong Kong Polytechnic University’s Postdoctoral Fellowships Scheme (G-YW2E). Appreciation is also given to the Hong Kong Housing Authority for its financial support.
Conflicts of Interest
The authors declare no conflicts of interest. The contents are solely the responsibility of the authors and do not necessarily represent the official view of the Hong Kong Housing Authority.
References
- Peng, C.; Huang, Y.; Wu, Z. Building-integrated photovoltaics (BIPV) in architectural design in china. Energy Build. 2011, 43, 3592–3598. [Google Scholar] [CrossRef]
- Parida, B.; Iniyan, S.; Goic, R. A review of solar photovoltaic technologies. Renew. Sustain. Energy Rev. 2011, 15, 1625–1636. [Google Scholar] [CrossRef]
- Temby, O.; Kapsis, K.; Berton, H.; Rosenbloom, D.; Gibson, G.; Athienitis, A.; Meadowcroft, J. Building-integrated photovoltaics: Distributed energy development for urban sustainability. Environ. Sci. Policy Sustain. Dev. 2014, 56, 4–16. [Google Scholar] [CrossRef]
- Transparency Market Research. Building Integrated Photovoltaics Market: Global Industry Analysis, Size, Share, Growth, Trends and Forecast, 2013–2019; Transparency Market Research: Albany, NY, USA, 2015. [Google Scholar]
- Nanomarkets. BIPV Technologies and Market, 2015–2022; Nano-839; N-Tech Research: Glen Allen, VA, USA, 2015. [Google Scholar]
- Tabakovic, M.; Fechner, H.; Sark, W.V.; Louwen, A.; Georghiou, G.; Makrides, G.; Loucaidou, E.; Ioannidou, M.; Weiss, I.; Arancon, S.; et al. Status and outlook for building integrated photovoltaics (BIPV) in relation to educational needs in the BIPV sector. Energy Procedia 2017, 111, 993–999. [Google Scholar] [CrossRef]
- Sharma, S.; Jain, K.K.; Sharma, A. Solar cells: In research and applications—A review. Mater. Sci. Appl. 2015, 6, 1145–1155. [Google Scholar] [CrossRef]
- Gul, M.; Kotak, Y.; Muneer, T. Review on recent trend of solar photovoltaic technology. Energy Explor. Exploit. 2016, 34, 485–526. [Google Scholar] [CrossRef] [Green Version]
- Shukla, A.K.; Sudhakar, K.; Baredar, P. A comprehensive review on design of building integrated photovoltaic system. Energy Build. 2016, 128, 99–110. [Google Scholar] [CrossRef]
- Zhao, J.; Wang, A.; Greea, M.A. High-efficiency PERL and PERT silicon solar cells on FZ and MCZ substrates. Sol. Energy Mater. Sol. Cells 2011, 65, 429–435. [Google Scholar] [CrossRef]
- National Renewable Energy Laboratory (NREL). Best Research-Cell Efficiencies. Available online: https://www.nrel.gov/pv/assets/images/efficiency-chart.png (accessed on 13 November 2018).
- Song, J.-H.; An, Y.-S.; Kim, S.-G.; Lee, S.-J.; Yoon, J.-H.; Choung, Y.-K. Power output analysis of transparent thin-film module in building integrated photovoltaic system (BIPV). Energy Build. 2008, 40, 2067–2075. [Google Scholar] [CrossRef]
- Yoon, J.-H.; Song, J.; Lee, S.-J. Practical application of building integrated photovoltaic (BIPV) system using transparent amorphous silicon thin-film PV module. Sol. Energy 2011, 85, 723–733. [Google Scholar] [CrossRef]
- Ng, P.K.; Mithraratne, N.; Kua, H.W. Energy analysis of semi-transparent BIPV in Singapore buildings. Energy Build. 2013, 66, 274–281. [Google Scholar] [CrossRef]
- Park, K.E.; Kang, G.H.; Kim, H.I.; Yu, G.J.; Kim, J.T. Analysis of thermal and electrical performance of semi-transparent photovoltaic (PV) module. Energy 2010, 35, 2681–2687. [Google Scholar] [CrossRef]
- Yoon, J.-H.; Shim, S.-R.; An, Y.S.; Lee, K.H. An experimental study on the annual surface temperature characteristics of amorphous silicon BIPV window. Energy Build. 2013, 62, 166–175. [Google Scholar] [CrossRef]
- Fossa, M.; Ménézo, C.; Leonardi, E. Experimental natural convection on vertical surfaces for building integrated photovoltaic (BIPV) applications. Exp. Therm. Fluid Sci. 2008, 32, 980–990. [Google Scholar] [CrossRef]
- Gan, G. Numerical determination of adequate air gaps for building-integrated photovoltaics. Sol. Energy 2009, 83, 1273–1353. [Google Scholar] [CrossRef]
- Ritzen, M.J.; Vroon, Z.A.E.P.; Rovers, R.; Lupíšek, A.; Geurts, C.P.W. Environmental impact comparison of a ventilated and a non-ventilated building-integrated photovoltaic rooftop design in the Netherlands: Electricity output, energy payback time, and land claim. Sol. Energy 2017, 155, 304–313. [Google Scholar] [CrossRef]
- Charron, R.; Athienitis, A.K. Optimization of the performance of double facades with integrated photovoltaic panel and motorized blinds. Sol. Energy 2006, 80, 482–491. [Google Scholar] [CrossRef]
- Tian, H.; Yu, X.; Zhang, J.; Duan, W.; Tian, F.; Yu, T. The Influence of environmental factors on DSSCs for BIPV. Int. J. Electrochem. Sci. 2012, 7, 4686–4691. [Google Scholar]
- Ordenes, M.; Marinoski, D.L.; Braun, P.; Rüther, R. The impact of building integrated photovoltaics on the energy demand of multi-family dwellings in Brazil. Energy Build. 2007, 39, 629–642. [Google Scholar] [CrossRef]
- BIPV China. Available online: http://www.bipvcn.org/project/case/domestic (accessed on 13 November 2018).
- You, S.; Yang, H. The potential electricity generating capacity of BIPV in Hong Kong. In Proceedings of the Conference Record of the Twenty-Sixth IEEE Photovoltaic Specialists Conference, Anaheim, CA, USA, 29 September–3 October 1997; pp. 1345–1348. [Google Scholar]
- International Energy Agency. Potential for Building Integrated Photovoltaics. Report IEA-PVPST7-4:2002. Available online: www.iea-pvps.org/index.php?id=9&eID=dam_frontend_push&docID=394 (accessed on 13 November 2018).
- Peng, J.; Lu, L. Investigation on the development potential of rooftop PV system in Hong Kong and its environmental benefits. Renew. Sustain. Energy Rev. 2013, 27, 149–162. [Google Scholar] [CrossRef]
- Defaix, P.R.; van Sark, W.G.J.H.M.; Worrell, E.; Visser, E.D. Technical potential for photovoltaics on buildings in the eu-27. Sol. Energy 2012, 86, 2644–2653. [Google Scholar] [CrossRef]
- Peng, J.; Lin, L.; Yang, H. An experimental study of the thermal performance of a novel photovoltaic double-skin facade in Hong Kong. Sol. Energy 2013, 97, 293–304. [Google Scholar] [CrossRef]
- Peng, J.; Lu, L.; Yang, H.; Han, J. Investigation on the annual thermal performance of a photovoltaic wall mounted on a multi-layer façade. Appl. Energy 2013, 112, 646–656. [Google Scholar] [CrossRef]
- Yang, H.; Burnett, J.; Ji, J. Simple approach to cooling load component calculation through PV walls. Energy Build. 2000, 31, 285–290. [Google Scholar] [CrossRef]
- Ji, J.; Chow, T.; He, W. Dynamic performance of hybrid photovoltaic/thermal collector wall in Hong Kong. Build. Environ. 2003, 38, 1327–1334. [Google Scholar] [CrossRef]
- Chow, T.T.; Pei, G.; Chan, L.S.; Lin, Z.; Fong, K.F. A comparative study of PV glazing performance in warm climate. Indoor Built Environ. 2009, 18, 32–40. [Google Scholar] [CrossRef]
- Chow, T.T.; Qiu, Z.; Li, C. Potential application of “see-through” solar cells in ventilated glazing in Hong Kong. Sol. Energy Mater. Sol. Cells 2009, 93, 230–238. [Google Scholar] [CrossRef]
- He, W.; Zhang, Y.X.; Sun, W.; Hou, J.X.; Jiang, Q.Y.; Ji, J. Experimental and numerical investigation on the performance of amorphous silicon photovoltaics window in east china. Build. Environ. 2011, 46, 363–369. [Google Scholar] [CrossRef]
- Wang, Y.; Tian, W.; Ren, J.; Ren, J.; Zhu, L.; Wang, Q. Influence of a building’s integrated-photovoltaics on heating and cooling loads. Appl. Energy 2006, 83, 989–1003. [Google Scholar] [CrossRef]
- Fung, T.Y.Y.; Yang, H. Study on thermal performance of semi-transparent building-integrated photovoltaic glazings. Energy Build. 2008, 40, 341–350. [Google Scholar] [CrossRef]
- Wong, P.W.; Shimoda, Y.; Nonaka, M.; Inoue, M.; Mizuno, M. Semi-transparent PV: Thermal performance, power generation, daylight modelling and energy saving potential in a residential application. Renew. Energy 2008, 33, 1024–1036. [Google Scholar] [CrossRef]
- Han, J.; Lu, L.; Yang, H. Numerical evaluation of the mixed convective heat transfer in a double-pane window integrated with see-through a-Si PV cells with low-e coatings. Appl. Energy 2010, 87, 3431–3437. [Google Scholar] [CrossRef]
- Han, J.; Lu, L.; Yang, H. Thermal behavior of a novel type see-through glazing system with integrated PV cells. Build. Environ. 2009, 44, 2129–2136. [Google Scholar] [CrossRef]
- Norton, B.; Eames, P.C.; Mallick, T.K.; Huang, M.J.; McCormack, S.J.; Mondol, J.D.; Yohanis, Y.G. Enhancing the performance of building integrated photovoltaics. Sol. Energy 2011, 85, 1629–1664. [Google Scholar] [CrossRef] [Green Version]
- Chow, T.-T.; Li, C.; Lin, Z. Innovative solar windows for cooling-demand climate. Sol. Energy Mater. Sol. Cells 2010, 94, 212–220. [Google Scholar] [CrossRef]
- Skandalos, N.; Karamanis, D. Investigation of thermal performance of semi-transparent PV technologies. Energy Build. 2016, 124, 19–34. [Google Scholar] [CrossRef]
- Tuchinda, C.; Srivannaboon, S.; Lim, H.W. Photoprotection by window glass, automobile glass, and sunglasses. J. Am. Acad. Dermatol. 2006, 54, 845–854. [Google Scholar] [CrossRef] [PubMed]
- Miyazaki, T.; Akisawa, A.; Kashiwagi, T. Energy savings of office buildings by the use of semi-transparent solar cells for windows. Renew. Energy 2005, 30, 281–304. [Google Scholar] [CrossRef]
- Chae, Y.T.; Kim, J.; Park, H.; Shin, B. Building energy performance evaluation of building integrated photovoltaic (BIPV) window with semi-transparent solar cells. Appl. Energy 2014, 129, 217–227. [Google Scholar] [CrossRef]
- Kroon, J.M.; Bakker, N.J.; Smit, H.J.P.; Liska, P.; Thampi, K.R.; Wang, P.; Grätzel, M.; Hinsch, A.; Hore, S.; Würfel, U.; et al. Nanocrystalline dye-sensitized solar cells having maximum performance. Prog. Photovolt. Res. Appl. 2007, 15, 1–18. [Google Scholar] [CrossRef]
- Ito, S.; Zakeeruddin, S.M.; Humphry-Baker, R.; Liska, P.; Charvet, R.; Comte, P.; Nazeeruddin, M.K.; Péchy, P.; Takata, M.; Miura, H.; et al. High-efficiency organic-dye-sensitized solar cells controlled by nanocrystalline-TiO2 electrode thickness. Adv. Mater. 2006, 18, 1202–1205. [Google Scholar] [CrossRef]
- Nazeeruddin, M.K.; De Angelis, F.; Fantacci, S.; Selloni, A.; Viscardi, G.; Liska, P.; Ito, S.; Takeru, B.; Grätzel, M. Combined experimental and DFT-TDDFT computational study of photoelectrochemical cell ruthenium sensitizers. J. Am. Chem. Soc. 2005, 127, 16835–16847. [Google Scholar] [CrossRef] [PubMed]
- Dennler, G.; Sariciftci, N.S. Flexible conjugated polymer-based plastic solar cells: From basics to applications. Proc. IEEE 2005, 93, 1429–1439. [Google Scholar] [CrossRef]
- Jørgensen, M.; Norrman, K.; Krebs, F.C. Stability/degradation of polymer solar cells. Sol. Energy Mater. Sol. Cells 2008, 92, 686–714. [Google Scholar] [CrossRef]
- Kim, H.; Kushto, G.P.; Arnold, C.B.; Kafafi, Z.H.; Piqué, A. Laser processing of nanocrystalline TiO2 films for dye-sensitized solar cells. Appl. Phys. Lett. 2004, 85, 464–466. [Google Scholar] [CrossRef]
- Schmidt-Mende, L.; Zakeeruddin, S.M.; Grätzel, M. Efficiency improvement in solid-state-dye-sensitized photovoltaics with an amphiphilic Rutheniumdye. Appl. Phys. Lett. 2005, 86, 013504. [Google Scholar] [CrossRef]
- Jiang, B.; Ji, J.; Yi, H. The influence of PV coverage ratio on thermal and electrical performance of photovoltaic-Trombe wall. Energy Conserv. 2007, 33, 2491–2498. [Google Scholar] [CrossRef]
- Yun, G.Y.; Mcevoy, M.; Steemers, K. Design and overall energy performance of a ventilated photovoltaic façade. Sol. Energy 2007, 81, 383–394. [Google Scholar] [CrossRef]
- Xu, S.; Liao, W.; Huang, J.; Kang, J. Optimal PV cell coverage ratio for semi-transparent photovoltaics on office building façades in central China. Energy Build. 2014, 77, 130–138. [Google Scholar] [CrossRef] [Green Version]
- Yoon, S.; Tak, S.; Kim, J.; Jun, Y.; Kang, K.; Park, J. Application of transparent dyesensitized solar cells to building integrated photovoltaic systems. Build. Environ. 2011, 46, 1899–1904. [Google Scholar] [CrossRef]
- Kang, J.-G.; Kim, J.-H.; Kim, J.-T. Performance evaluation of DSC windows for buildings. Int. J. Photoenergy 2013, 2013, 472086. [Google Scholar] [CrossRef]
- López, C.S.P.; Sangiorgi, M. Comparison assessment of BIPV façade semitransparent modules: Further insights on human comfort conditions. Energy Procedia 2014, 48, 1419–1428. [Google Scholar] [CrossRef]
- Olivieri, L.; Caamaño-Martin, E.; Olivieri, F.; Neila, J. Integral energy performance characterization of semi-transparent photovoltaic elements for building integration under real operation conditions. Energy Build. 2014, 68, 280–291. [Google Scholar] [CrossRef] [Green Version]
- Lu, L.; Law, K.M. Overall energy performance of semi-transparent single-glazed photovoltaic (PV) window for a typical office in Hong Kong. Renew. Energy 2013, 49, 250–254. [Google Scholar] [CrossRef]
- Zhang, W.; Lu, L.; Peng, J.; Song, A. Comparison of the overall energy performance of semi-transparent photovoltaic windows and common energy-efficient windows in Hong Kong. Energy Build. 2016, 128, 511–518. [Google Scholar] [CrossRef]
- Peng, J.; Curcija, D.C.; Lu, L.; Selkowitz, S.E.; Yang, H.; Zhang, W. Numerical investigation of the energy saving potential of a semi-transparent photovoltaic double-skin facade in a cool-summer Mediterranean climate. Appl. Energy 2016, 165, 345–356. [Google Scholar] [CrossRef]
- Wang, M.; Peng, J.; Li, N.; Lu, L.; Ma, T.; Yang, H. Assessment of energy performance of semi-transparent PV insulating glass units using a validated simulation model. Energy 2016, 112, 538–548. [Google Scholar] [CrossRef]
- Wang, M.; Peng, J.; Li, N.; Yang, H.; Wang, C.; Li, X.; Lu, T. Comparison of energy performance between PV double skin facades and PV insulating glass units. Appl. Energy 2017, 194, 148–160. [Google Scholar] [CrossRef]
- Peng, J.; Lu, L.; Yang, H.; Ma, T. Comparative study of the thermal and power performances of a semi-transparent photovoltaic façade under different ventilation modes. Appl. Energy 2015, 138, 572–583. [Google Scholar] [CrossRef]
- Bahaj, A.S.; James, P.A.B.; Jentsch, M.F. Potential of emerging glazing technologies for highly glazed buildings in hot arid climates. Energy Build. 2008, 40, 720–731. [Google Scholar] [CrossRef]
- Radhi, H. Energy analysis of facade-integrated photovoltaic systems applied to UAE commercial buildings. Sol. Energy 2010, 84, 2009–2021. [Google Scholar] [CrossRef]
- Leite Didoné, E.; Wagner, A. Semi-transparent PV windows: A study for office buildings in Brazil. Energy Build. 2013, 67, 136–142. [Google Scholar] [CrossRef]
- Li, D.H.W.; Lam, T.N.T.; Chan, W.W.H.; Mak, A.H.L. Energy and cost analysis of semitransparent photovoltaic in office buildings. Appl. Energy 2009, 86, 722–729. [Google Scholar] [CrossRef]
- Chow, T.T.; Fong, K.F.; He, W.; Lin, Z.; Chan, A.L.S. Performance evaluation of a PV ventilated window applying to office building of Hong Kong. Energy Build. 2007, 39, 643–650. [Google Scholar] [CrossRef]
- Olivieri, L.; Caamaño-Martín, E.; Moralejo-Vázquez, F.J.; Martín-Chivelet, N.; Olivieri, F.; Neila-Gonzalez, F.J. Energy saving potential of semi-transparent photovoltaic elements for building integration. Energy 2014, 76, 572–583. [Google Scholar] [CrossRef] [Green Version]
- Wei, L.; Xu, S. Energy performance comparison among see-through amorphous-silicon PV (photovoltaic) glazings and traditional glazings under different architectural conditions in China. Energy 2015, 83, 267–275. [Google Scholar]
- Fthenakis, V.M.; Kim, H.C. Photovoltaics: Life-cycle analyses. Sol. Energy 2009, 85, 1609–1628. [Google Scholar] [CrossRef]
- Fthenakis, V.; Frischknecht, R.; Raugei, M.; Kim, H.C.; Alsema, E.; Held, M.; de Wild-Scholten, M. Methodology Guidelines on Life Cycle Assessment of Photovoltaic Electricity, 3rd ed.; IEA PVPS Task 12; International Energy Agency Photovoltaic Power systems Programme: Ursen, Switzerland, 2016; Available online: http://www.iea-pvps.org/fileadmin/dam/public/report/technical/Task_12_-_Methodology_Guidelines_on_Life_Cycle_Assessment_of_Photovoltaic_Electricity_3rd_Edition.pdf (accessed on 13 November 2018).
- Lamnatou, C.; Baig, H.; Chemisana, D.; Mallick, T.K. Environmental assessment of a building-integrated linear dielectric-based concentrating photovoltaic according to multiple life-cycle indicators. J. Clean. Prod. 2016, 131, 773–784. [Google Scholar] [CrossRef]
- Menoufi, K.; Chemisana, D.; Rosell, J.I. Life Cycle Assessment of a Building Integrated Concentrated Photovoltaic scheme. Appl. Energy 2013, 111, 505–514. [Google Scholar] [CrossRef]
- Ng, P.K.; Mithraratne, N. Lifetime performance of semi-transparent building-integrated photovoltaic (BIPV) glazing systems in the tropics. Renew. Sustain. Energy Rev. 2014, 31, 736–745. [Google Scholar] [CrossRef]
- Li, G.; Xuan, Q.; Pei, G.; Su, Y.; Lu, Y.; Ji, J. Life-cycle assessment of a low-concentration PV module for building south wall integration in China. Appl. Energy 2018, 215, 174–185. [Google Scholar] [CrossRef]
- Bizzarri, G.; Morini, G.L. A Life Cycle Analysis of roof integrated photovoltaic systems. Int. J. Environ. Technol. Manag. 2007, 7. [Google Scholar] [CrossRef]
- Lu, L.; Yang, H.X. Environmental payback time analysis of a roof-mounted building-integrated photovoltaic (BIPV) system in Hong Kong. Appl. Energy 2010, 87, 3625–3631. [Google Scholar] [CrossRef]
- Perez, M.J.R.; Fthenakis, V. A lifecycle assessment of façade BIPV in New York. In Proceedings of the 2011 37th IEEE Photovoltaic Specialists Conference, Seattle, WA, USA, 19–24 June 2011; pp. 003271–003276. [Google Scholar]
- Belussi, L.; Mariotto, M.; Meroni, I.; Zevi, C.; Dei Svaldi, S. LCA study and testing of a photovoltaic ceramic tile prototype. Renew. Energy 2015, 74, 263–270. [Google Scholar] [CrossRef]
- Baumann, A.E.; Hill, R.; Hynes, K.M. Environmental impacts of PV systems-ground-based vs. BIPV. In Proceedings of the Conference Record of the Twenty Sixth IEEE Photovoltaic Specialists Conference, Anaheim, CA, USA, 29 September–3 October 1997; pp. 1361–1364. [Google Scholar]
- Hammond, G.P.; Harajli, H.A.; Jones, C.I.; Winnett, A.B. Integrated appraisal of a building integrated photovoltaic (BIPV) system. In Proceedings of the 2009 International Conference on Sustainable Power Generation and Supply, Nanjing, China, 6–7 April 2009; pp. 1–9. [Google Scholar]
- Wu, Y.W.; Wen, M.H.D.; Young, L.M.; Hsu, I.T. LCA-Based Economic Benefit Analysis for Building Integrated Photovoltaic (BIPV) Façades: A Case Study in Taiwan. Int. J. Green Energy 2017, 15. [Google Scholar] [CrossRef]
- Jayathissa, P.; Jansen, M.; Heeren, N.; Nagy, Z.; Schlueter, A. Life cycle assessment of dynamic building integrated photovoltaics. Sol. Energy Mater. Sol. Cells 2016, 156, 75–82. [Google Scholar] [CrossRef]
- Agrawal, B.; Tiwari, G.N. Life cycle cost assessment of building integrated photovoltaic thermal (bipvt) systems. Energy Build. 2010, 42, 1472–1481. [Google Scholar] [CrossRef]
- Tripathy, M.; Joshi, H.; Panda, S.K. Energy payback time and life-cycle cost analysis of building integrated photovoltaic thermal system influenced by adverse effect of shadow. Appl. Energy 2017, 208, 376–389. [Google Scholar] [CrossRef]
- Peng, J.; Lu, L.; Yang, H. Review on life cycle assessment of energy payback and greenhouse gas emission of solar photovoltaic systems. Renew. Sustain. Energy Rev. 2013, 19, 255–274. [Google Scholar] [CrossRef]
- Hammond, G.P.; Harajli, H.A.; Jones, C.I.; Winnett, A.B. Whole systems appraisal of a UK building integrated photovoltaic (BIPV) system: Energy, environmental, and economic evaluations. Energy Policy 2012, 40, 219–230. [Google Scholar] [CrossRef]
- Ito, M.; Kato, K.; Komoto, K.; Kichimi, T.; Kurokava, K. A comparative study on cost and life-cycle analysis for 100 MW very large-scale (VLS-PV) systems in deserts using m-Si, a-Si CdTe and CIS modules. Prog. Photovolt. Res. Appl. 2008, 16, 17–30. [Google Scholar] [CrossRef]
- Raugei, M.; Bargigli, S.; Ulgiati, S. Life cycle assessment and energy pay-back time of advanced photovoltaic modules: CdTe and CIS compared to poly-Si. Energy 2007, 32, 1310–1318. [Google Scholar] [CrossRef]
- Pacca, S.; Sivaraman, D.; Keoleian, G.A. Parameters affecting the life cycle performance of PV technologies and systems. Energy Policy 2007, 35, 3316–3326. [Google Scholar] [CrossRef]
- Battisti, R.; Corrado, R. Evaluation of technical improvements of photovoltaic systems through life cycle assessment methodology. Energy 2005, 30, 952–967. [Google Scholar] [CrossRef]
- Held, M.; Ilg, R. Update of environmental indicators and energy payback time of CdTe PV systems in Europe. Prog. Photovolt. Res. Appl. 2011, 19, 614–626. [Google Scholar] [CrossRef]
- Wilson, R.; Young, A. The embodied energy payback period of photovoltaic installations applied to buildings in the UK. Build. Environ. 1996, 31, 299–305. [Google Scholar] [CrossRef]
- Kato, K.; Murata, A.; Sakuta, K. Energy pay-back time and life-cycle CO2 emission of residential PV power system with silicon PV module. Prog. Photovolt. Res. Appl. 1998, 6, 105–115. [Google Scholar] [CrossRef]
- Alsema, E.A.; Wild-Scholten, M.J. The real environmental impacts of crystalline silicon PV modules: An analysis based on up-to-date manufacture data. In Proceedings of the 20th European Photovoltaic Solar Energy Conference, Barcelona, Spain, 6–10 June 2005. [Google Scholar]
- Alsema, E.A.; Wild-Scholten, M.J.; Fthenakis, V.M. Environmental impacts of PV electricity generation—A critical comparison of energy supply options. In Proceedings of the 21th European Photovoltaic Solar Energy Conference, Dresden, Germany, 4–8 September 2006. [Google Scholar]
- Jungbluth, N.; Dones, R.; Frischknecht, R. Life cycle assessment of photovoltaics: Update of the ecoinvent database. In Proceedings of the 14th SETAC LCA Case Studies Symposium, Giteborg, Sweden, 3–4 December 2007. [Google Scholar]
- Wild-Scholten, M.J. Energy payback times of PV modules and systems. In Proceedings of the Workshop Photovoltaik-Modultechnik, Koln, Germany, 26–27 November 2009. [Google Scholar]
- Ito, M.; Komoto, K.; Kurokawa, K. Life-cycle analyses of very-large scale PV systems using six types of PV modules. Curr. Appl. Phys. 2010, 10, S271–S273. [Google Scholar] [CrossRef]
- Seng, L.Y.; Lalchand, G.; Lin, G.M.S. Economical, environmental and technical analysis of building integrated photovoltaic systems in Malaysia. Energy Policy 2008, 36, 2130–2142. [Google Scholar] [CrossRef]
- Phylipsen, G.J.M.; Alsema, E.A. Environmental Life-Cycle Assessment of Multicrystalline Silicon Solar Cell Modules; Report No. 95057; Department of Science, Technology and Society, Utrecht University: Utrecht, The Netherlands, 1995. [Google Scholar]
- Alsema, E.A. Energy pay-back time and CO2 emissions of PV systems. Prog. Photovolt. Res. Appl. 2000, 8, 17–25. [Google Scholar] [CrossRef]
- Ito, M.; Kato, K.; Sugihara, H.; Kichimi, T.; Song, J.; Kurokava, K. A preliminary study on potential for very large-scale photovoltaic power generation (VLS-PV) system in the Gobi desert from economic and environmental viewpoints. Sol. Energy Mater. Sol. Cells 2003, 75, 507–517. [Google Scholar] [CrossRef]
- Jungbluth, N. Life cycle assessment of crystalline photovoltaics in the Swiss ecoinvent database. Prog. Photovolt. Res. Appl. 2005, 13, 429–446. [Google Scholar] [CrossRef] [Green Version]
- Lewis, G.; Keoleian, G. Life Cycle Design of Amorphous Silicon Photovoltaics Modules; APE/600/SR-97/081; Environmental Protection Agency Center for Environmental Research Information: Cincinnati, OH, USA, 1997. Available online: http://www.umich.edu/~nppcpub/research/pv.pdf). (accessed on 13 November 2018).
- Alsema, E.A. Energy requirements of thin film solar cell modules—A review. Renew. Sustain. Energy Rev. 1998, 2, 387–415. [Google Scholar] [CrossRef]
- Kato, K.; Hibino, T.; Komoto, K.; Ihara, S.; Yamamoto, S.; Fujihara, H. A life-cycle analysis on thin-film CdS/CdTe PV modules. Sol. Energy Mater. Sol. Cells 2001, 67, 279–287. [Google Scholar] [CrossRef]
- Fthenakis, V.M.; Kim, H.C. Energy use and greenhouse gas emissions in the life cycle of thin film CdTe photovoltaics. In Proceedings of the Symposium G-Life Cycle Analysis, Materials Research Society Fall Meeting, Boston, MA, USA, 29 November–2 December 2005. [Google Scholar]
- Fthenakis, V.; Kim, H.C.; Held, M.; Raugei, M.; Krones, J. Update of PV energy payback times and life-cycle greenhouse gas emissions. In Proceedings of the 24th European Photovoltaic Solar Energy Conference, Hamburg, Germany, 21–25 September 2009. [Google Scholar]
- Keoleian, G.A.; Lewis, G.M. Modeling the life cycle energy and environmental performance of amorphous silicon BIPV roofing in the US. Renew. Energy 2003, 28, 271–293. [Google Scholar] [CrossRef]
- Yang, R.J.; Zou, P.X.W. Building integrated photovoltaics (BIPV): Costs, benefits, risks, barriers and improvement strategy. Int. J. Constr. Manag. 2016, 16, 39–53. [Google Scholar] [CrossRef]
- Moosavian, S.M.; Rahim, N.A.; Selvaraj, J.; Selvaraj, J.; Solangi, K.H. Energy policy to promote photovoltaic generation. Renew. Sustain. Energy Rev. 2013, 25, 44–58. [Google Scholar] [CrossRef]
- Azadian, F.; Radzi, M.A.M. A general approach toward building integrated photovoltaic systems and its implementation barriers: A review. Renew. Sustain. Energy Rev. 2013, 22, 527–538. [Google Scholar] [CrossRef] [Green Version]
- Abdullah, A.S.; Abdullah, M.P.; Hassan, M.Y.; Hussin, F. Renewable energy cost-benefit analysis under Malaysian feed-in-tariff. In Proceedings of the 2012 IEEE Student Conference on Research and Development (SCOReD), Pulau Pinang, Malaysia, 5–6 December 2012; pp. 160–165. [Google Scholar]
Figure 1.
The three generations of solar photovoltaic (PV) cells.

Figure 2.
The reported timeline of solar cell energy conversion efficiencies (National Renewable Energy Laboratory) [11].
Figure 2.
The reported timeline of solar cell energy conversion efficiencies (National Renewable Energy Laboratory) [11].

Figure 3.
(a) A thin-film building-integrated photovoltaic (BIPV) system and its (b) electricity output in Reference [12].
Figure 3.
(a) A thin-film building-integrated photovoltaic (BIPV) system and its (b) electricity output in Reference [12].

Figure 4.
The investigation of (a) a photovoltaic-double-skin façade (PV-DSF) on its (b) thermal performance in Reference [28].
Figure 4.
The investigation of (a) a photovoltaic-double-skin façade (PV-DSF) on its (b) thermal performance in Reference [28].

Figure 5.
(a) A ventilated semi-transparent photovoltaic (PV) façade and its (b) optimal PV cell coverage ratio under various window-to-wall ratios and room depths [55].
Figure 5.
(a) A ventilated semi-transparent photovoltaic (PV) façade and its (b) optimal PV cell coverage ratio under various window-to-wall ratios and room depths [55].

Figure 6.
The overall energy performance assessment of semi-transparent BIPV systems [61].
Figure 6.
The overall energy performance assessment of semi-transparent BIPV systems [61].

Figure 7.
The overall energy performance of a photovoltaic double-skin façade (PV-DSF): (a) the PV-DSF; (b) the overall energy performance of the PV-DSF [62].
Figure 7.
The overall energy performance of a photovoltaic double-skin façade (PV-DSF): (a) the PV-DSF; (b) the overall energy performance of the PV-DSF [62].

Figure 8.
The environmental assessment of (a) a building-integrated concentrating photovoltaic (BICPV) according to (b) the multiple life-cycle indicators in Reference [75].
Figure 8.
The environmental assessment of (a) a building-integrated concentrating photovoltaic (BICPV) according to (b) the multiple life-cycle indicators in Reference [75].

Figure 9.
The review results of (a) energy payback time (EPBT) and (b) the greenhouse gas emission (GHGE) rate for various PV modules [89].
Figure 9.
The review results of (a) energy payback time (EPBT) and (b) the greenhouse gas emission (GHGE) rate for various PV modules [89].


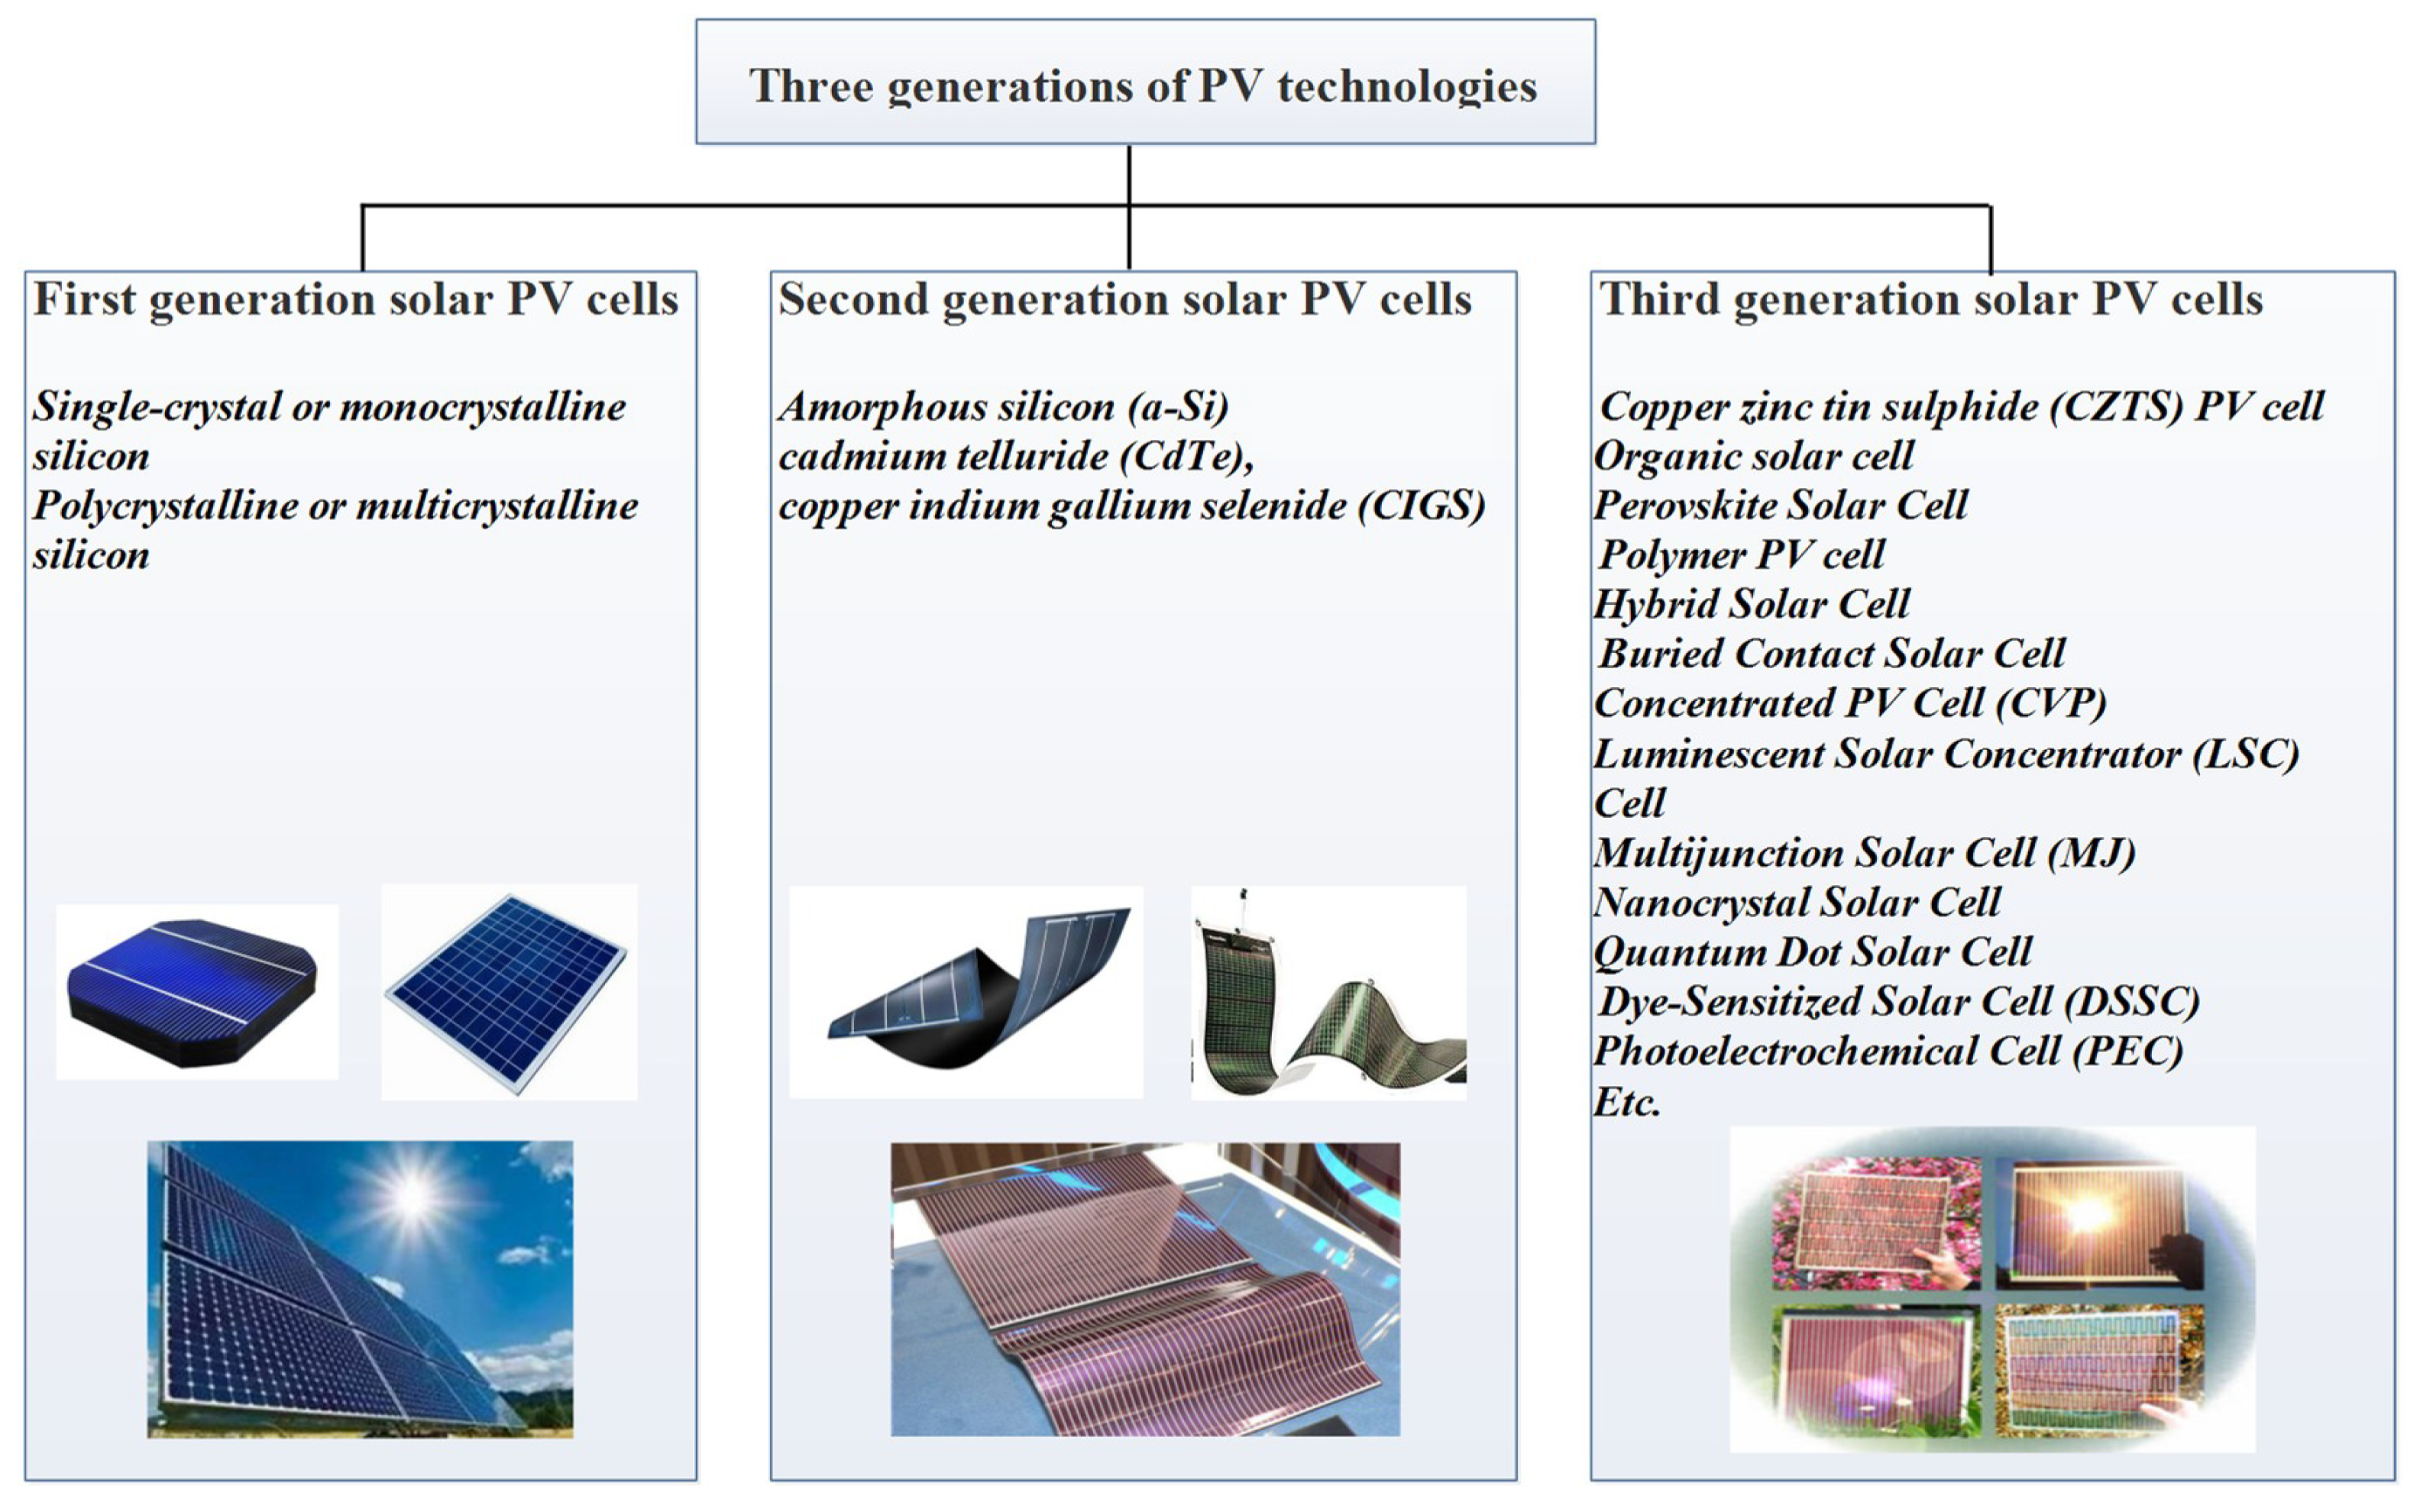
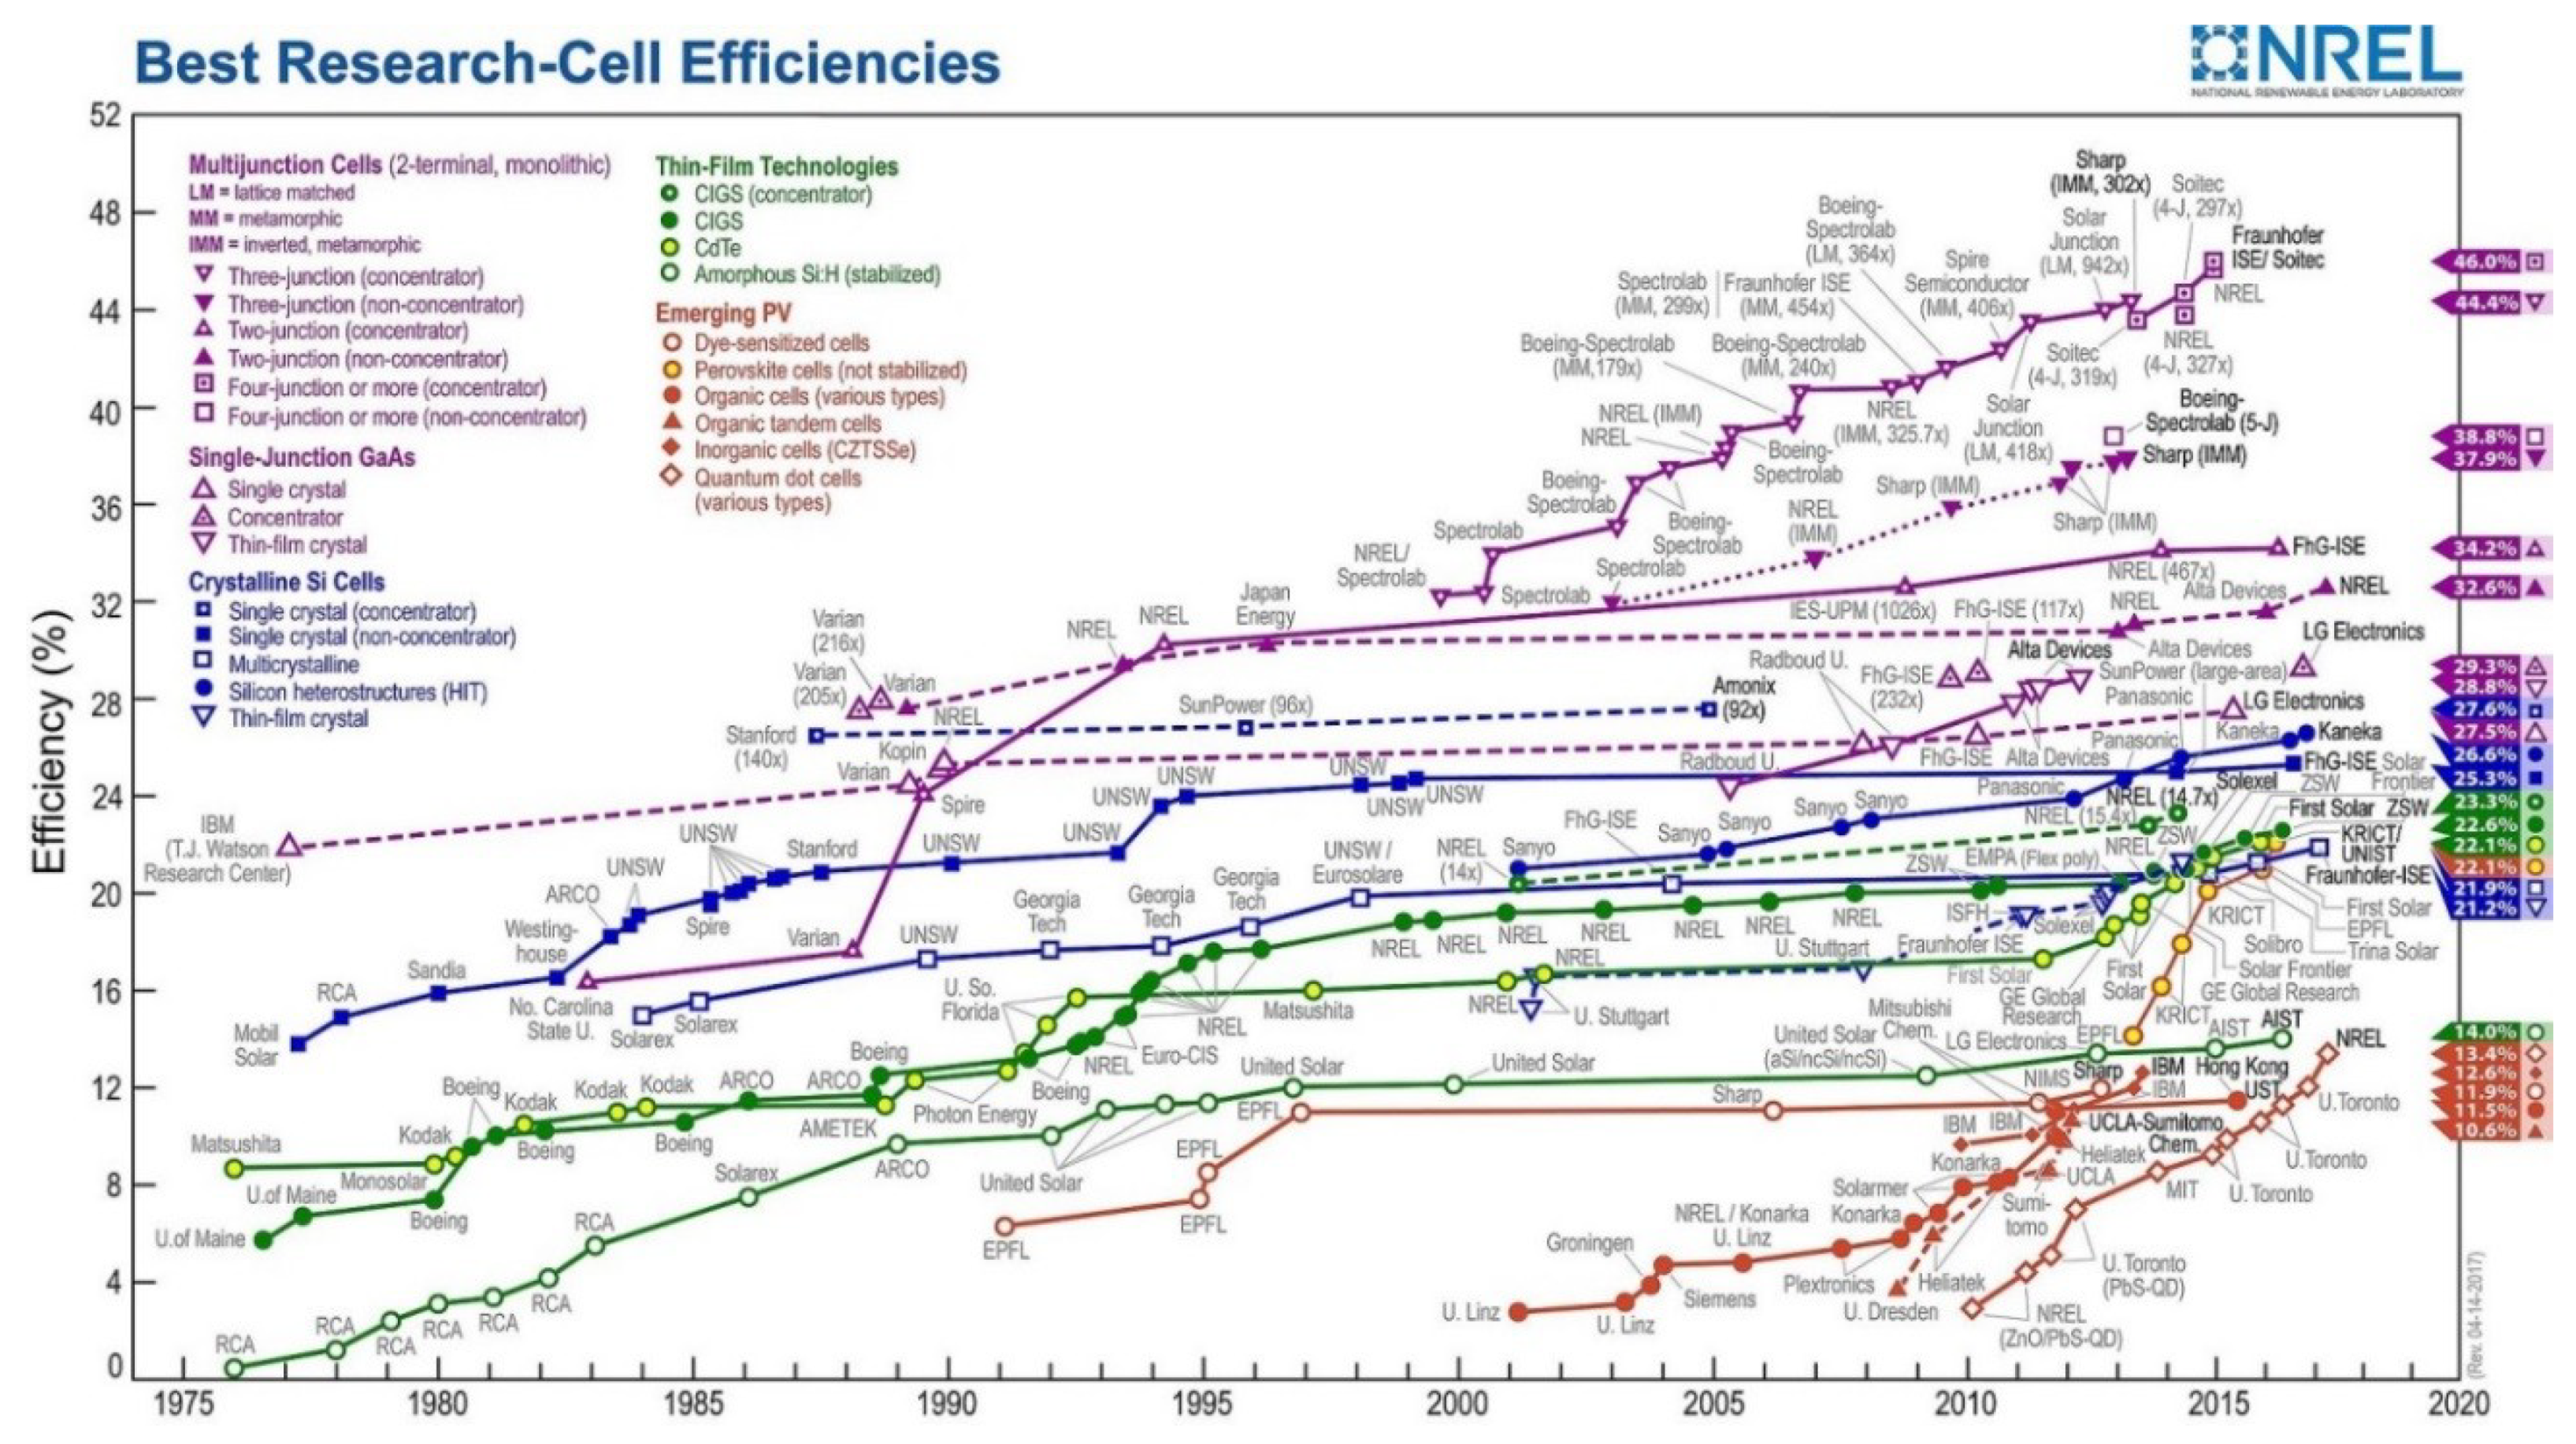
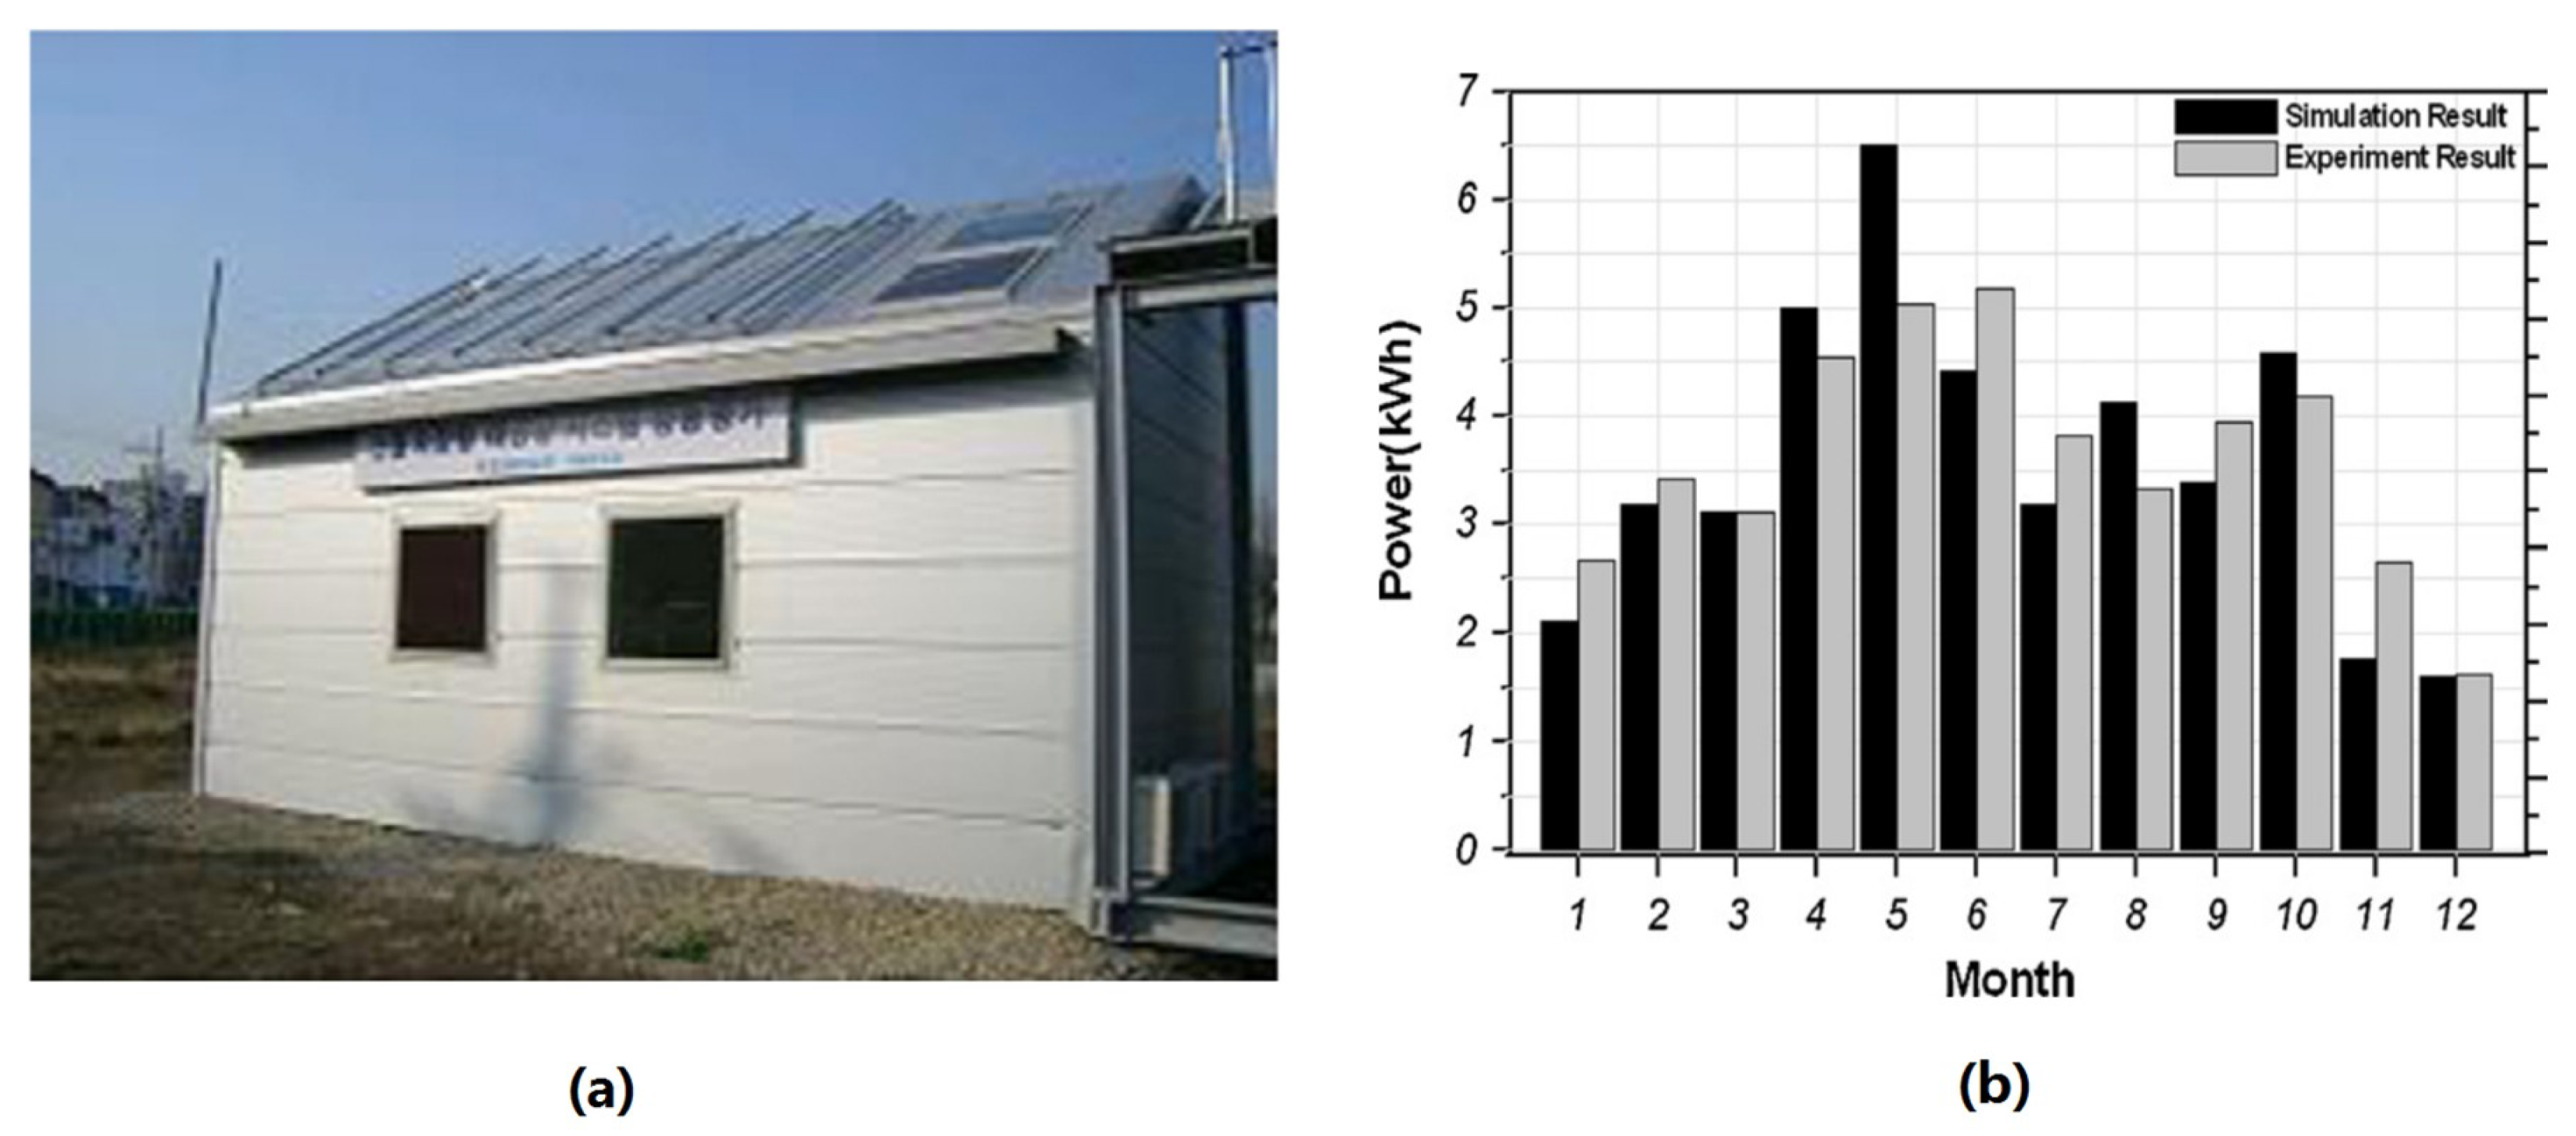
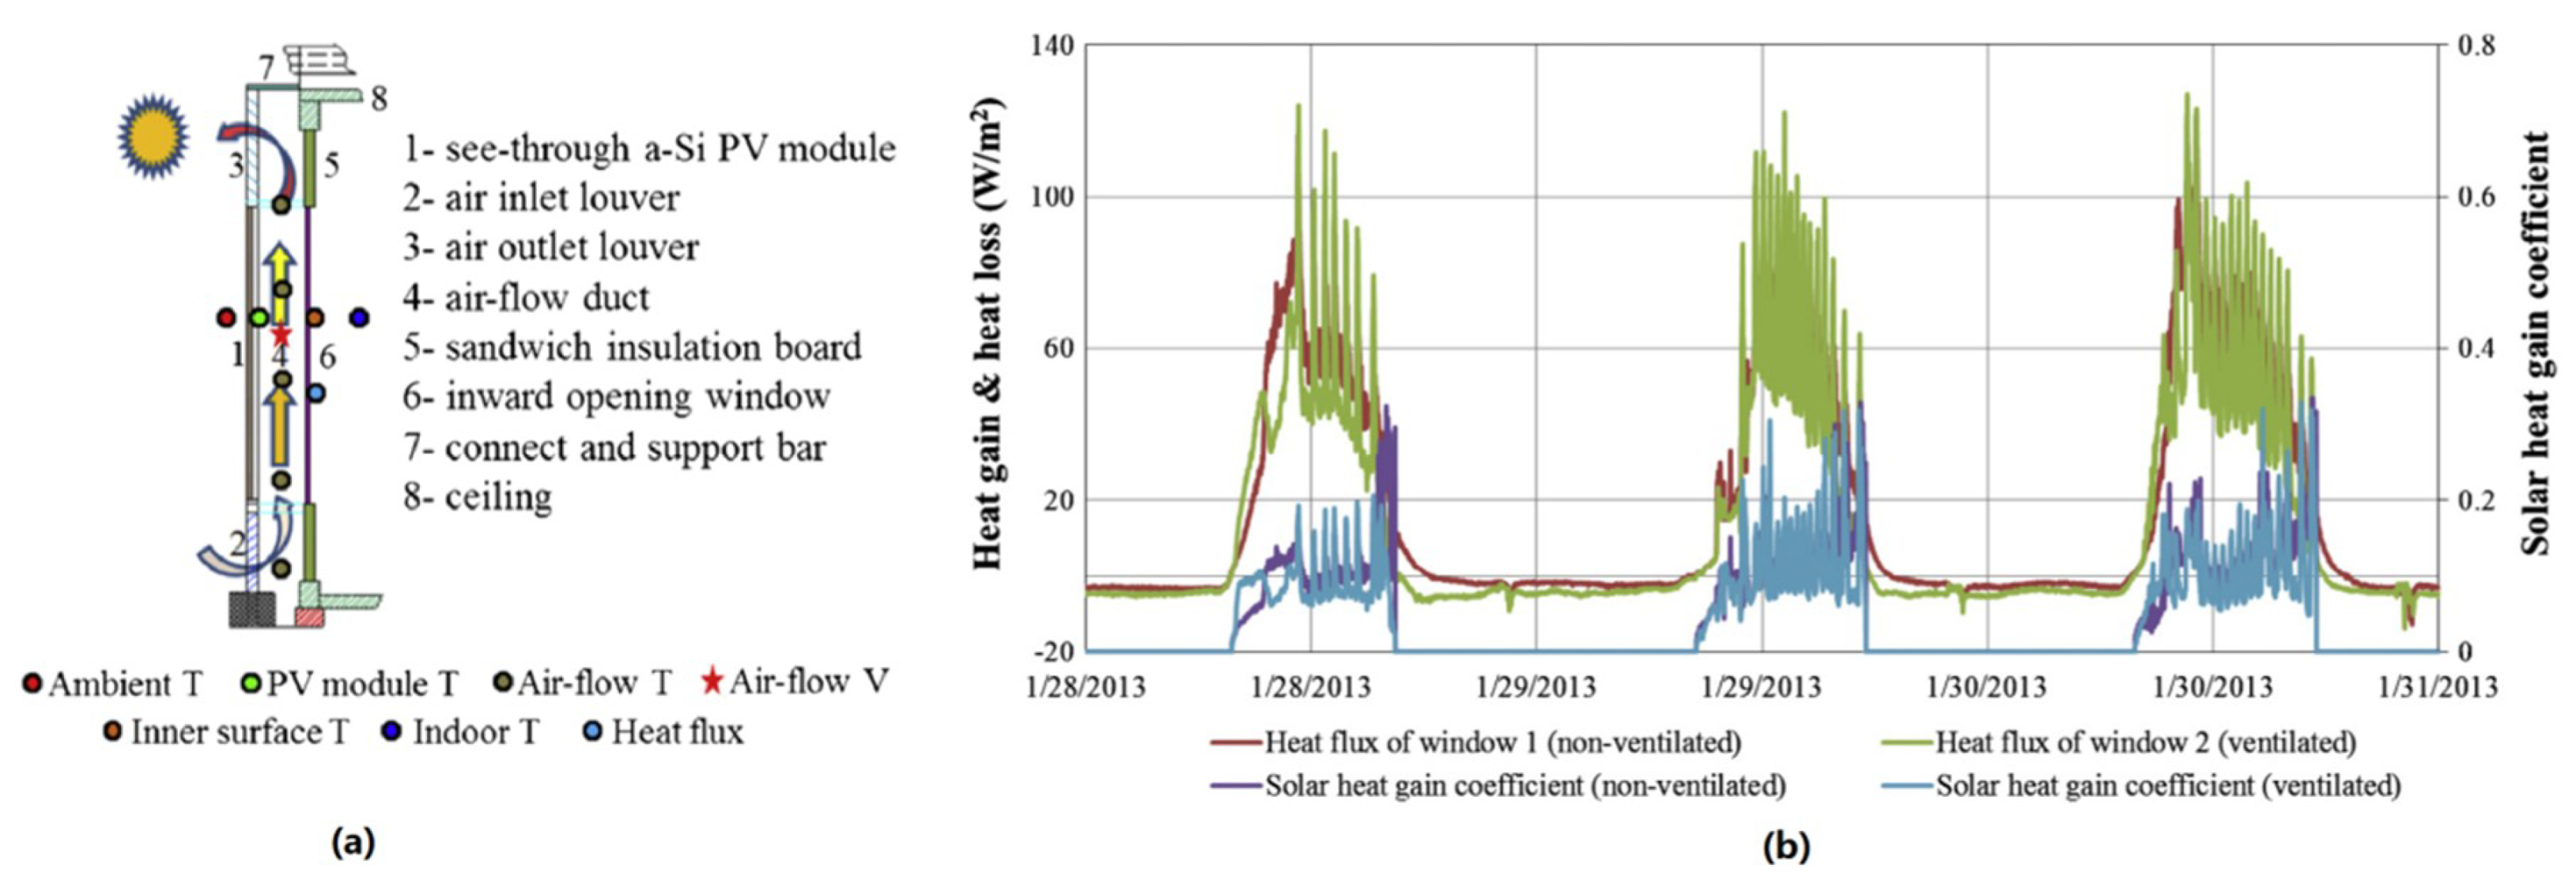
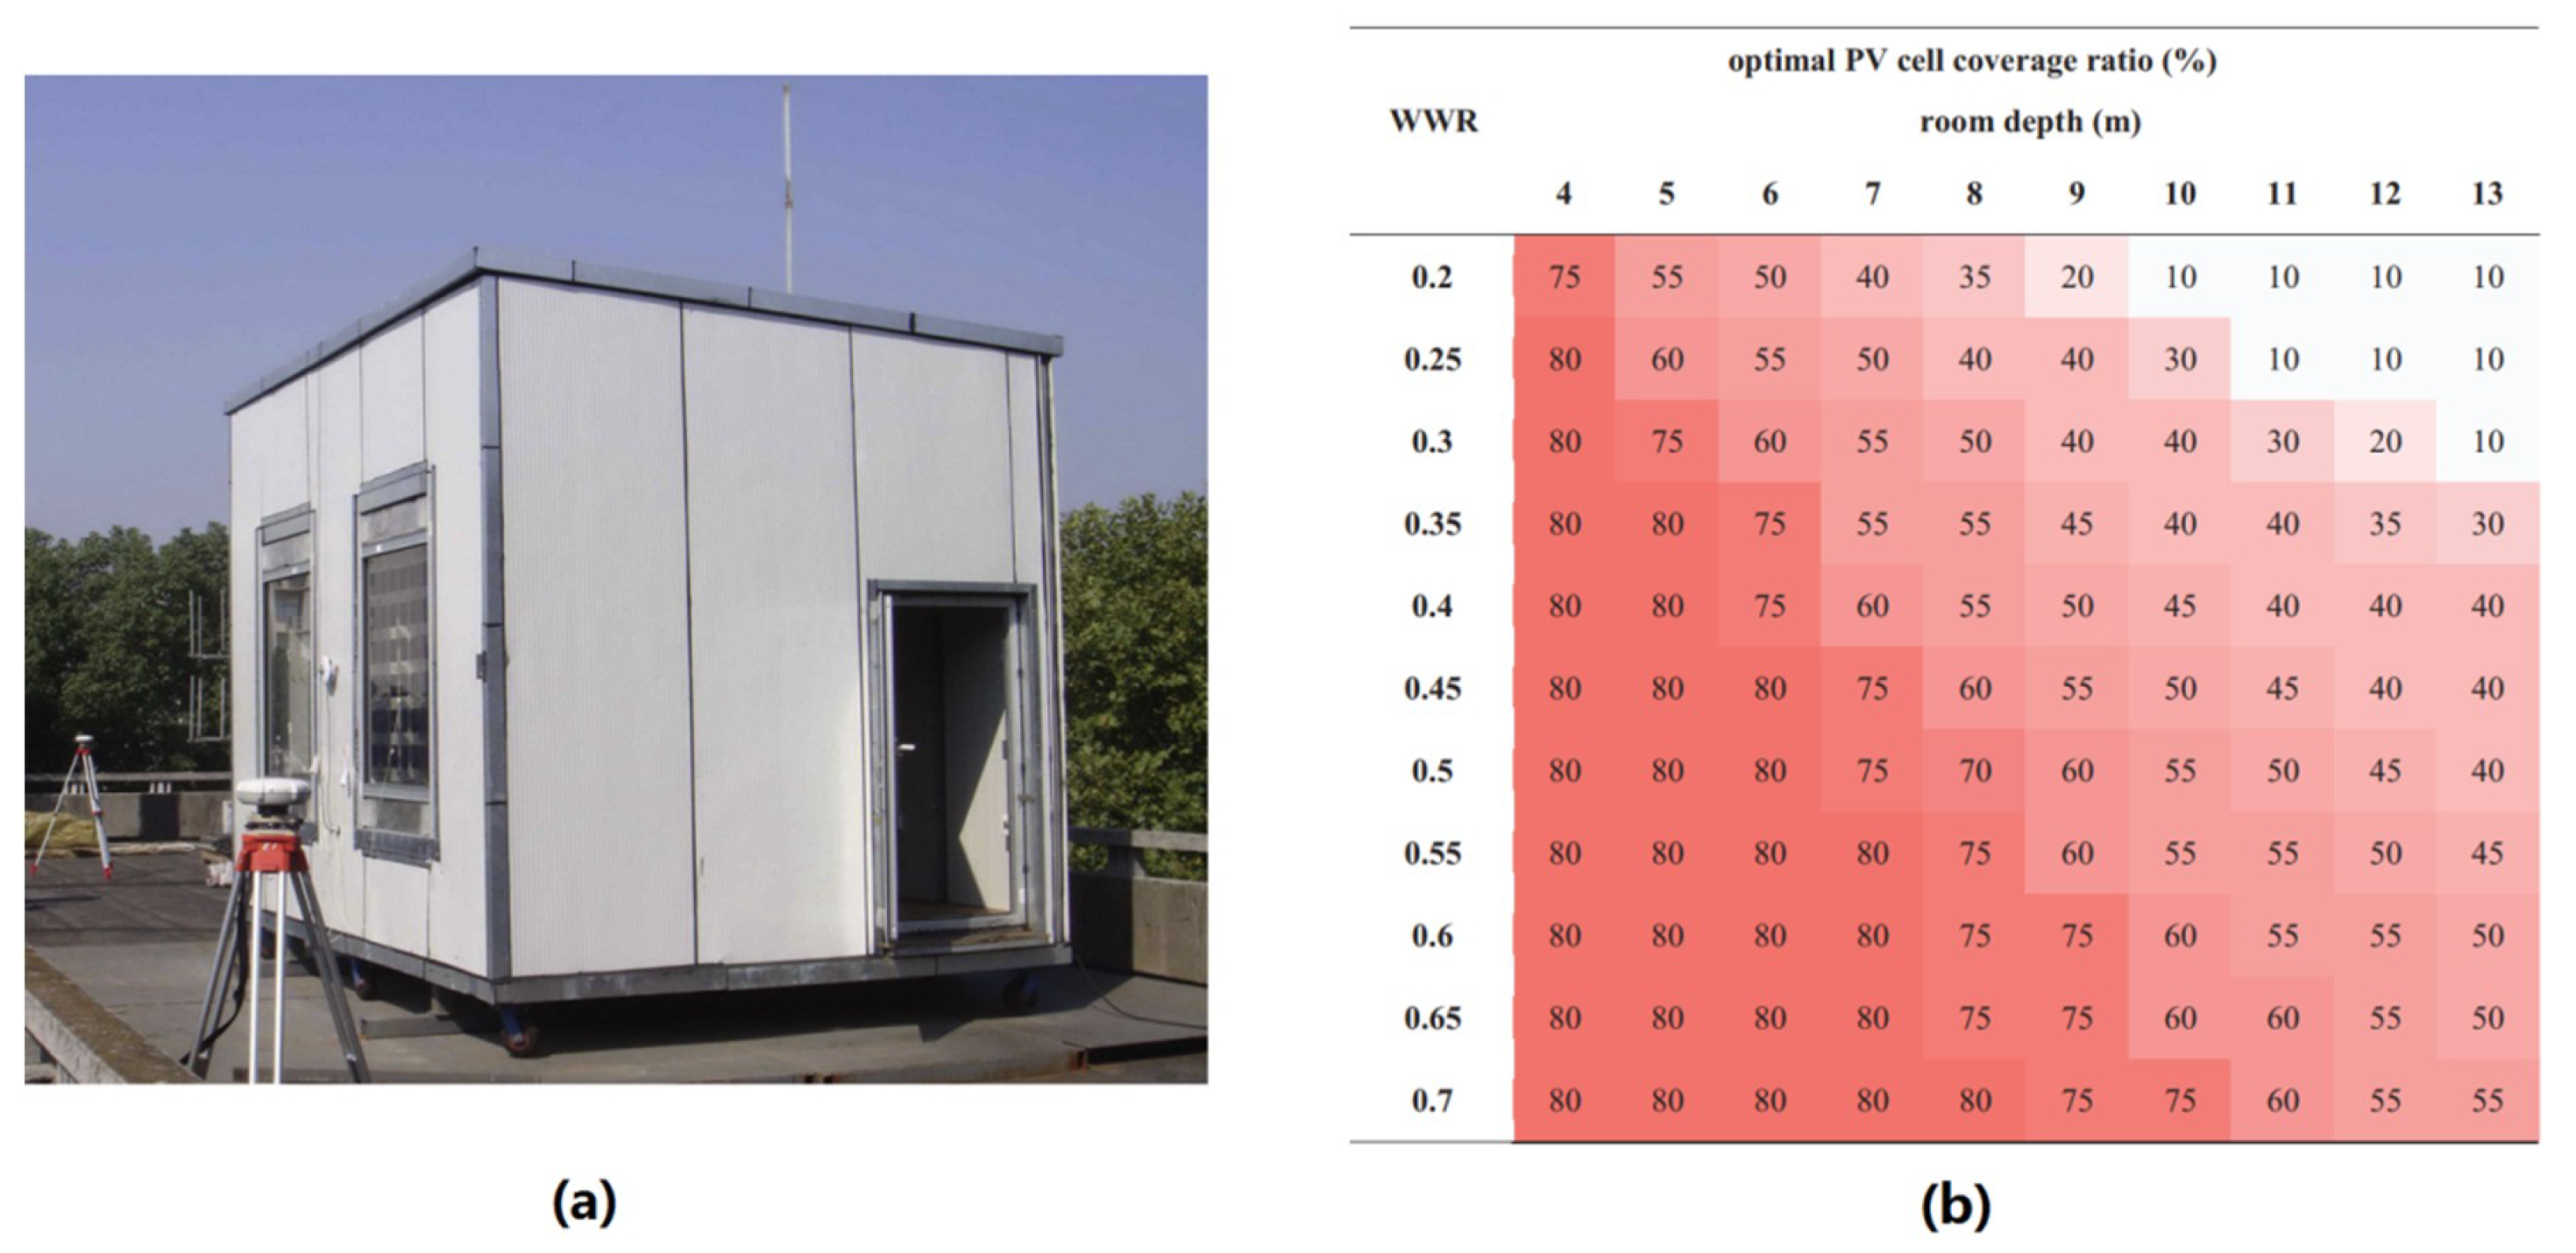
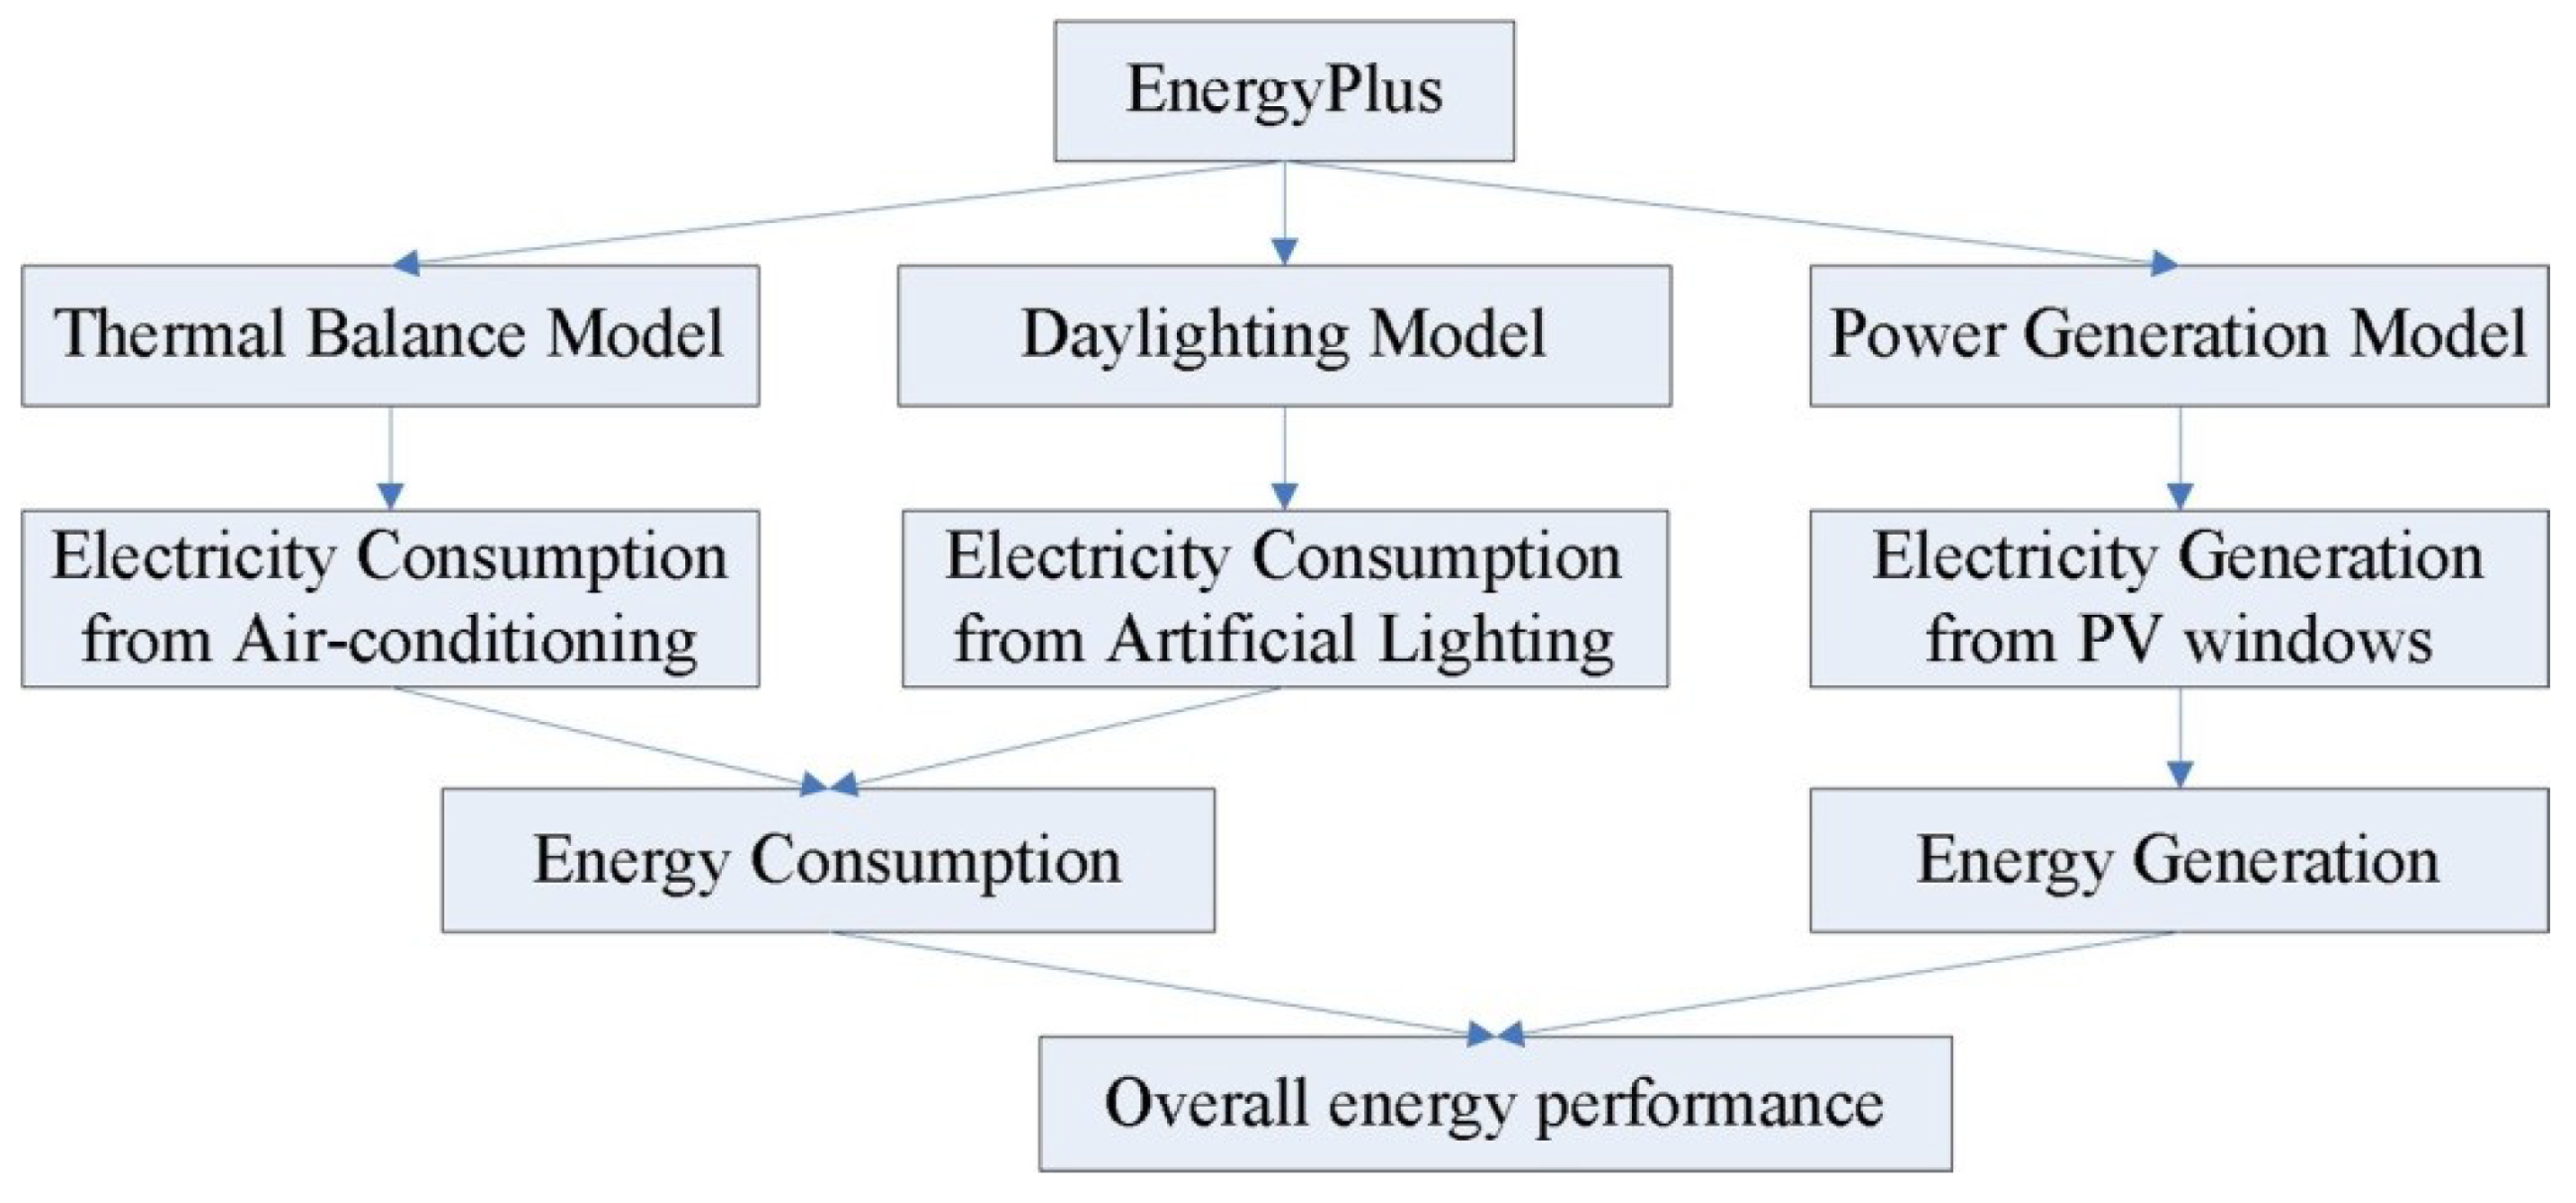
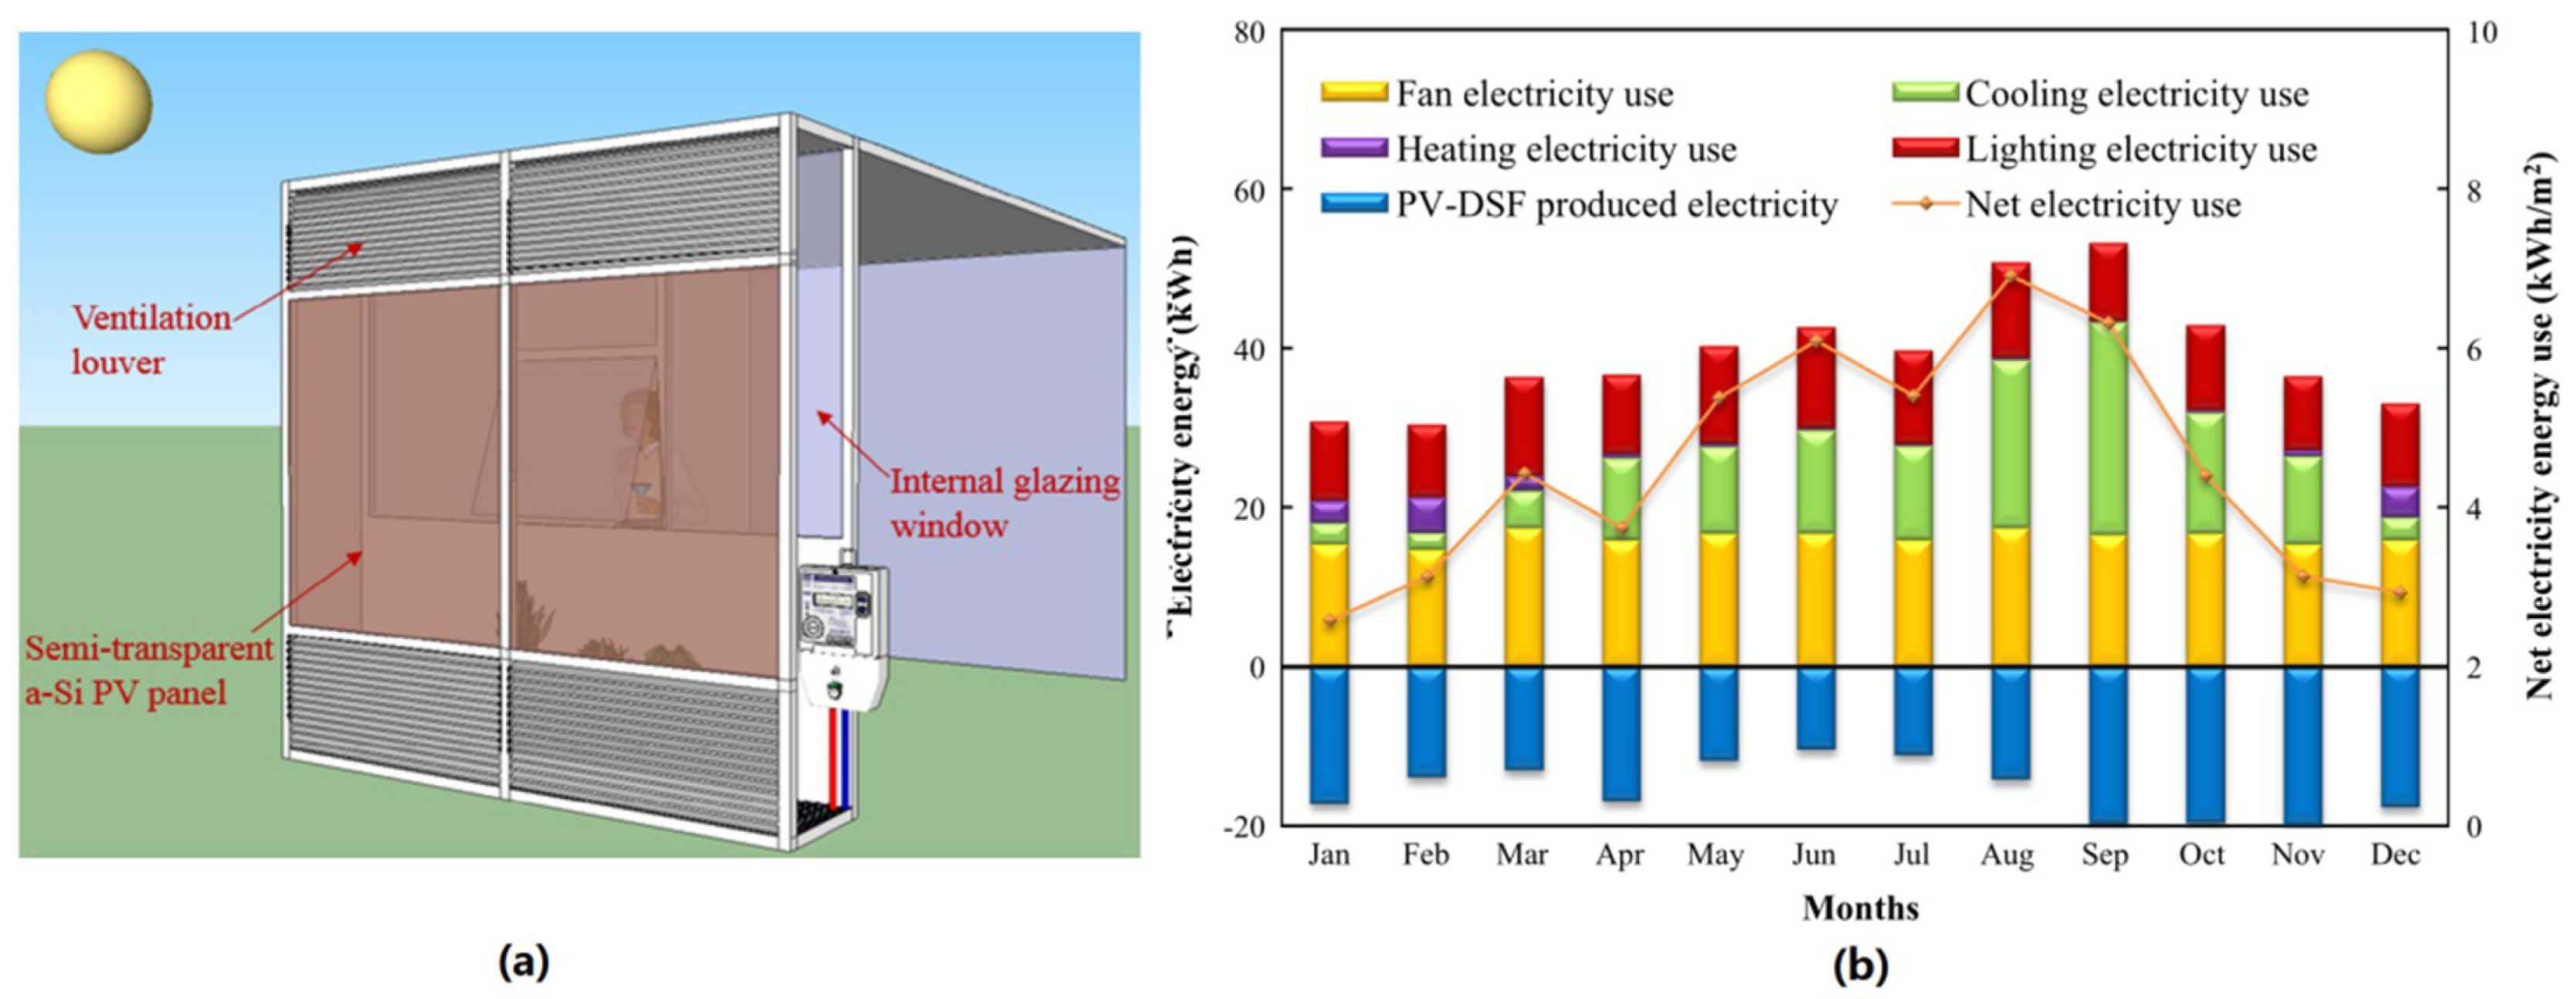
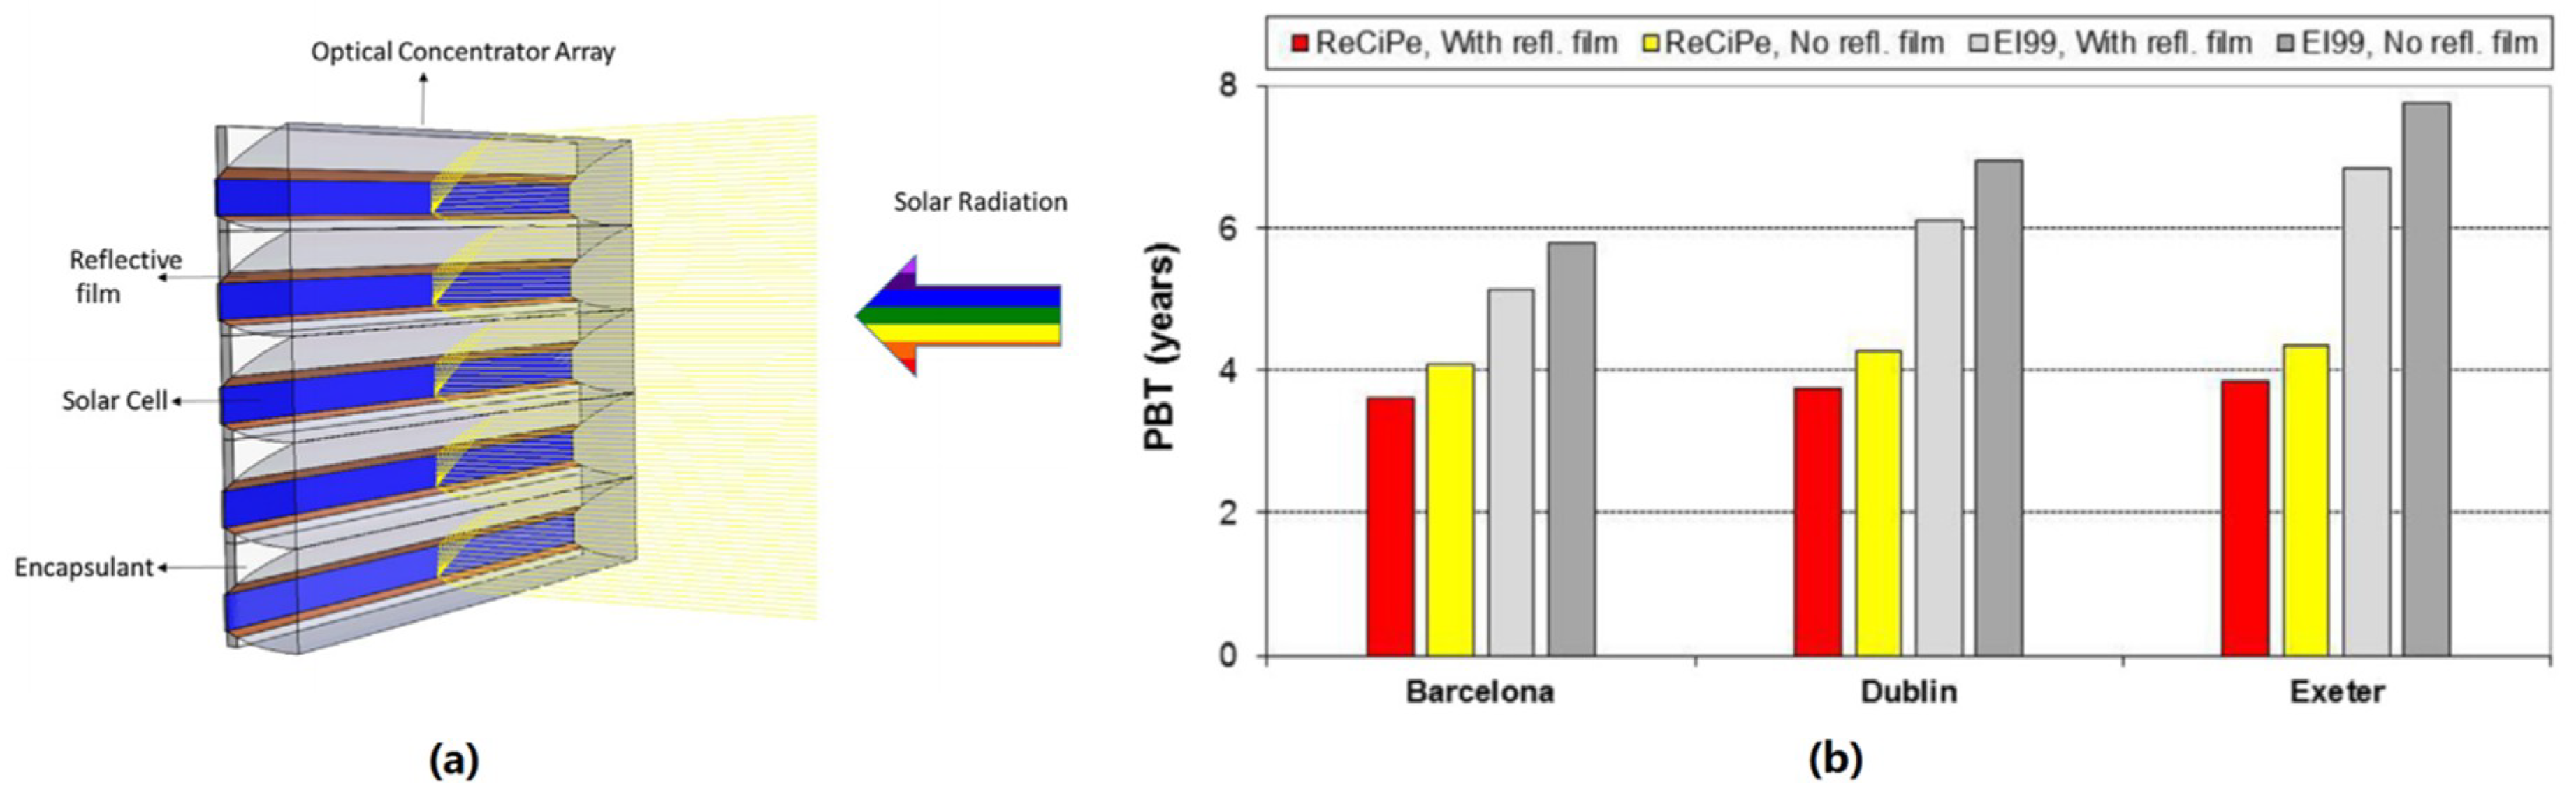
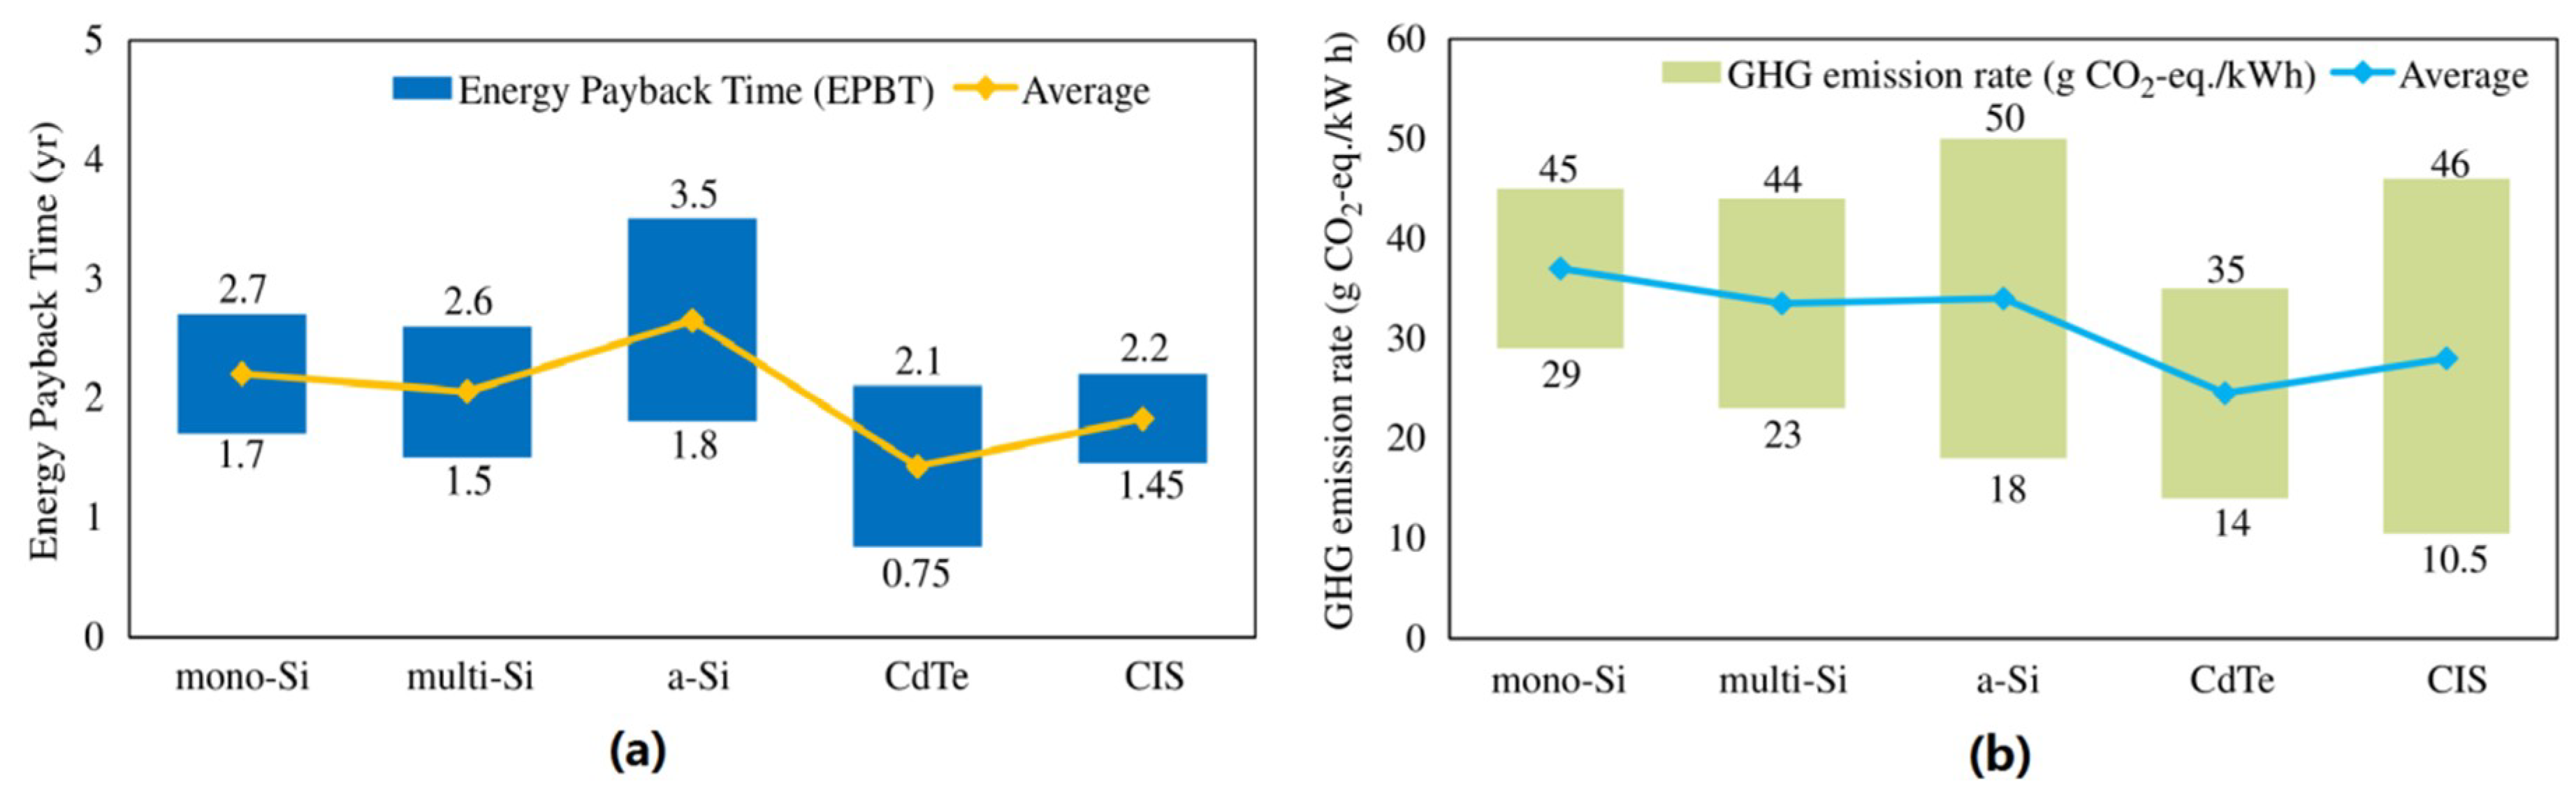
Table 1.
The global building-integrated photovoltaic (BIPV) market development and forecast from 2014 to 2020 (MW) [6].
Table 1.
The global building-integrated photovoltaic (BIPV) market development and forecast from 2014 to 2020 (MW) [6].
| Region/Country | 2014 | 2015 | 2016 | 2017 | 2018 | 2019 | 2020 | CAGR (%) |
|---|---|---|---|---|---|---|---|---|
| Asia/Pacific | 300 | 492 | 772 | 1159 | 1672 | 2329 | 3.134 | 47.8 |
| Europe | 650 | 967 | 1441 | 2103 | 2929 | 3807 | 4838 | 39.7 |
| USA | 319 | 476 | 675 | 917 | 1200 | 1491 | 1766 | 33.0 |
| Canada | 42 | 61 | 86 | 119 | 157 | 190 | 228 | 32.6 |
| Japan | 143 | 201 | 268 | 349 | 434 | 520 | 612 | 27.5 |
| Rest of world | 81 | 125 | 184 | 263 | 355 | 451 | 561 | 37.9 |
| Total (GW) | 1.5 | 2.3 | 3.4 | 4.9 | 6.7 | 8.8 | 11.1 |
Table 2.
The major research outcomes of the electrical performance of building-integrated photovoltaic (BIPV) systems.
Table 2.
The major research outcomes of the electrical performance of building-integrated photovoltaic (BIPV) systems.
| Authors | Module Type | Region | Objectives | Outcomes |
|---|---|---|---|---|
| Song [12] | a-Si | Korea | Studied the influential factors of PV electricity performance | South-facing PV module with a slope of 30° achieved the highest annual power performance |
| Yoon [13] | a-Si | Korea | Evaluated the long-term performance of a thin-film a-Si BIPV window | The optimized design can improve electricity production by 47% |
| Ng [1,4] | c-Si, a-Si | Singapore | Examined the overall performance of a semi-transparent BIPV system | The proposed system can be used in building components of all orientations |
| Park [15] | mc-Si | Korea | Investigated the electrical and thermal performance of a semi-transparent PV module | A 1 °C increase in the operating temperature of a c-Si PV module may result in power decreases of 0.48% and 0.52% |
| Yoon [16] | c-Si | Korea | Investigated the long-term surface temperature characteristics of a PV window | Inner surface temperature of PV window differs from that of normal windows |
| Fossa [17] | a-Si | - | Studied the influence of the cavity thickness on the performance | The thickness has a significant effect on the operating temperature and the efficiency |
| Gan [18] | - | - | Investigated the effect of an air gap on a PV module’s electrical performance | A 12–16 cm air gap could greatly reduce the overheating problem and increase the electricity generation. |
| Ritzen, M.J. [19] | mc-Si | Netherlands | Investigated the performances of ventilated and non-ventilated BIPV rooftops | The electricity production of a ventilated IPV rooftop was 2.6% higher than that of a non-ventilated rooftop |
| Charron, R. [20] | c-Si | Montreal | Found the optimized design to maximize the conversion efficiency | An optimized design can increase the efficiency by 80% |
| Tian, H. [21] | DSSC | - | Examined the influence factors of the I–V curve | Temperature and irradiance greatly impact the DSSC’s performance |
| Ordenes [22] | mc-Si, pc-Si, a-Si, CdTe, CIS | Brazil | Investigated the potential of BIPV potential in Brazil | For 30% of the running time, the electricity generation exceeds building’s demand |
Table 3.
Successful examples of newly developed large-scale building-integrated photovoltaic (BIPV) systems in China [23].
Table 3.
Successful examples of newly developed large-scale building-integrated photovoltaic (BIPV) systems in China [23].
| Project Name | Brief Introduction | |||||
|---|---|---|---|---|---|---|
| Site | Integration Mode | Panel Type | Active Area (m2) | PV Power (kWp) | Power Yield (MWh/year) | |
 Shandong Museum | Jinan, Shandong, China | Roof integrated | Poly-Si | 9500 | 450 | 560 |
 Capital Museum (China) | Beijing, China | Roof integrated | a-Si | 5000 | 300 | - |
 Qinghai science and Technology Museum | Xilin, Qinghai, China | Roof and façade integrated | Mono-Si | 1600 | 186.6 | 220 |
 Zhongnan international building materials market | Hangzhou, Zhejiang, China | Roof and façade integrated | Mono-Si | 1210 | 400 | 290 |
 China National Gymnasium | Beijing, China | Roof integrated and shadings | Mono-Si | 1000 | 102.5 | 97 |
 Suntech Eco Building | Wuxi, Jiangsu, China | Roof and façade integrated | Poly-Si | 6900 | 1010 | 1020 |
 Canton Tower | Guangzhou, Guangdong, China | Façade integrated | Thin-film | 1120 | 20 | 12.66 |
 Power Valley Plaza Business Conference Center | Baoding, Hebei, China | Roof and façade integrated | Poly-Si | - | 500 | 420 |
 Astronergy Manufacture Factory | Hangzhou, Zhejiang, China | Roof and façade integrated | Mono-Si, thin-film | - | 510 | 558.8 |
 Hangzhou East Railway Station | Hangzhou, Zhejiang, China | Roof integrated | Poly-Si | 79,000 | 10,000 | 10,000 |
 Weihai Public Cultural Center | Weihai, Shandong, China | Roof integrated | Thin-film | 7800 | 480 | 330 |
 Tianjin West Railway Station | Tianjin, China | Roof integrated | a-Si | 36,000 | 1884 | 2000 |
 Changsha cSCEc Building | Changsha, Hunan, China | Roof and façade integrated | Mono-Si, Poly-Si | - | 96.82 | 37.5 |
 Guangzhou South Railway Station | Guangzhou, Guangdong, China | Roof integrated | Mono-Si | 5016 | 253 | 260 |
 Beijing South Railway Station | Beijing, China | Roof integrated | CIGS | 7000 | 240 | 223.6 |
 Wuhan Railway Station | Wuhan, Hubei, China | Roof integrated | Mono-Si | 15,200 | 2200 | 2000 |
 Shenzhen International Landscape Flowers Exposition Park | Shenzhen, Guangdong, China | Roof integrated | Mono-Si, Poly-Si | 7660 | 1000 | 1000 |
 Nanjing South Railway Station | Nanjing, Jiangsu, China | Roof integrated | c-Si | 82,000 | 10,670 | 9230 |
 Shanghai Hongqiao Railway Station | Shanghai, China | Roof integrated | Poly-Si | 61,000 | 6688 | 6300 |
 Shenzhen North Railway Station | Shenzhen, Guangdong, China | Roof integrated | Mono-Si | 7896 | 501.4 | 537 |
Table 4.
The potential electricity generation capacity of building-integrated photovoltaics (BIPVs) for the selected countries of International Energy Agency (IEA) [25].
Table 4.
The potential electricity generation capacity of building-integrated photovoltaics (BIPVs) for the selected countries of International Energy Agency (IEA) [25].
| Country | Potential Area of Roofs (km2) | Potential Area of Façades (km2) | Potential of Roofs (TWh/year) | Potential of Façades (TWh/year) | Total Potential (TWh/year) | Actual Consumption (TWh) | Potential-Demand Ratio (%) |
|---|---|---|---|---|---|---|---|
| Australia | 422.5 | 158.34 | 68.176 | 15.881 | 84.057 | 182.24 | 46.1 |
| Austria | 139.62 | 52.36 | 15.197 | 3.528 | 18.725 | 53.93 | 34.7 |
| Canada | 963.54 | 361.33 | 118.708 | 33.054 | 151.762 | 495.31 | 30.6 |
| Denmark | 87.98 | 32.99 | 8.710 | 2.155 | 10.865 | 34.43 | 31.6 |
| Finland | 127.31 | 32.99 | 11.763 | 3.063 | 14.827 | 76.51 | 19.4 |
| Germany | 1295.92 | 485.97 | 128.296 | 31.745 | 160.040 | 531.64 | 30.1 |
| Italy | 763.53 | 286.32 | 103.077 | 23.827 | 126.904 | 282.01 | 45.0 |
| Japan | 966.38 | 362.39 | 117.416 | 29.456 | 146.872 | 1012.94 | 14.5 |
| Netherlands | 259.36 | 97.26 | 25.677 | 6.210 | 31.887 | 99.06 | 32.2 |
| Spain | 448.82 | 168.31 | 70.689 | 15.784 | 86.473 | 180.17 | 48.0 |
| Sweden | 218.77 | 82.04 | 21.177 | 5.515 | 26.692 | 137.12 | 19.5 |
| Switzerland | 138.22 | 51.83 | 15.044 | 3.367 | 18.410 | 53.17 | 34.6 |
| United Kingdom | 914.67 | 343.00 | 83.235 | 22.160 | 105.395 | 343.58 | 30.7 |
| United States | 10,096.26 | 3876.10 | 1662.349 | 418.312 | 2080.661 | 3602.63 | 57.8 |
Table 5.
The major research outcomes of the thermal performance of building-integrated photovoltaic (BIPV) systems.
Table 5.
The major research outcomes of the thermal performance of building-integrated photovoltaic (BIPV) systems.
| Authors | Module Type | Region | Objectives | Outcomes |
|---|---|---|---|---|
| Peng [28] | a-Si | Hong Kong | Evaluate the thermal property of a newly designed PV-DSF | The ventilated mode could minimize the solar heat gain among all the operation modes |
| Peng [29] | m-Si | Hong Kong | Investigate the thermal performance of a multi-layer PV façade | The PV façade performed the best in reducing the thermal loss |
| Yang [30] | c-Si | China | PV wall thermal performance in typical cities of China | The cooling load can be reduced by 33–50% with a PV wall |
| Ji [31] | a-Si, m-Si | Hong Kong | Test the transient thermal property of a PV wall system | The PV wall reduced the total heat gain by 53–59.2% during the summer period |
| Chow [32] | a-Si | Hong Kong | Investigate the performances of different PV glazed windows. | The air-conditioning load could be significantly reduced by PV windows |
| Chow [33] | a-Si | Hong Kong | Evaluate the cooling load reduction effect of ventilated PV windows | The PV window reduced the heat gain of an office by 28% |
| He [34] | a-Si | Hefei, China | Evaluate the benefits of a double-glazed PV window | The window system cut down the thermal load and had a lower inner surface temperature |
| Wang [35] | c-Si | Tianjin, China | Investigate the effects of PV roofs on a building’s heating and cooling loads | The PV roof with air-gap provides a higher power efficiency and lower cooling load |
| Fung [36] | mc-Si | Hong Kong | Investigate the thermal performance of semitransparent PV modules | The area and orientation of the solar cell greatly influenced the heat gain |
| Wong [37] | a-Si | Japan | Investigate the performance of semi-transparent PV roofs | A net energy savings of 3.0–8.7% were produced by the PV roof with a transparency of 50% |
| Han [38] | a-Si | Hong Kong | Find the thermal performance influential factors of a double-pane PV window | Radiative heat transfer can be reduced in the air cavity by a PV window with Low-E coating |
| Han [39] | a-Si | Hong Kong | Find the optimal thickness of the air cavity in a double glazed PV window | The air gap with a thickness between 6 and 8 cm achieves the best thermal performance |
Table 6.
The major research outcomes of the optical performance of semi-transparent building-integrated photovoltaic (BIPV) systems.
Table 6.
The major research outcomes of the optical performance of semi-transparent building-integrated photovoltaic (BIPV) systems.
| Authors | Module Type | Region | Objectives | Outcomes |
|---|---|---|---|---|
| Jiang [53] | c-Si | Hefei, China | Investigated the effect of PV cell coverage ratio on the performances of PV Trombe walls | A higher coverage ratio leads to a higher generation of electrical and a higher overall efficiency, but a lower indoor temperature and thermal efficiency |
| Miyazaki [44] | a-Si | Tokyo | Studied the performance influential factors of PV windows | PV windows with a transmittance of 40% and a window-to-wall ratio of 50% achieved the best overall performance |
| Yun [54] | c-Si | Stockholm, London, Madrid | Determined the optimal transparency by considering the room and depth-window-wall ratio | The optimal PV cell coverage ratio must be determined together with the window-to-wall ratio and room depth |
| Xu [55] | c-Si | Wuhan, China | Evaluated the optimal PV cell coverage ratio of BIPV façades | The PV cell coverage ratio greatly affects the performance. An optimal PV ratio reduces energy use by 13% |
| Yoon [56] | DSSC | - | Studied the effect of transmittance on the performance of DSSC | A higher module efficiency does not always bring a higher overall efficiency for the window |
| Kang [57] | DSSC | - | Investigate the optical performance of DSSC windows | TiO2 thickness greatly influences the transmittance and absorption, but the reflectance is not affected |
| López [58] | mc-Si a-Si CIS | Milan | Evaluated the daylighting and shading performance of PV windows | PV module integration reduces the daylighting perception, but the shading effect offers great potential in mitigating the overheating problem |
| Olivieri [59] | a-Si | Madrid | Evaluated the transparency of a PV module under different outdoor conditions | SHGC diversities occurred when the PV was located in different environmental conditions |
Table 7.
The research outcomes of the overall energy performance and energy-saving potential of BIPV systems.
Table 7.
The research outcomes of the overall energy performance and energy-saving potential of BIPV systems.
| Authors | Module Type | Region | Objectives | Outcomes |
|---|---|---|---|---|
| Lu [60] | a-Si | Hong Kong | Investigated the overall energy performance of a PV window | The proposed window was able to reduce the heat gain by 65% |
| Peng [65] | a-Si | Hong Kong | Examined the performances of a semi-transparent PV double-skin façade | Ventilated mode provides a higher electricity output and a lower solar heat gain, the non-ventilated mode provides a better thermal insulation performance |
| Peng [62] | a-Si | Berkeley | Investigated the overall energy performance of a PV-DSF | The proposed system was able to save the net electricity use by 50% |
| Wang [63] | a-Si | Hong Kong | Examined the overall performance of a new PV insulating glass unit | The energy-saving potentials of the new unit were 25.3% and 10.7% compared to a single clear glass window and a Low-E glass window |
| Wang [64] | a-Si | Hong Kong | Comparatively studied a PV-DSF and a PV insulating glass unit | The overall energy-saving potentials were 28.4% and 30% for the two PV systems |
| Zhang [61] | a-Si | Hong Kong | Compared the overall energy performance of an STPV window and energy-efficient window | An STPV window can save 18% and 16% of the electricity consumption per year |
| Bahaj [66] | a-Si | The Middle East | Evaluated the energy-saving potential of semitransparent BIPV systems | The system reduced the cooling load by 31% during a one-year operation |
| Radhi [67] | a-Si | United Arab Emirates | Investigated the energy performance of façade-integrated PV systems | Operational energy consumption was reduced by 1.1–2.2%. Energy payback time was able to be reduced by 10 years |
| Didone [68] | a-Si | Brazil | Investigated the daylighting and overall energy performance of different window systems | The PV window saves up to 43% of the energy use, providing the best overall energy performance among all the window systems |
| Miyazaki [44] | a-Si | Tokyo | Studied the key factors of a PV window’s performance | The optimal performance was obtained when the transmittance was 40% and the window-to-wall ratio was 50% |
| Ng [14] | c-Si, a-Si | Singapore | Studied the energy-saving potential of BIPV | An energy-saving potential of 16.7–41.3% was achieved with different BIPV technologies |
| Wong [37] | a-Si | Japan | Evaluated the overall performance of PV roofs | PV roofs produced net energy savings of 3.0–8.7% |
| Li [69] | a-Si | Hong Kong | Studied the influential parameters of PV systems | Thermal and optical performances of the PV systems contribute a major part to the overall energy performance |
| Chow [33] | a-Si | Hong Kong | Employed ESP-r to study the energy performance of different window systems | Proposed PV windows can reduce the annual cooling electricity consumption by 23% and 28% |
| Chow [32] | a-Si | Hong Kong | Investigated the energy-saving potential of ventilated PV glazing | Proposed PV windows were able to cut down the cooling load by 26% and 61% |
| Chow [70] | a-Si | Hong Kong | Studied the performances of different PV windows | Ventilated PV window with a transmittance of 0.45–0.55 saves the annual energy use by up to 55% |
| Olivieri [71] | a-Si | Madrid, Spain | Evaluated the performance of five semitransparent PV elements | Semitransparent solutions with a window-to-wall ratio larger than 33% saves the energy requirement by 18–59% |
| Liao [72] | a-Si | Wuhan, China | Compared the performances of PV glazing with three traditional glazings | See-through a-Si PV glazing showed a better energy performance than single and double glazing |
Table 8.
The research outcomes on the lifecycle assessment (LCA) of BIPV systems.
| Authors | Module Type | Region | Objectives | Outcomes |
|---|---|---|---|---|
| Lamnatou [75] | m-Si | Barcelona, Exeter, Dublin | Investigated the life-cycle property of a BICPV | The PBTs of the BICPV of different cities ranged between 3.6 to 7.8 years |
| Menoufi [76] | m-Si | Lleida, Spain | LCA study of a BICPV scheme at the University of Lleida | The environmental impact of a PV system is about 2.35 times the impact of the BICPV scheme |
| Ng [77] | -- | Singapore | Examined the environmental performance of semi-transparent BIPV modules | The EPBT and EROEI for the modules ranged from 0.68 to 1.98 and 11.72 to 34.49 |
| Li [78] | c-Si | 5 cities in China | Performed an LCA study for a novel aCPC-PV in China | The EPBTs of the aCPC-PV module are 2.82–4.74 years in the five cities in China |
| Bizzarri [79] | c-Si, thin-film | Ferrara, Italy | Investigated the energetic and environmental impact of a BIPV roof | The roof-integrated PV systems can bring both energy and environmental benefits |
| Lu [80] | m-Si | Hong Kong | Investigated the EPBT and GPBT of a rooftop BIPV system | The EPBT is 7.3 years and the GPBT is 5.2 years |
| Perez [81] | m-Si | New York | LCA for façade-integrated BIPV systems | The façade-integrated BIPV system has an EPBT of 3.8 years |
| Belussi [82] | a-Si | Bologna, Italy | Quantified the environmental impact of a ceramic BIPV module | The impact of the module takes on values comparable to conventional PV systems |
| Baumann [83] | m-Si | Toledo, Newcastle | Compared the impacts of a ground-based system and a BIPV system | The CO2 emissions were 88 t/GWh and 143 t/GWh, respectively |
| Hammond [84] | -- | Bath, UK | Studied the performance of a domestic BIPV system | The impacts from the production were offset by the electricity generation |
| Wu [85] | -- | Taiwan | Investigated the economic benefits of BIPV facilities | The BIPV façade reaches its breakeven point within 10 years of the payback period and 16 years |
| Jayathissa [86] | CIGS | ETH Honggerberg | Accessed the environmental impact of a dynamic and adaptive BIPV system | The environmental impact of the dynamic BIPV system is 50% higher than a static system |
| Agrawal [87] | m-Si, a-Si | New Delhi | Determined the energy, exergy, and life-cycle cost of a BIPV system | Energy and exergy efficiencies are found to be 33.54% and 7.13% |
| Tripathy [88] | m-Si | Cities in India | Performed the LCCA and EPBT of BIPV systems in India | The EPBT of the system was found to range between 7.30 years and 16.9 years |
Table 9.
The lifecycle assessment (LCA) results review of different types of PV modules.
| Investigator | Module Type | EPBT (year) | GHGE Rate (g CO2-eq./kWh) |
|---|---|---|---|
| Wilson and Young [96] | mono-Si | 7.4–12.1 | - |
| Peng et al. [89] | mono-Si | 1.7–2.7 | 29.0–45.0 |
| Kato and Murata [97] | mono-Si | 8.9 | 61 |
| Alsema and Wild-Scholten [98] | mono-Si | 2.6 | 41 |
| Alsema and Wild-Scholten [99] | mono-Si | 2.1 | 35 |
| Jungbluth and Dones [100] | mono-Si | 3.3 | - |
| Hammond et al. [90] | mono-Si | 4.5 | - |
| Wild-Scholten [101] | mono-Si | 1.75 | 30 |
| Ito and Komoto [102] | mono-Si | 2.5 | 50 |
| Lu and Yang [80] | mono-Si | 7.3 | - |
| Ito et al. [91] | mono-Si | 2.0–2.5 | 43.0–55.0 |
| Seng et al. [103] | mono-Si | 3.2–4.4 | - |
| Phylipsen and Alsema [104] | multi-Si | 2.7 | - |
| Kato and Murata [97] | multi-Si | 2.4 | 20 |
| Alsema [105] | multi-Si | 3.2 | 60 |
| Ito and Kato [106] | multi-Si | 1.7 | 12 |
| Battisti and Corrado [94] | multi-Si | 3.3 | - |
| Alsema and Wild- Scholten [99] | multi-Si | 1.9 | 32 |
| Pacca and Sivaraman [93] | multi-Si | 2.1 | 54.6 |
| Jungbluth and Dones [100] | multi-Si | 2.9 | - |
| Raugei and Bargigli [92] | multi-Si | 2.4 | 72 |
| Wild-Scholten [101] | multi-Si | 1.75 | 29 |
| Ito and Komoto [102] | multi-Si | 2.0 | 43 |
| Seng et al. [103] | multi-Si | 2.2–3.0 | - |
| Pacca et al. [93] | multi-Si | 7.5 | 72.4 |
| Jungbluth [107] | multi-Si | 3.0–6.0 | 39.0–110.0 |
| Lewis and Keoleian [108] | a-Si | 3.0 | - |
| Alsema [109] | a-Si | 3.2 | - |
| Alsema [105] | a-Si | 2.7 | 50 |
| Jungbluth and Dones [100] | a-Si | 3.1 | - |
| Pacca and Sivaraman [93] | a-Si | 3.2 | 34.3. |
| Ito and Kato [91] | a-Si | 2.5 | 15.6 |
| Wild-Scholten [100] | a-Si | 1.4 | 24 |
| Alsema [109] | CdTe | 3.2 | - |
| Kato [110] | CdTe | 1.7 | 14 |
| Fthenakis and Kim [111] | CdTe | 1.2 | 23.6 |
| Held and Ilg [95] | CdTe | 0.7–1.1 | 19.0–30.0 |
| Alsema and Wild-Scholten [99] | CdTe | 1.1 | 25 |
| Jungbluth and Dones [100] | CdTe | 2.5 | - |
| Raugei and Bargigli [92] | CdTe | 1.5 | 48 |
| Wild-Scholten [101] | CdTe | 0.84 | 16 |
| Fthenakis [112] | CdTe | 0.79 | 18 |
| Ito and Komoto [102] | CdTe | 2.1 | 50 |
| Alsema [105] | CdTe | 1.7 | 14.0 |
| Held [95] | CdTe | 0.7–1.1 | 19–30 |
| Jungbluth and Dones [100] | CIS | 2.9 | - |
| Raugei and Bargigli [92] | CIS | 2.8 | 95 |
| Ito and Kato [91] | CIS | 1.6 | 10.5 |
| Ito et al. [106] | CIS | 1.8 | 45.0 |
| Wild-Scholten [101] | CIS | 1.45 | 21 |
| Ito and Komoto [102] | CIS | 1.8 | 46 |
| Peng et al. [89] | Thin film | 0.75–3.5 | 10.5–50.0 |
| Seng et al. [103] | Thin film | 1.9–2.6 | - |
| Pacca et al. [93] | Thin film | 3.2 | 34.3 |
| Keoleian and Lewis [113] | Thin film | 3.39–5.52 | - |
© 2018 by the authors. Licensee MDPI, Basel, Switzerland. This article is an open access article distributed under the terms and conditions of the Creative Commons Attribution (CC BY) license (http://creativecommons.org/licenses/by/4.0/).
Share and Cite
MDPI and ACS Style
Zhang, T.; Wang, M.; Yang, H. A Review of the Energy Performance and Life-Cycle Assessment of Building-Integrated Photovoltaic (BIPV) Systems. Energies 2018, 11, 3157. https://doi.org/10.3390/en11113157
AMA Style
Zhang T, Wang M, Yang H. A Review of the Energy Performance and Life-Cycle Assessment of Building-Integrated Photovoltaic (BIPV) Systems. Energies. 2018; 11(11):3157. https://doi.org/10.3390/en11113157
Chicago/Turabian StyleZhang, Tiantian, Meng Wang, and Hongxing Yang. 2018. "A Review of the Energy Performance and Life-Cycle Assessment of Building-Integrated Photovoltaic (BIPV) Systems" Energies 11, no. 11: 3157. https://doi.org/10.3390/en11113157
Note that from the first issue of 2016, this journal uses article numbers instead of page numbers. See further details here.