Integrated Daylighting Design by Combining Passive Method with DaySim in a Classroom

1
SUSB Centre, Hanyang University, Gyeonggi-do 15588, Korea
2
School of Architecture, Hanyang University, Gyeonggi-do 15588, Korea
*
Author to whom correspondence should be addressed.
Energies 2018, 11(11), 3168; https://doi.org/10.3390/en11113168
Submission received: 5 October 2018
/
Revised: 12 November 2018
/
Accepted: 12 November 2018
/
Published: 15 November 2018
Abstract
:This paper suggests a daylighting design method by combining a passive approach and advanced software to design external shading devices for daylighting in a classroom. A simplified method to predict and assess the indoor natural illuminance is a prerequisite for designers to design schools with better performance. Recently there has been growing demand for school refurbishment; mainly environmental improvement of classrooms in Korea. However, the passive approach of design has been neglected while the use of advanced simulation software has increased, requiring additional time and cost. Combining passive design methods with up-to-date numerical simulation is explored with shading devices to verify the daylighting distribution and daylight autonomy in classrooms with different orientations and shading forms. Weather tool Autodesk Ecotect, for the shading coefficient, and DaySim software (v3.0), for daylight autonomy, were adopted for the initial and the detail design stage, respectively. The findings support the linked design approaches of passive and advanced software would benefit designers in the strategic design process with further potential for design options and lighting electricity reduction.
1. Introduction
Daylight should always be considered carefully as it can provide both visual and thermal comfort, in particular within a classroom in a school. This fact justifies why there is a continuous demand to optimise daylight, such as its intensity, direction, distribution, and creation of shadow, which have a direct and indirect influence on human physiology and psychology [1]. In Korea, large glazing areas are normally found in most schools that provide good view-out and overall well-amount of daylight. This vast area of glazing, however, has a trade-off: it can cause glare problems throughout the year and overheat in summer due to a considerable amount of incident direct and diffuse solar radiation. Shading devices are normally found in mid-latitude cities and can play an important role in controlling incident solar radiation [2,3]; they can also be found frequently in the traditional architecture of Korea. Some traditional building elements regarding solar radiation are coming back to the building façade because of a green policy of the Korean government. There is incentivisation and regulation of the daylight indoor and illuminance levels of a school, which encourages designers to use natural daylight as the primary source of illuminance indoor. Besides, overheating needs to be considered as the main discomfort in summer, which also can be controlled by shading devices [4,5].
This research is to reveal effective façade design methodology (e.g., shading) through numerical case studies by exploring daylighting levels in a classroom in combination with different types of canopy attached to the classroom. Canopies, the most common type of shading device, need to be explored at the initial design stage to control heat and daylight as an extended roof and/or detachable window/door in traditional architecture in Korea [6]. Achieving good quality daylighting is essential in schools in order to reduce energy demand for lighting as well as to enhance student satisfaction leading to better student performance [7], it also has effects on biological functions such as hormones, regulating the day–night cycles and the student’s concentration capacity [8].
Performance of natural light has reportedly shown various positive effects such as increase in work efficiency, reduction of absenteeism, an increase in sales rates of commercial buildings, and higher grades [9]. With this kind of expectation, the Korean government has invested school for refurbishment and upgraded building regulation for the new construction. However, most upgrading facilities tend to focus on minimising energy consumption rather than responding to the nature of the surroundings. Indoor daylighting conditions and visual comfort are both achieved by replacing fluorescent ceiling lights with LED lights, achieving energy savings. Recently designers tend to leave facility-related things that are about energy and comfort to the engineers as the benefits of the design take a while to become apparent. This kind of an engineering-oriented attitude furthers the distance between designers and engineers without efforts being made to reach an understanding. Besides, in education, it not easy to teach students a holistic design approach as there is a lack of connected courses between designers and engineers in the process of design. Nature responsive approaches and environmentally friendly design can be achieved by a combination of engineering and passive architecture [10]. Kirimtat and Manzan [11,12] showed good examples of optimisation of the shading devices through simulation and indicated that the importance of shading devices could provide a good way of avoiding glare and also reduce the cooling load in summer. Ghosh and Norton evaluated heat gain and loss can be controlled by different static and dynamic transparent glazing systems for large glazed applications [13]. Also, avoiding glare is a critical role of glazing device controlling incident solar radiation such as switchable glazing with transparency [14].
This approach supports the importance of passive design with which optimal design can be achieved in combination with engineering. Developing an integrated passive design method can, therefore, accomplish functional facade design and the use of the traditional and innovative method can provide wise solutions by manipulating advanced daylight simulation tools [15,16]. External shading devices are reported as a simple, economical, and effective solution to manage incoming natural light. Diverse solutions for shading design have been studied by many researchers with a long history for cities and buildings. Baker and Littlefair researched daylighting studies with shadings based on the passive methods [17,18]. The use of a sun-path diagram in stereograph has been emphasised by Olgyay, Oh, and Kenlasek [19,20,21]. However, most studies in the field of façade design have only focused either on passive design or engineering points of view. Therefore, an integrated approach is required for the right direction of architecture design.
The objective of the research is to develop a methodology to combine a passive shading method for the initial design stage with a numerical simulation for the detail design. This study introduces the background knowledge of daylighting researches and then methodology with definitions (information) of terms and the simulation scope. Daylighting simulations by Daysim and the Weather tool will be simulated and analysed according to the suggested loop design process. Numerical simulations are implemented with the dynamic daylight sky conditions which has different skies with times to evaluate annual daylighting performance. The results are presented, identifying the interactive approach of passive with advanced software. It would eventually help to develop a methodology to regulate classroom illuminance distribution for visual comfort and minimise electricity for light with shading designs.
2. Background Knowledge
Passive design needs to take advantage of the local climate, especially solar radiation, for illuminance enhancement. Therefore, as a passive approach, building shading design is critical to maximise indoor visual comfort and to reduce building energy consumption by controlling the amount of incident solar radiation [22]. Of the various design techniques for green buildings, natural light has not been considered of much importance. Mostly, there is a lack of consideration of natural light as a passive concept; though it is the basis of eco-friendly building design. For instance, using a curtain wall to construct the entire exterior of the building with a glass window meets minimum standards, but it is difficult to adapt to the indoor visual comfort and energy consumption in the recent climate changes.
Most analysis tools are developed for standalone usage, not for cooperative or supplementary work, even though there is a limit for users to understand the whole design process to optimise energy of the building or daylighting, etc. Optimising the external shading can be obscured unless designers understand what the building (or client) needs and how to approach. Understanding the whole process of environmental architecture enables designers to manipulate suitable software at each stage. However, there has been little research conducted to show the combined method from passive concept to an advanced software simulation for the external shading design in an integrated process.
Recent fast-growing software for environmental analysis requires designers to understand and learn new technical skills. It sometimes leads to architects (designers) understanding software mainly composed of numbers without sufficient knowledge of software. Also, expert or well-informed software specialists are required to handle the software professionally, which causes extra time and cost. On the other side, using a passive design suggests some advantages: In the passive design process, designers would be able to predict the environmental performance of the building based on empirical intuition, which helps recent weather calculation present a precise shading mask and solar path from local weather data. Education effect is also available as passive approaches are typically illustrated with a graphic that is easy to understand. Experience with nature on a daily, monthly, and yearly basis would be beneficial to learners to understand nature-friendly design according to the flow of nature (i.e., the movement of the sun). The passive approach can be summarised as being direct and clear. The solutions would come from the climate through one’s empirical evidence when one feels comfortable, when it is cold/hot and if an individual’s eyes feel comfortable during the day, and so forth. The hypothesis can be drawn as that the integrated use of passive design and advanced software would help to design a building to enhance the efficiency of building performance with response to the climate.
Regarding the regulations of lighting for illuminance and visual comfort in classrooms, there are limited documents available in charge of regulation of school design, in particular, classroom environment. Recent software (e.g., DaySim, IES, Radiance, etc.) considers the dynamics of sky conditions for the whole year, enabling the calculation of possible savings when using daylight as the source of lighting in different locations and surroundings. The standard of illuminance for the school classroom is specified in Korean Industrial Standard (KS A 3011-1993) [23]. According to this rule, the school building classifies the illuminance from A to K according to the type of activity and specifies the illuminance range with each minimum-standard-maximum illuminance value. In the case of the school classroom, the activity type is classified as “Items relating to the performance of start-ups of general objects or small objects”, and the minimum allowable illuminance is defined as 300 lux, the standard illuminance as 400 lux, and the maximum allowable illuminance as 600 lux. It was also found that the Chartered Institution of Building Services Engineers (CIBSE) in the UK similarly defines the classroom standards as 300 lux and laboratory as 500 lux. The International Commission on Illumination (CIE) suggests limiting by 700 lux for indoor learning for learning & writing [24]. Useful daylight illuminance (UDI) as a modification of Daylight Autonomy is extensively used to evaluate daylight performance, providing full credit only to values ranged between 100 lux and 2000 lux [25].
In recent years, the use of computers has become a necessity throughout the field of construction. Through Building Information Modelling (BIM), all information of architecture is efficiently managed, and it is possible to evaluate the structure, schedule, materials, cost, and energy of various buildings. It is also applicable to the design process through simulation of various eco-friendly building elements. However, in addition to the design process, it is not easy to assess the light environment immediately through eco-simulation. First, it takes time to acquire software, requires expert knowledge, and a large amount of data input. It will take much time to evaluate and analyse the design. These problems hinder the use of architects in natural light during the initial design phase. In particular, the existing RADIANCE, DaySim, etc., are difficult to apply at the design stage and especially to architects at the beginning due to the nature of the natural light analysis program.
3. Methodology
3.1. Simulation Strategy
Recently, many calculation methods have been developed to support engineers and designers to optimise visual comfort and improve energy performance in developing the design. Depending on the complexity and end users, the packages range from simple computations with static sky conditions and average climatic data to advanced computation using dynamic sky conditions based on hourly weather data. The daylighting design in a classroom follows a schematic flowchart shown in Figure 1. It needs to consider the passive approach as a critical initial part of the whole design process and then a detailed simulation with advanced software.
The schematic flowchart shows the linked work process of designing shading devices in a building which conjoined for the optimal environmental analysis. The designer or client suggests the initial concept of the building according to the program in a school. Designers would be able to start a passive design (i.e., sun-path, orientation, etc.) with the design concepts and agreed-upon strategy [26]. With simple configuration and drawing with sun-path, designers or engineers can simulate the initial numerical models with advanced software, DaySim [27]. If the simulation result does not cope with the initial concept, designers will go back to the previous stage for further passive study. In this looped process, different types of shading or orientation can be optimised with quick response from the numerical models simulated on hourly meteorological data throughout the whole year. This process would be repeated until the simulation results satisfy both designers and regulations.
Ecotect software will be used at the stage of passive design for the simple 3D modelling and sun-path diagram. The Shading Coefficient (SC) is also calculated according to the solar shading and orientation. For the verification of solar radiation, Daylight Autonomy (DA), and Daylight Saturation Percentage (DSP) are selected as an illuminance index calculated with DaySim. Simulated data can be transferred to Autodesk Ecotect for visualisation which helps to understand clearly. Through the stages will it show detailed control of solar radiation by shadings would provide a great potential to minimise visual discomfort and electricity. It supports maximising the use of natural light for the indoor environment through mixed design methods. Therefore, this study shows the process of environmental design including the loop: optimising external shading design by controlling the amount of daylight.
The illuminance level on the working plane has to be no less than 300 lux in the teaching area according to Korea regulation. In order to maintain the minimum requirement, a sophisticated adjustment needs to be made to the shading device adjacent to the classroom to maximise daylighting levels throughout the year. There are tools that can be used to predict the daylight factor or light transmittance, usually by using simple algorithms, which have a quantitative output. Such tools include Ecotect and Radiance which use ray-tracing techniques to model the behaviour of light and can produce highly quantitative data but also realistic images.
3.2. Shading Mask
The first step for efficient environmental design is a shading mask for passive solar design. It can help to appreciate solar access into the building and the site. Shading mask mapped over a sun-path diagram will help designers determine strategies to control daylight and heat gain. Therefore, shading mask diagrams are useful resourceful tools to determine solar access, which is a starting point to understand site and climate. As a representation of the sky viewed from a reference point, a shading mask indicates the portion of the sky that is visible and obstructed: more access to sky means more admission to daylight. Through sun-path diagrams and shading masks the impact of these solar controls can be demonstrated graphically, which makes the shading mask diagram an efficient tool to solve problems with the visual process and to comprehend nature in the designing passive solar buildings. Shading masks can be generated once CAD models of the site are available using the Weather tool from Autodesk Ecotect. The masks can be calculated with accuracy which leads to fast and straightforward shading design while considering surroundings. As described by Marsh (2005), shading masks allow for detailed shading information to be stored between simulations and should ideally be done in a format that other tools can view, edit, or even generate. Also, Ecotect can multiply the shading percentage of this surface by the amount of solar radiation, depending on the position and the environment. This shading mask helps to calculate a more realistic estimate of the amount of solar radiation that the surface would receive. Generating the total solar radiation on a surface uses a cumulative sky, in which solar radiation through each segment is aggregated over time and then multiplied by incidence angle and shading factors [28,29]. The result of the calculation is represented by SC (Shading Coefficient), which is the ratio of solar radiation that is allowed on the surface. The higher the SC, the more solar radiation is allowed on the surface (as it nears the value of 1.0, equal to clear glass).
3.3. DaySim
DaySim (Dynamic daylight simulations) is a daylight analysis software package that calculates the annual daylight availability in a building as well as the energy use of automated lighting controls (occupancy sensors and photocells) compared to standard on/off switches. DaySim, hereafter, combines the raytracing software Radiance with a daylight coefficients approach, which enables accurate calculations to be made. The underlying sky model used by DaySim to calculate annual illuminance profiles is the Perez all weather sky model [30]. One of the main advantages of a dynamic daylight simulation, DaySim can calculate annual illuminance/luminance profiles which are used for daylight performance: daylight factor, daylight autonomy, electric lighting use, etc.
Concerning daylight in the classrooms, minimum illuminance values are established, and the daylight autonomy (DA) metric is incorporated, which defines the minimum DA percentages for the integration of daylight as a design variable [31]. During the environmental process, an iterative process between passive and advanced simulation would be practical to evaluate the feasibility of the design concept. The main concern shown by the numerical study was that where blinds were used in a classroom, it is likely to increase the electric lighting due to the visual discomfort unless there are shading devices attached to window area. Daylight autonomy (DA) on grids in the classroom can be displayed according to the percentage of daylight availability and Daylight Saturation Percentage (DSP), values at above or below specific numbers calculated, will be explored with the data of DA. Dynamic sky conditions with hourly data will provide close to models of the real-world construction either new construction or refurbishment of existing buildings [32].
4. Simulations
4.1. Simulation Model
The aim of this research is to manipulate fixed types of the canopy for numerical simulations with vertical and horizontal shading: the most common shading device. For the design process, a shading mask is reviewed as a passive method, and DaySim software is deployed for an advanced simulation to review different shading options. Mainly one side-lighting situation is chosen to evaluate the daylighting levels in a typical classroom. Different orientations (South and West) and shading devices (horizontal and vertical canopy) are explored for the daylighting analysis along with a passive design approach.
The classroom is selected is standard size for a primary and a secondary school; daylighting is mostly concerned with students’ performance and comfort by providing adequate illuminance levels. The classroom is composed of a single zone with 8.1 m deep, 8.4 m wide, and 2.6 m high as shown in Figure 2. The classroom is assumed to be occupied by 25 pupils and necessary equipment (a projector, a desktop, and a laser printer) in a classroom. The reflectance of ceiling, wall, and floor are set at 0.7, 0.5, and 0.3 (as seen in Table 1), respectively, while the illuminance of the desk is set to the threshold of 300 lux as the minimum requirement for illuminance. Two orientations (South and West), frequently found directions, were selected for the simulations; direction can be adjusted by Ecotect as illustrated in Figure 3. Horizontal and vertical shading devices are applied in separate form and also in combined form like an egg crate; these will be compared regarding daylighting performance. The internal illuminance in the classroom needs to be above 300 lux, the minimum threshold recommended in the School Design Guidelines of the Korean School Association. DaySim software uses the threshold of 300 lux for the daylighting autonomy.
A 49.5% glazing ratio (window to wall) is applied on the main wall while the relatively small size of corridor window (0.7 × 7.2 m) is located on the other side of the classroom. There is limited illuminance at the opposite of the window in the classroom during the daytime mainly caused by diffuse light from the corridor sides facing north and east directions.
Seoul in Korea chosen for the numerical simulation is located in the mid-latitude temperate climatic zone, and the four seasons are distinct. In summer, the average temperature in summer reaches at 23.6 degrees with high humidity while the average temperature stays as low as 0.5 degrees in winter. There is constant direct solar radiation throughout the year, which has potential for use for indoor lighting and thermal energy in winter.
4.2. Passive Design: Shading Coefficient (SC)
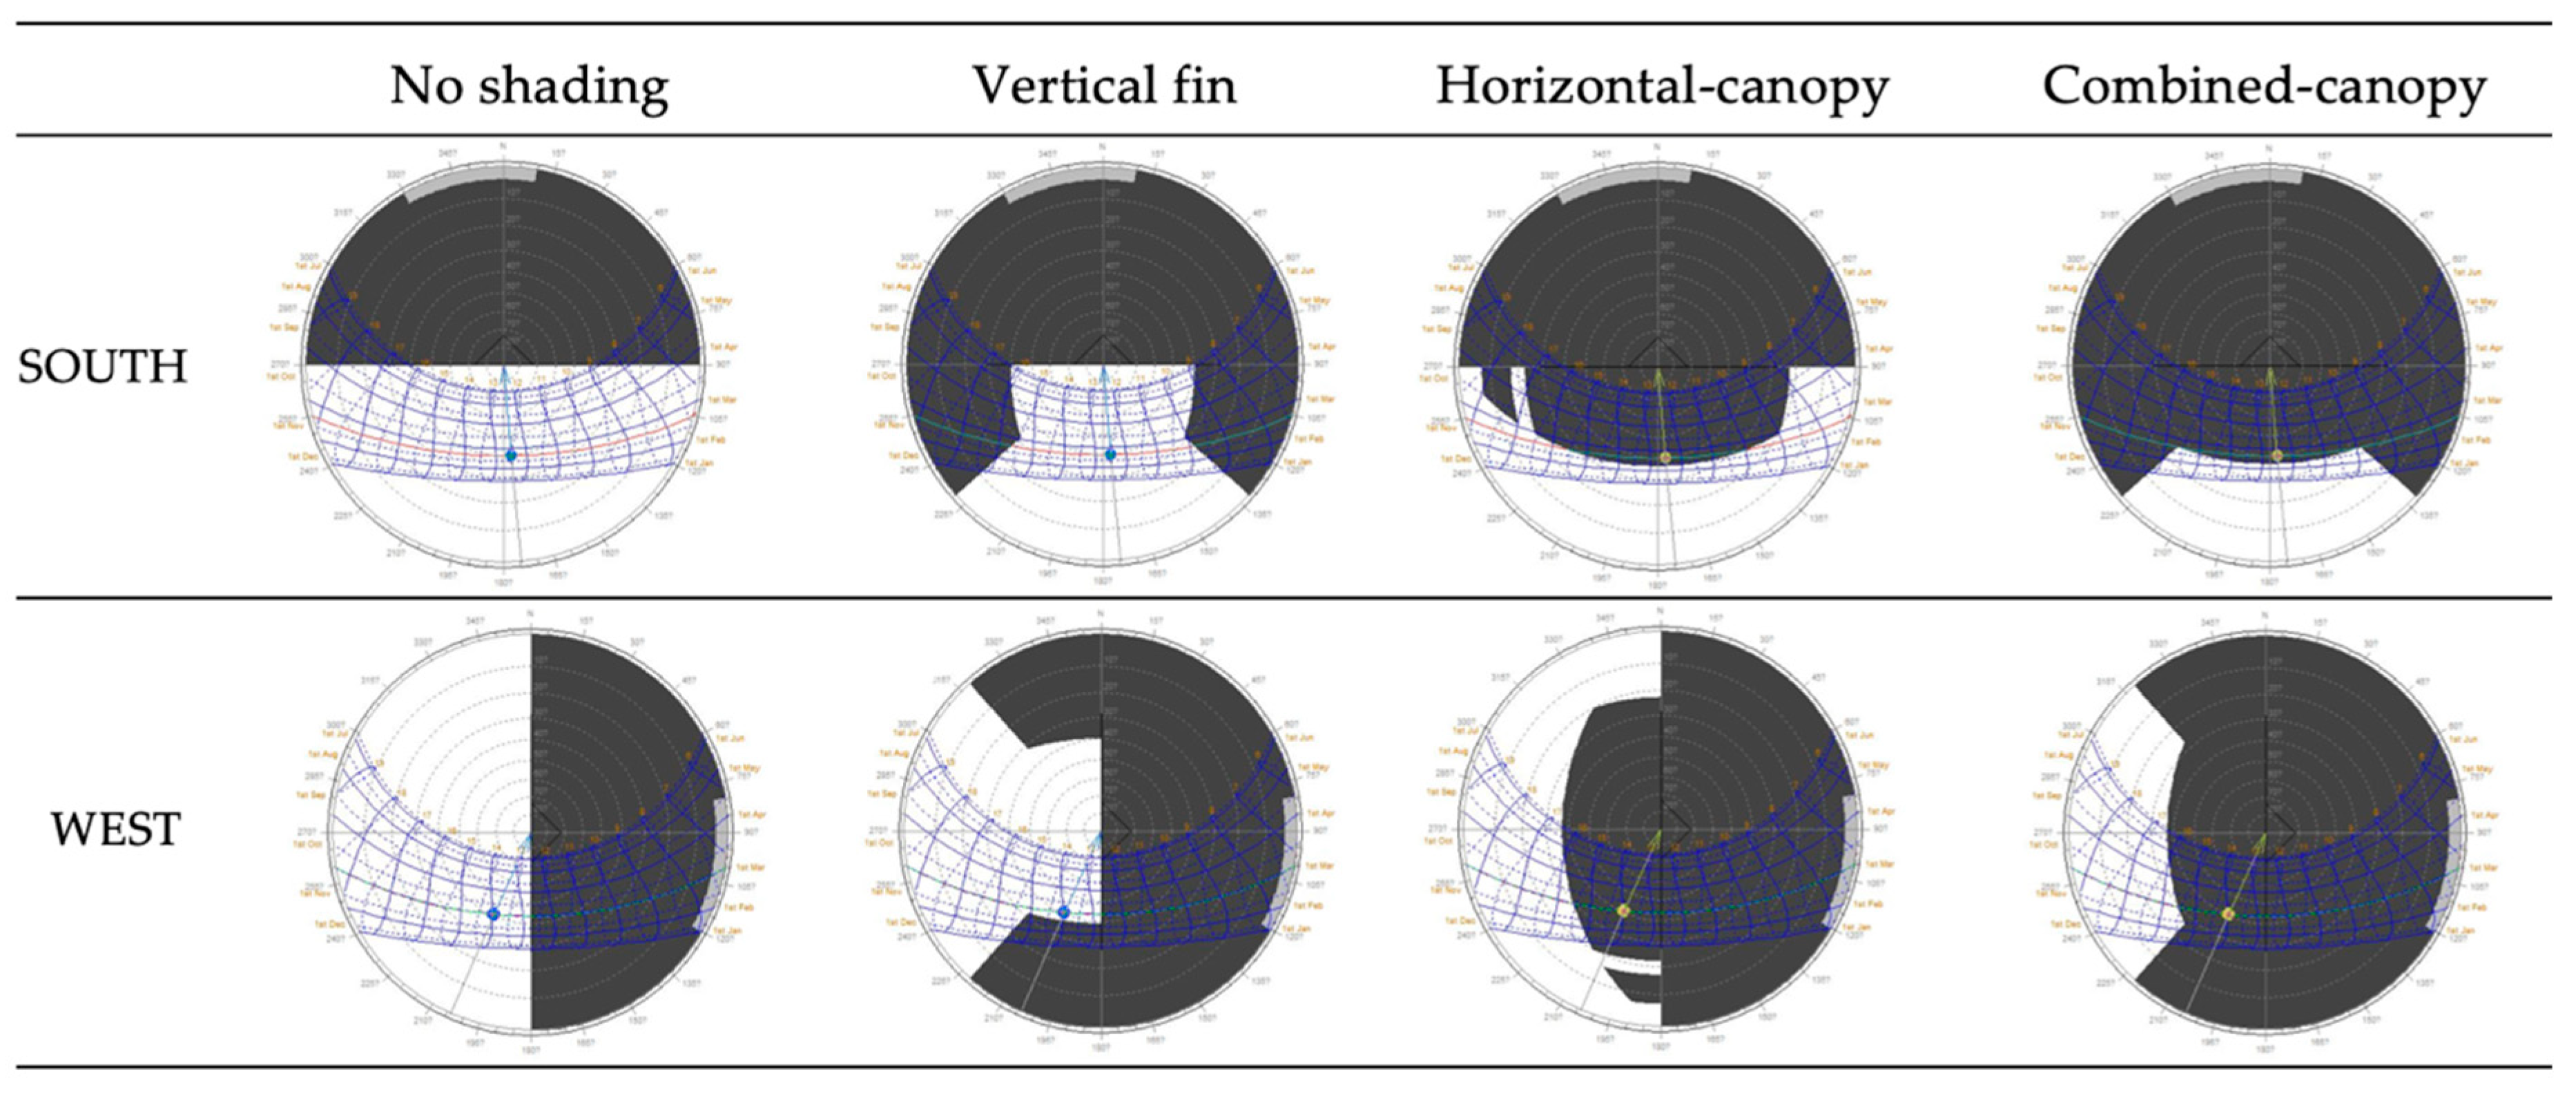
External shading design (device) can be calculated using shading masks, which store the shading percentage at a track of sky angles, overlaid on the sun-path diagram. As shown in Figure 4, direct solar radiation can be plotted whether the point in the middle of the selected plane is shaded or not. It clearly shows the relation between the sun’s movement and the shading device. For the window area, the value of solar penetration was calculated at different times of year, and it accounts for 0 to 100 per cent of the variation. The position of the Sun plays a definite role in determining how to direct the solar beam onto the selected surface at the required date and time. Therefore, the percentage of the shade in the object is stored in the stereographic diagram represented as a bright colour for more solar radiation gain than that filtered by the surrounding conditions and external shadings. Incident direct solar radiation can be estimated on the selected element. The shading area coloured in black and the unshaded area in white show where the beam can reach over the sun-path as tabulated in Figure 4. It helps to understand effectively how the surrounding condition (i.e., buildings, trees, and orientation) would influence shading by the direct solar radiation. Cases of no shading and vertical fin show there is almost no obstacle for direct solar radiation to reach in the middle of the window during daytime. The horizontal canopy protects direct solar radiation during the daytime, and early/late sunlight is allowed to come through when facing south. The depth of the canopy can have an impact on the control of sunlight during daytime. When west-facing, sunlight comes through mostly in the afternoon while the horizontal canopy performs well between 12 p.m. and 3 p.m. Besides, vertical fins would be practical later in the day to protect the low angle of the solar beam. As a part of starting the passive design, designers would be able to get an intuitive idea of the shading device and solar radiation though there is some difference in the solar position between the middle of the window and edge.
For the detailed analysis of shading coefficient, various shading devices with different sizes are suggested to reveal their performance for the shading mask as shown in Table 2, Table 3 and Table 4. Horizontal, vertical, and combined shading devices with the same area of 3.6 m2 are tested with south and west directions. The shading coefficient is calculated with the Weather tool from Ecotect. Shading mask can calculate either direct beam or diffuse light or both in the mixed calculation of shading percentage. The position of the sun is evaluated at each date and time, which provides an azimuth and altitude value and then data can be used to locate a specific cell in the mask. Each cell stores the percentage of the object that is in the shade from the angle. From this shading percentage, an exposure value is calculated and then multiplied by the beam component. Naturally, the larger shading areas reduce exposing percentage of the glazing area. It shows direct ratio in both the south and west directions as illustrated in Figure 5 and Figure 6. More light can come through in the south-oriented classroom in any shading shape, which is why most buildings are generally encouraged with facing south in Korea. It is helpful to compare the shading coefficient of three fins and three canopies as they have the same area of 3.6 m2. When facing south, the three fins perform with 57.5% (44.3% in summer and 68.8% in winter) and the three canopies perform with 39% (8.7% in summer and 69.8% in winter). From the annual average performance, SC of three fins shows 18.5% more daylighting penetration than horizontal ones. However, there is a huge difference in summer.
The horizontal canopy with three blades shows 35.6% more protection from solar radiation, which is a very critical factor to avoid solar radiation in summer in the climate of Korea. Though the similar result is found in both vertical and horizontal cases in winter, horizontal canopy performs well in the facing south. In the case of facing west, the three fins show 39.7% (46.2% in summer and 31.9% in winter) and the three canopies show 27.5% (25.6% in summer and 29% in winter). There is not much difference overall between vertical and horizontal though 20.6% more penetration can be found in the vertical fins. Some ideas can be drawn from the SC graphs. In general, SC is directly proportional to the area of shading as shown in Figure 5 and Figure 6. Horizontal canopies perform well in summer in the facing south. In the case of facing west vertical fins performs well in winter while horizontal and vertical ones show similar performance in winter.
SC is useful to analyse with separation of the season, summer and winter. Korea has four distinctive seasons: spring (March–May), summer (June–August), autumn (September–November), and winter (December–February). It is therefore critical to block direct sunlight in summer and allows it in winter. SC can be visualised on the stereograph with sun-path for the performance in different season, which is one of the vital functions. The shading coefficient (%) with horizon canopy and vertical fins decreases gradually along with the numbers of canopies or fins throughout the year. The rate of declination is steeper when facing south than when facing west, which found in both horizontal and vertical shadings.
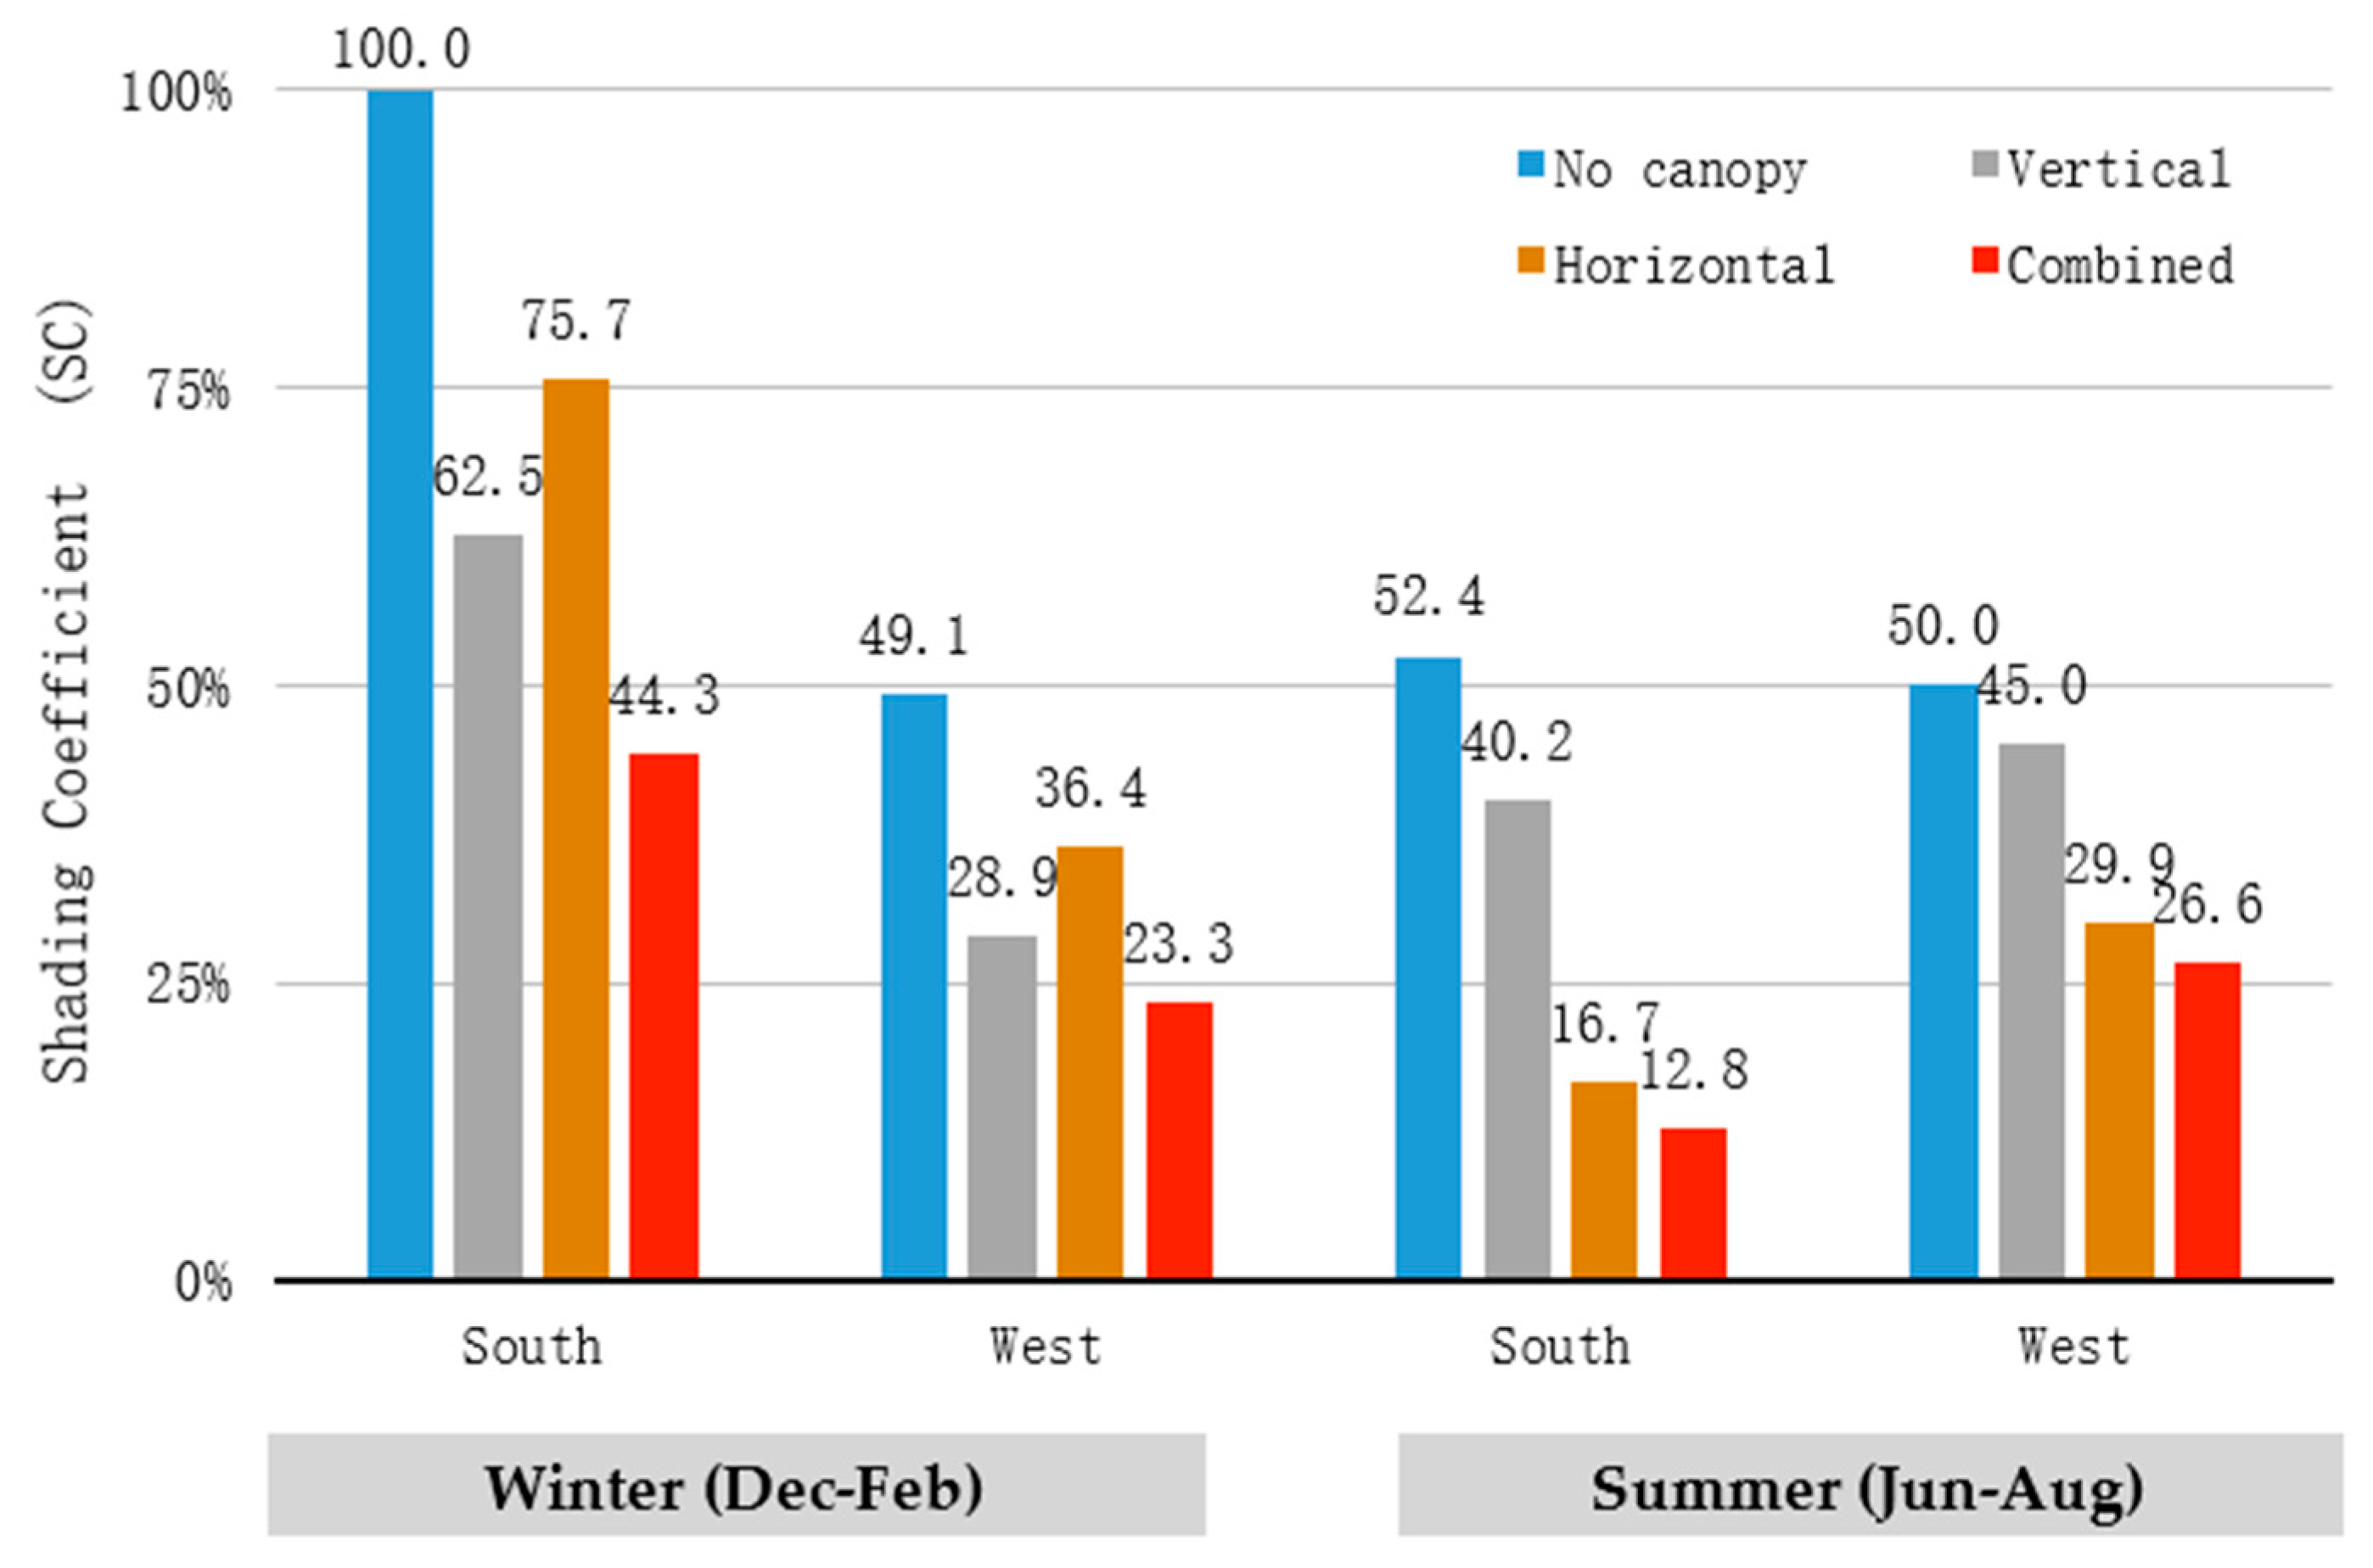
That is because there is more incident solar radiation in the south in the northern hemisphere and total areas of shadings work proportionally to block diffused and direct solar radiation. For the in-depth analysis, it is useful to break down the simulation data in summer and winter separately as displayed in Figure 7. The annual performance of the shading device can help reveal what type of shading device is a better fit for the different directions of the classroom than the other shapes. In winter, allowing sunlight into the indoor has been considered as an essential factor to warm up inside in the cold period, while forbidding unwanted solar radiation in summer. This control is also profoundly related to visual comfort in seasons.
The south facing classroom with a horizontal canopy in winter has 75.7% of the highest lighting penetration and 62.5% with vertical fins and 44.3% with composite canopy. It proves that the horizontal canopy performs 13.2% better than that of the vertical shading and 31.4% more solar radiation than that of composite shading in winter in the facing south. Similarly, the west-facing classroom shows similar performance orders: horizontal canopy with 36.4%, vertical fins with 28.9%, and composite shading with 23.3% of solar penetration rate. It shows that the horizontal canopy performs 7.5% better than a vertical fin, which is an unexpected result though the difference is a little. It can be different in the different designs of vertical fins. From the simulation, the horizontal canopy is suitable for the south and west direction in winter from December to February.
On the other hand, it is essential to forbid unwanted sunlight in order to minimise cooling energy in summer. Based on the strategy, it is required to minimise shading coefficient as much as possible. Overly, horizon and composite canopies perform well in both directions compared with vertical shading. Only 16.7% of SC is for the south, and 29.9% of SC for the west is implemented with a horizontal canopy in summer. The use of horizontal canopy in summer can efficiently block solar radiation with an improvement of 23.5% for the south and 15.1% for the west in comparison with the performance of vertical shading. The composite canopy also performs well with 12.8% for the south and 26.6% for the west, which has a slightly better achievement than with horizontal canopy. Regarding annual performance, the composite canopy works best in summer, but it shows the lowest solar penetration in winter as well where heat gains are needed. For the performance throughout the year, horizontal canopy shows its best ability to deal with solar radiation.
Internal lighting spread can influence the visual comfort of the student which may shut blinds to stop incoming direct sunlight. Therefore it is vital to maintaining uniformity of the illuminance distribution on the indoor work surface. SC calculation does not cover this issue of sunlight distribution, but the internal rending of solar tracing can provide views of spreading condition. In order to identify sunlight distribution, internal illuminance levels in the classroom are calculated with different shading devices on midday with the sun on 21 September as tabulated in Figure 8. Internal reflectances (albedo) are set as 0.3 for the floor, 0.5 for wall, and 0.7 for the ceiling as well as 0.2 for outdoor ground. The rendered images in Figure 8 show the nearer the window area, the more intensity of sunlight is observed, which may cause to glare for students. It leads users typically to use a blind to keep solar beams from penetrating the classroom to avoid glare problems. Besides, it forwards to turn on electric lights to cover daylight shortage causing by blocking daylight during the daytime. In the south-facing classroom, the horizontal canopy can block explicitly at noon as shown in Figure 8c. Composite shading also works well, but it also blocks diffused light, which makes the other side of the classroom dark as illustrated in Figure 8e. The case of the vertical device in Figure 8g shows there is little shading toward the south as like one with no shading device in Figure 8a. It seems solar radiation is coming in parallel with the shading device. From the solar tracing renders, horizontal canopy blocks well direct solar radiation in the south-facing classroom.
Composite shading in Figure 8f, in the case of the west-facing classroom, shows the most sunlight blocked at 3 p.m., while it provides low illuminance levels less than 150 lux the other side of the classroom. At the setting time for simulation is 3 p.m. that is selected for the west sunlight in the afternoon which increases heating problem in summer and draws sunlight deeply into the classroom. Given that shown illustration in Figure 8, a classroom with the horizon and one with vertical shading represent a similar amount of solar penetration at 3 p.m. on 21 September. One of the advantages to render with contour lines of illuminance can clarify with visual how much illuminance is spread at the internal space and also how much is affected by the shading.
This simple internal rendering gives ideas horizontal shading is adequate for the south-facing classroom and also horizontal and vertical canopy are both the excellent solution of shading for each classroom. However, since it shows the momentary light penetration at a particular time, there is a limit to understanding the overall light performance. Therefore, it is critical to verify passive design with advanced software as a continuous step of passive design. Empirical and vernacular architecture would be helpful to approach sophisticatedly for environmentally sustainable design. This approach can minimise trial and error process for a building to adapt itself with the climate before running it in advanced simulation for the decision of detail element design. It is useful to adopt DSM (Dynamic Software Modelling), i.e., DaySim, to check in detail for the distribution of light throughout the year.
4.3. Dynamic Simulation Method: DaySim
Advanced software, DaySim, for measuring illuminance on a surface is explored in order to provide in-detailed illuminance condition of the classroom. DaySim is adopted for DSM (Dynamic Simulation Modelling), validated as a radiance-based daylighting analysis software, and allows to simulate lighting levels with every 5 min and provides accurate results.
Daylight Autonomy (DA), as an illuminance index, shows the values of which data forms the basis of the lighting analysis. The figures are illustrated according to the frequency (%) above the threshold of 300 lux, which can help to understand daylighting performance in the classroom. The results calculated using DaySim Software are tabulated in Table 5. The colours ranged with ten stages indicated frequency of the occupied hours over the year during daytime (08:00–17:00). The classroom without canopy facing south has the highest daylight autonomy of 87.9% in average which means daylight can light the classroom with above 300 lux for 87.9% of the school hours (08:00–17:00 with an hour lunch break) without artificial lights. The west-facing classroom with combined shading shows the lowest DA of 80% which indicates artificial lights would be used for around 20% of school hours, which would lead to increase light energy consumption. However, DA is calculated only above a certain illuminance level without considering for the excess lighting amount, which would cause glare problem. Therefore, the method of using an average of DA may lead to misunderstanding of the illuminance quality in the classroom. For example, if there is direct sunlight near the window of the wall, it would be adding to the average of DA though it may cause glare problem. This is why not much difference of DA between different shading devices as shown in Table 5. DSP (Daylight Saturation Percentage) is suggested to review the quality of the light considering the might-glare problem.
Daylight Saturation Percentage (DSP) is calculated with illuminance ranges between 430 lux (40 footcandles) and 4300 lux (400 footcandles). Besides, the grid point is deducted from the grid point annual values by penalising when the values are above 4300 lux. Using the modified data, DSP can be perceived as a realistic figure to reflect the illuminance conditions in the classroom, which is the most merit to figure out the useful daylighting distribution. Classroom facing south with horizontal canopy achieves average daylight autonomy of 64.1% which is the best performer, while classroom with no canopy shows the least one with an average of 54.9%. It is caused by the exclusion of the excess lighting above 4300 lux which mostly found at near windows. In the case of west-facing classroom, vertical shading shows the best device to respond to the sun by permitting adequate daylight to get through the façade as shown in Table 6. The results also show horizontal canopy facing west plays a similar function with the vertical shading. The difference is only 1.1% which may be different with the size of canopy and distance between them. DSP illustrated in the plan is helpful to understand the way of lighting spread and where the weakest area in the classroom.
From the simulation as seen in Table 6, DSP ranged from 48.3 to 65%, the different levels are rendered by colours. Shortage of light (blue colour) is caused by using blind to protect from the excess light, here above 4300 lux. In order to overcome this shortage, designers can, for example, propose a sophisticated solar reflector to redirect solar radiation into the inner side of the classroom while keeping from sunlight, which creates light to spread widely and uniformly throughout the classroom. However, this paper needs to focus on the methodology of design, and so detailed shading design will be left for further research.
As seen the simulation results, developed software such as DaySim can calculate the quantity of illuminance by DA (Daylight Autonomy) and lighting quality by DSP (Daylight Saturation Percentage). All of them are represented by an average percentage which helps to understand the impact of the quality of light.
4.4. Analysis
This study has reviewed how shading proposal as a part of façade design can be decided through the associated method of passive design and advanced software. It is therefore essential to understand the difference among daylighting indexes tested in this research, which helps to use the index at each design stage. The comparison of the index is illustrated in Figure 9 which reveals characteristics of the values and should be used correctly to evaluate indoor lighting levels. DA (Daylight Autonomy), DSP (Daylight Saturation Percentage), and SC (Shading Coefficient) are compared with a bar graph to show the difference value. SC drops steeply that is caused by the area of the shadings throughout the year. Shading performance, therefore, needs to configure in seasons which is more practical to figure out shading performance as reviewed in Figure 7. DA value shows decrease gradually, not steeply, as the value is calculated with an average in the classroom. The high value of DA can be found in the near window, though the brightness does not help for the visual comfort of the student, which increases the average value of DA in the classroom. It means DA value should be considered for the quality of daylighting, not for the quantity. In order to reveal daylight quality, illuminance in DSP ranged between 430 and 4300 lux is presented in which daylight is regarded as useful for users.
SC and DA show similar patterns of performance in the different shading devices while DSP represents the different way in the same shadings. SC and DA are calculated generally regardless of the amount of daylight. Therefore, the physical shading area is the only factor to influence the amount of daylight. DSP, however, is useful to determine what shading canopy implements better than other shapes of shading. The horizontal canopy in the south-facing façade performs the highest average of 64% among other shadings. It means proper daylighting levels ranged from 430 lux to 4300 lux can be maintained in the classroom with an average of 64% over the year. Also, 55% of DSP with no canopy, 57% of DSP with vertical fins, and 58% of DSP with the composite canopy are followed. It supports horizontal canopy is useful to provide useful daylight indoor in the south-facing classroom. SC (Shading Coefficient) varies between 26% and 53% for both south- and west-facing classrooms, while in the advanced software (i.e., DaySim), the DA ranges between 80% to 88%. Both metrics move proportionally in annual performance. For the westerly direction, both vertical and horizontal shadings performed best at 61% and 60%, respectively, while composite shading shows 48% of DSP. Approximately 60% of the occupied time meets appropriate daylighting levels with the vertical fins. However, it is not enough to explain fully for DA to support the vertical fin in the west-facing façade as DA shows the only the quantity of daylighting, not for the glaring risk. DA provides a basis of the illuminance analysis with which electric lighting energy savings, for example, can be estimated DSP can claim which shading shapes are appropriate in each direction with an accurate simulation. From the seasonal analysis of SC, as a passive method, vertical fins show better performance to allow more useful daylight to reach indoor in the west-facing classroom. It supports passive design at the initial stage is vital to provide general ideas of the site and to design according to the environment. The intuitive design process and relatively short feedback time can save time and provide designers with more potential of design with a solid base for the next design process working with engineers.
5. Discussion
In view of the comparison of daylight index with SC, DA, and DSP, it was found that estimating the lighting environment should be considered with combined approaches of passive and advanced software. The suggested method will help designers to understand nature in more depth and to find a reasonable design solution as well as to save time and cost. Recently, there are fast-growing simulation tools which are relatively easy to use for designers even though designers are sometimes hard to understand the environment factors, such as the solar path, orientation, surrounding conditions, etc. In order to manipulate advanced software, the understanding of passive elements is essential. Therefore, using shading mask as a part of the passive approach plays a vital role in understanding sun movement and the quantity of solar radiation. Through DaySim, it becomes explicit to choose what types of shading device can be useful to protect solar radiation in summer and to draw sunlight in winter as it needs to be considered equally from the aspect of thermal performance. The integrated method by looping daylighting analysis provides an opportunity for designers and students to design a building effectively. The passive approach should be applied at the early phase of design in order to quantify dimensional characteristics of shading devices and understand the environmental nature of the surroundings. In order to estimate environmental data for the optimal daylighting in a classroom SC (Shading Coefficient) is essential to understand the solar path of a classroom as a simple tool for a quick assessment of the solar radiation in the window surface. It is calculated with Autodesk Ecotect representing by stereograph diagram mapping with solar-path throughout the year based on the hourly weather data of Seoul. Variables of the design are tested with two orientations (south and west) and different shapes of shading canopies (without, vertical, horizontal, and composite canopy). The process reveals how to decide shading design through the iterative process between passive method and advanced software. In the passive design, the seasonal analysis also enables to look into shading performance in depth in that summer and winter season are harsh environmental conditions to minimise energy demand in Korea. Protection in summer and permission in winter of solar radiation are key for an effective environmental design process.
Once done in the passive design stage, more detailed simulation with the connection process can be performed to show which design factors are critical. This stage does not stand alone and should be a continuous process with information from the passive design stage.
6. Conclusions
This study has provided an optimal design process for efficient and effective building performance. As there is a growing demand for refurbishment for a better environment in schools in Korea, the study proposes a combined environmental design method by providing a numerical study of canopy design in a school. Combining the method of passive approach and advanced software is suggested through the continuous steps including a looping process between passive design and advanced software, which helps to seek the optimal design device in a classroom.
Given the current situation, this research provides a combined design method which provides designers with comprehensive daylighting design and intuitive shading design options. However, the design proposed was limited to a simple comparison between orientations and basic shading shapes: vertical, horizon, and combination. This method is essential for designers to figure out indoor environment affected by building elements, which is to integrate the architectural design factors from simple design typologies with dynamic daylight study to claim testimony the lighting performance of the classroom for the whole year.
The findings in this research can be summarised as follows, which can be used in architectural practice and also in education.
- The proposed loop method between passive and advanced software will provide an optimal design and simplified approach to designers.
- Being able to visualise in the diagram (i.e., Shading mask) supports the designers analyse what the calculation is based on, making it easier to track down simulation results and control the level of details to their specific requirement.
- DaySim as an advanced software calculates DA and DSP for the quality of daylight. Those indices show lighting illuminance with different shading devices and generate a sufficiently accurate daylighting level in a classroom
- The passive design approach makes it easy for the viewer to understand the movement of the sun and the surroundings of the site which can adjust building intuitively over the process of design.
- Integrated daylighting design method by combining passive design and advanced software would guide in a positive way of the building design regarding environmental performance. It, therefore, leads to an increase in the efficiency of the design process and finally to benefit designers and clients.
Also, it will serve as a basis for future studies such as how much is the passive approach helpful in architectural practice and how students get affected this combined environmental architecture method. In particular, the prevalent use of precalculated shading masks needs to be used continuously for the future mapping with sun-path. The design process can be positively extended to other buildings needed refurbishment, once a dimensional tool considering geometric parameters of the space, the shading device and window is appreciated. The current research was not specifically designed to evaluate building factors related to thermal comfort. Therefore, further work needs to be done to establish whether shading devices or building façade are influential to both visual and thermal comfort.
Author Contributions
All authors equally contributed to the paper.
Funding
This work was supported by the research fund of Hanyang University (HY-2013).
Conflicts of Interest
The authors declare no conflicts of interest.
References
- Gugliermetti, F.; Bisegna, F. Daylighting with external shading devices: Design and simulation algorithms. Build. Environ. 2006, 41, 136–149. [Google Scholar] [CrossRef]
- Szokolay, S.V. Introduction to Architectural Science: The Basis of Sustainable Design, 2nd ed.; Elsevier Architectural Press: Amsterdam, The Netherlands; London, UK, 2008; p. xi. 345p. [Google Scholar]
- Manzan, M.; Clarich, A. Fast energy and daylight optimization of an office with fixed and movable shading devices. Build. Environ. 2017, 113, 175–184. [Google Scholar] [CrossRef]
- Thomas, R. Environmental Design: An Introduction for Architects and Engineers, 3rd ed.; Taylor & Francis: London, UK, 2006; p. xvi. 272p. [Google Scholar]
- Yun, G.; Kim, K.S. An empirical validation of lighting energy consumption using the integrated simulation method. Energy Build. 2013, 57, 144–154. [Google Scholar] [CrossRef]
- Kwon, C.W.; Shin, S.W. Flexible Component for Optimizing Building Performance of the Sustainable School. In Advanced Materials Research; Trans Tech Publications: Zurich, Switzerland, 2014; pp. 102–105. [Google Scholar]
- Heschong, L. Daylighting in Schools: An Investigation into the Relationship between Daylighting and Human Performance; Detailed Report; Heschong Mahone Group: Gold River, CA, USA, 1999. [Google Scholar]
- Dudek, M. A Design Manual Schools and Kindergartens; Springer: Berlin/Heidelberg, Germany, 2007. [Google Scholar]
- Gul, M.S.; Patidar, S. Understanding the energy consumption and occupancy of a multi-purpose academic building. Energy Build. 2015, 87, 155–165. [Google Scholar] [CrossRef] [Green Version]
- Lo Verso, V.R.M.; Mihaylov, G.; Pellegrino, A.; Pellerey, F. Estimation of the daylight amount and the energy demand for lighting for the early design stages: Definition of a set of mathematical models. Energy Build. 2017, 155, 151–165. [Google Scholar] [CrossRef]
- Kirimtat, A.; Koyunbaba, B.K.; Chatzikonstantinou, I.; Sariyildiz, S. Review of simulation modeling for shading devices in buildings. Renew. Sustain. Energy Rev. 2016, 53, 23–49. [Google Scholar] [CrossRef]
- Manzan, M. Genetic optimization of external fixed shading devices. Energy Build. 2014, 72, 431–440. [Google Scholar] [CrossRef]
- Ghosh, A.; Norton, B. Advances in switchable and highly insulating autonomous (self-powered) glazing systems for adaptive low energy buildings. Renew. Energy 2018, 126, 1003–1031. [Google Scholar] [CrossRef]
- Ghosh, A.; Norton, B.; Duffy, A. Daylighting performance and glare calculation of a suspended particle device switchable glazing. Sol. Energy 2016, 132, 114–128. [Google Scholar] [CrossRef]
- Bellia, L.; Pedace, A.; Fragliasso, F. The impact of the software’s choice on dynamic daylight simulations’ results: A comparison between daysim and 3ds max design®. Sol. Energy 2015, 122, 249–263. [Google Scholar] [CrossRef]
- Bian, Y.; Ma, Y. Analysis of daylight metrics of side-lit room in canton, south china: A comparison between daylight autonomy and daylight factor. Energy Build. 2017, 138, 347–354. [Google Scholar] [CrossRef]
- Baker, N.; Steemers, K. Daylight Design of Buildings; James & James: London, UK, 2002; p. 250. [Google Scholar]
- Littlefair, P.J.; Santamouris, M.; Alvarez, S. Environmental Site Layout Planning: Solar Access, Microclimate and Passive Cooling in Urban Areas; Building Research Establishment: San Francisco, CA, USA, 2000. [Google Scholar]
- Kensek, K.; Noble, D.; Schiler, M.; Setiadarma, E. Shading mask: A teaching tool for sun shading devices. Autom. Constr. 1996, 5, 219–231. [Google Scholar] [CrossRef]
- Oh, J.; Haberl, J.S. New Educational Software for Teaching the Sunpath Diagram and Shading Mask Protractor. In Proceedings of the 1997 IBPSA Building Simulation Conference, Prague, Czech Republic, September 1997. [Google Scholar]
- Olgyay, V. Design with Climate: Bioclimatic Approach to Architectural Regionalism; Princeton University Press: Princeton, NJ, USA, 2015. [Google Scholar]
- Hernández, F.F.; López, J.M.C.; Suárez, J.M.P.; Muriano, M.C.G.; Rueda, S.C. Effects of louvers shading devices on visual comfort and energy demand of an office building. A. case of study. Energy Procedia 2017, 140, 207–216. [Google Scholar] [CrossRef]
- Korean Standards Association. Illuminance Standard; Vol. KSA 3011; Korean Standards Association: Seoul, Korea, 1998. [Google Scholar]
- CIBSE. Daylighting Design and Research; CIBSE: London, UK, 2000. [Google Scholar]
- Nabil, A.; Mardaljevic, J. Useful daylight illuminances: A replacement for daylight factors. Energy Build. 2006, 38, 905–913. [Google Scholar] [CrossRef]
- Stevanović, S. Optimization of passive solar design strategies: A review. Renew. Sustain. Energy Rev. 2013, 25, 177–196. [Google Scholar] [CrossRef]
- Reinhart, C.F. Lightswitch-2002: A model for manual and automated control of electric lighting and blinds. Sol. Energy 2004, 77, 15–28. [Google Scholar] [CrossRef]
- DeKay, M.; Brown, G. Sun, Wind, and Light: Architectural Design Strategies; John Wiley & Sons: Hoboken, NJ, USA, 2013. [Google Scholar]
- Marsh, A. The application of shading masks in building simulation. In Proceedings of the Building Simulation 2005 Conference, Montréal, QC, Canada, 15–18 August 2005. [Google Scholar]
- Reinhart, C.F.; Walkenhorst, O. Validation of dynamic radiance-based daylight simulations for a test office with external blinds. Energy Build. 2001, 33, 683–697. [Google Scholar] [CrossRef]
- Reinhart, C.F.; Herkel, S. The simulation of annual daylight illuminance distributions‚ äî a state-of-the-art comparison of six radiance-based methods. Energy Build. 2000, 32, 167–187. [Google Scholar] [CrossRef]
- Acosta, I.; Muñoz, C.; Esquivias, P.; Moreno, D.; Navarro, J. Analysis of the accuracy of the sky component calculation in daylighting simulation programs. Sol. Energy 2015, 119, 54–67. [Google Scholar] [CrossRef]
Figure 1.
Schematic flowchart showing the process for calculating daylighting levels of a building.

Figure 2.
Model with analysis and size.

Figure 3.
View of the standard classroom.

Figure 4.
Shading mask of the direct beam in the middle of the window with facing south and west.

Figure 5.
Shading coefficient with vertical fins.

Figure 6.
Shading coefficient with horizon canopy.
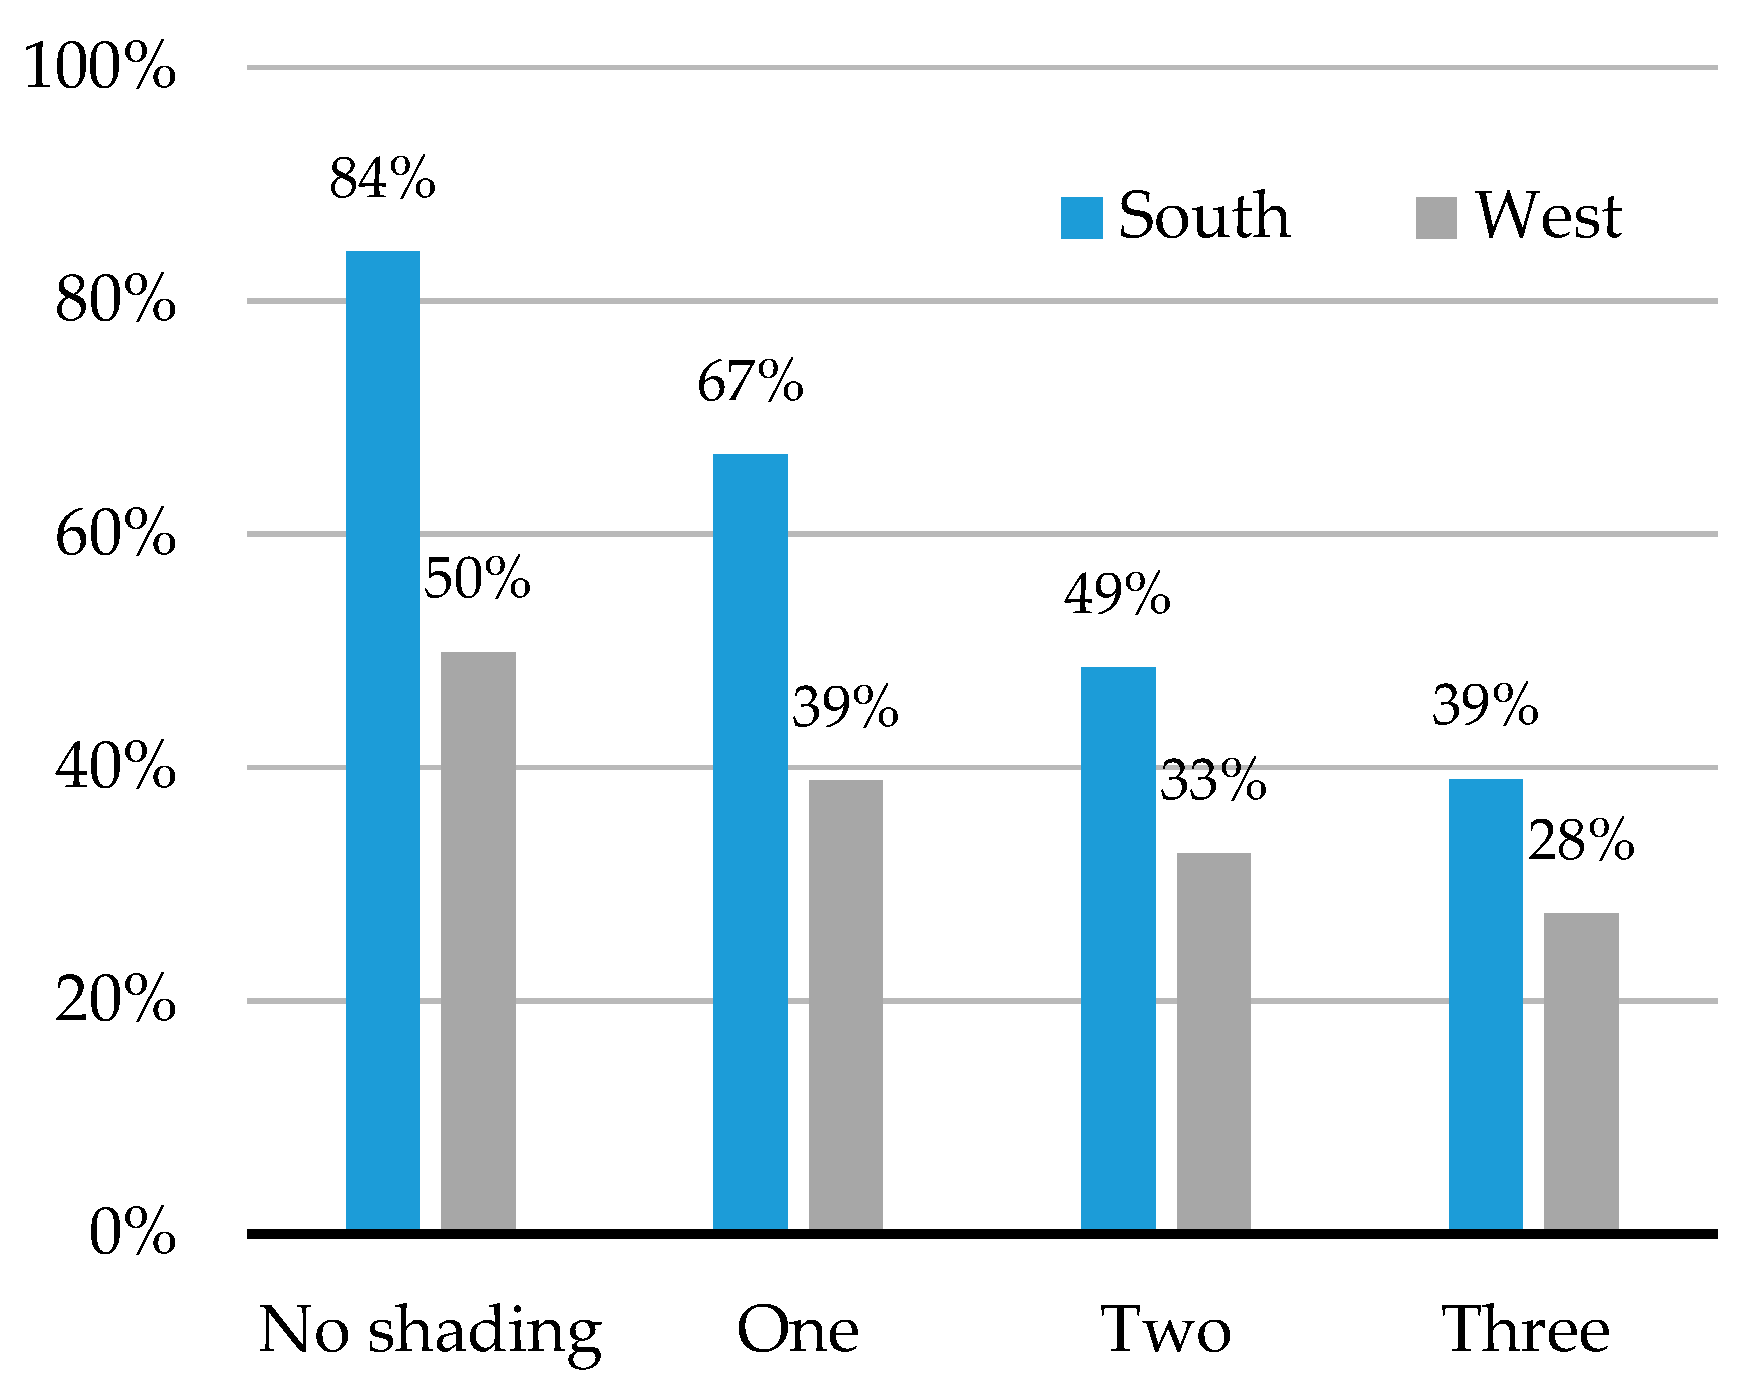
Figure 7.
Shading coefficient in winter and summer.

Figure 8.
Internal illuminance is rendering with different shape of canopies with the intermediate sun in Seoul.
Figure 8.
Internal illuminance is rendering with different shape of canopies with the intermediate sun in Seoul.

Figure 9.
Comparison of daylight index with SC (Shading Coefficient), DA (Daylight Autonomy), and DSP (Daylight Saturation Percentage).
Figure 9.
Comparison of daylight index with SC (Shading Coefficient), DA (Daylight Autonomy), and DSP (Daylight Saturation Percentage).


Table 1.
Input data for classrooms.
| Design Variables | Data | Design Variables | Data |
|---|---|---|---|
| Orientation | South, West | Window area | 10.8 m2 (Double glazing) |
| Window to Wall ratio | 49.5% | Room dimensions | 9 m (w) × 7 m (d) × 2.9 m (h) |
| Canopy dimensions | 3.6 m (w) × 1 m (d) | Reflectance | Wall 0.5 |
| 3.6 m (w) × 0.33 m (d) | Ceiling 0.7 | ||
| 0.8 m (w) × 1.5 m (d) | Floor 0.3 |
Table 2.
Different size and shape of shading device.
| Horizontal Shading (Large) | Vertical Shading | Horizontal Shading (Small) | ||
|---|---|---|---|---|
| Shading Devices |  |  |  |  |
| Size (W × D) | 3.6 m × 1 m | 0.8 m × 1.5 m (3ea) | 3.6 m × 0.33 m (1ea) | 3.6 m × 0.33 m (3ea) |
| Area | 3.6 m2 | 3.6 m2 | 1.2 m2 | 3.6 m2 |
Table 3.
Shading mask on the window south facing with vertical fins shadings.
| Direction | No Shading | One Fin | Three Fins | Five Fins |
|---|---|---|---|---|
| South facing |  |  |  |  |
| SC (Summer, Winter) | 84.2% (55.9%, 100%) | 70.7% (50%, 84.2%) | 57.5% (44.3%, 68.8%) | 43.0% (35.3%,49.2%) |
| West facing |  |  |  |  |
| SC (Summer, Winter) | 49.9% (50%, 49.1%) | 44.7% (48%, 40.5%) | 39.7% (46.2%, 31.9%) | 32.2% (42.5%, 21.1%) |
Table 4.
Shading mask on the window south facing with horizontal canopies shadings.
| Direction | No Shading | One Canopy | Two Canopies | Three Canopies |
|---|---|---|---|---|
| South facing |  |  |  |  |
| SC (Summer, Winter) | 84.2% (55.9%, 100%) | 66.8% (33.6%, 91.1%) | 48.6% (9.9%, 81.5%) | 39.0% (8.7%, 69.8%) |
| West facing |  |  |  |  |
| SC (Summer, Winter) | 49.9% (50%, 49.1%) | 38.9% (37.4%, 40%) | 32.6% (30.7%, 33.9%) | 27.5% (25.6%, 29%) |
Table 5.
Daylight Autonomy (DA) in the classroom with different shading devices.
| No Canopy | Vertical | Horizontal | Combined | |||
|---|---|---|---|---|---|---|
| Orientation | South |  |  |  |  |  |
| 87.9% | 86% | 84.7% | 80.7% | |||
| West |  |  |  |  | ||
| 87.2% | 85.2% | 83.8% | 80% |
Table 6.
Daylight Saturation Percentage (DSP) in the classroom with different shading devices.
| No Canopy | Vertical | Horizontal | Combined | |||
|---|---|---|---|---|---|---|
| Orientation | South |  |  |  |  |  |
| 54.9% | 57.2% | 64.1% | 57.9% | |||
| West |  |  |  |  | ||
| 65% | 60.8% | 59.7% | 48.3% | |||
© 2018 by the authors. Licensee MDPI, Basel, Switzerland. This article is an open access article distributed under the terms and conditions of the Creative Commons Attribution (CC BY) license (http://creativecommons.org/licenses/by/4.0/).
Share and Cite
MDPI and ACS Style
Kwon, C.W.; Lee, K.J. Integrated Daylighting Design by Combining Passive Method with DaySim in a Classroom. Energies 2018, 11, 3168. https://doi.org/10.3390/en11113168
AMA Style
Kwon CW, Lee KJ. Integrated Daylighting Design by Combining Passive Method with DaySim in a Classroom. Energies. 2018; 11(11):3168. https://doi.org/10.3390/en11113168
Chicago/Turabian StyleKwon, Choul Woong, and Kang Jun Lee. 2018. "Integrated Daylighting Design by Combining Passive Method with DaySim in a Classroom" Energies 11, no. 11: 3168. https://doi.org/10.3390/en11113168
Note that from the first issue of 2016, this journal uses article numbers instead of page numbers. See further details here.