Study on the Energy Saving Potential for Semi-Transparent PV Window in Southwest China
by
 , ,
, ,
Hao Tian
1 ,
,
Wei Zhang
1,*,
Lingzhi Xie
2,
Yupeng Wu
3,
Yanyi Sun
3,
Mo Chen
1,
Wei Wang
1 and
Xinwen Wu
1 1
College of Architecture and Environment, Sichuan University, Chengdu 610065, China
2
Institute of New Energy and Low-Carbon Technology, Sichuan University, Chengdu 610065, China
3
Department of Architecture and Built Environment, Faculty of Engineering, The University of Nottingham, University Park, Nottingham NG72RD, UK
*
Author to whom correspondence should be addressed.
Energies 2018, 11(11), 3239; https://doi.org/10.3390/en11113239
Submission received: 19 October 2018
/
Revised: 7 November 2018
/
Accepted: 14 November 2018
/
Published: 21 November 2018
(This article belongs to the Special Issue Selected Papers from the 9th Edition of the International SOLARIS Conference)
Abstract
:To study Semi-Transparent photovoltaic (STPV) windows, experiments were conducted to test the energy potential of STPV window installed in buildings. Two identical rooms were built up as experimental units; one was fitted with amorphous silicon (a-silicon) photovoltaic (PV) windows, and another was fitted with a conventional window. The interactional influence was analyzed among air conditioning energy consumption, lighting energy consumption, and energy generation. It can be concluded that STPV windows could provide 0.26 kWh/per day and save 29% on comprehensive building load on a typical sunny day. In order to further investigate, buildings installed with STPV windows in four typical cities with different climate environments in southwest China were simulated and analyzed. The cooling load of the buildings were all decreased while the heating energy consumption and lighting energy consumption were lightly increased. The energy generation of STPV windows was highest in Lhasa at 402.1 kWh/year. The energy saving potential of STPV windows was predicted with good values; 54% in Kunming.
1. Introduction
The use of PV to meet the demand for electricity has been widely recognized. It is a key developmental step of the renewable energy plan in China [1]. The application of PV technology in the construction field is particularly important. The current building energy consumption accounts for around 30% of the total energy consumption [2]. Windows may be considered as the least energy efficient component of a building [3]. The research and development in the application of PV windows can potentially improve building energy conservation in Southwest China.
In Southwest China, solar energy application is being encouraged to develop at a rapid pace owing to an abundant availability of solar radiation and sparsely populated land [4]. For building related practice and research, the climatic conditions in China have been divided into five climatic zones, and southwest China houses three of those, Hot Summer Cold Winter Zone, Cold Zone, and Temperate Zone. Four cities were chosen for simulation: Lhasa, Kunming, Guiyang and Chengdu. Each city represents a different climate and solar radiation condition [5].
Research on the thermal performance of PV technology development was studied by Fung et al. [6]. It was found that solar heat gain is the major component of the total heat gain. The area of solar cell in the PV module has a significant effect on the total heat gain while the solar cell energy efficiency and the PV module’s thickness have minimal effect. Nuria Martin-Chivelet et al. [7] tested the optical and electrical properties of STPV modules and it was discovered that STPV windows are efficient in an indoor lighting environment. Martin-Chivelet et al. [8] rebuilt the building and applied the PV module to the building, which achieved a good energy saving effect. Costanzo et al. [9] set up a method to analyze energy performance of building integrated photovoltaics, whilst keeping the urban context in mind. It was found that the BIPV system can achieve the renewable energy directive target of 20%. Cucchiella et al. [10] used the net present value (NPV), internal rate of return (IRR), discounted payback period (DPbP), discounted aggregate cost benefit ratio (BCr), and reduction of emissions of carbon dioxide (ERcd) to evaluate the environmental impact and economics of building integrated photovoltaic systems in Italy.
For the application of PV on windows and glazing, prototypes had been made of crystalline silicon solar cells (e.g., Mono-crystalline (mono c-Si), poly-crystalline (poly c-Si)), thin film solar cells (e.g., amorphous silicon (a-Si), and organic solar cells (e.g., organic PV (OPV)). As shown in Figure 1, crystalline silicon modules have the highest power generation efficiency but are opaque. Thin film modules have good transmittance, but the power generation efficiency has only been reported within a range of 4.1–12% [11]. In recent years, the new generation of photovoltaics- organic photovoltaic (OPV), have been encouraged in the market. They are more economical and flexible but with lower electrical efficiency (e.g., module efficiencies for OPV devices are in the range of 3–7.6%) [12].
In recent years, semi-transparent PV (STPV) windows have attracted the attention of many researchers. Wong et al. [13] studied STPV as the roof of residential applications. The experimental results showed that PV roofs can save indoor energy consumption. Liao et al. [14] compared amorphous silicon glass with traditional glass in different buildings. Considering the influence of building conditions, it was shown in the experiment that STPV windows are more advantageous than traditional glass windows.
To consider the energy performance of STPV windows, He et al. [15] compared the performance of single-layer PV windows and double-layer PV windows in Hefei, China. Based on the test results, double-layer PV provided better thermal comfort. Peng et al. [16] set up the experimental units in Hong Kong to test the heating performance of STPV windows in winter. Chow et al. [17] built an experimental system for a typical office environment in Hong Kong for the verification of the simulation models. In the simulated results, it was demonstrated that innovative natural ventilation photovoltaic double glazing can significantly reduce indoor energy consumption by 28%.
To further explore the performance of PV windows, researchers set up a simulation model and analyzed their performance. The simulation model set up by Peng [18] for an optimized double-skin PV window showed that the annual power output could be doubled even with ventilation. Vartiainen et al. [19] found that if the solar panel coverage of solar cells increased, the annual average daylight autonomy (DA) of buildings increased significantly. Olivieri et al. [20] studied the relationship between photovoltaic cell transmittance and building interior lighting by establishing an ideal model. The results showed that when the transmittance of STPV windows were reduced from 40% to 10%, the indoor lighting coefficient gradually reduced but the uniformity of illumination improved.
According to the previous study, most of the studies were focused on electricity performance tests and used numerical simulation to evaluate the energy consumption. However, the comprehensive energy saving potential is complicated. It should include the interactional influence among air conditioning energy consumption, lighting energy consumption, and energy generation. And the southwest region is in a complex climate zone, the application of PV windows in different regions of Southwest China should be further investigated. This article aims to evaluate the potential for saving and generating energy in buildings using semi-transparent photovoltaic windows. Experimental tests were carried out to analyze the energy consumption of semi-transparent PV windows in summer, and the coupling relationship between air conditioning energy consumption, lighting energy consumption, and power generation. With the aim to investigate further, STPV windows installed in buildings of four typical cities of Southwest China, each with different climate conditions, would be simulated, analyzed and thus the energy-saving potential of STPV windows will be predicted.
2. Investigation Methods
2.1. Parameters of PV Module
The double-layer STPV window was designed and produced by our research team and the Hanergy Company. As shown in Figure 2, the double-layer STPV window consists of one layer of single STPV windows, and one layer of conventional window with a vacuum air layer. The key characteristics of the PV module are shown in Table 1.
2.2. Test Methods
The analysis of the building with integrated PV windows were divided into two parts: energy consumption and electricity generation. The energy benefits of the BIPV systems are based on three aspects, electricity saving of the artificial lighting system, the HVAC system, and electricity generation from the PV. According to the “Design Code for Heating Ventilation and Air Conditioning of Civil Buildings” in China, the indoor temperature should be set to 18–26 °C, and 26 ± 1 °C was chosen for the test [21].
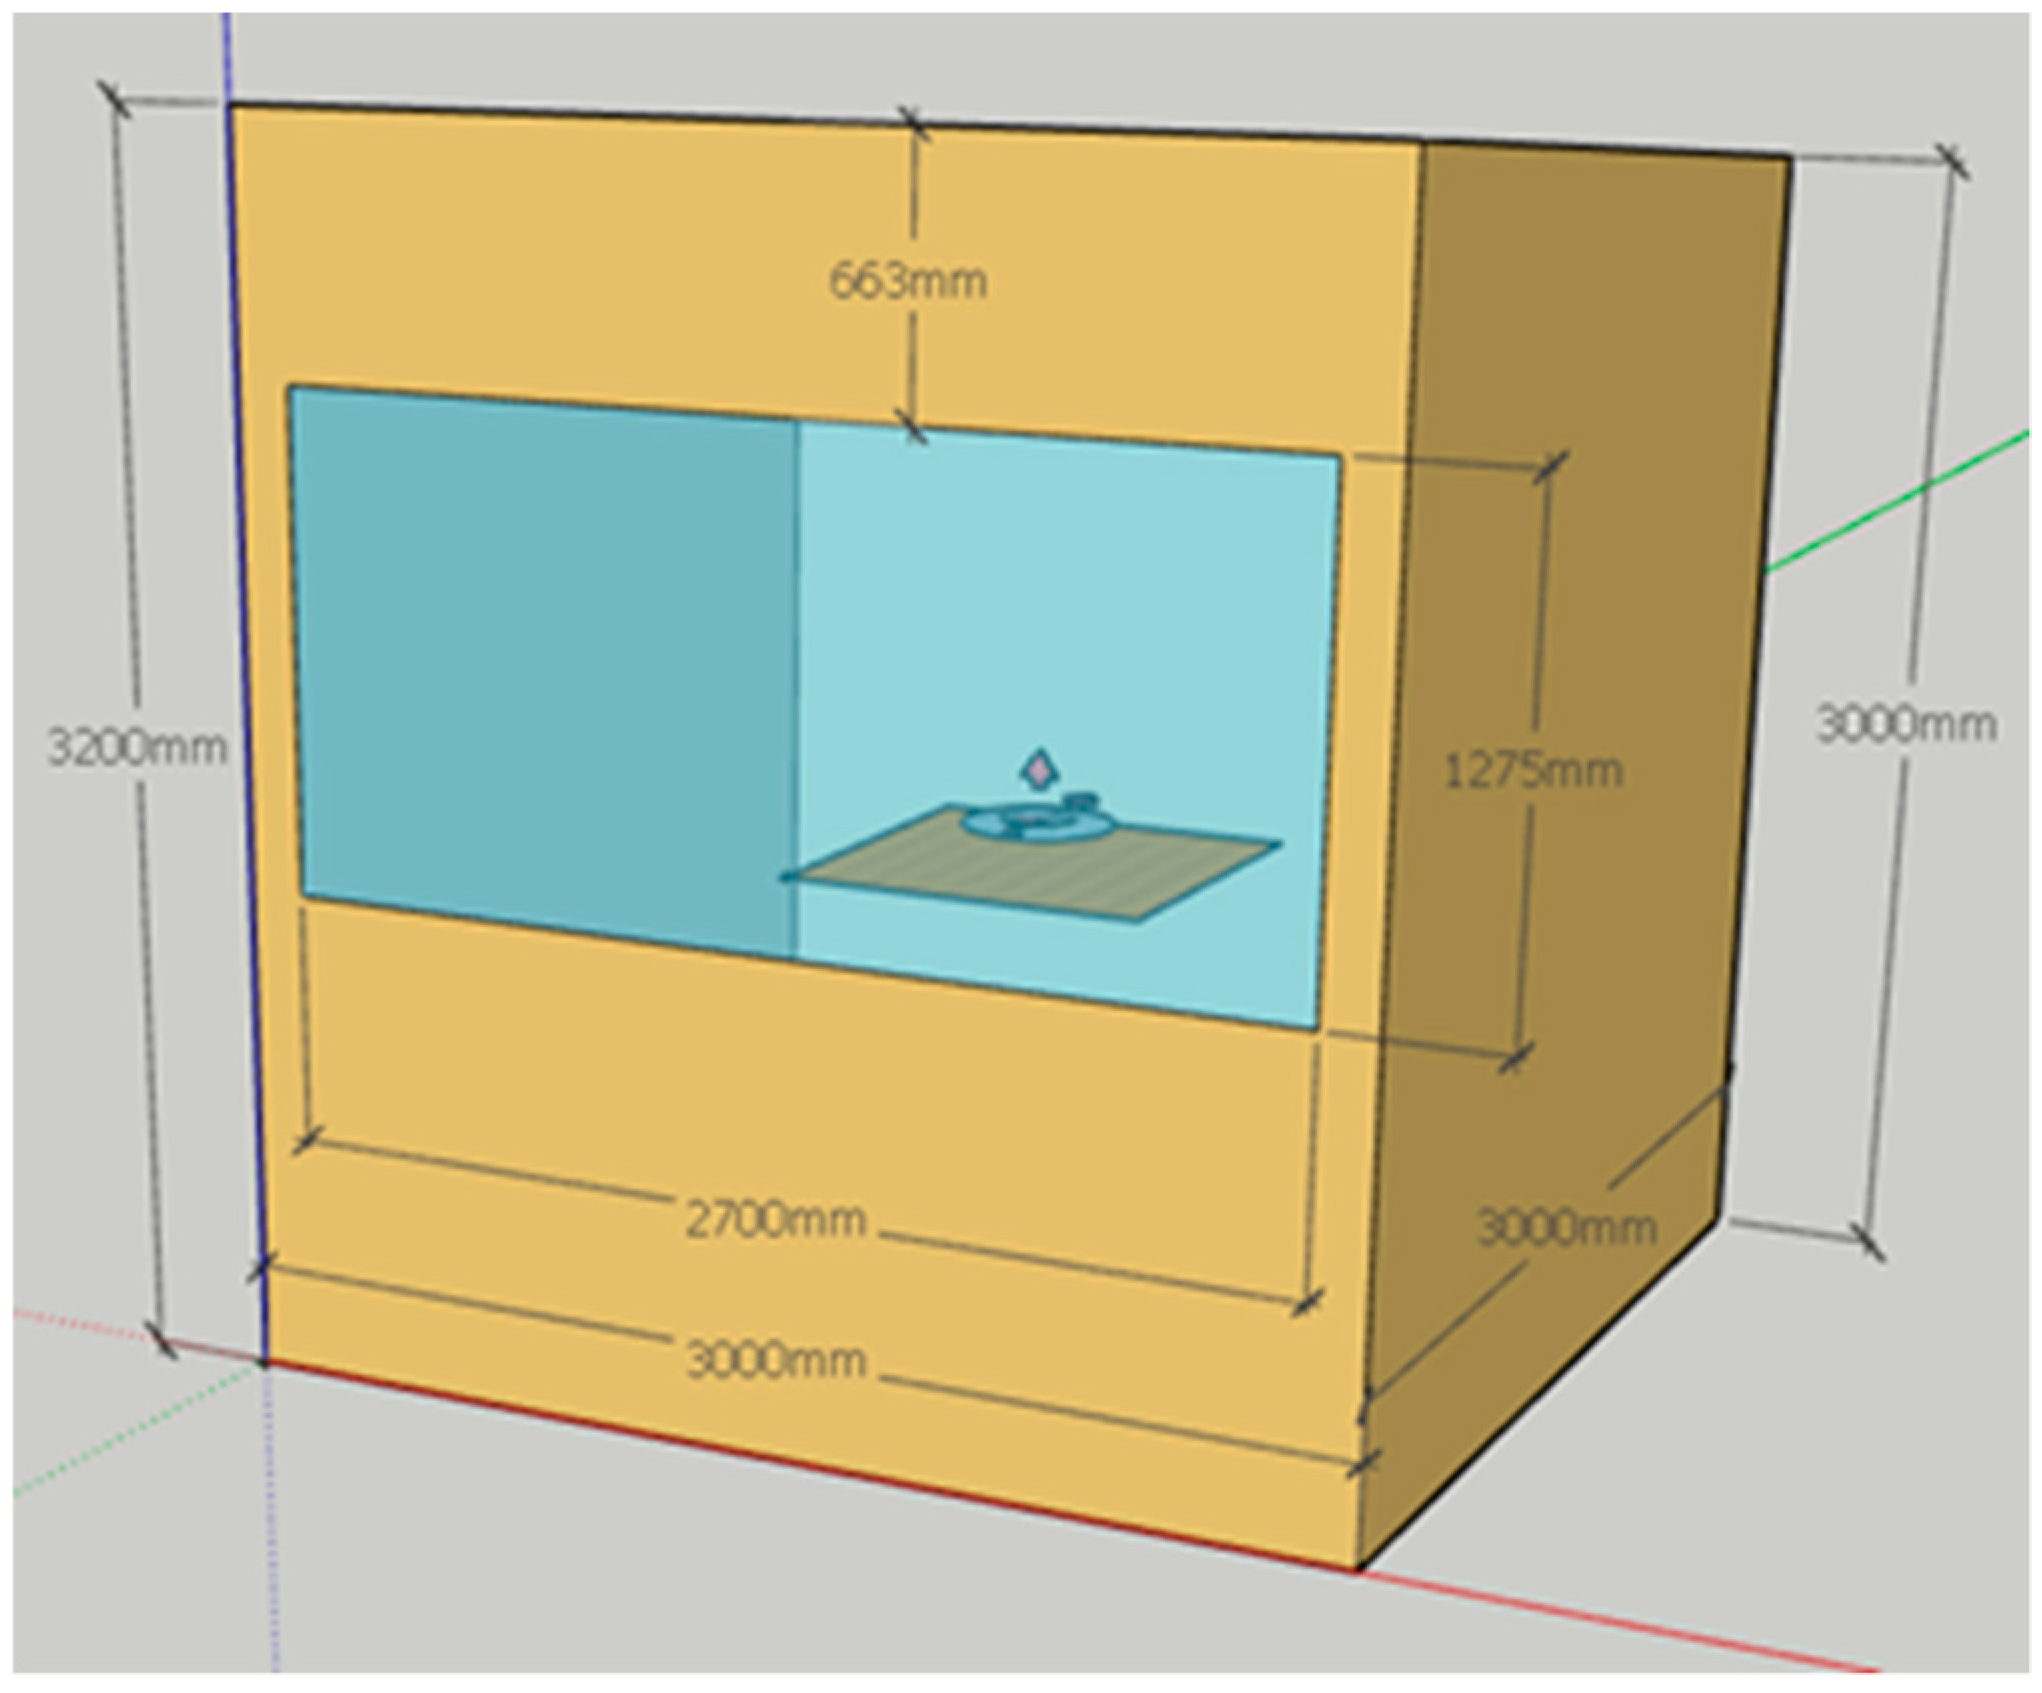
To test the performance of the double-skin STPV window, a test rig was built in Sichuan University in Chengdu, as shown in the Figure 3. The test rig included two identical test units (3 m × 3 m × 3 m) and a 75 mm thick sandwich rock wool board was used as the material for the wall and roof to meet the requirements of the thermal insulation. The windows were installed on a south facing wall.
Measurement instruments of the test rig are shown in Figure 4. The wireless lighting illuminance sensors were used to measure the daylighting illuminance on the working surface. The measuring points were arranged 1 m from the wall and 0.75 m from the floor. The double-skin window related parameters like I–V curves, solar radiation upon south façade, and generation power were measured by the outdoor PV testing equipment. The indoor temperature was tested by the wireless temperature sensors. The experimental data, except the electrical parameters, were collected by wireless multi-channel data recorders with an interval of 1 min. As for the indoor energy consumption, STPV windows not only generated electricity, but also influenced the indoor light environment and thermal environment. To get a comprehensive analysis of the indoor energy consumption, the power consumption of the indoor air-conditioner and lighting had been collected by the electric quantity recorder. The quantity recorder made by BULL can transfer data through a wireless network. All the key instruments and their specifications [22] are shown in Table 2.
2.3. Building Model
In order to simulate a comprehensive performance of a double-layer a-silicon windows in Southwest China, a three-factor model of lighting-heat-electricity was established with the Thermal balance model, the Daylighting model, and the Sandia PV model in EnergyPlus.
This study focuses on the overall energy performance of different windows, the simulation model of test units was simplified [23]. The room model, which has the same dimensions as the test units, is shown in Figure 5. In winter, the indoor temperature was maintained at 18 °C, while in summer, it was maintained at 26 °C.
3. Experimental Results and Analysis
In summer, experiments were conducted to test the building electricity consumption of two units in different weather conditions from June to August. The electricity performance of STPV windows were evaluated. The average outdoor ambient temperature was around 24 °C. The average radiation upon the south face of the units was about 200 W/m2/per day. STPV windows can generate an average 0.17 kWh/m2/per day of electricity, and its conversion efficiency may reach 13.8%. During the test period, three continuous days (sunny to cloudy) from 21 June, 22 June (Summer Solstice) and 23 June were selected to analyze the energy saving potential in Chengdu. According to the record of weather conditions, the other days were similar to the selected days. To simplify the analysis of energy consumption, only the electricity consumption of air conditioning and lighting were analyzed.
3.1. Air-Conditioning Electricity Consumption Test
The air-conditioning electricity consumption for the two units are shown in the Figure 6. On a sunny day, the average electricity consumption of the test unit and comparison unit was 0.181 kWh and 0.214 kWh. On a cloudy to sunny day, the average electricity consumption of the test unit and comparison unit was 0.189 kWh and 0.206 kWh. Since the shade of solar radiation by STPV windows increased the air conditioning load of the unit, it’s shown in the experiment that the electricity consumption of the test unit was less than that of the comparison unit. On cloudy days, the average electricity consumption of the test unit and comparison unit was 0.105 kWh and 0.106 kWh, respectively, which is essentially the same.
3.2. Lighting Electricity Consumption Test
When the illuminance does not meet the preset requirement of 300 lx [24], the lighting was turned on automatically and the electric power meter was used to record the electricity consumption of the lighting. As per the observations in the experiment, on sunny days, STPV windows would not affect the indoor daylighting requirement and the average illuminance in both the test unit and comparison unit reached up to 1583 lx and 3897 lx; thereby eliminating the consumption of electricity by the lighting. On a cloudy to sunny day, the average illuminance in the test unit was 287 lx in the morning but 1437 lx in the afternoon. On cloudy days, the average illuminance in the test unit and comparison unit were 207 lx and 832 lx, respectively.
In Table 3, the test results of lighting on a sunny day, cloudy day, and cloudy to sunny day have been shown. As can be seen in the table, the unit with STPV windows needed to turn on daylight when the nature lighting did not meet indoor lighting required. The electricity for lighting on cloudy days were about 0.3 kWh per day, and 0.1 kWh per day on a cloudy to sunny day. Compared to the experiment tests of the daily lighting, indoor lighting would be reduced due to the shading of STPV windows, and electricity consumption would slightly increase.
3.3. Energy Saving Potential Analysis
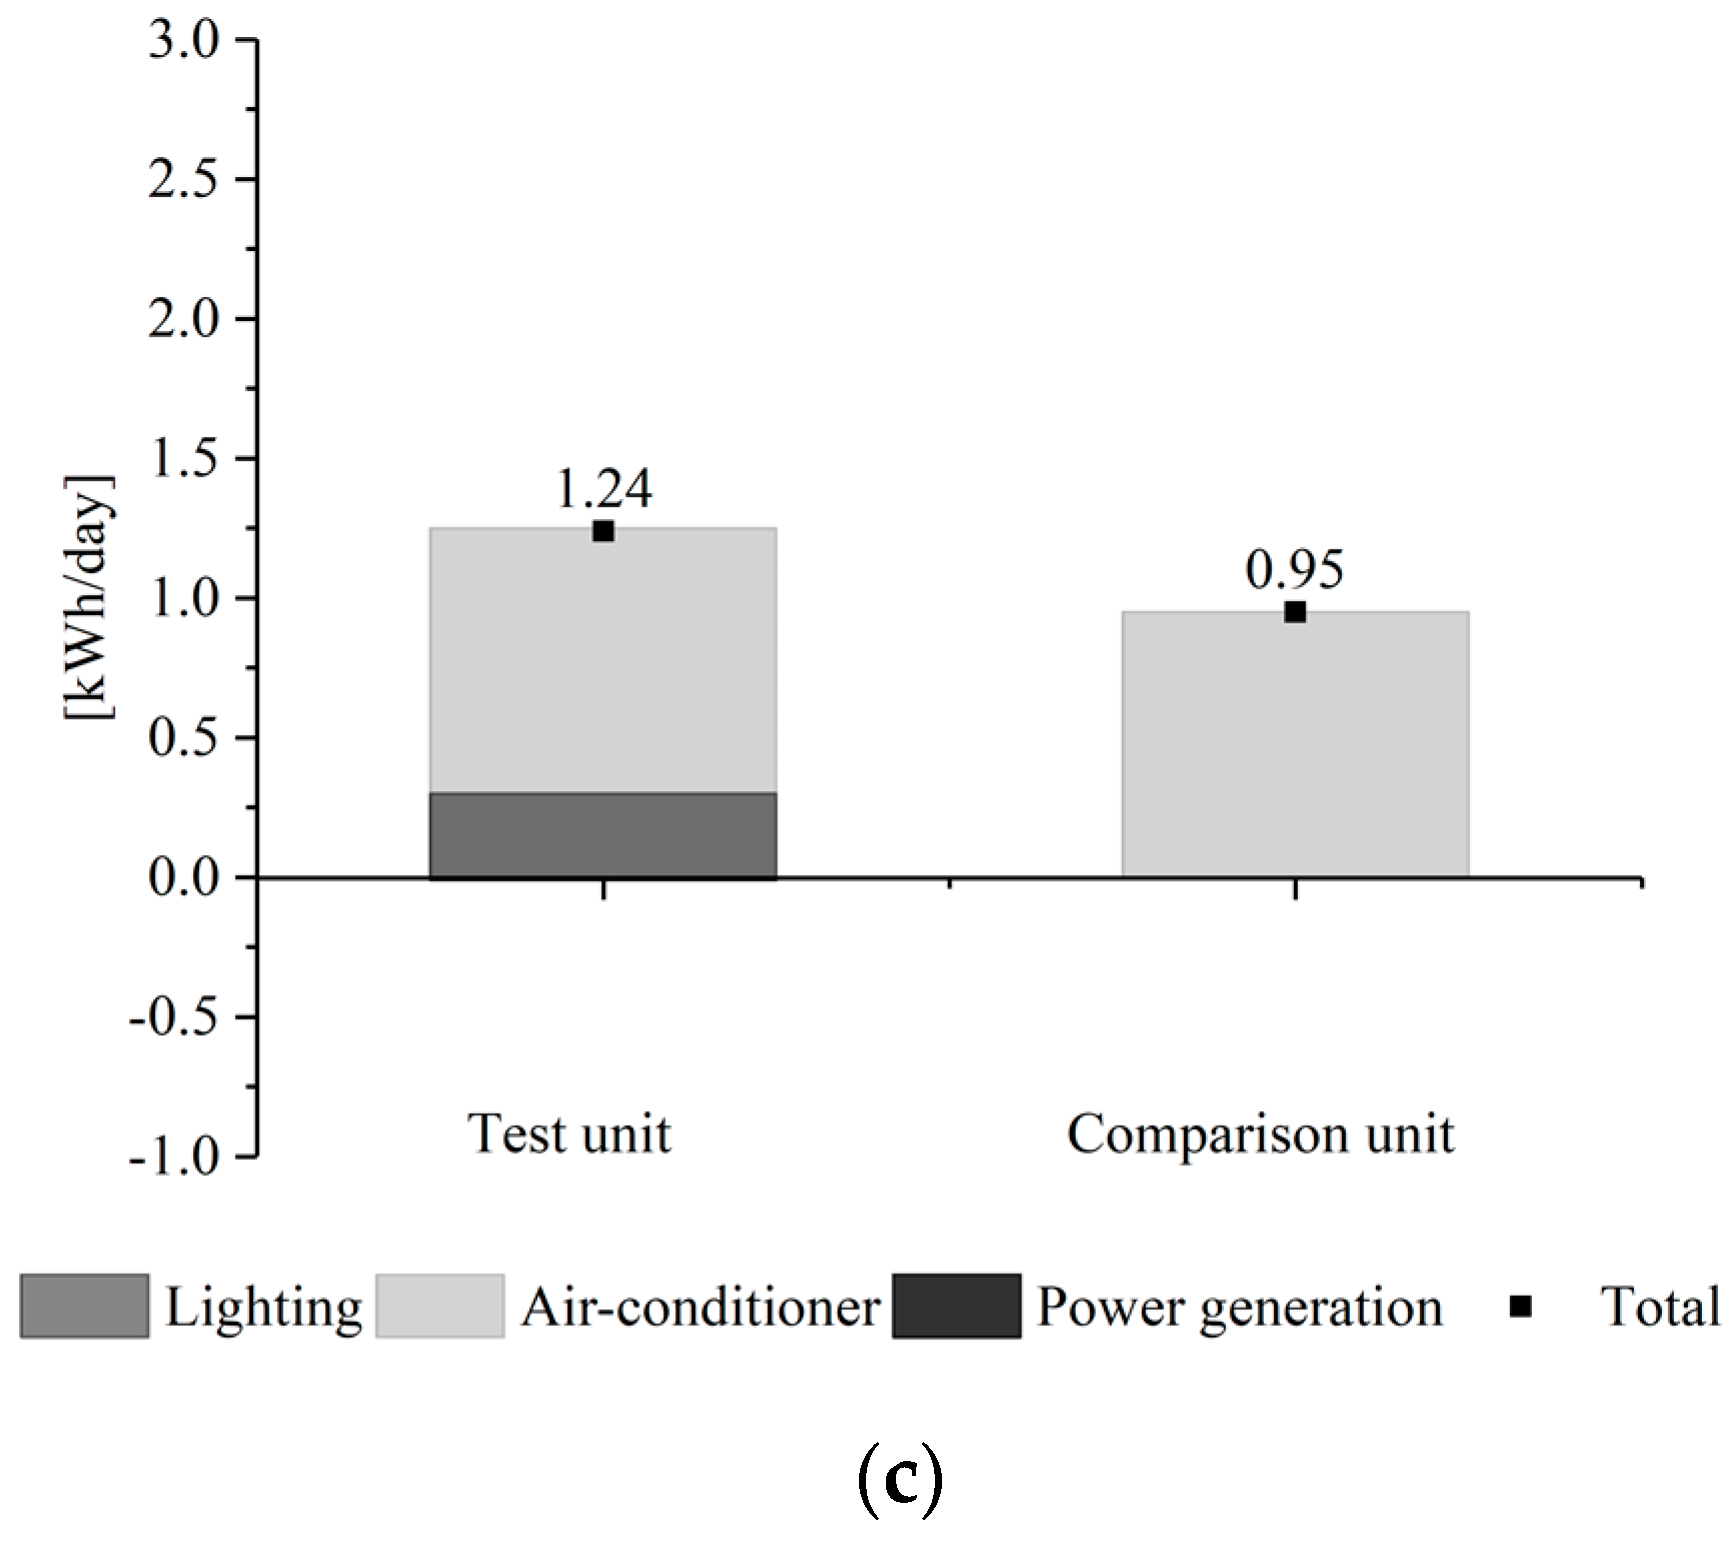
As shown in Figure 7, the energy saving analysis for the two units were carried out to compare the energy consumption and generation. On a sunny day, the energy generation of a STPV window was 0.26 kWh. As for the energy consumption in two units, only the air-conditioning consumption in test unit with 1.37 kWh was lower than that in comparison unit with 1.93 kWh. The total energy saving rate was 29%. On the cloudy to sunny day, there was minimal energy generation and the energy consumption in the two units remained the same. On the cloudy day, due to the shade of STPV windows, the test unit turned on the lighting, unlike the comparison unit. The energy consumption in two units were 1.24 kWh and 0.95 kWh, respectively. The test unit needed additional energy consumption as opposed to the comparison unit.
4. Simulation Analysis of Energy Saving Potential in Typical Cities in Southwest China
According to the test results, the PV surface temperature and power generation test data were used to validate the simulation model. To assess the accuracy of the simulation model, ASHRAE Guideline 14 suggests that if the mean bias error (MBE) and the coefficient of variation of the root mean square error (Cv(RMSE)) of a building energy simulation model fall within 10% and 30%, respectively, it can be regarded as an acceptable model in accuracy [25]. For the validation of the photovoltaic window outer surface temperature, The MBE was 3.8%, and the Cv(RMSE) is 5%. For the power of PV panel electricity generation, the MBE is 7.6% and the Cv(RMSE) is 20.39%. It can be verified that the simulation model can simulate the real operation of a room.
For further study of energy saving potential, four typical cities in Southwest China were selected for simulation analysis [26]. Locations and climatic conditions of four cities are shown in Table 4. Lhasa, a representative city of the abundance of solar energy resources in southwest China, is located in the plateau area. The solar radiation in Kunming is also high, and its ambient temperature is mild all year round. Chengdu, the economic and political center of Southwest China is located in the Sichuan Basin while Guiyang is located in the central part of Yunnan Guizhou Plateau. It has a mild climate, and the solar radiation of both the cities is relatively low.
The building load and energy saving potential for STPV windows were predicted in the four chosen cities. As shown in Figure 8, Lhasa has the largest energy generation with 402.1 kWh and Guiyang has the lowest energy generation with 216.5 kWh. The energy generation in Chengdu and Kunming were 233.55 kWh and 314.1 kWh, respectively. Cooling loads of building with STPV windows in Chengdu, Kunming, Lhasa and Guiyang had reduced to 285 kWh, 393.9 kWh, 369.1 kWh, and 227.4 kWh, respectively. The cooling load of all the buildings decreased, while the heating energy consumption and lighting energy consumption increased slightly. This was caused by the partially blocked solar radiation by STPV windows and different climatic conditions. It was calculated that Kunming had the largest energy saving rate with 53% and Guiyang had the lowest energy saving rate with 24%. The energy saving rate in Chengdu and Lhasa were 30.3% and 34% respectively. According to the simulation results, STPV windows presented good energy saving values in Southwestern China.
5. Conclusions
In this article, based on the test and simulation research work, good energy saving potential of STPV windows in Southwest China can be found. The research conclusions in this article were collected as follows:
- The experimental tests of the energy consumption and generation of STPV windows in summer were carried out in two caparison units, and interactional influence amongst air conditioning energy consumption, lighting energy consumption, and energy generation were analyzed. Due to the shading of STPV windows, air-conditioning and lighting energy consumption would be lower in the test unit than that of the comparison unit. The comprehensive energy saving could reach up to 29% on sunny days.
- For further investigation, buildings installed with STPV windows in four typical cities with different climatic conditions in southwest China were simulated and analyzed, and the highest energy saving potential of STPV windows was predicted in Kunming with 54%. Guiyang had the lowest energy saving rate with 24%. The energy saving rate in Chengdu and Lhasa were 30.3% and 34%, respectively.
- According to the simulation results, after buildings were installed with STPV windows, the energy generation of STPV windows was highest in Lhasa at 402.1 kWh/year, while Guiyang had the lowest energy generation at 216.5 kWh. The cooling load of all the buildings was decreased, while the heating and lighting energy consumption increased slightly, owing to the partially blocked solar radiation by STPV windows and different climatic conditions.
The research results in this paper could be contributed to support optimal BIPV design in Southwest China.
Author Contributions
Conceptualization, and Writing-Original Draft Preparation, H.T.; Writing-Review and Editing, W.Z.; Project Administration, L.X.; Methodology, Y.W. and Y.S.; Experiment, W.W., X.W. and M.C.
Funding
The project is funded by National Key Research and Development Program of China: Newton Fund–China–UK Research and Innovations Bridges (No. 2016YFE0124500).
Conflicts of Interest
The authors declare no conflict of interest.
References
- Outline of 13th Five-Year Plan in China. 2016. Available online: https://wenku.baidu.com/view/aff4d13be418964bcf84b9d528ea81c758f52edc.html (accessed on 1 September 2018).
- Tang, Y. The integration of photovoltaic building ushered in the development of spring. Urban Hous. 2009, 12, 56–59. [Google Scholar]
- Wang, M.; Peng, J.; Li, N.; Lu, L.; Yang, H. Experimental Study on Thermal Performance of Semi-transparent PV Window in Winter in Hong Kong. Energy Procedia 2017, 105, 864–868. [Google Scholar] [CrossRef]
- Xiao, Y.; Li, D. Application status and development trend of solar photovoltaic building integration. Energy Saving 2010, 29, 12–18. [Google Scholar]
- Zhao, M.; Kunzel, H.M.; Antretter, F. Parameters influencing the energy performance of residential buildings in different Chinese climate zones. Energy Build. 2015, 96, 63–75. [Google Scholar] [CrossRef]
- Fung, T.Y.Y.; Yang, H. Study on thermal performance of semi-transparent building-integrated photovoltaic glazings. Energy Build. 2007, 40, 341–350. [Google Scholar] [CrossRef]
- Martín-Chivelet, N.; Guillén, C.; Trigo, J.F.; Herrero, J.; Pérez, J.J.; Chenlo, F. Comparative Performance of Semi-Transparent PV Modules and Electrochromic Windows for Improving Energy Efficiency in Buildings. Energies 2018, 11, 1526. [Google Scholar] [CrossRef]
- Martín-Chivelet, N.; Gutiérrez, J.C.; Alonso-Abella, M.; Chenlo, F.; Cuenca, J. Building Retrofit with Photovoltaics: Construction and Performance of a BIPV Ventilated Façade. Energies 2018, 11, 1719. [Google Scholar] [CrossRef]
- Costanzo, V.; Yao, R.; Essah, E.; Shao, L.; Shahrestani, M.; Oliveira, A.C.; Araz, M.; Hepbasli, A.; Biyik, E. A method of strategic evaluation of energy performance of Building Integrated Photovoltaic in the urban context. J. Clean. Prod. 2018, 184, 82–91. [Google Scholar] [CrossRef]
- Cucchiella, F.; D’Adamo, I.; Lenny Koh, S.C. Environmental and economic analysis of building integrated photovoltaic systems in Italian regions. J. Clean. Prod. 2015, 98, 241–252. [Google Scholar] [CrossRef]
- Myong, S.Y.; Jeon, S.W. Effcient outdoor performance of esthetic bifacial a-Si: H semi-transparent PV modules. Appl. Energy 2016, 164, 312–320. [Google Scholar] [CrossRef]
- Skandalos, N.; Karamanis, D. PV glazing technologies. Renew. Sustain. Energy Rev. 2015, 49, 306–322. [Google Scholar] [CrossRef]
- Wong, P.W.; Shimoda, Y.; Nonaka, M.; Inoue, M.; Mizuno, M. Semi-transparent pv: thermal performance, power generation, daylight modelling and energy saving potential in a residential application. Renew. Energy 2008, 33, 1024–1036. [Google Scholar] [CrossRef]
- Liao, W.; Shen Xu, S. Energy performance comparison among see-through amorphous silicon PV (photovoltaic) glazings and traditional glazings under different architectural conditions in China. Energy 2015, 83, 267–275. [Google Scholar] [CrossRef]
- He, W.; Zhang, Y.X.; Sun, W.; Hou, J.X.; Jiang, Q.Y.; Ji, J. Experimental and numerical investigation on the performance of amorphous silicon photovoltaics window in East China. Build. Environ. 2011, 46, 363–369. [Google Scholar] [CrossRef]
- Wang, M.; Peng, J. Comparison of energy performance between PV double skin facades and PV insulating glass units. Appl. Energy 2017, 194, 148–160. [Google Scholar] [CrossRef]
- Chow, T.-T.; Qiu, Z.; Li, C. Potential application of “see-through” solar cells in ventilated glazing in hong kong. Sol. Energy Mater. Sol. Cells 2009, 93, 230–238. [Google Scholar] [CrossRef]
- Peng, J.; Curcija, D.C.; Lu, L.; Selkowitz, S.E.; Yang, H.; Zhang, W. Numerical investigation of the energy saving potential of a semi-transparent photovoltaic double-skin facade in a cool-summer mediterranean climate. Appl. Energy 2016, 165, 345–356. [Google Scholar] [CrossRef]
- Vartiainen, E.; Peippo, K.; Lund, P. Daylight optimization of multifunctional solar facades. Solar Energy 2000, 68, 223–235. [Google Scholar] [CrossRef]
- Olivieri, L.; Caamaño-Martin, E.; Olivieri, F.; Neila, J. Integral energy performance characterization of semi-transparent photovoltaic elements for building integration under real operation conditions. Energy Build. 2014, 68, 280–291. [Google Scholar] [CrossRef] [Green Version]
- China Academy of Building Research. Design Code for Heating Ventilation and Air Conditioning of Civil Buildings; China Academy of Building Research: Beijing, China, 2016; pp. 12–20. [Google Scholar]
- Manual for Outdoor PV Test System. 2018. Available online: http://www.ei41.com/Home/JSZC_Search? openPartTypeName =jishuzhichi_chanpinziliao (accessed on 15 March 2018).
- Zhang, W.; Lu, L.; Peng, J.; Song, A. Comparison of the overall energy performance of semi-transparent photovoltaic windows and common energy-efficient windows in Hong Kong. Energy Build. 2016, 128, 511–518. [Google Scholar] [CrossRef]
- Method of Daylighting Measurement; Standardization Administration of China: Beijing, China, 2017.
- ASHRAE. Ashrae Guideline 14-2014: Measurement of Energy Demand and Savings; American Society of Heating: Atlanta, GA, USA, 2014. [Google Scholar]
- Solar and Wind Energy Resource Assessment (SWERA). 2018. Available online: https://energyplus.net/weather (accessed on 31 April 2018).
Figure 1.
Window integrated with different types of PV cell materials. (a) c-Si (b) a-Si.
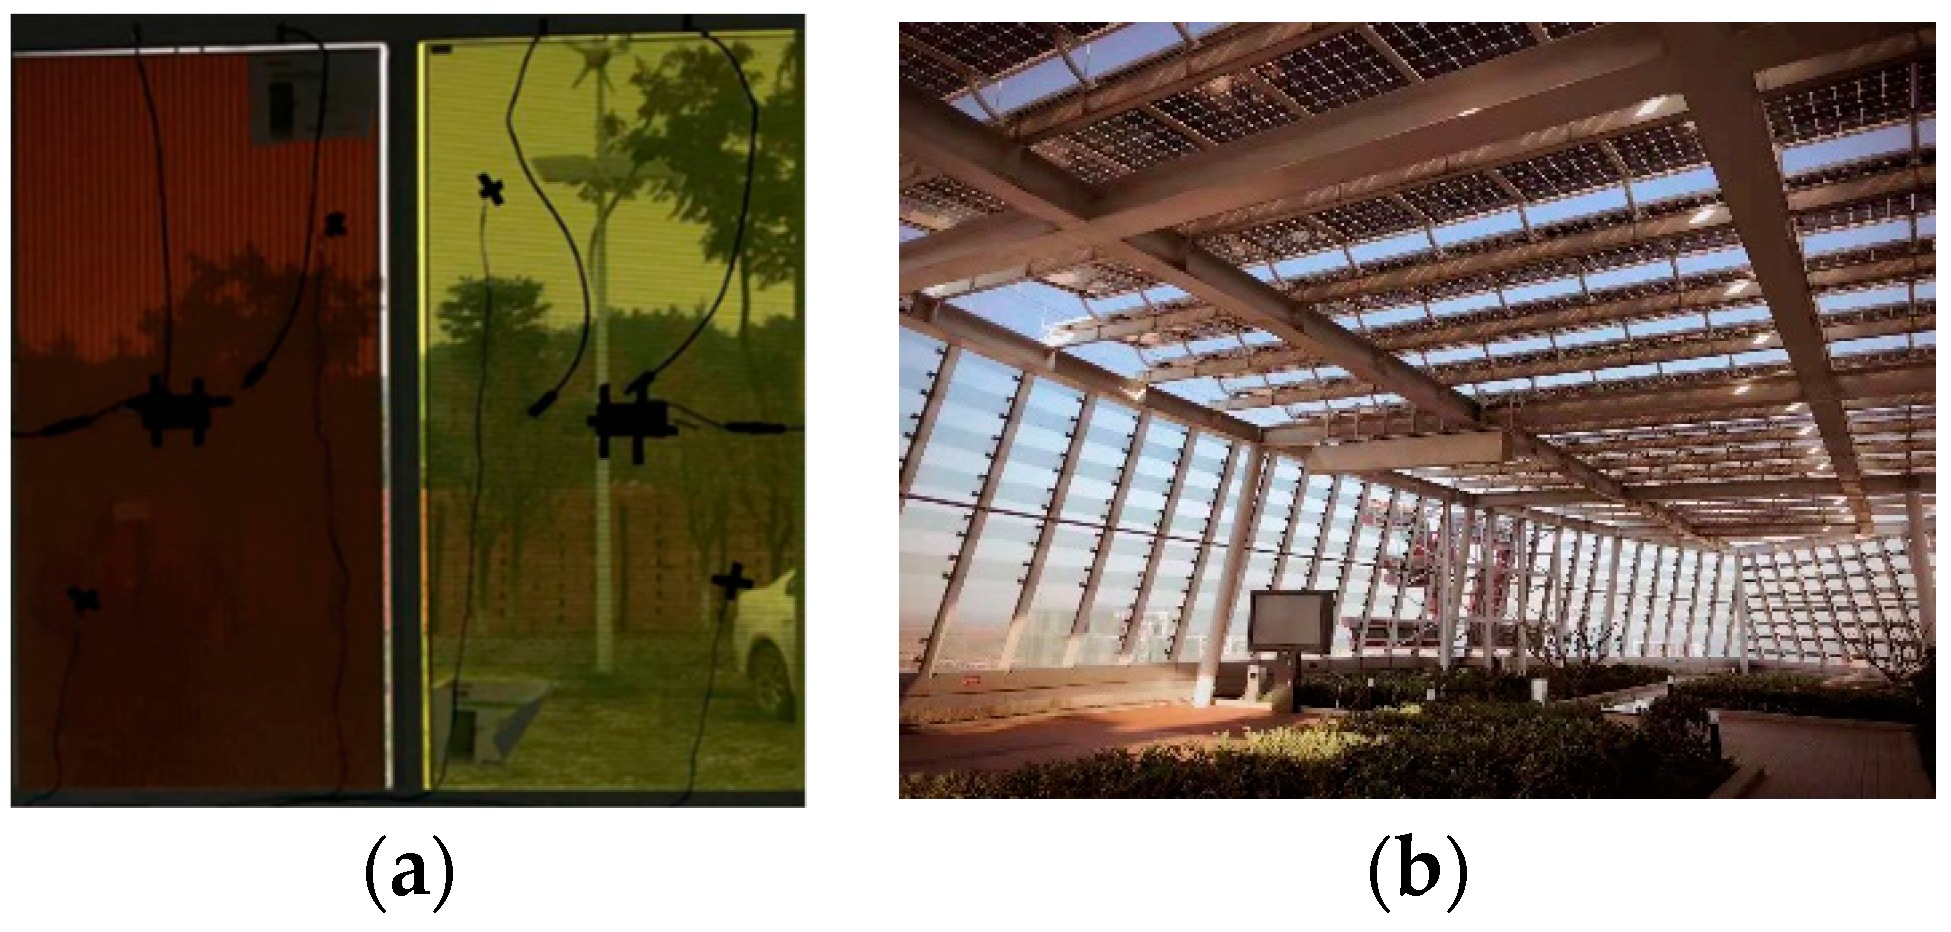
Figure 2.
Schematic diagram of double-skin STPV window.
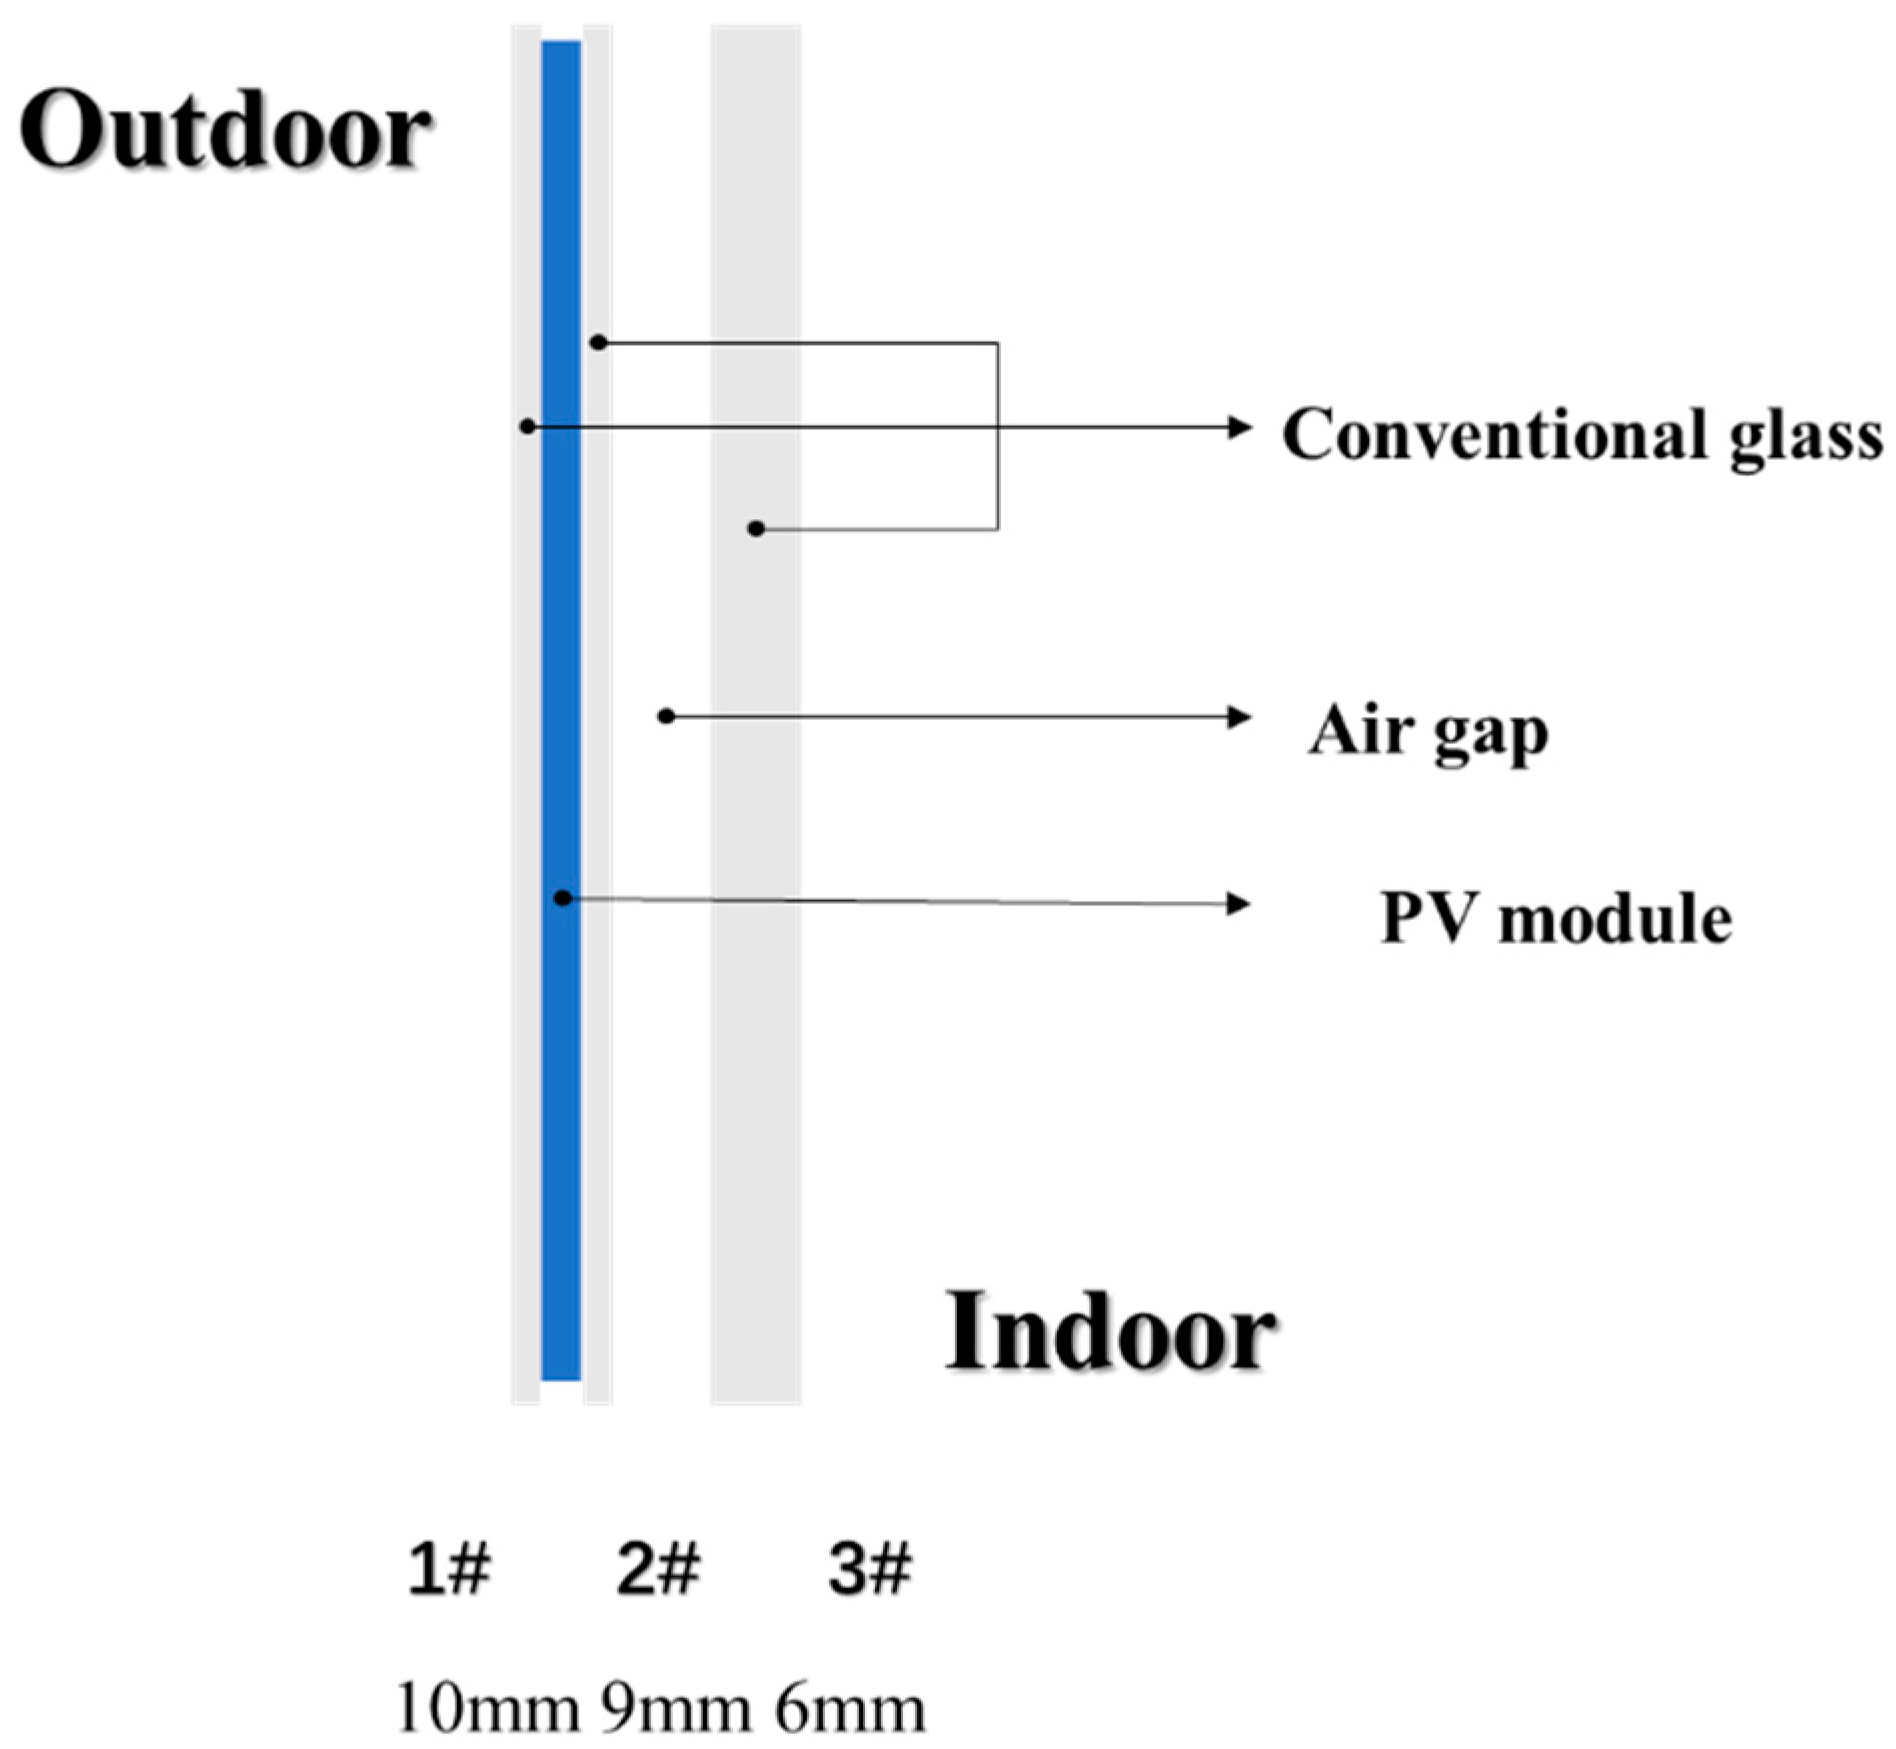
Figure 3.
The (a) outside and (b) inside of the test rig.
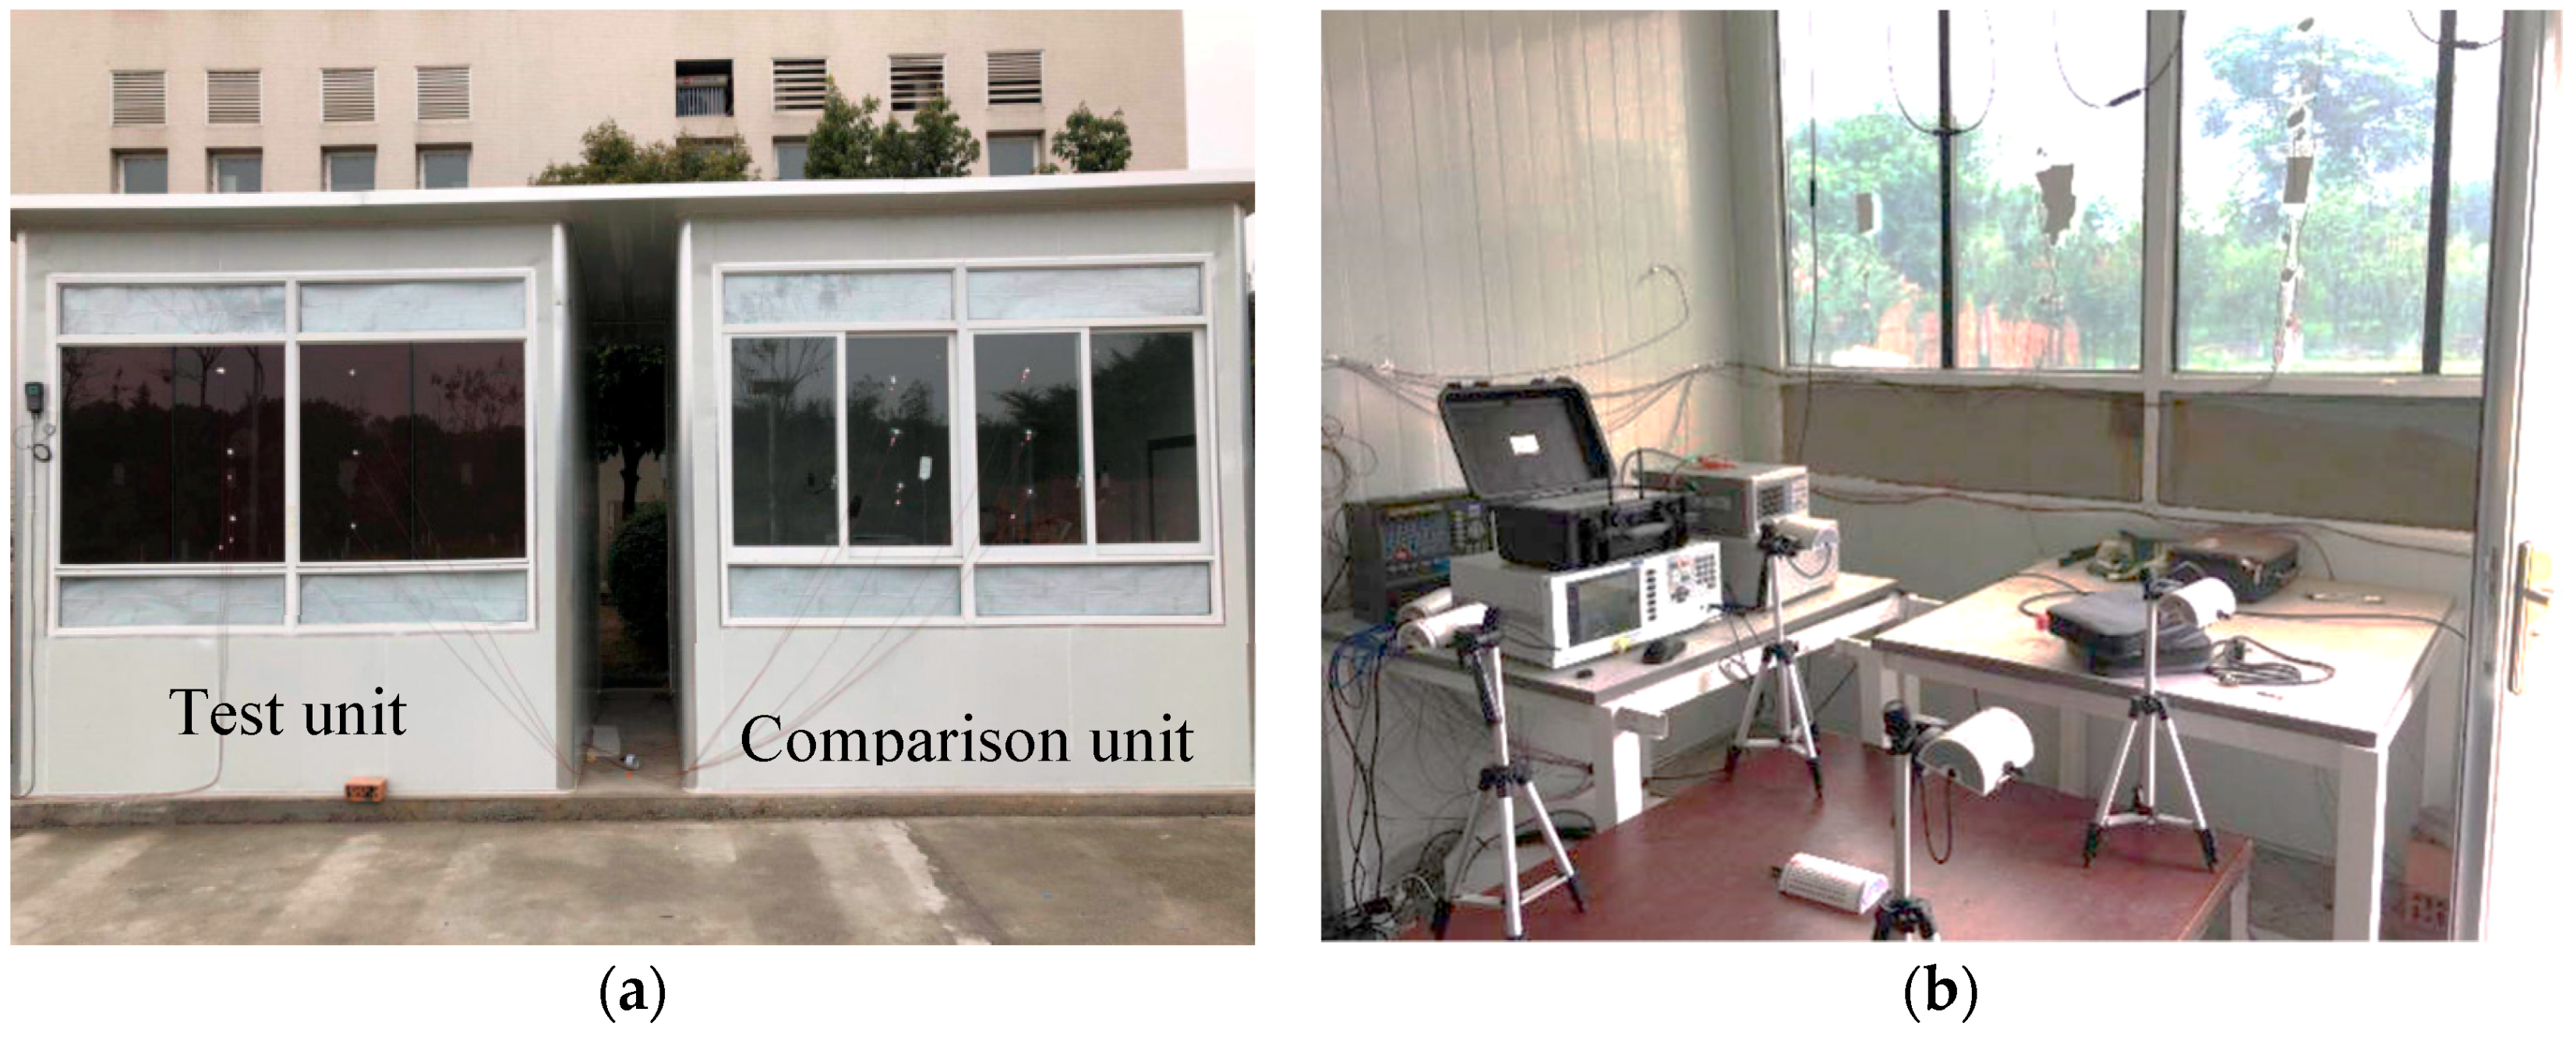
Figure 4.
Energy saving test instruments for STPV modules, (a) air-conditioning electricity consumption recorder; (b) lighting electricity consumption recorder.
Figure 4.
Energy saving test instruments for STPV modules, (a) air-conditioning electricity consumption recorder; (b) lighting electricity consumption recorder.

Figure 5.
Room model.

Figure 6.
Air-conditioning electricity consumption on a (a) sunny day, (b) cloudy to sunny day, and (c) a cloudy day.
Figure 6.
Air-conditioning electricity consumption on a (a) sunny day, (b) cloudy to sunny day, and (c) a cloudy day.
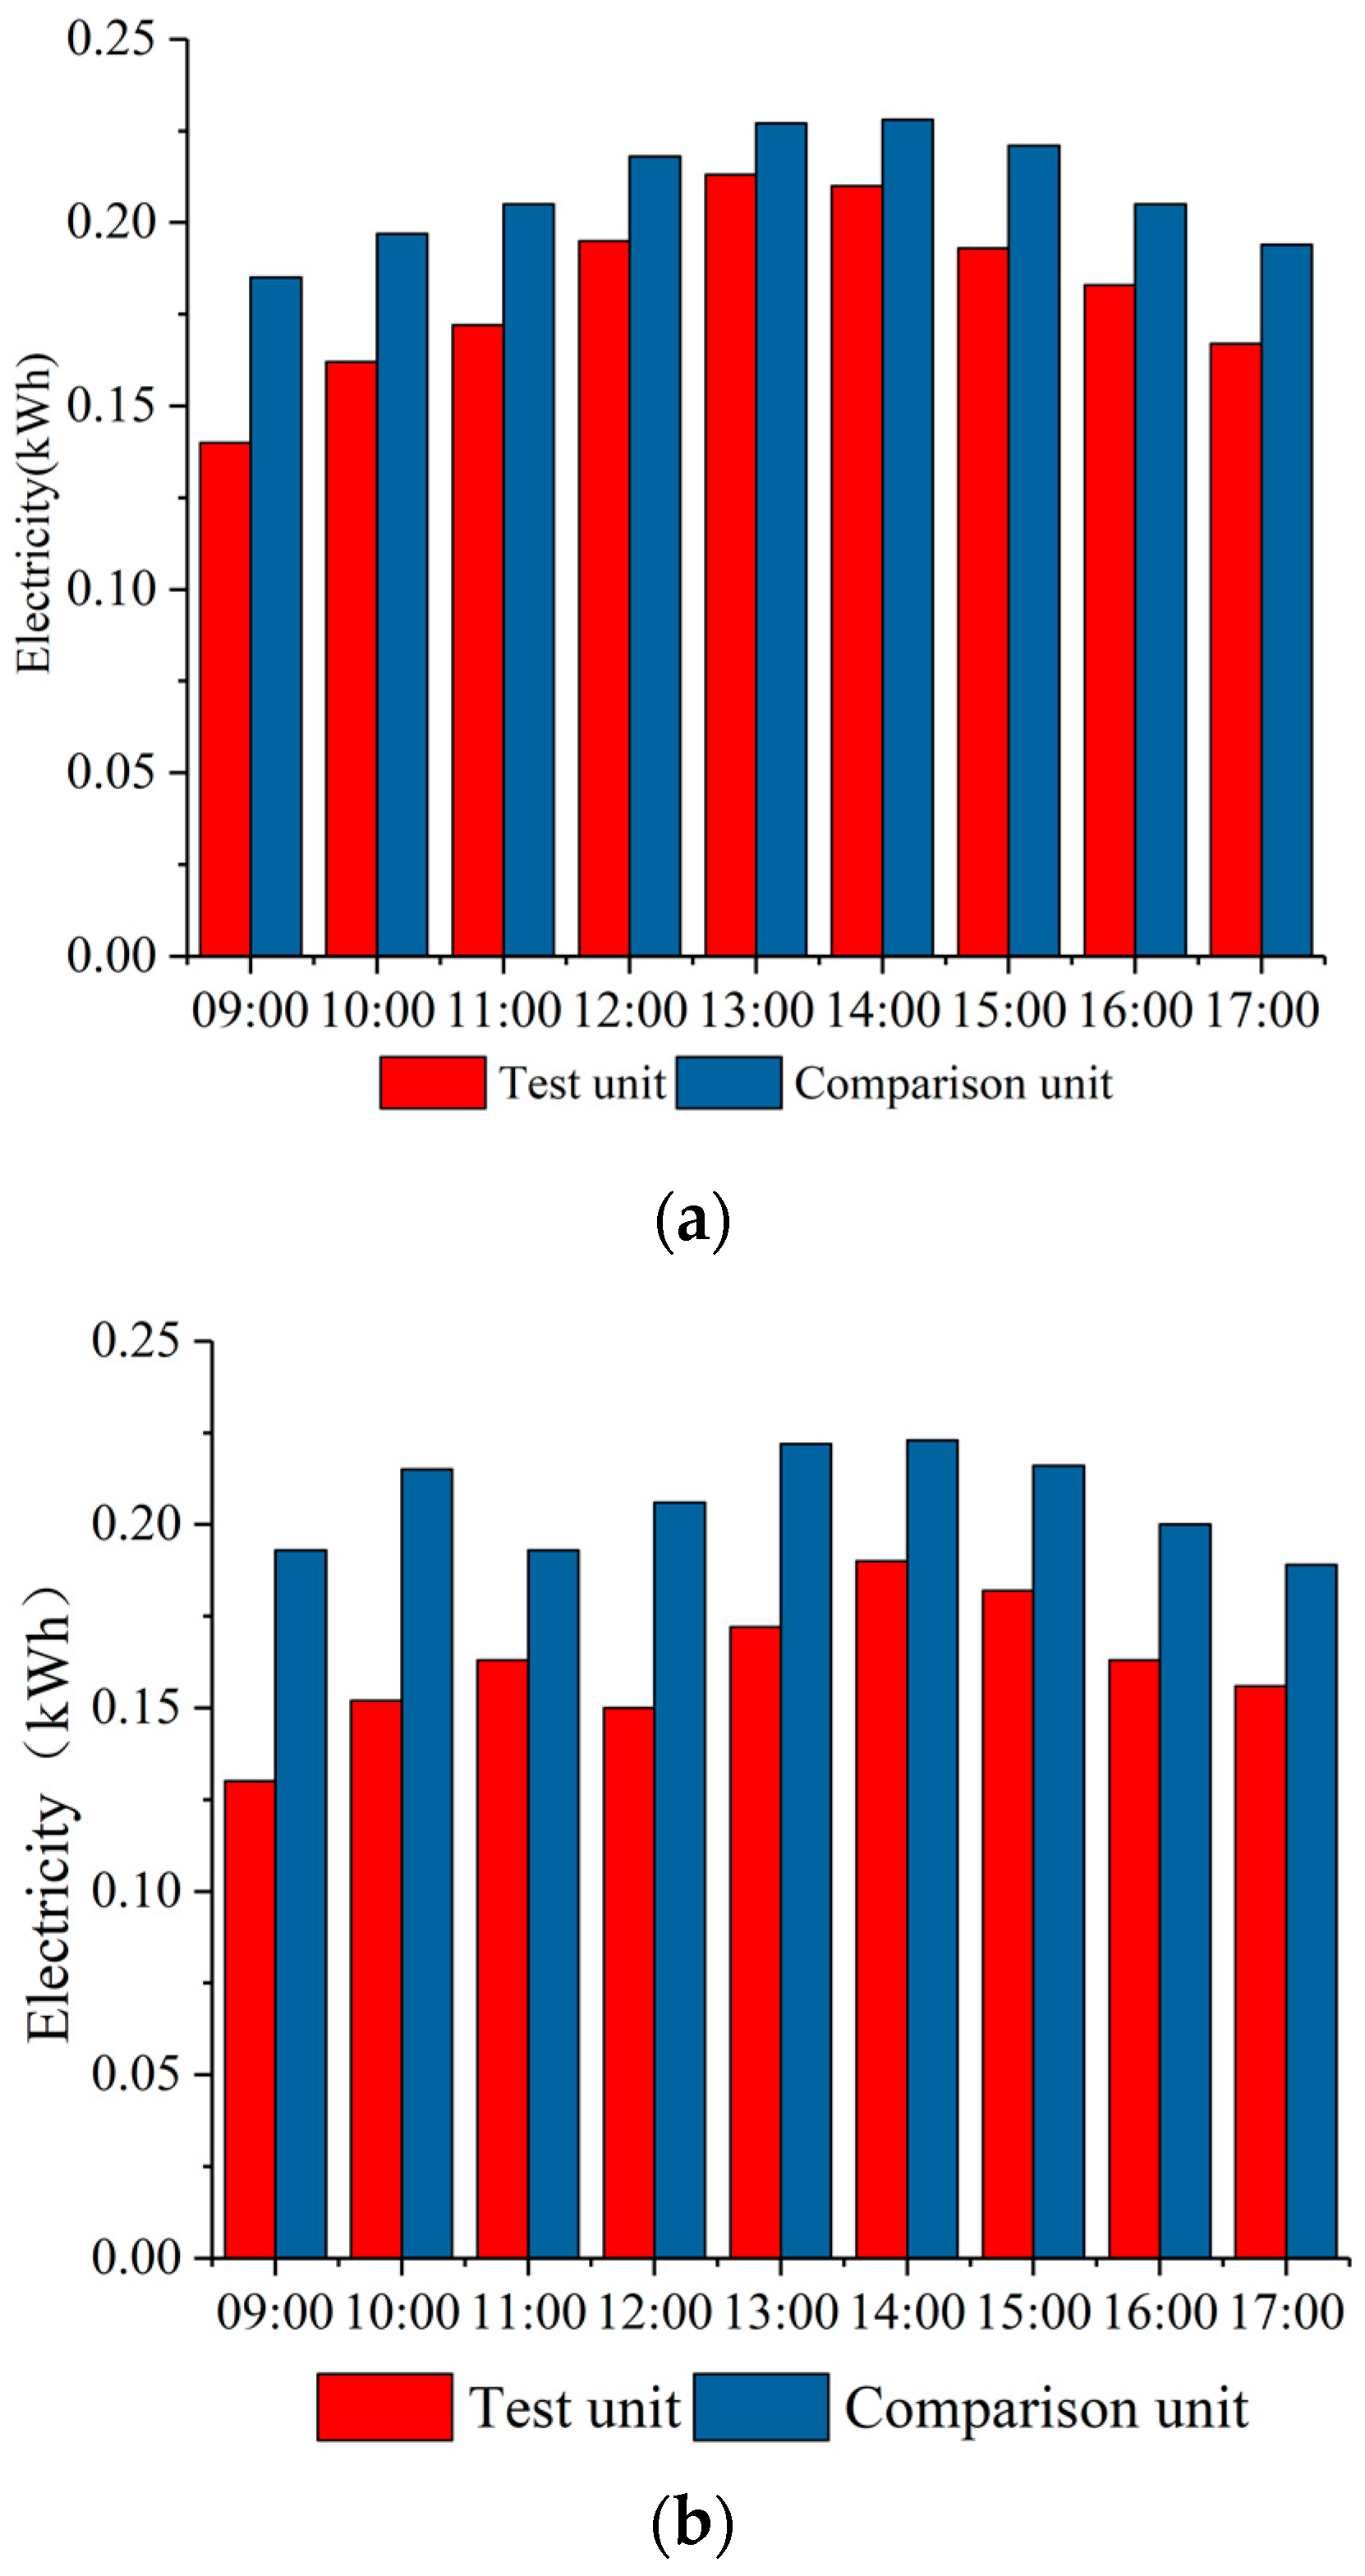

Figure 7.
Energy saving analysis for the two units on (a) sunny day, (b) cloudy to sunny day, and (c) a cloudy day.
Figure 7.
Energy saving analysis for the two units on (a) sunny day, (b) cloudy to sunny day, and (c) a cloudy day.
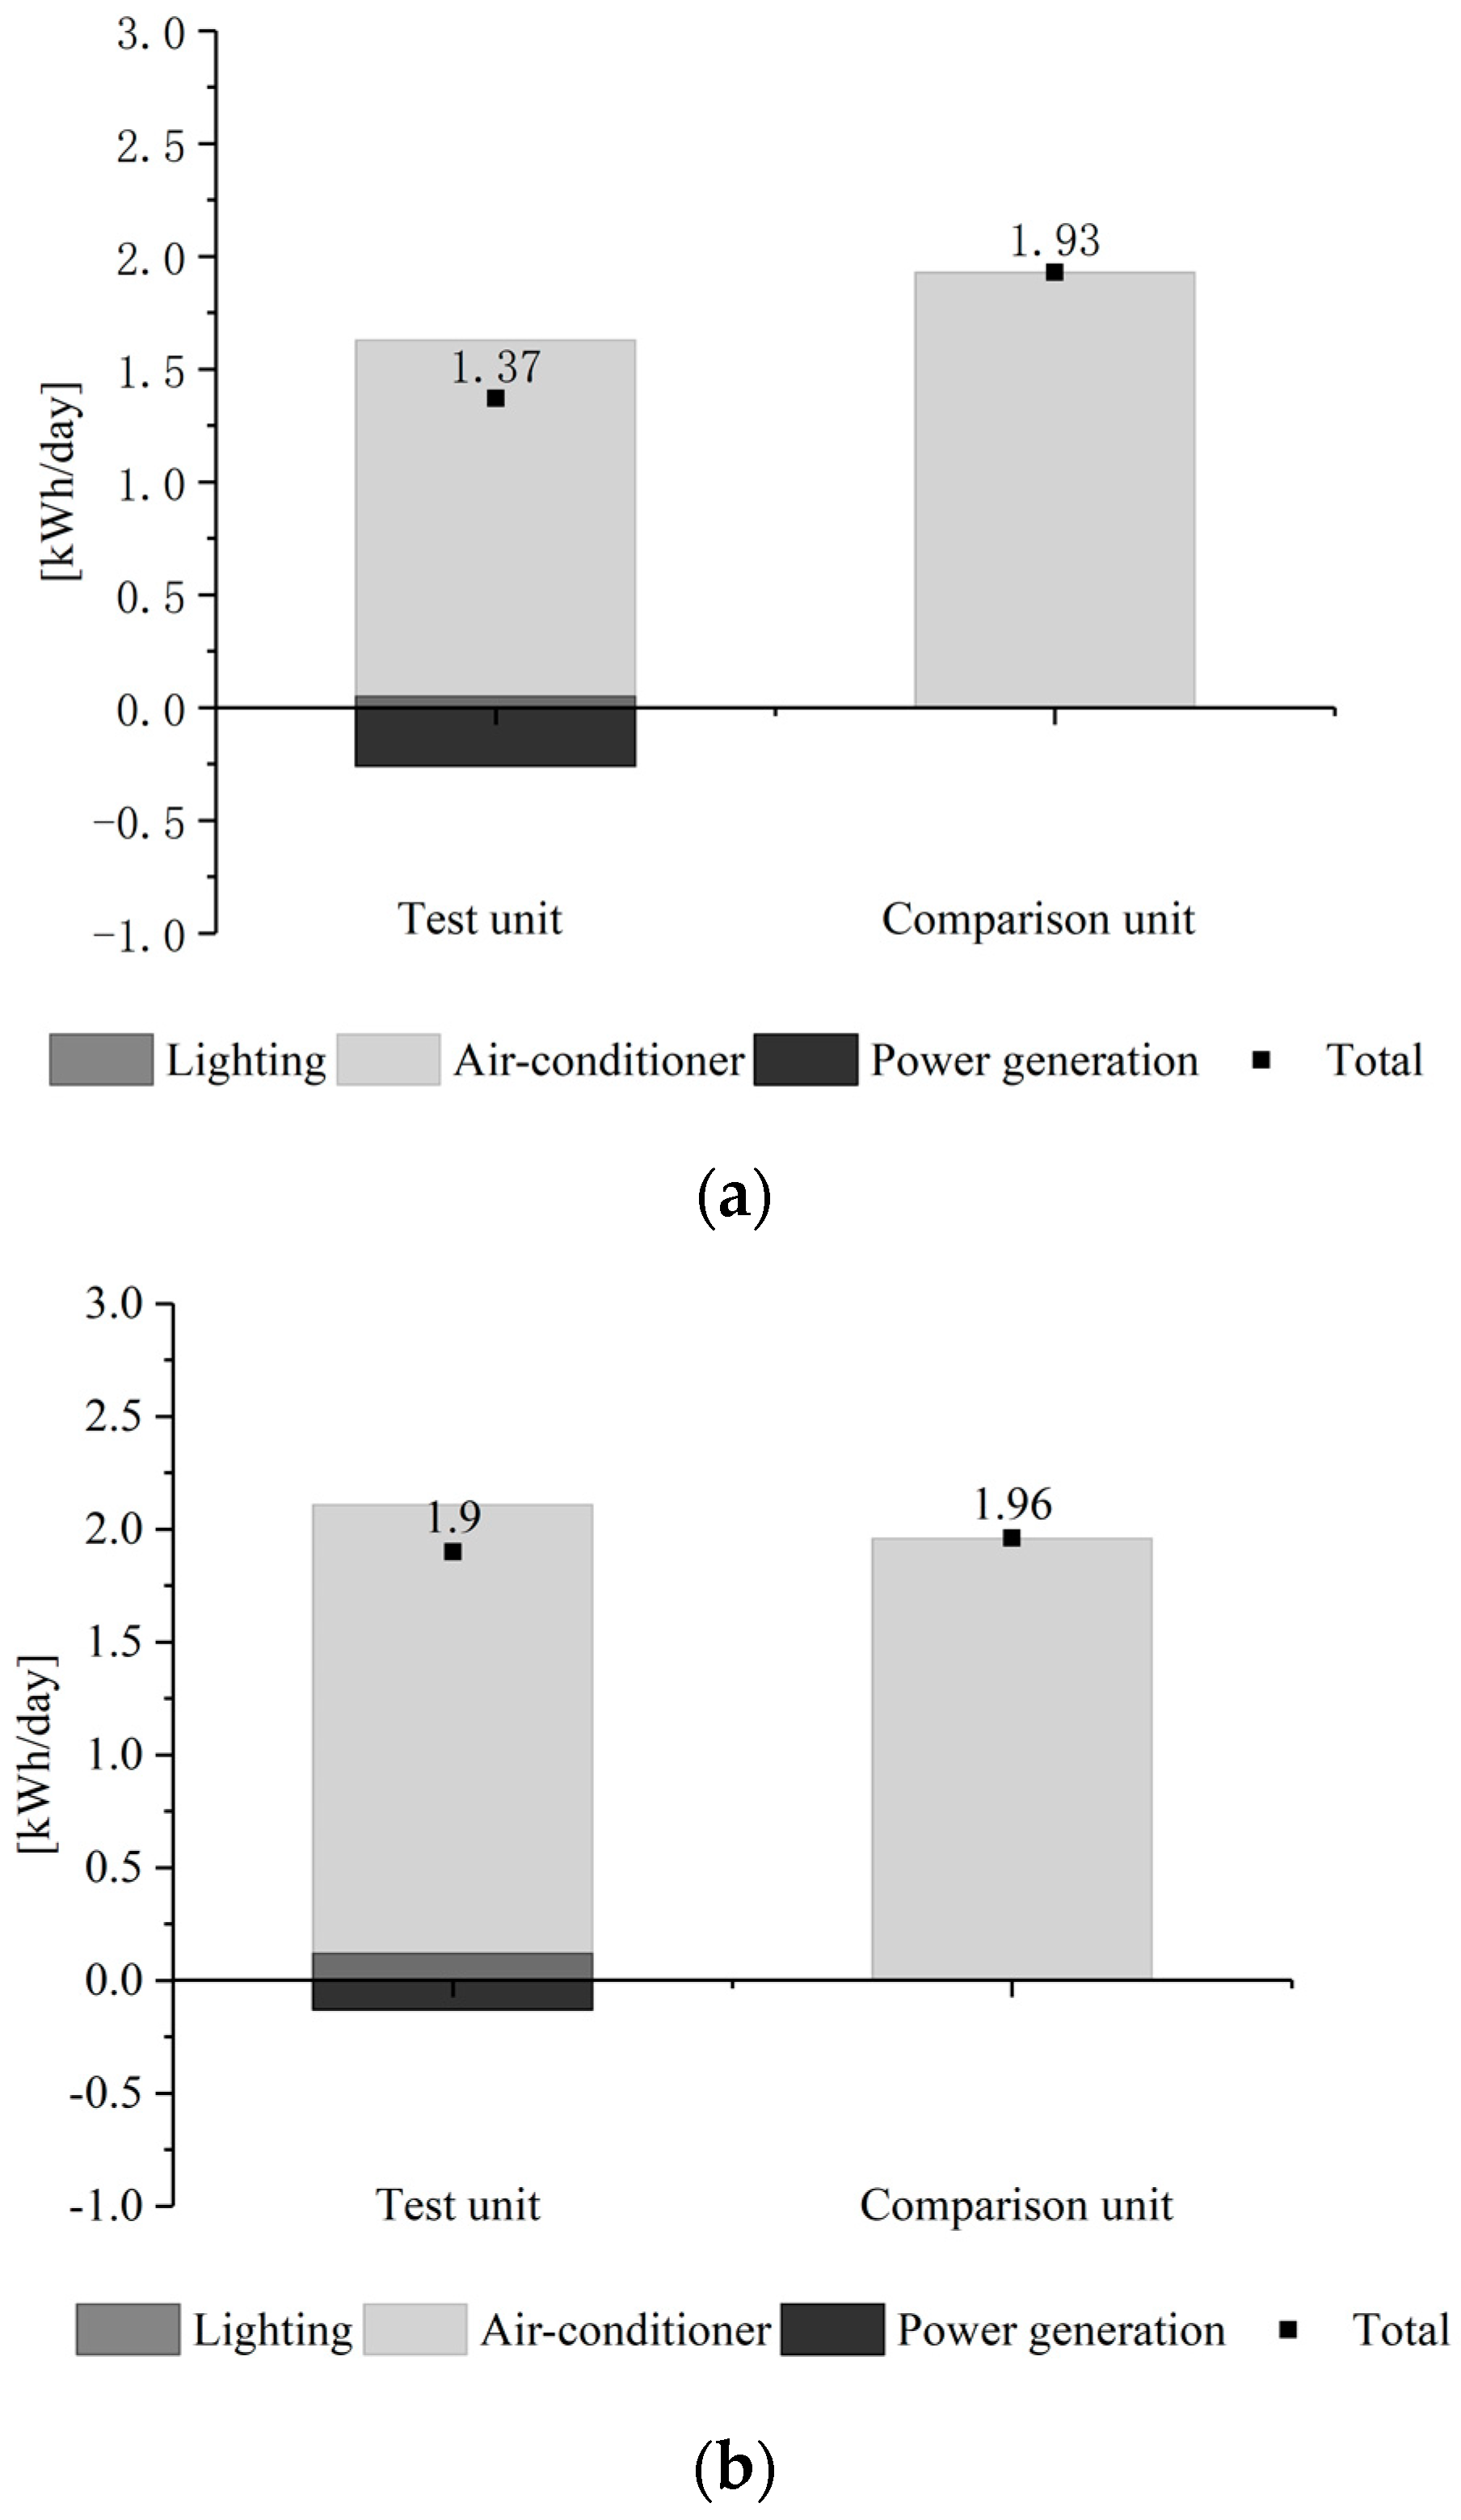

Figure 8.
Energy consumption for two units in different cities.


Table 1.
Physical and electrical properties of STPV window and conventional window.
| a. Physical properties of STPV window | |
| Layer/Property | thickness (mm) |
| Glass-tempered | 6 |
| Air gap | 9 |
| Single STPV window | 10 |
| b. Physical properties of conventional window | |
| Layer/Property | thickness (mm) |
| Glass-tempered | 8 |
| Air gap | 9 |
| Glass-tempered | 8 |
| c. Electrical properties of STPV window | |
| PV module type | a-SiGe |
| Maximum power under STC (W) | 50 |
| Photoelectric conversion rate | 6.7% |
| d. Other properties of windows | |
| Dimension of each STPV window and conventional window | 1.24 m (L) × 0.64 m (W) |
| Visible transmittance of the STPV window | 20% |
| Weight density of the double-skin STPV window | 40 kg/m2 |
Table 2.
The key instruments and their specifications.
| Equipment | Manufacturer | Function and Model | Range/Sensitivity | Number |
|---|---|---|---|---|
| Outdoor multi-channel PV test equipment | Ceyear AV6595A | PV testing (three 500 W module and one 10 kW module) | 0 W–10 kW, 1% | 1 |
| Solar radiation test equipment | AV87110 | Testing the solar radiation upon the south façade | 0–1800 W/m2; ±3% | 1 |
| Weather station | J.t | Weather condition recorder | Temperature: ±0.5 °C, humidity: 0.1%, ±2%; atmospheric pressure: 1 mbar; wind rate: 0.1 m/s; wind direction: ±5% | 1 |
| Multi-channel data recorder | J.t | Data collector | The minimum resolutions are 1 μV and 0.1 °C | 1 |
| Thermocouples | J.t | Temperature test (T type thermocouple) | −20 °C–100 °C; 0.1 °C; ±0.5 °C | 24 |
| Light meter | J.t | - | 0–100,000 lux; 1 lux; ±4% | 8 |
| Electricity recorder | BULL | Record electricity consumption | 0–3000W, ±1% | 4 |
Table 3.
Lighting test results.
| Test unit | ||||
| Date | Weather | Maximum illuminance | Average illuminance | Total lighting electricity consumption |
| 21st June | Sunny | 1205 lx | 983 lx | 0 kWh |
| 22nd June | Cloudy to sunny | 1078 lx | 763 lx | 0.1 kWh |
| 23rd June | Cloudy | 419 lx | 207 lx | 0.3 kWh |
| Comparison unit | ||||
| Date | Weather | Maximum illuminance | Average illuminance | Total lighting electricity consumption |
| 21st June | Sunny | 3505 lx | 2683 lx | 0 kWh |
| 22nd June | Cloudy to sunny | 2178 lx | 1763 lx | 0 kWh |
| 23rd June | Cloudy | 2119 lx | 832 lx | 0 kWh |
| Difference from test and comparison unit | ||||
| Date | Weather | Maximum illuminance | Average illuminance | Total lighting electricity consumption |
| 21st June | Sunny | 34% | 36% | - |
| 22nd June | Cloudy to sunny | 49% | 43% | - |
| 23rd June | Cloudy | 19% | 24% | - |
Table 4.
Radiation and temperature of four cities.
| Locations | Climatic Zone | Global Solar Radiation (MJ/m2) | Average Temperature in Summer (°C) | Average Temperature in Winter (°C) |
|---|---|---|---|---|
| Chengdu/Capital of Sichuan | Hot Summer Cold Winter | 6.67 | 27.8 | 5 |
| Guiyang/Capital of Guizhou | Hot Summer Cold Winter | 10.72 | 23.2 | 4.6 |
| Lhasa/Capital of Tibet | Cold Zone | 21.92 | 15.5 | 1 |
| Kunming/Capital of Yunnan | Temperate | 18.91 | 20 | 10 |
© 2018 by the authors. Licensee MDPI, Basel, Switzerland. This article is an open access article distributed under the terms and conditions of the Creative Commons Attribution (CC BY) license (http://creativecommons.org/licenses/by/4.0/).
Share and Cite
MDPI and ACS Style
Tian, H.; Zhang, W.; Xie, L.; Wu, Y.; Sun, Y.; Chen, M.; Wang, W.; Wu, X. Study on the Energy Saving Potential for Semi-Transparent PV Window in Southwest China. Energies 2018, 11, 3239. https://doi.org/10.3390/en11113239
AMA Style
Tian H, Zhang W, Xie L, Wu Y, Sun Y, Chen M, Wang W, Wu X. Study on the Energy Saving Potential for Semi-Transparent PV Window in Southwest China. Energies. 2018; 11(11):3239. https://doi.org/10.3390/en11113239
Chicago/Turabian StyleTian, Hao, Wei Zhang, Lingzhi Xie, Yupeng Wu, Yanyi Sun, Mo Chen, Wei Wang, and Xinwen Wu. 2018. "Study on the Energy Saving Potential for Semi-Transparent PV Window in Southwest China" Energies 11, no. 11: 3239. https://doi.org/10.3390/en11113239
Note that from the first issue of 2016, this journal uses article numbers instead of page numbers. See further details here.