Abstract
This article focuses on the minimization of operational cost and optimal power dispatch associated with microgrids coupled with natural gas networks using particle swarm optimization (PSO). Introducing a natural gas turbine in a microgrid to overcome the drawbacks of renewable energy resources is a recent trend. This results in increased load and congestion in the gas network. To avoid congestion and balance the load, it is necessary to coordinate with the electric grid to plan optimal dispatch of both interactive networks. A modification is done in applying PSO to solve this coupled network problem. To study the proposed approach, a 7-node natural gas system coupled with the IEEE bus 33 test system is used. The proposed strategy provides the optimal power dispatch. Moreover, it indicates that power sharing between the main grid and microgrid is reduced in such a way that it may help the main grid to shave the load curve peaks.
1. Introduction
Technological advancement in the past decade such as combined cycle natural gas-powered generation and recent policies are reshaping the primary energy networks. Meanwhile, electricity networks are transforming from being centralized toward decentralized to become more secure, independent and environmentally benign. The distributed electric networks are a promising approach to accommodate a larger share of renewable energy sources (RES), e.g., photovoltaic and wind power generation. RESs cause power fluctuations in the electricity grid, which are a concern for the reliability and power quality of the system and supposed to be compensated by the main grid [1]. In the meantime, current global policies are encouraging more gas and electric power network integration. The new integration of these two-networks is becoming a popular approach for upcoming distributed and Integrated Energy Systems (IES) [2,3]. In the IES, a gas-powered turbine performs the role of coupling gear. This coupling component can increase the reliability and power quality of the electric system because it has greater inertia and faster response. Due to these advantages, countries around the globe are paying more attention to energy network coupling strategies, e.g., China has approved more integration of energy networks in its 13th Five-Year Development Plan (2016–2020). According to this plan, by 2020 the total capacity of electricity generation by natural gas will exceed 110 gigawatts. This growing size and increasing share of gas-powered generation will have a significant effect on both networks. Moreover, in some parts of the world both energy networks, electricity and natural gas, are operated by a single company, e.g., in Great Britain.
As per the review article [4], general microgrid management or control schemes can be categorized on three levels; (1) primary; (2) secondary; (3) tertiary. These three levels of control are based on the response speed and infrastructure. The first one, primary control, deals with voltage and frequency regulation. The second one, secondary control, which is also called an energy management system (EMS), deals with the reliability and economical operation of a microgrid. The third one, tertiary control, deals with grids interacting with main grid and other grids. The problem addressed in this article falls in the secondary control level category.
Microgrid optimal power dispatch problems belong to the mixed integer nonlinear programming classification. This problem’s objective function will possibly involve second order or higher order polynomial equations for the cost functions. It can also include complex system constraints related to a variety of renewable energy resources and loads.
So far, several researchers have focused their attention to this issue using a lot of different techniques to solve this problem. The authors in [5] noticed the congestion in gas networks and tried to solve this problem by adjusting the electricity network. Optimal energy flow in electricity and the natural gas coupled network was discussed in [6,7]. An attempt to reduce the total operational cost is done in [8], where the authors combined two methods; the interior and Newton’s method, to perform the optimization. The Newton Raphson method was used to solve the problem under discussion in [9]. A similar technique is used in [10], where the authors also used the Newton Raphson method and multi-objective optimization using adaptive-covariance and Levy-flights (MGSO-ACL). The former method is also used by [11] for coordinated operation of gas and electricity coupled networks. In [12] the authors have done a steady-state analysis, including district heating, and tried to solve the problem using the Newton-Raphson method. To solve the problem via heuristic optimization methods, Ant Colony Optimization is presented in [13] and genetic algorithms in [14,15]. In [16], a hybrid genetic algorithm is presented to solve the economic dispatch problem.
Some of these techniques are not appropriate if a carbon-tax or pollution treatment cost is included. In this situation, the Integrated Energy System’s (IES) problem falls in the multi-objective optimization category. The multi-objective function with heuristic optimization methods is studied in [17,18,19].
Comparisons of a few popular optimization methods used to solve the IES dispatch problem are discussed in [4,20,21,22]. The superiority of particle swarm optimization (PSO) is proven in terms of finding the most optimal operational cost of IES [22]. In [20,23] authors did complex modification in PSO to make it converge faster and consume less computation time. In [24] hybrid swarm intelligence is proposed for optimal power dispatch. A standalone grid’s operational economy is optimized using a modified PSO in [25]. To do hourly optimal electric load flow of a microgrid having renewable energy sources (RES), the authors in [26,27] chose PSO. In another article [28], the optimal flow problem of a microgrid having PV, wind, combined heat and power (CHP), electric vehicles (EVs) and energy storage system is solved using PSO. A recent review article [22], which covered optimization approaches for distributed energy system, claims that AI techniques are dominating to solve the problem under discussion and among these popular AI techniques, PSO is the most commonly used method.
In previous studies, most of the researchers considered running or operational cost only. Pollution emission penalties or treatment costs are ignored and not included in the optimization function. Moreover, most of the researchers used a barrier or interior point method based on linear or nonlinear optimization to solve the coupled energy network problem. In this article, the authors’ objective is to optimize operational cost including some pollution emission penalty or pollution treatment cost. To do so, the authors formulated this operational cost optimization problem as a multi-objective problem. From the discussion in the above paragraphs, the authors concluded that particle swarm optimization (PSO) is one of the best-recommended techniques in the literature to solve this type of optimization problem. Moreover, PSO is well understood, easy to implement and easy to modify. Therefore, PSO has been chosen to solve the optimization problem and a modification has been done in applying PSO to make it converge much faster to save computation time. A convergence test was carried out to find convergence speed and the sufficient number of iterations to find the desired solution. After that, the results are matched with the pre-optimization operational cost to prove the effectiveness of the proposed technique. Furthermore, the microgrid became more reliable and its power-sharing with main grid reduced in such a pattern that it also helped main grid to smoother its load curve. This paper is organized as follows: in Section 2, an electricity and natural gas networks’ model is formulated. In Section 3 the dispatch strategy is described. A case study is presented in Section 4, and in Section 5 simulation results of the proposed strategy are presented.
2. Modeling of Integrated Energy System
The abstract illustration in Figure 1 shows the energy flow in an Integrated Energy System (IES). Here different components of the IES can be seen. Arrow signs show the direction of energy flow. The single head arrows show that energy can flow only in one direction, similarly, dual head arrows show energy can flow in both directions. Further details and mathematical model of these components are formulated in the following paragraphs.
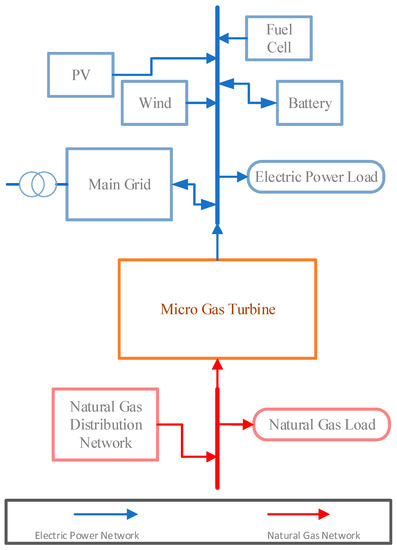
Figure 1.
Energy flow in an IES.
2.1. Micro Grid’s (Electricity Network) Component Modeling
The microgrid is connected with the main grid through a point of common coupling (PCC). The distributed energy sources (DERs) in the proposed microgrid discussed in this article can be divided into two types; (1) dispatchable, e.g., controlled dispatch, microturbine, fuel cells and (2) non-dispatchable, e.g., solar and wind-powered generation.
In general, a renewable energy resource (RES), which depends on the natural occurrence, is not very reliable. The reliability can be increased by more precise predictions of the subjected natural occurrence.
2.1.1. Photovoltaic
Photovoltaic (PV) mainly depends on available solar radiation to produce electric power. The power generated by PV can be formulated as follows:
The cost of the power generated can be calculated by the following equation:
In this article, we supposed that as solar PV is not producing any pollution, e.g., NOx or CO2, so is equal to zero.
2.1.2. Wind Turbine
Like PV, wind turbines (WTs) depend on nature-controlled phenomena like the wind speed. There are some other parameters which also affect its performance. Power produced by wind turbines in term of its parameters can be formulated as follows:
The cost of this power produced is given as follows:
As wind turbines do not produce pollution, the pollution coefficient is equal to zero.
2.1.3. Fuel Cell
Fuel cells (FCs) produce electricity through an electrochemical reaction. They are a good choice for the microgrid because they can be easily adjusted accompanied with noiseless operation and low emission. Electric power produced by a FC, , can be expressed by the following equation:
The cost of power generation by a FC can be formulated as follows:
As a FC does not produce any harmful gases, its pollution coefficient is considered zero.
2.1.4. Micro Turbine
The micro turbine (MT) considered here is natural gas turbine, which helps in producing electric power. MT is an important player for the system under discussion, as it is the way in which natural gas and electric network interact with each other. MTs are becoming popular as they can quickly ramp up and ramp down, have a fast start-up, short downtime and less installation time.
Power output from a MT in terms of fuel cost can be written as follows:
A MT also has a maintenance cost , which is related to the power produced. The relation between maintenance cost and power produced is given as follows:
As a MT uses a hydrocarbon-based fuel, during its operation harmful gases (e.g., NOx, CO2, SO2) are also produced. The treatment cost () of these exhaust gases can be written as follows:
Total operational cost of MT () at time t can be calculated as given below:
2.1.5. Batteries
A battery bank is used to store electric power and make it available when needed. Typically, it stores extra power and helps in nullifying fluctuations. Here extra power also includes power from the main grid when its tariff is the cheapest. Battery bank functional cost can be calculated by its main factors, which are listed in the following equation:
In addition to that, there are also some minor factors which affect the battery function, i.e., shelf life, service life, self-discharge. There are some other constraints also considered in battery functionality, i.e., charge and discharge rate, which depend on the charging state, and the lowest discharging level.
2.1.6. Main Grid
The national grid or main grid is one of the most important players of the proposed microgrid. It is supposed that the main grid can have failures caused by external interruptions like the weather or a cascaded shutdown. The most important function of the main grid is to enable the market to sell and purchase electricity to and from microgrid. Other assumptions about the main grid are taken in this article, i.e., the main grid has a time of use (TOU) price tariff, and the main grid already includes a pollution treatment cost or penalty. The selling and buying price-related equations are given below:
where Grid sale price at time t, time of use (TOU) function defines the buying price on an hourly basis using .
Likewise, the following equation explains the buying price:
The main grid has its own limitations, for example, there is a limit to its sale and purchase volume. We have not calculated the pollution cost for the main grid as it is assumed that the pollution penalty is already included in the main grid price.
2.2. Natural Gas Network Modeling
In general, the gas network has a gas source or gas well, pipeline, compressors, interconnection, storage, and gas load. The natural gas flow related equations are described in Osiadacz’s book [29]. The goal of the gas network is to maximize social welfare, which can be done by minimizing operational cost and maximizing utilization.
2.2.1. Pipeline Model
For natural gas, the general flow Equation (14) is derived from energy balance [6]:
where is the flow rate of the pipeline (SCF/h), is the flow direction , F is the friction factor of the pipeline, D is the pipeline diameter (in inches). G is the natural gas specific gravity (natural gas = 0.6), L is the length of the pipeline, is the pressure of node i (psia), is the pressure of node j (psia), is the standard pressure (psia), is the standard temperature, T is the natural gas average temperature, and Z is the average natural gas compressibility factor. Through Equation (14), the pressure drop between two nodes can be measured.
2.2.2. Compressor Model
As per Equation (14), gas flow results in a pressure drop or a pressure difference causes a gas flow. This pressure drop is caused by the loss of energy due to friction. To compensate this pressure-drop, gas compressors are used. Compressors require energy, which can be calculated as per the following Equation (15) [6]:
Compressor horsepower:
where f is the compressor flow rate (psia), is the compressor inlet pressure (psia), is the compressor outlet pressure (psia), Z is the natural gas compressibility factor, is the constant specific heat ratio and is the efficiency of the compressor.
The compressors’ required energy is generated by using gas. For simplicity, we assume that gas flow through a pipeline consumes gas to maintain its pressure. This results in a cost increment of the natural gas as it passes through the compressor.
2.3. Micro Grid and Natural Gas Coupling Constraints
The microturbine is a link between the electric and natural gas network. Both networks have their own operational objective, priorities, and limitations.
For the electricity network, the operational objective is to meet electric load demand with the lowest possible cost:
To do so, first, the network uses its renewable resource. Second, the network uses economical and clean generation, i.e., fuel cells, as well as it gets a benefit from the time of use policy.
For the natural gas network, the operational objective is to be utilized fully without having congestion. First, it is necessary to fulfill the direct gas load and second, to provide rest of available gas capacity to the MT.
The natural gas network first estimates and satisfies the household gas load or heat load. Second, it provides the natural-gas related information to the microturbine of the electricity network. Equations (14) and (15) imply that as the natural gas network approaches its upper capacity limits, the natural gas gets more expensive, because a higher energy ratio is required by the natural gas compressor to pump the gas near its full capacity. Other than the capacity limits, distance is also a cause that increases the natural gas price.
3. Coupled Networks’ Dispatch Strategy
The electricity network tries to operate the microgrids in island-mode without incurring in a cost increment. To do this, the network needs to meet its electric load demand via its renewable resource and storage. To make an efficient dispatch strategy, its renewable power is estimated by forecasting and using maximum power point tracking (MPPT). If the estimated renewable generation is less than estimated electric load, other power sources will be considered, e.g., fuel cells, microturbines, batteries and the main grid. To do so, the PSO algorithm will be used, which will determine which DERs and in what ratio will be the most economical to use. This strategy is summarized in Figure 2.
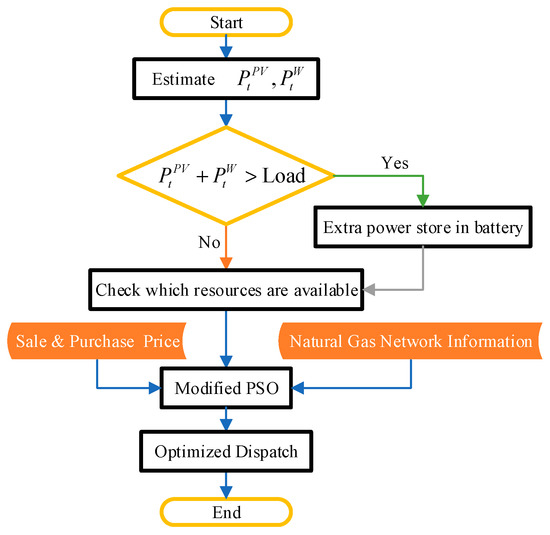
Figure 2.
IES’s dispatch strategy overview.
A brief introduction of the proposed strategy is described in the above paragraphs. The strategy is executed with the help of the PSO algorithm as summarized in Figure 3. The modification is done by limiting the search area. Limitation in the search area is done as per the electricity and natural gas network constraints. For example, for PV, the total expected generated power is calculated by getting weather forecasting information and using MPPT techniques. As this type of produced energy has no significant effect on operating cost, therefore, the PSO algorithm does not need to search the optimized solution because it is already known and the expected calculated power is used in the simulation (Figure 3, step 3). Kennedy [30] introduced the PSO for the first time back in 1995. Later, some modifications have been done in different aspects of the PSO algorithm. Shi [31] added a new variable inertia weight. In [30], Kennedy described that the PSO is based on the observation of natural swarms’ behavior, i.e., a school of fish or a flock of birds. It can be implemented easily. In this algorithm, there are total three global variables; (1) gBest, the best global available solution; (2) stopping criteria and (3) condition or target. This algorithm depends on imaginary particle moments. Each of the particles has three values: (1) the best valid (pBest) solution; (2) velocity and (3) the best local value. Further, there are many topologies for the particles to communicate with each other. The topology used in the algorithm implemented in this article is called fully connected. In this topology, every particle is connected to each other.
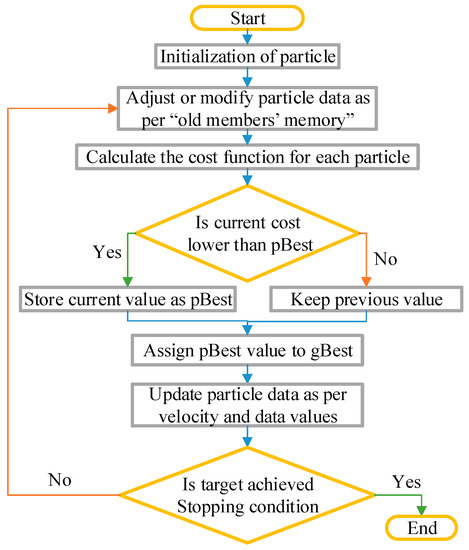
Figure 3.
Flowchart of PSO.
The proposed modification is done in the searching area for the particles, inspired by old and experienced members of the flock or school, who already know the best and worst places to search. By using already known information about the system, the search area can be limited, which makes the algorithm converge much faster and able to find the solution in a shorter time. To validate the assumption, a number of tests are carried out, and it is found that it converges faster compared to the previous unmodified algorithm. The population size of 20, the learning factors c1 and c2 equal to 2 and inertia weight w equal to 0.7, are used throughout the simulations.
In Figure 4, the number of iterations is shown on the x-axis and the best solution per case is given on the y-axis. In this testing environment, the proposed electric and natural gas networks’ data is used. To make it easier to compare the simulation result, the data is normalized. The best available solution in every case is 1. As shown in Figure 4, the algorithm achieved the solution in less than 150 iterations. To make sure, we wouldn’t miss the best solution available, the 350th iteration is set as the stopping criteria in an actual simulation.
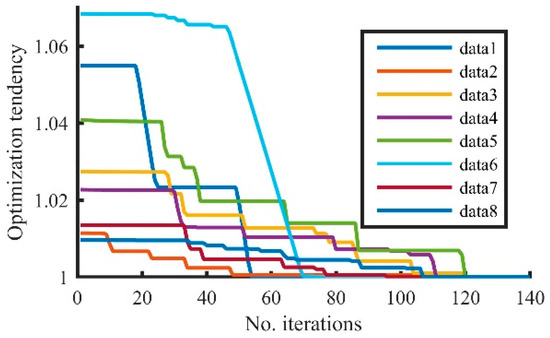
Figure 4.
Conversion test for modified PSO.
4. Case Study
The simulation was done on an IES having a 7-node natural gas system coupled with the IEEE bus 33 test system. The structure for these networks can be seen in the following Figure 5 and Figure 6. The electricity network parameters are given in Table 1, and the natural gas network parameters are given in Table 2. This study is focused on a residential microgrid.
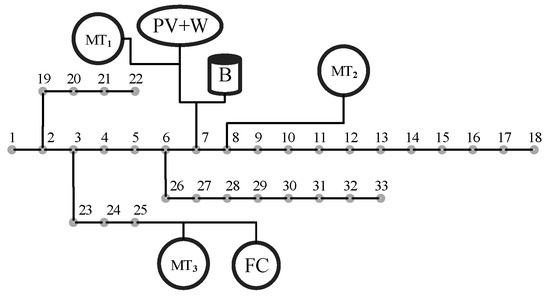
Figure 5.
IEEE bus 33 with DERs.
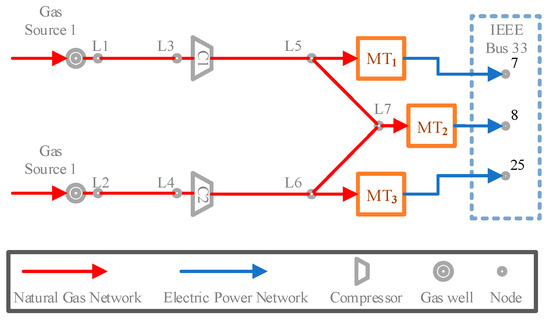
Figure 6.
Natural gas network.

Table 1.
Microgrid’s DER and load parameters.
Table 2.
Gas network parameters.
In the simulation, the main grid, which is also called national grid, does electricity trading as per a Time of Use price (TOU) policy. The trading price has three intervals: (1) lower price; (2) normal price and (3) higher price. As shown in Figure 7. The first interval lasts from 0:00 to 8:00 h. The second interval lasts from 9:00 to 11:00 and 17:00 to 19:00 h. The third interval lasts from 12:00 to 16:00 and 20:00 to 24:00 h. The main grid also has a difference in its selling and buying price.
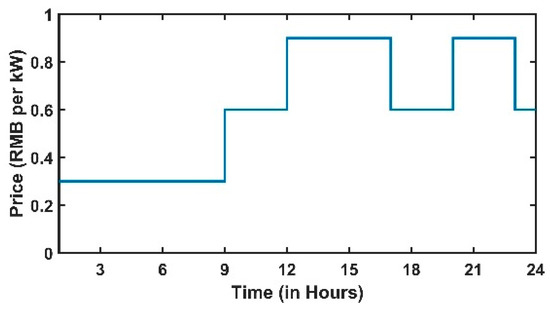
Figure 7.
Electricity network trading price.
The electricity network’s load pattern is taken from a typical day of the residential load, which can be seen in Figure 8.
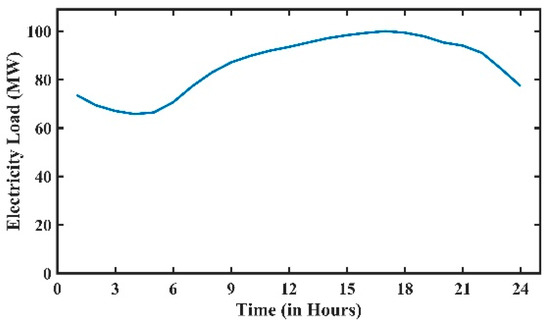
Figure 8.
Load curve of the electricity network.
In the electricity network, load and electricity price mostly follow the same pattern. Similarly, the gas network load pattern from a typical day, which represents the household load of the gas network, is shown in Figure 9.
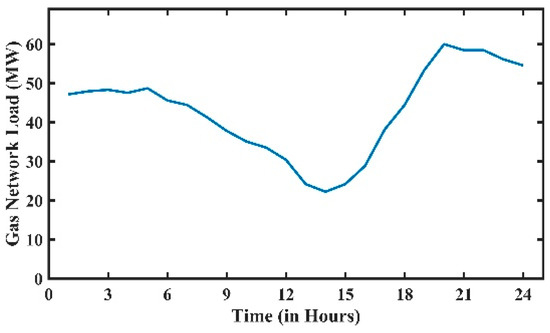
Figure 9.
Load curve of the gas network (excluding MT).
For the natural gas network, there is an increment in gas price as the gas passes through the gas pipeline. As natural gas travels through the pipeline, its pressure drops, which affects the natural gas network capacity. To maintain the required pressure, compressors are used, which consume gas and cause a price increment. The residential demand for electricity and gas varies throughout the year. For simplicity, this variation can be divided into three categories:
(1) Summer case:
Generally, in summer, electricity demand is higher and its peak and off-peak demand differences are also higher. As compared to electricity, natural gas demand drops significantly. Mostly, natural gas is available for electricity generation due to lower demand for household or district heating [32].
(2) Spring case:
In general, both electricity and natural gas are not in high demand. It means there is not much stress on both networks.
(3) Winter case:
In winter, both networks are under stress to meet their load requirements. Explicitly, natural gas is in high demand and its peak and off-peak demand gaps are also higher. Considering the coupled network, in winter case, the total energy flow is the highest [32]. As per the above discussion, in winter, both networks have a higher possibility of having congestion and this may cause a rise in per unit price. That’s why this simulation is about the winter case only.
The electricity network components’ parameters are given below.
The battery bank consists of eight lithium ion-based battery units, each with 10 MWh capacity, or 80 MWh in total. The natural gas network components’ parameters are given below.
The microturbines (MT) used here are Siemens SGT-A65 gas turbines. Their combined cycle power generation capacity at 50 Hz is 65.3 MW. Its maximum operating efficiency is 53.6%.
The electricity network’s 24 h dispatch as per the proposed strategy is shown in Figure 10. According to the results shown in Figure 10 and Figure 11, the micro-grids’ dependency on the main grid is reduced. The battery bank was charged when the main grid price was the lowest and discharged in needy hours, e.g., discharged at 11:00 h. When the MT production got lower, the batteries started functioning to fill the power gap. The battery bank got charged when the main grid electricity price was the lowest, e.g., from 0:00 to 8:00 h. This strategic function of the battery bank also provides an economic benefit.
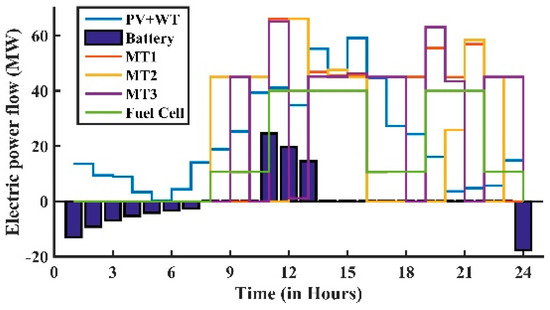
Figure 10.
Electricity network dispatch.
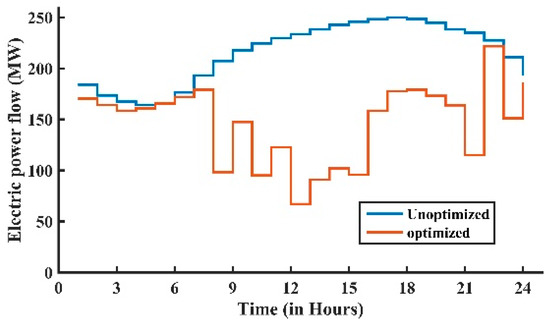
Figure 11.
Sale and purchase for the main grid.
Figure 11 shows the sale and purchase before and after introducing the microgrid. All the electricity was purchased from the main grid before optimization, but in the later optimized case, electricity is produced by DERs and a battery bank is also introduced in the microgrid.
The proposed dispatch strategy is focused on the time of use price, but it can also help the regional grid shave its load curve peaks, which is the main purpose of using time of use price. Figure 12 shows the microgrid effect on the regional grid, assuming the regional grid’s peak load is 1000 MW.
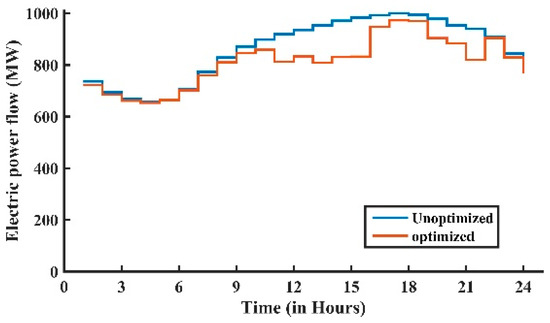
Figure 12.
Effect on the regional grid.
Before introducing MT and other DER, the total expenditure was 2.7240 million RMB on a typical day. In the second case, this expenditure was 2.0529 million RMB on the same typical day. This financial benefit also includes 0.0590 million RMB from battery bank operational financial benefit. The comparison of dispatch strategy with different techniques is given in Table 3. All these algorithms were run on the same machine (Core i3 CPU, 4 GB RAM).
Table 3.
Comparison of dispatch solutions with different methods.
As depicted in Table 3, the 24 h cost for ABC, PSO and the proposed method of applying PSO is same, and only the computational time is lesser for latter. Here it is worth noting that ACO has an edge to pursuit a better search direction depending on the experience and to produce better initial result solutions using a heuristic technique, but this feature can often cause trapping in a local minimum. This is the reason for the lesser computational time and higher cost (local minima) for ACO as mentioned in Table 3. ABC is good at finding the correct global minima, but its computation time is higher. In the literature, some authors claim to develop a better metaheuristic optimization algorithm based on swarm optimization. Most of these claims are based on some selective aspect of the comparison results. For example in [33] authors performed only 40 iterations and did not mention the computational time in comparison. Having a conversion test is a must thing for metaheuristic optimization algorithms as these types of algorithms cannot find the correct global optimum every time if the number of maximum iterations are not enough. In Figure 4, a conversation test of the algorithm used in this article is given. The authors proposed to calculate the output of PV and wind generation and fully used it. It does not need to be optimized via PSO, as it can be realized that using all the power by renewables will be a better option than using a portion. This modification in applying PSO results in lesser time consumption to compute the desired results.
The dispatch strategy for natural gas MT operation provided by the simulation is summarized in Table 4. Here “0” means shut down or in standby mode (less than 5 MW). “1” represents operational status in respective hours.
Table 4.
One-day gas turbine operation.
5. Conclusions
This paper proposed a dispatch strategy for microgrids coupled with the natural gas networks using particle swarm optimization (PSO). The coupled networks’ optimal dispatch problem is formulated as a multi-objective optimization problem. This model covered the non-linear cost function of the natural gas network, natural gas-powered micro gas turbine and other components of the microgrid. A modification was done in applying PSO by limiting the search area as coupled to the network constraints. To verify the effectiveness of the proposed strategy, first a test was done to check its convergence speed and find a sufficient number of iterations and then it was applied to the proposed Integrated Energy System (IES). This proposed IES consists of a 7-node natural gas system coupled with the IEEE bus 33 test system. The results provide an optimal dispatch scheme, which is able to reduce the operational cost by 0. 6710 million RMB per day. Furthermore, it is also noticed that power sharing between microgrid and main grid is also reduced in such a beneficial way that it also supports the main grid to shave its load curve. This can be a promising approach for robust operation of the microgrid. The conclusion can be summarized as follows:
- We formulated the power dispatch strategy of a microgrid coupled with a natural gas network as a multi-objective problem and used PSO to solve it.
- Limited the search area for PSO.
- Included pollution treatment costs or emission penalties.
- Verified the effectiveness of the proposed strategy. First, a test was done to check its convergence speed and find out a sufficient number of iterations and then it was applied to the proposed Integrated Energy System (IES).
- The results provided an optimal dispatch scheme, which is able to reduce the operational cost of the microgrid by 0. 6710 million RMB per day.
- The proposed strategy not only provides an optimal dispatch, but also reduces the power dependability of the microgrid in such a way that it helps the main grid to smoothen its power demand curve.
As we know that the forecasting information of renewable energy is changing continuously, so, it is suggested that the proposed strategy should be executed whenever the forecasting information changes, to get up-to-date optimized dispatch strategy for the day ahead dispatch. Installation cost of DERs and pollution treatment penalty is subjected to local market situations and policies. It may revise in succeeding work.
Author Contributions
Conceptualization and methodology, M.Y. and Q.A.; software, and data curation, M.Y. and Y.G.; writing—original draft preparation, M.Y.; writing—review and editing, M.Y, W.A.W., R.H. and Z.J.; supervision and funding acquisition, Q.A.
Funding
This work was supported by National Natural Science Foundation of China (U1866206).
Conflicts of Interest
The authors declare no conflict of interest.
Nomenclature
| A | Area of PV panels |
| Total social cost of FC at time t | |
| Total social cost of battery at time t | |
| Total social cost of MT at time t | |
| Total social cost of PV at time t | |
| Total social cost of a wind turbine at time t | |
| Natural gas price per unit | |
| Pollution treatment cost for MT | |
| Fuel cost for MT | |
| MT maintenance cost | |
| Power curve provided by WT manufacture | |
| Global tilted solar irradiation on PV | |
| Fuel cell stack current | |
| Maintenance cost constant for MT | |
| Number of units installed | |
| Power supplied or stored (charge or discharge) by battery at time t | |
| Estimated power generated by FC at time t | |
| Power generated by MT at time t | |
| Estimated power generated by PV at time t | |
| Estimated power generated by WT at time t | |
| Index of hour | |
| All hours in the year | |
| DC voltage between stack of FC at time t | |
| Velocity of the wind at time t | |
| Maintenance coefficient for battery | |
| Maintenance coefficient for FC | |
| Emission characteristic coefficient for MT | |
| Maintenance coefficient of PV | |
| Maintenance coefficient of wind turbine | |
| Emission characteristic coefficient for battery | |
| FC value depreciation coefficient | |
| Value depreciation coefficient for MT | |
| PV value depreciation coefficient | |
| Wind value depreciation coefficient | |
| Pollution treatment cost coefficient for battery | |
| Pollution treatment cost coefficient for FC | |
| Emission characteristic coefficient for MT | |
| Pollution treatment cost coefficient for PV | |
| Pollution treatment cost coefficient for wind turbine | |
| Efficiency of solar PV | |
| MT Power generation efficiency at time t | |
| Emission characteristic coefficient for MT | |
| Unit pollution cost | |
| Emission characteristic coefficient for MT |
References
- Gu, W.; Wang, Z.; Wu, Z.; Luo, Z.; Tang, Y.; Wang, J. An Online Optimal Dispatch Schedule for CCHP Microgrids Based on Model Predictive Control. IEEE Trans. Smart Grid 2017, 8, 2332–2342. [Google Scholar] [CrossRef]
- Wu, J.; Yan, J.; Jia, H.; Hatziargyriou, N.; Djilali, N.; Sun, H. Integrated energy systems. Appl. Energy 2016, 167, 155–157. [Google Scholar] [CrossRef]
- Qian, A.; Ran, H. Key technologies and challenges for multi-energy complementarity and optimization of integrated energy system. Autom. Electr. Power Syst. 2018, 42, 2–10. [Google Scholar]
- Olivares, D.E.; Mehrizi-Sani, A.; Etemadi, A.H.; Cañizares, C.A.; Iravani, R.; Kazerani, M.; Hajimiragha, A.H.; Gomis-Bellmunt, O.; Saeedifard, M.; Palma-Behnke, R.; et al. Trends in microgrid control. IEEE Trans. Smart Grid 2014, 5, 1905–1919. [Google Scholar] [CrossRef]
- Li, Q.; An, S.; Gedra, T. Solving natural gas loadflow problems using electric loadflow techniques. In Proceedings of the North American Power Symposium, Rolla, MO, USA, 20–21 October 2003. [Google Scholar]
- Seungwon, A.; Qing, L.; Gedra, T.W. Natural gas and electricity optimal power flow. In Proceedings of the 2003 IEEE PES Transmission and Distribution Conference and Exposition, Dallas, TX, USA, 7–12 September 2003; Volume 1, pp. 138–143. [Google Scholar] [CrossRef]
- Qiu, J.; Zhao, J.; Yang, H.; Dong, Z.Y. Optimal Scheduling for Prosumers in Coupled Transactive Power and Gas Systems. IEEE Trans. Power Syst. 2018, 33, 1970–1980. [Google Scholar] [CrossRef]
- Unsihuay, C.; Lima, J.W.M.; de Souza, A.C.Z. Modeling the Integrated Natural Gas and Electricity Optimal Power Flow. In Proceedings of the 2007 IEEE Power Engineering Society General Meeting, Tampa, FL, USA, 24–28 June 2007; pp. 1–7. [Google Scholar] [CrossRef]
- Martinez-Mares, A.; Fuerte-Esquivel, C.R. A unified gas and power flow analysis in natural gas and electricity coupled networks. IEEE Trans. Power Syst. 2012, 27, 2156–2166. [Google Scholar] [CrossRef]
- Wu, L.L.; Wu, Q.H.; Jing, Z.X.; Wei, F.; Deng, S.; Zhou, X.X. Optimal power and gas dispatch of the integrated electricity and natural gas networks. In Proceedings of the IEEE PES Innovative Smart Grid Technologies Conference Europe, Melbourne, Australia, 28 November–1 December 2016; pp. 244–249. [Google Scholar]
- Kou, Y.N.; Zheng, J.H.; Li, Z.; Wu, Q.H. Many-objective optimization for coordinated operation of integrated electricity and gas network. J. Mod. Power Syst. Clean Energy 2017, 5, 350–363. [Google Scholar] [CrossRef]
- Shabanpour-Haghighi, A.; Seifi, A.R. An integrated steady-state operation assessment of electrical, natural gas, and district heating networks. IEEE Trans. Power Syst. 2016, 31, 3636–3647. [Google Scholar] [CrossRef]
- Colson, C.M.; Nehrir, M.H.; Wang, C. Ant colony optimization for microgrid multi-objective power management. In Proceedings of the 2009 IEEE/PES Power Systems Conference and Exposition, Seattle, WA, USA, 15–18 March 2009. [Google Scholar]
- Conti, S.; Nicolosi, R.; Rizzo, S.A. Optimal dispatching of distributed generators in an MV autonomous micro-grid to minimize operating costs and emissions. In Proceedings of the IEEE International Symposium on Industrial Electronics, Bari, Italy, 4–7 July 2010; pp. 2542–2547. [Google Scholar]
- Hatziargyriou, N.; Contaxis, G.; Matos, M.; Pecas Lopes, J.A.; Kariniotakis, G.; Mayer, D.; Halliday, J.; Dutton, G.; Dokopoulos, P.; Bakirtzis, A.; et al. Energy management and control of island power systems with increased penetration from renewable sources. In Proceedings of the 2002 IEEE Power Engineering Society Winter Meeting, New York, NY, USA, 27–31 January 2002; Volume 1, pp. 335–339. [Google Scholar] [CrossRef]
- Baskar, S.; Subbaraj, P.; Rao, M.V.C. Hybrid real coded genetic algorithm solution to economic dispatch problem. Comput. Electr. Eng. 2003, 29, 407–419. [Google Scholar] [CrossRef]
- Alvarez, E.; Lopez, A.C.; Gómez-Aleixandre, J.; De Abajo, N. On-line minimization of running costs, greenhouse gas emissions and the impact of distributed generation using microgrids on the electrical system. In Proceedings of the 1st IEEE-PES/IAS Conference on Sustainable Alternative Energy, Valencia, Spain, 28–30 September 2009. [Google Scholar]
- Kanchev, H.; Lu, D.; Colas, F.; Lazarov, V.; Francois, B. Energy management and operational planning of a microgrid with a PV-based active generator for smart grid applications. IEEE Trans. Ind. Electron. 2011, 58, 4583–4592. [Google Scholar] [CrossRef]
- Kanchev, H.; Lu, D.; Francois, B.; Lazarov, V. Smart monitoring of a microgrid including gas turbines and a dispatched PV-based active generator for energy management and emissions reduction. In Proceedings of the IEEE PES Innovative Smart Grid Technologies Conference Europe, Gothenberg, Sweden, 11–13 October 2010. [Google Scholar]
- Mahdi, F.P.; Vasant, P.; Rahman, M.M.; Abdullah-Al-Wadud, M.; Watada, J.; Kallimani, V. Quantum particle swarm optimization for multiobjective combined economic emission dispatch problem using cubic criterion function. In Proceedings of the 2017 IEEE International Conference on Imaging, Vision and Pattern Recognition, Dhaka, Bangladesh, 13–14 February 2017. [Google Scholar]
- Colson, C.M.; Nehrir, M.H.; Pourmousavi, S.A. Towards real-time microgrid power management using computational intelligence methods. In Proceedings of the IEEE PES General Meeting, Providence, RI, USA, 25–29 July 2010. [Google Scholar]
- Twaha, S.; Ramli, M.A.M. A review of optimization approaches for hybrid distributed energy generation systems: Off-grid and grid-connected systems. Sustain. Cities Soc. 2018, 41, 320–331. [Google Scholar] [CrossRef]
- Singh, H.; Srivastava, L. Hybrid multi-swarm particle swarm optimisation based multi-objective reactive power dispatch. IET Gener. Transm. Distrib. 2015, 9, 727–739. [Google Scholar] [CrossRef]
- Shareef, S.M.; Srinivasa Rao, R. Optimal reactive power dispatch under unbalanced conditions using hybrid swarm intelligence. Comput. Electr. Eng. 2018, 69, 183–193. [Google Scholar] [CrossRef]
- Wang, F.; Zhou, L.; Ren, H.; Liu, X. Search improvement process-chaotic optimization-particle swarm optimization-elite retention strategy and improved combined cooling-heating-power strategy based two-Time scale multi-objective optimization model for stand-Alone microgrid operation. Energies 2017, 10. [Google Scholar] [CrossRef]
- Khaled, U.; Eltamaly, A.M.; Beroual, A. Optimal power flow using particle swarm optimization of renewable hybrid distributed generation. Energies 2017, 10, 1013. [Google Scholar] [CrossRef]
- Huang, W.T.; Chen, T.H.; Chen, H.T.; Yang, J.S.; Lian, K.L.; Chang, Y.R.; Lee, Y.D.; Ho, Y.H. A two-stage optimal network reconfiguration approach for minimizing energy loss of distribution networks using particle swarm optimization algorithm. Energies 2015, 8, 13894–13910. [Google Scholar] [CrossRef]
- Liu, Z.; Chen, C.; Yuan, J. Hybrid Energy Scheduling in a Renewable Micro Grid. Appl. Sci. 2015, 5, 516–531. [Google Scholar] [CrossRef]
- Osiadacz, A. Integration of Large-Scale Renewable Energy into Bulk Power Systems; Springer: Berlin, Germany, 2017. [Google Scholar] [CrossRef]
- Kennedy, J. Particle swarm optimization. Briefs Appl. Sci. Technol. 2016, 182, 1942–1948. [Google Scholar] [CrossRef]
- Shi, Y.; Eberhart, R. A modified particle swarm optimizer. In Proceedings of the 1998 IEEE International Conference on Evolutionary Computation Proceedings. IEEE World Congress on Computational Intelligence (Cat. No.98TH8360), Anchorage, AK, USA, 4–9 May 1998; pp. 69–73. [Google Scholar] [CrossRef]
- Jiang, Y.; Xu, J.; Sun, Y.; Wei, C.; Wang, J.; Liao, S.; Ke, D.; Li, X.; Yang, J.; Peng, X. Coordinated operation of gas-electricity integrated distribution system with multi-CCHP and distributed renewable energy sources. Appl. Energy 2018, 211, 237–248. [Google Scholar] [CrossRef]
- Kefayat, M.; Lashkar Ara, A.; Nabavi Niaki, S.A. A hybrid of ant colony optimization and artificial bee colony algorithm for probabilistic optimal placement and sizing of distributed energy resources. Energy Convers. Manag. 2015, 92, 149–161. [Google Scholar] [CrossRef]


© 2018 by the authors. Licensee MDPI, Basel, Switzerland. This article is an open access article distributed under the terms and conditions of the Creative Commons Attribution (CC BY) license (http://creativecommons.org/licenses/by/4.0/).