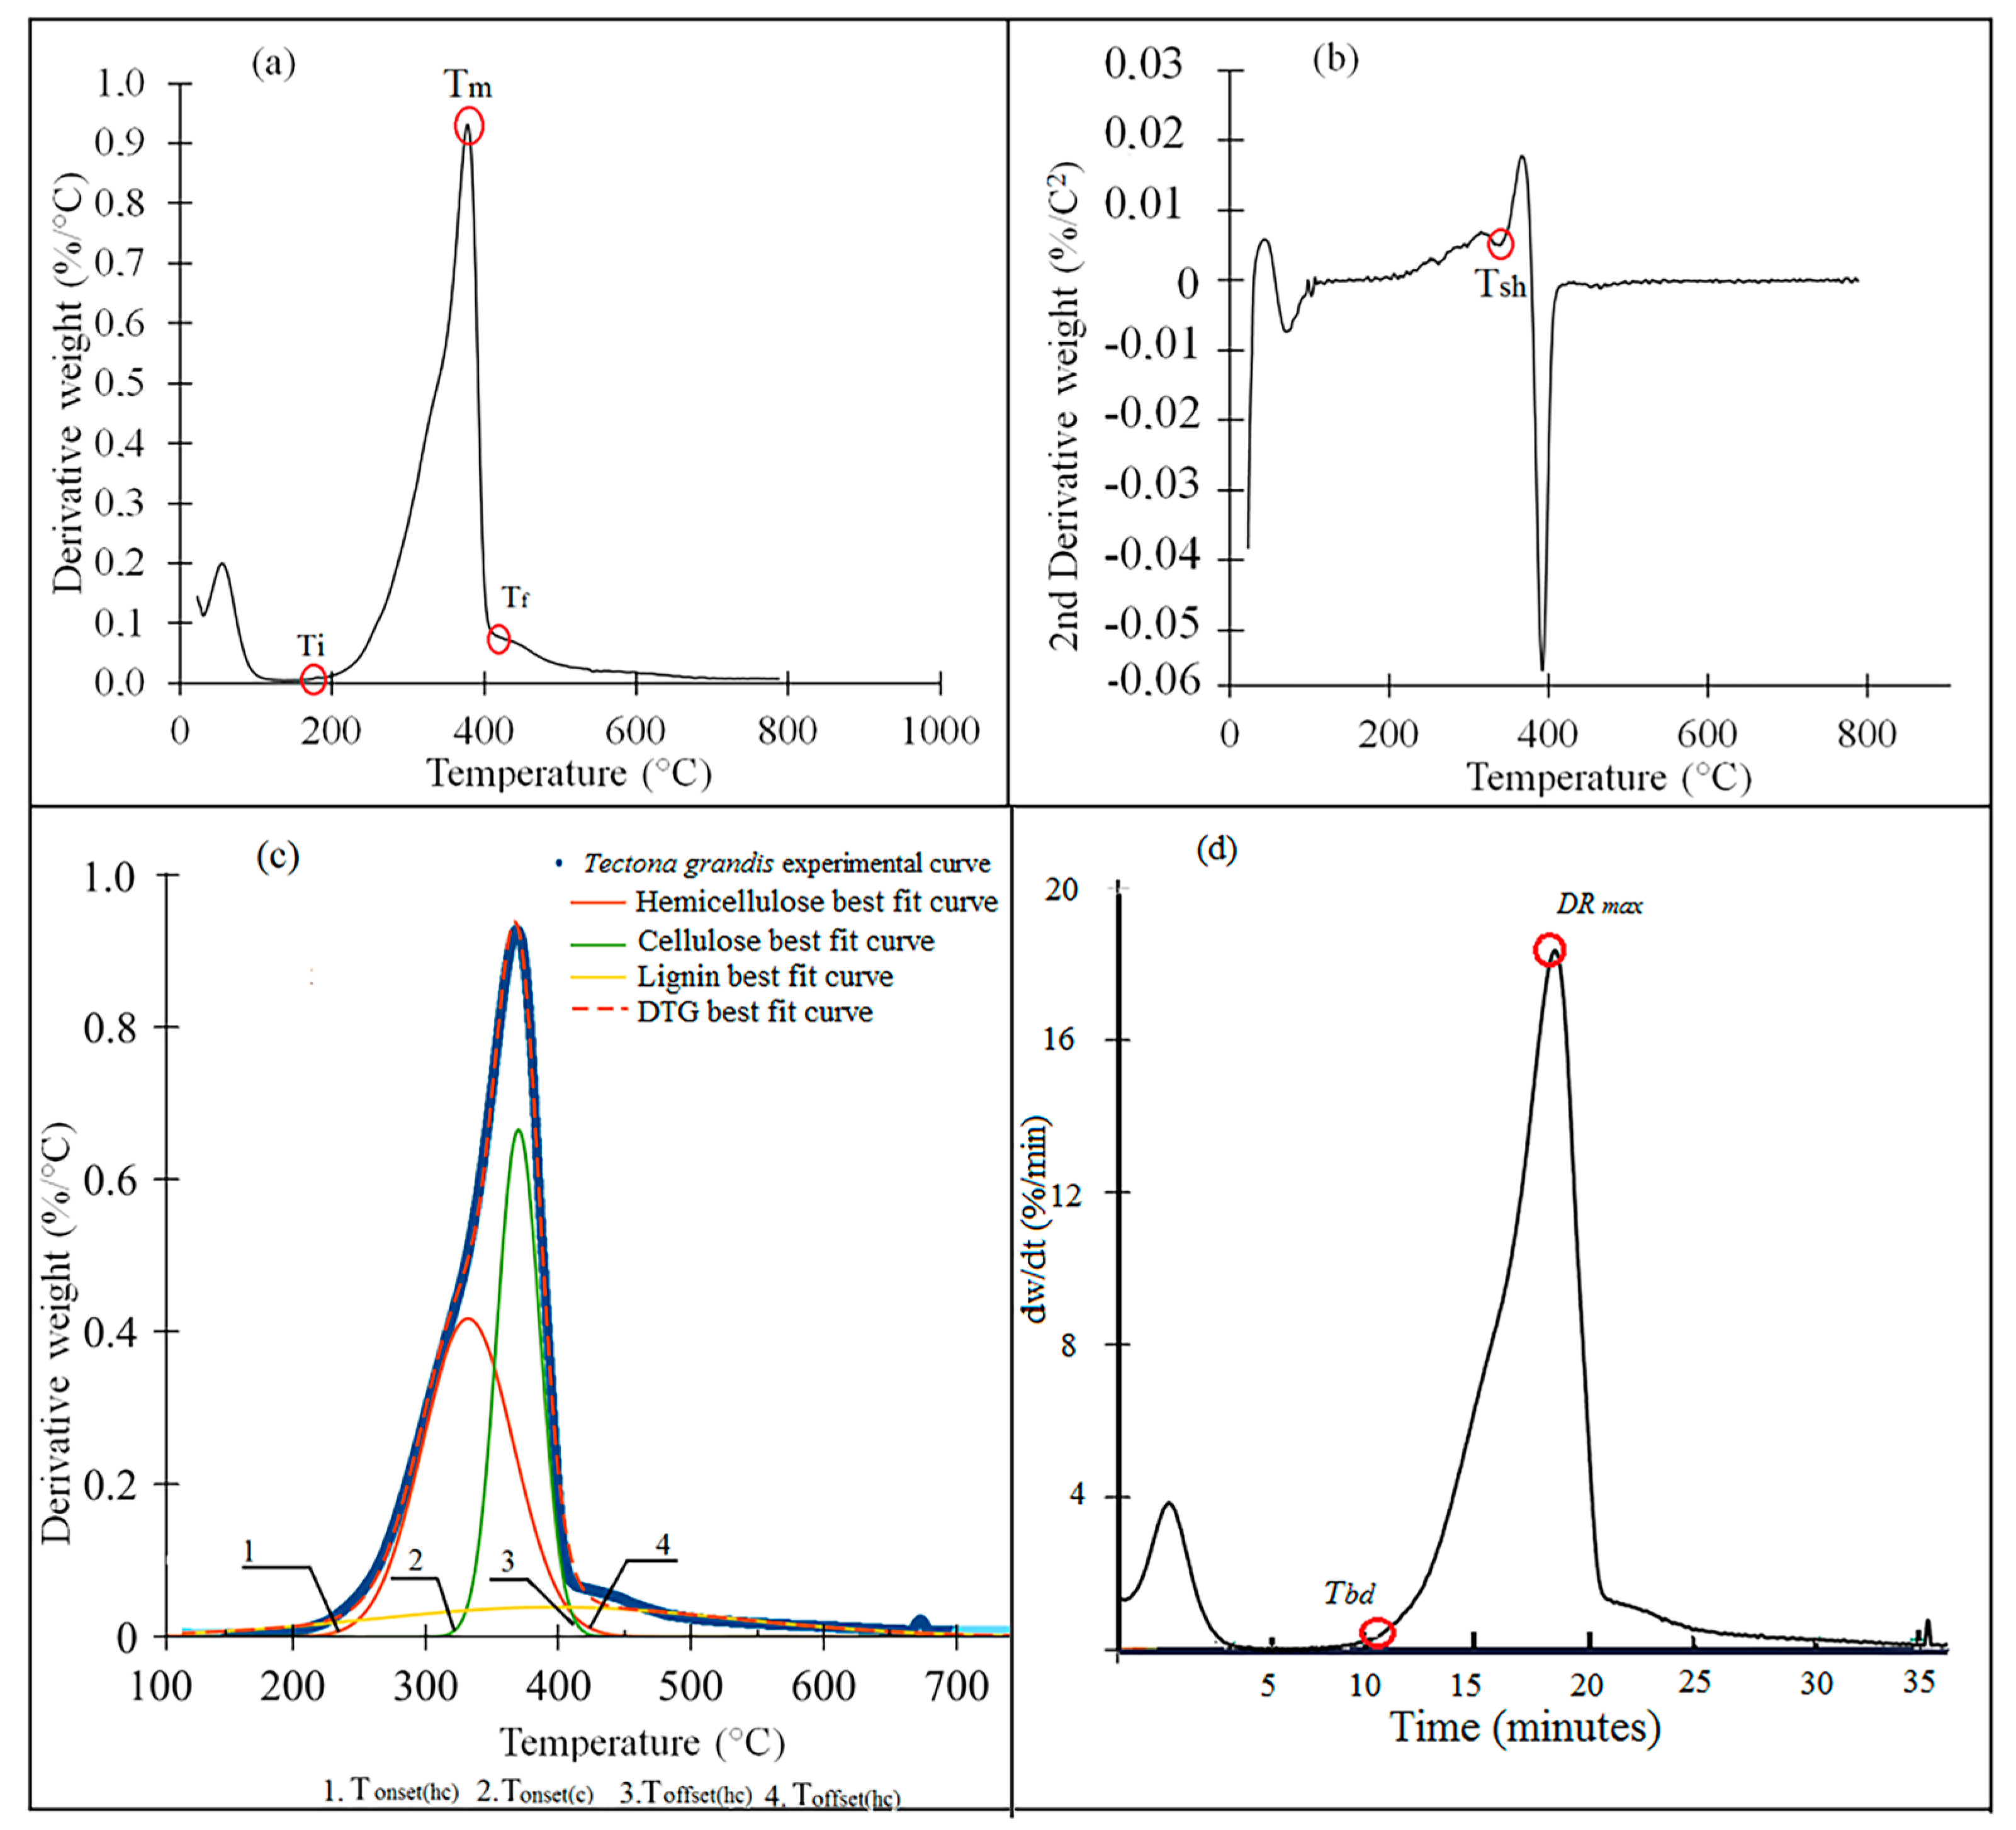
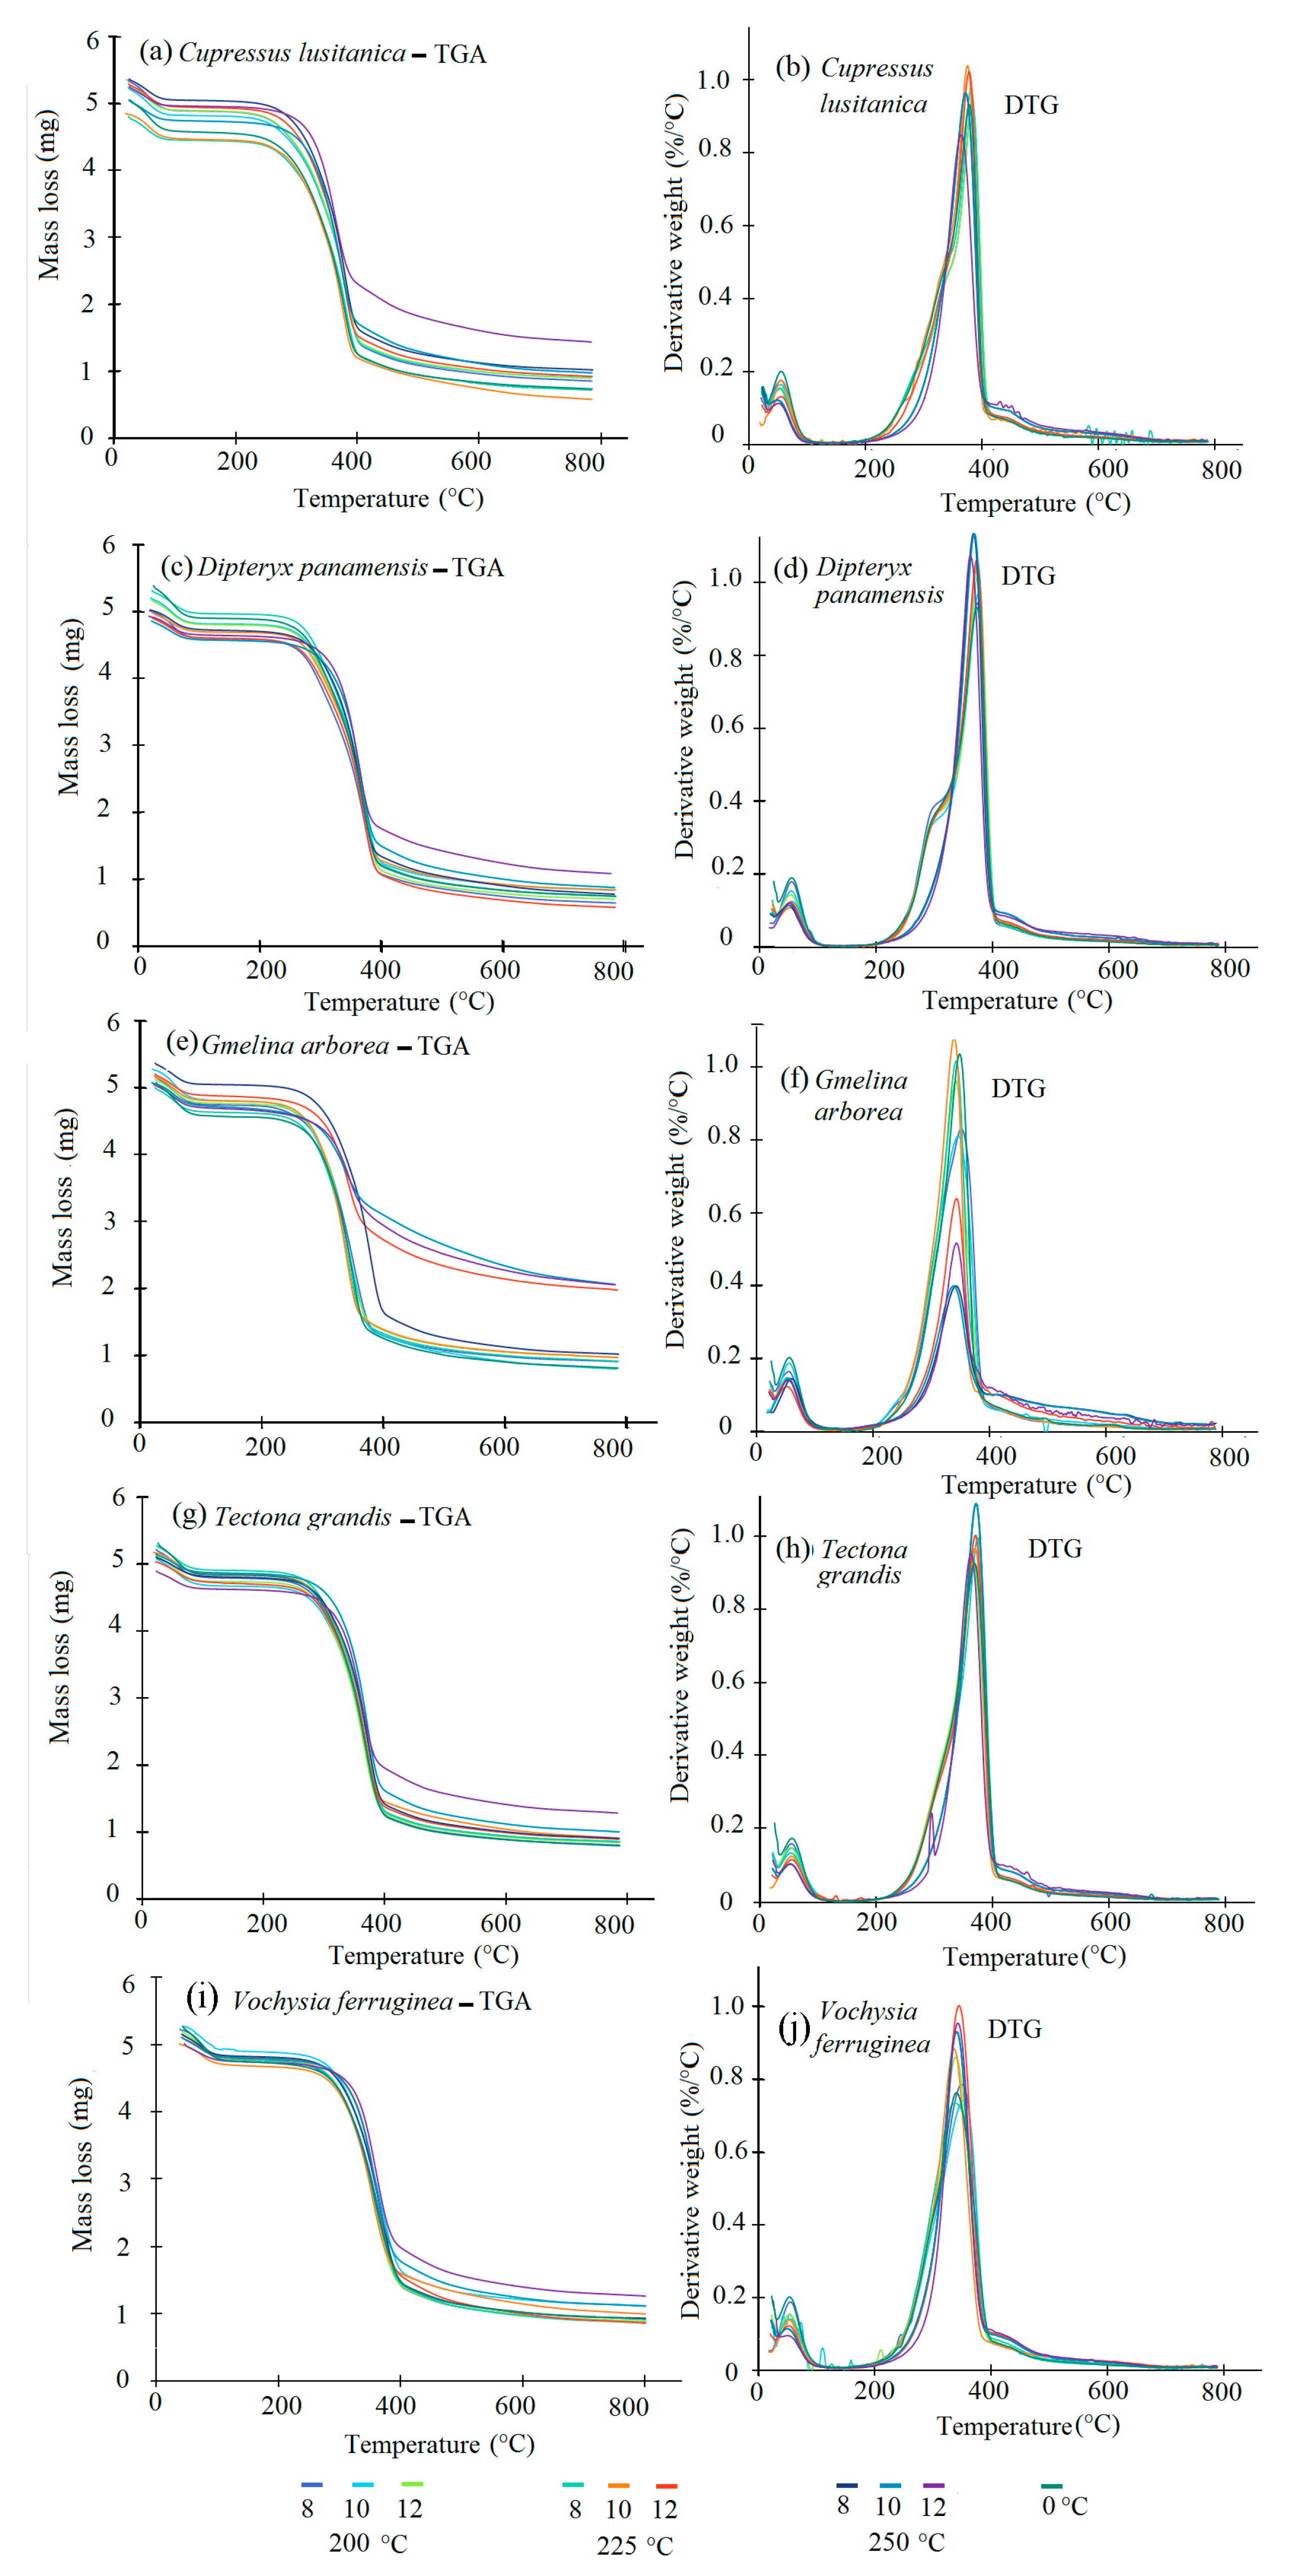
3.1. TGA-DTG Analysis
The thermogravimetric decomposition behavior of the torrefied biomass for the five species showed the same pattern with different T
T and t
T (
Figure 3a–h). However, the DTG curve showed some differences in biomass decomposition (
Figure 3a–h). For the TGA curve, five important stages were observed. A predominant signal appeared in the first stage prior to 100 °C. The second stage showed a pronounced peak between 290 °C and 330 °C, the third stage occurred between 340–380 °C. And the fourth stage appeared between 400–500 °C, where the speed of mass loss mas lower compared with the two previous decomposition stages. Finally, few changes in the sample occurred as temperature continued to increase.
Overall, the TGA and DTG curves (
Figure 3a–h) showed small visually noticeable differences in the thermal behaviour of the torrefied biomass at various T
T. For all species studied, the biomass torrefied at 250 °C at the three t
T were thermally different. First, the TGA curves show that the biomass torrefied at 250 °C, or severe torrefaction, behaved differently compared to the rest of the T
T. After 340–380 °C, mass loss was less than for biomass torrefied at 250 °C (
Figure 3a–h). Second, the DTG curves showed a strong signal at 290 °C, but it appeared as a small shoulder along that at 250 °C (
Figure 3a–h). This signal was more visible in
D. panamensis (
Figure 3c) and
V. ferruginea (
Figure 3i), whereas this shoulder was not present in
C. lusitanica (
Figure 3a),
G. arborea (
Figure 3e), and
T. grandis (
Figure 3g) in biomass torrefied at 250-12.
Table 2 and
Table 3 show the detailed analyses of the temperatures and mass loss for the various species, where the main changes in the degradation of the different chemical components of the torrefied biomass during the TGA occurred. In the evaluation of the decomposition T
i in
C. lusitanica, the T
i of biomass torrefaction increased with respect to untorrefied biomass, except for the 250-8 condition. For the remaining four species under all torrefaction conditions, decomposition T
i increased (
Table 2). As for W
Ti at 250 °C, torrefaction was greater in the torrefied biomass compared with untorrefied biomass for all species (
Table 3). Conversely, T
i tended to increase in torrefied biomass under the light torrefaction condition (200-8) to the middle torrefaction condition between 225-10 and 225-12, depending on the species, and decreased under 250-10 or 250-12 conditions. For
D. panamensis,
G. arborea,
T. grandis, and
V. ferruginea, the decomposition T
f was lower for the torrefied biomass than the untorrefied biomass under any condition of T
T and t
T. T
f increased at 200 °C in the torrefied biomass of
C. lusitanica compared to untorrefied biomass. The remaining conditions (225 and 250 °C) displayed lower T
f compared to the untorrefied biomass (
Table 2). The behavior of W
Ti, W
Tf, and the residual mass differed among T
i and T
f conditions for all species, as W
Ti and W
Tf increased with increasing T
T and t
T (
Table 2 and
Table 3).
C. lusitanica behaved differently with respect to hemicellulose parameters compared with the other species. T
onset(hc) and T
sh were higher in the torrefied biomass compared to the untorrefied biomass (
Table 2), whereas the T
offset(hc) was lower in all torrefied biomasses compared to the untorrefied biomass (
Table 2). T
onset(hc) was lower in the torrefied biomass of
D. panamensis,
G. arborea,
T. grandis, and
V. ferruginea compared to untorrefied biomass. The T
sh and T
offset(hc) of the torrefied biomass of these species were higher than the untorrefied biomass (
Table 2).
The different torrefaction conditions had varying effects on the hemicellulose of C. lusitanica compared to the other four species. The Tonset(hc) of the torrefied biomass of C. lusitanica increased as TT and tT increased, whereas Tsh and Toffset(hc) decreased with increasing TT and tT. The Tonset(hc) also increased in the torrefied biomass of the remaining species (D. panemensis, G. arborea, T. grandis and V. feruginea) under light 200-8) to medium (between 225-10 or 225-12 depending on the species), torrefaction conditions, then decreasing under the 250-10 or 250-12 conditions. For the Tsh and Toffset(hc) parameters, their values decreased with increasing TT and tT, whereas some irregularities were observed in this behaviour in C. lusitanica and T. grandis.
In biomass torrefied at any T
T or t
T, W
Tonset(hc), W
Tsh, and W
Toffset(hc) had higher values than in untorrefied biomass in all species (
Table 3). The values of T
T and t
T varied under different torrefaction conditions. In general, the values of W
Tonset(hc), W
Tsh and W
Toffset(hc) for all species increased with increasing T
T, particularly in biomass torrefied at 250 °C. Few changes were observed in t
T at the same T
T in the W
Tonset(hc) and W
Tsh values for all t
T of the different species. However, for W
Toffset(hc), for 8 and 10 min, the parameter values were similar, whereas under condition 250-12, a significant increase in W
Toffset(hc) was observed in all species (
Table 3).
For the cellulose decomposition parameters, biomass torrefaction increased T
onset(c) compared to the untorrefied biomass in
C. lusitanica,
G. arborea,
T. grandis, and
V. ferruginea, whereas in
D. panamensis, T
onset(c) increased from the 200-8 to the 250-10 condition, and then decreased under the most severe condition (250-12) (
Table 3). Conversely, T
m increased in the torrefaction of the biomass of
C. lusitanica and
D. panamensis from the least severe condition (200-8) to condition 225-10. Also, under conditions 225-12 and T
T at 250 °C, the torrefied biomass had a lower T
m than the untorrefied biomass. The torrefied biomass of
G. arborea had a higher T
m value compared to the untorrefied biomass, except under condition 250-8. In the biomass of
T. grandis, torrefaction increased T
m compared to untorrefied biomass, except for condition 250-12. In the biomass of
V. ferruginea, torrefaction reduced T
m under conditions 200-12, 225-8, and 225-10, whereas T
m was higher under the rest of the torrefaction conditions (
Table 3) compared with untorrefied biomass. Lastly, torrefaction of the biomass of the five species decreased T
offset(c) compared with untorrefied biomass (
Table 3).
With respect to the different torrefaction conditions, the increase in T
T and t
T decreased T
onset(c) in
C. lusitanica and
D. panamensis. Conversely, in
G. arborea, the increase in T
T and t
T decreased T
onset(c), except under condition 225-8. As for
T. grandis and
V. ferruginea, no trend was found in T
onset(c) with either an increase or decrease of T
T or t
T (
Table 3). T
m and T
offset(c) decreased in all species as T
T or t
T increased (
Table 3).
The evaluation of the residual mass of the different biomasses showed that torrefaction decreased the W
Tonset(c) value in
C. lusitanica and
T. grandis, whereas in
D. panamensis,
G. arborea and
V. ferruginea, torrefaction decreased the W
Tonset(c) value, except under the most severe condition (250-12) (
Table 3). Torrefaction increased T
m in all species, except under condition 200-8 for
D. panamensis and
T. grandis and conditions 200-8 and 200-10 for
V. ferruginea, where T
m decreased. Lastly, W
Toffset(c) was higher in torrefied biomass than in untorrefied biomass for all species (
Table 3). The evaluation of the residual mass under the different torrefaction conditions showed that all parameters related to residual mass (W
Tonset(c), W
Tm, and W
Toffset(c)) increased their values with increasing T
T and t
T of torrefaction in all species (
Table 3).
Table 4 shows the kinetic parameters of hemicellulose and cellulose decomposition in torrefied biomass observed with TGA. In the torrefied biomass of
C. lusitanica, the activation energy (Ea) value of hemicellulose increased with the increase in T
T and t
T up to 225 °C; however, in torrefaction at 250 °C for 10 and 12 min, the Ea values were lower. The Ea cellulose values for the biomass of
C. lusitanica increased with the increase in T
T and t
T, requiring more energy to degrade the cellulose in the biomass. For Ea, the torrefied biomasses at 200 °C and 225-8 had lower values than the untorrefied biomass; then Ea increased with T
T and t
T, decreasing again under the 250-12 condition.
The torrefaction increased the pre-exponential factor (A) and Ea of the hemicellulose in the D. panamensis biomass compared to the untorrefied biomass. The A and Ea increased from 200-8 to 225-12, and decreased at 250 °C. For cellulose, the A and Ea in the torrefied biomass decreased with the increase in TT and tT, but any torrefaction produced lower values of A and Ea compared to the untorrefied biomass.
The
G. arborea torrefied biomass had lower A and Ea hemicellulose values than the untorrefied biomass. Torrefaction at 200 °C had high Ea hemicellulose values, whereas the Ea decreased significantly with T
T and t
T above 225 °C. For cellulose, Ea increased as T
T and t
T increased, especially under condition 225-10 (
Table 4). The torrefied biomass had higher Ea values compared to untorrefied biomass, except for conditions 200-8 and 200-10. In general, torrefaction Ea increased with increasing T
T and t
T.
With
T. grandis, the hemicellulose A and Ea increased up to torrefaction condition 225-12, with values greater than those for untorrefied biomass. Beyond these torrefaction conditions, A and Ea decreased in the torrefied biomass at 250 °C, with values lower than found for the untorrefied biomass. For cellulose, Ea was lower for the different types of torrefied biomass, except under condition 250-12. Ea was also lower in torrefied biomass under 225-8, 225-10, and 250-8 conditions. Ea increased with T
T for the other temperatures. However, Ea was greater for all torrefied biomasses, increasing as T
T and t
T increased (
Table 4).
The torrefied biomass of V. ferruginea had lower Ea values for hemicellulose than the untorrefied biomass. Ea in hemicellulose decreased with decreasing TT for the different torrefaction conditions, whereas at the same temperature, Ea decreased at 10 and 12 min. For cellulose, the Ea value was lower as TT, decreased except for conditions 225-10 and 250-12, in which Ea was higher in the torrefied biomass. For the EA value for cellulose for different TT, Ea increased with TT, excluding conditions 200-10 and 225-8, which had a low Ea value.
Notably, the correlation coefficients (R2) for all torrefaction conditions remained close to 0.99, with the exception of the cellulose models for G. arborea, which were low.
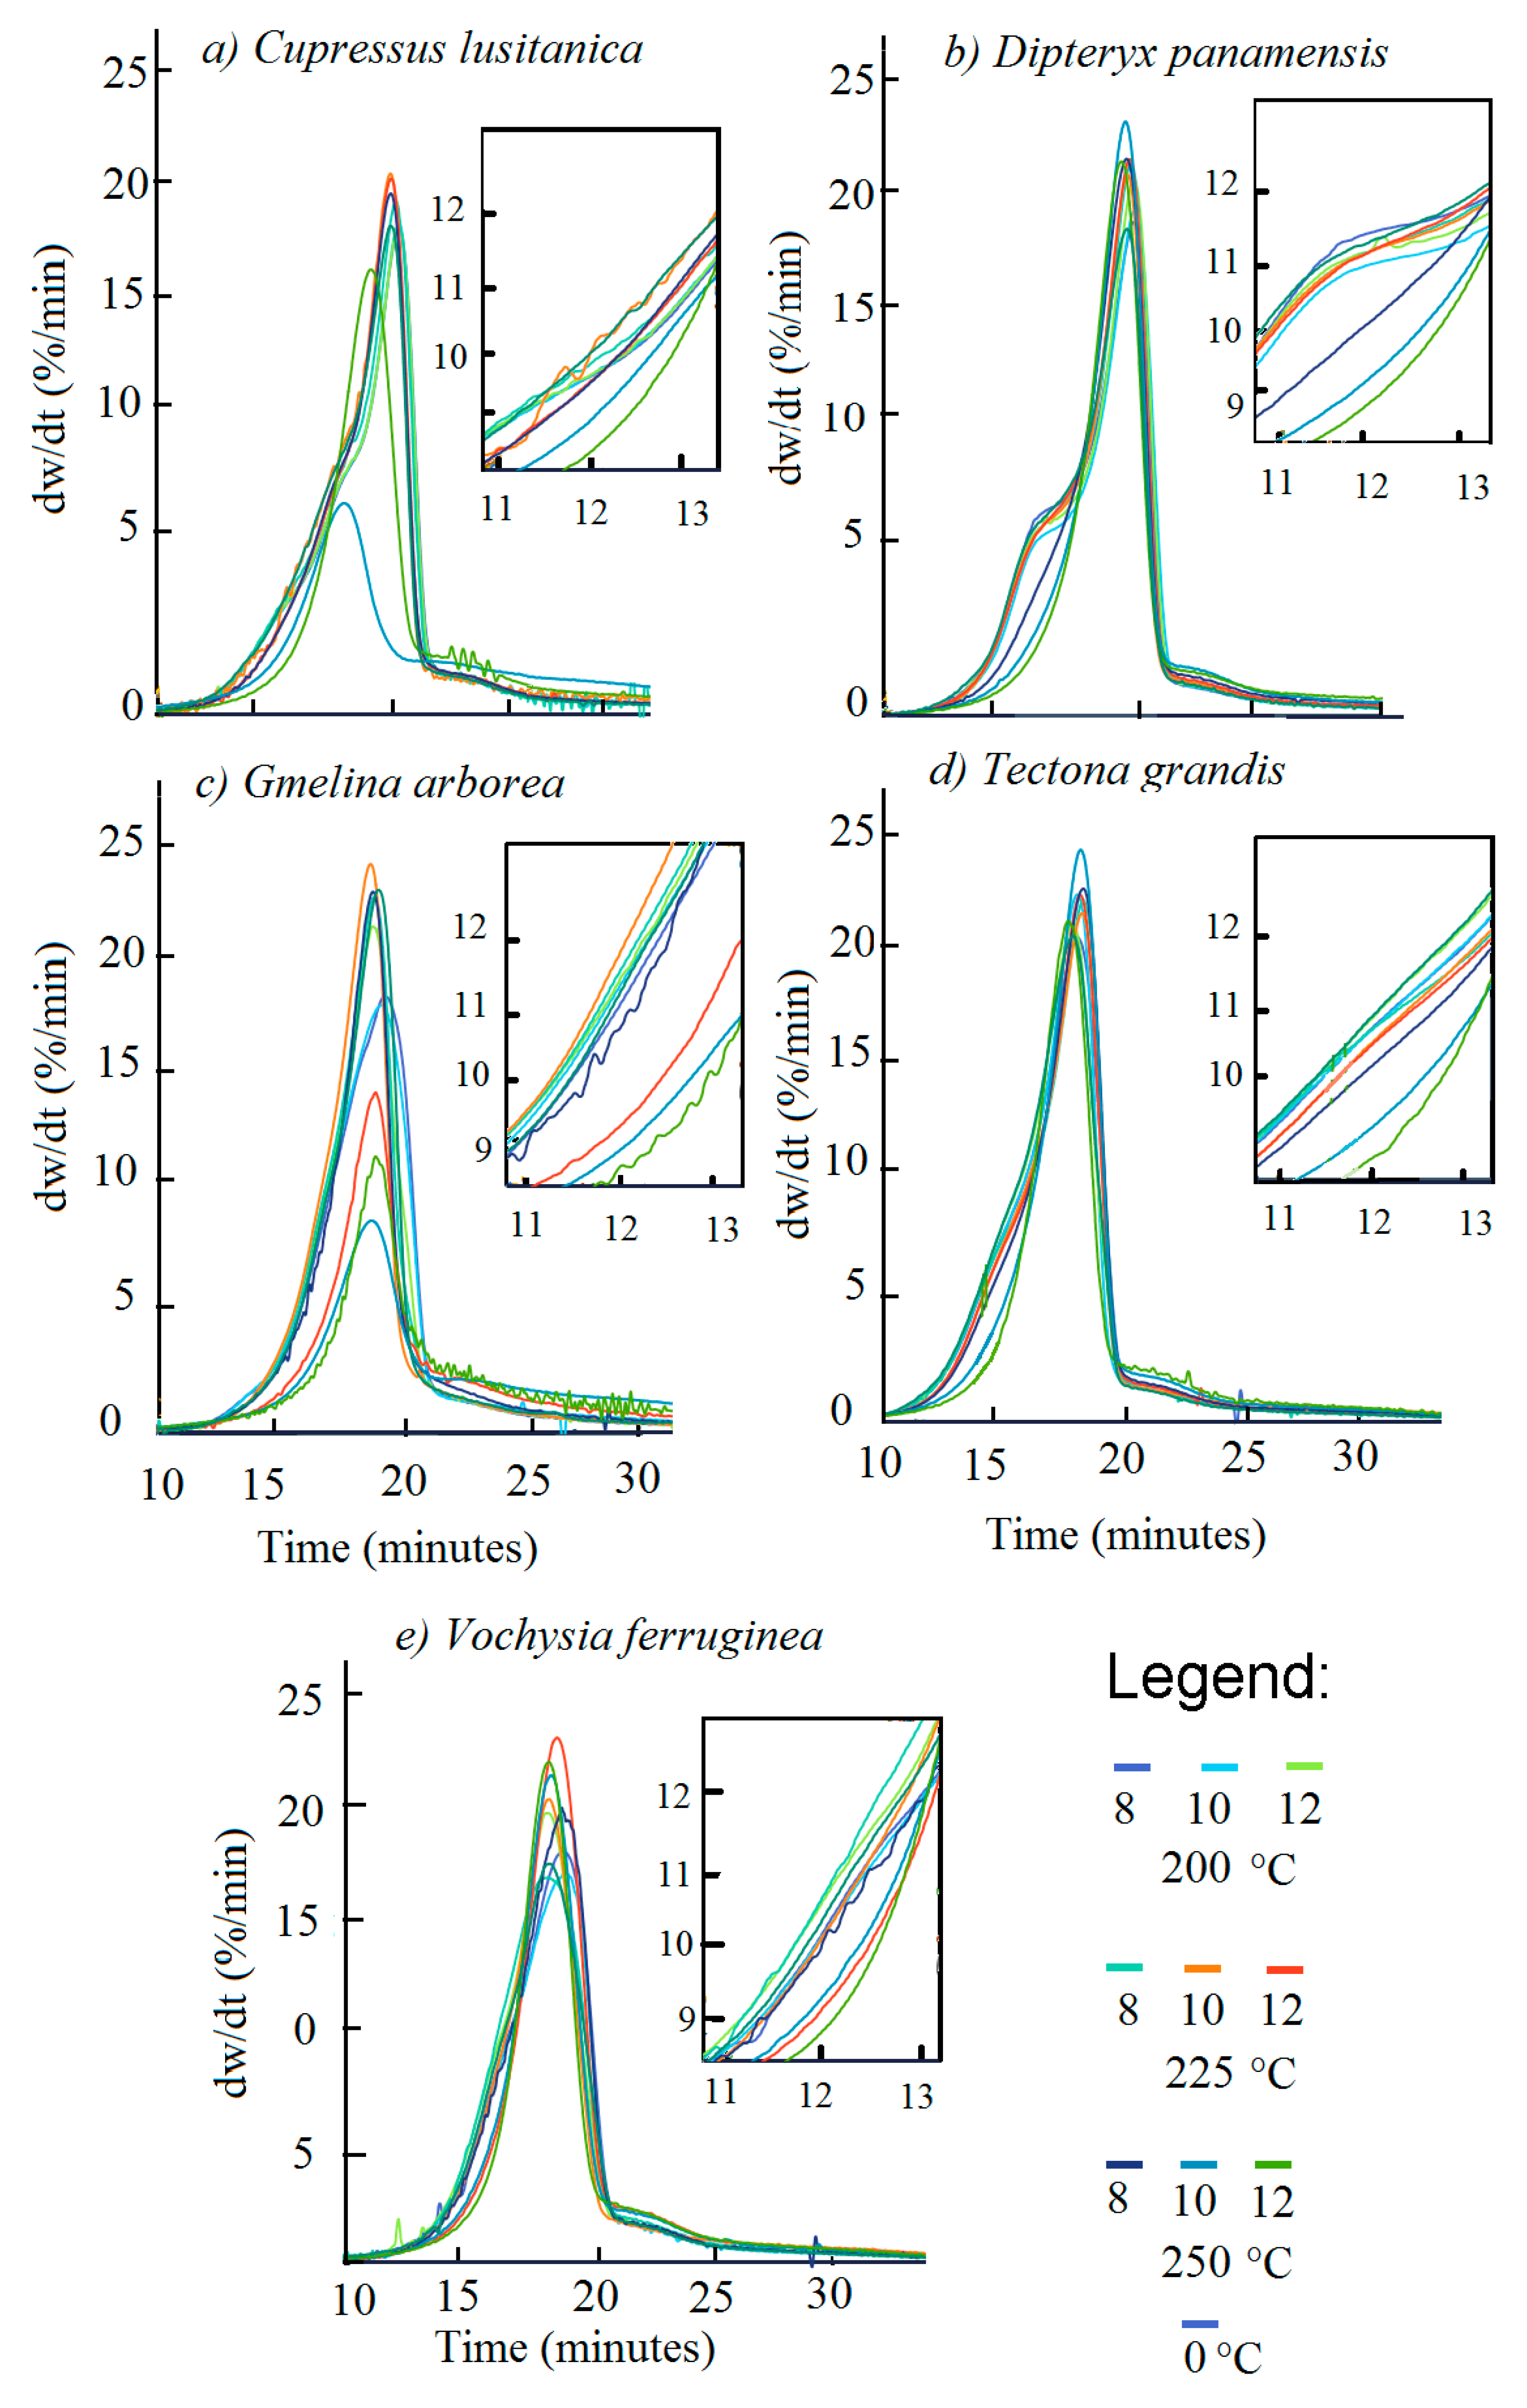
3.2. Devolatilization
Figure 4 displays the devolatilization rate of the torrefied and untorrefied biomasses.
Table 5 shows when D
max was reached and the D
max values. For the
C. lusitanica biomass, torrefaction at 250-10 and 250-12 had lower D
rate values (
Figure 5a) and reached D
max more quickly (
Table 5), whereas D
max increased between 200-8 and 225-12, and then decreased in biomass torrefied at 250 °C.
The
D. panamensis biomass torrefied at 250 °C at the three temperatures had the lowest devolatilization rate. In addition, the shoulder in the devolatilization curve at 13 min disappeared in the biomass torrefied at 250 °C (
Figure 4b). The time to reach D
max showed no significant variation, except for condition 250-12 where the time required was shorter and D
max increased with T
T and t
T, except for condition 250-12, where again the value was low (
Table 5).
G. arborea had the lowest devolatilization rate for all torrefactions, and especially for 225-10, 225-12, and 250 °C in the three t
T (
Figure 4c). The time to reach D
max was approximately 16 min in the different types of biomass. However, the shortest time was obtained with 250-10 (
Table 5). The D
max value increased at 225 °C, but decreased at 250 °C.
The
T. grandis torrefied biomass had a D
rate above 20 dw/dt, whereas torrefactions at 250-10 and 250-12 displayed no inflexion at 13 min (
Figure 3d). The maximum devolatilization was reached at 17 min for the untorrefied biomass and 200 °C and 250-12 for torrefied biomass. Under other torrefaction conditions, the time exceeded 18 min. D
max increased with increasing T
T and t
T of torrefaction, with the exception of 250-12, which had a low D
max value (
Table 5).
Under conditions 200-8, 200-10, and 225-8, the torrefied
V. ferruginea had a lower D
rate relative to the torrefied and untorrefied biomass under the other conditions (
Figure 4e). The time to reach D
max was close to 17 min, with a slight increase in the value of D
max with increasing T
T and t
T of torrefaction (
Table 5).
Notably, in all species, once D
max was reached, the slope of the curve became more severe, with a steeper slope (
Figure 4a–e).


