Article

A Recognition Method of the Hydrophobicity Class of Composite Insulators Based on Features Optimization and Experimental Verification

1
School of Electric Power, South China University of Technology, Guangzhou 510640, China
2
Electric Power Research Institute, China Southern Power Grid Co., Ltd., Guangzhou 510080, China
*
Author to whom correspondence should be addressed.
Energies 2018, 11(4), 765; https://doi.org/10.3390/en11040765
Submission received: 17 January 2018 / Revised: 11 March 2018 / Accepted: 21 March 2018 / Published: 28 March 2018

Abstract

:
The hydrophobicity of composite insulators is a great significance to the safe and stable operation of transmission lines. In this paper, a recognition method of the hydrophobicity class (HC) of composite insulators based on features optimization was proposed. Through the spray method, many hydrophobic images of water droplets on the insulator surface at various hydrophobicity classes (HCs) were taken. After processing of the hydrophobic images, seven features were extracted: the number n, mean eccentricity Eav and coverage rate k1 of the water droplets, and the coverage rate k2, perimeter Lmax, shape factor fc, and eccentricity Emax of the maximum water droplet. Then, the maximum value Δxmax, the minimum value Δxmin, and the average value Δxav of the change rate of each feature value between adjacent HCs, and the volatility Δs of each feature value, were used as the evaluation indexes for features optimization. After this features optimization, the five features that are most closely related to the HC were obtained. Lastly, a recognition model of the HC with the five features as input and the seven HCs as output was established. When compared with the spray method and the contact angle method, the correct rate of the proposed recognition method was 98.1% and 95.2%, respectively. The influence of subjective factors on the spray method was effectively overcome.

1. Introduction

Composite insulators have been widely used because of their good hydrophobicity and unique hydrophobic migration characteristics [1]. According to statistics, the number of composite insulators used in the world had reached 20 million by the end of 2013 [2]. Especially in China, composite insulators have been popularized. In ultra high voltage (UHV) alternating current (AC) and direct current (DC) transmission systems, the most commonly used are the hydrophobic composite insulators instead of hydrophilic insulators in China. Because, on traditional hydrophilic insulator surfaces, a water film is easily formed in humid environments, leading to the leakage of the current and dry-band discharges, which can ultimately cause contaminated flashover accidents [3,4]. Hydrophobicity causes the water on the insulator surface to form small droplets that are separated from each other, rather than a water film. This makes it difficult for a conductive channel to form on the surface. Additionally, the contamination flashover voltage of the composite insulators will be greatly increased [5]. However, due to the influence of natural weathering, corrosion, corona, electric heating, and other factors, the hydrophobicity and the hydrophobicity migration rate of insulators continuously decreases over time. The loss of hydrophobicity will lead to a decrease of the external insulation capacity of the insulators, leading to flashover. Therefore, it is necessary to detect the hydrophobicity of composite insulators on-line periodically in order to ensure the safe and reliable operation of the power system [6,7].
The commonly used methods of detecting the hydrophobicity of insulators include the contact angle method, surface tension method, and the spray method [8,9,10]. Because of its simple operation and the advantages of field testing, the spray method has been widely used in the detection of hydrophobicity of composite insulators. However, this method is mainly based on naked eye observation, introducing the subjectivity of human judgment, and the classification basis is a coarse value of the wetting status. It is difficult to divide the HC step by step accurately. Therefore, some scholars put forward the use of a combination of image processing and the spray method to determine the hydrophobicity class (HC) of insulators.
The research on HC recognition based on image processing has made some progress. Berg et al. [11,12] proposed the use of the acronym average of normalized entropies, which can reflect the brightness information of the hydrophobicity images, in order to recognize the HC of the insulators. Jarrar et al. [13] selected the most significant contributing features from the radon transform-based features, discrete wavelet transform-based features, contourlet transform-based features, discrete cosine transform-based features and gray level co-occurrence matrix-based features. These features reflect the brightness and energy information of the images, both of which will be affected by the conditions of the light and photography.
Some scholars began to extract the geometric features of the images, which are only influenced by the shape of the water droplets in the images, to determine the hydrophobicity. Tokoro et al. [14] proposed using the shape factor of water droplets to estimate the HC. The shape factor is determined by the area and perimeter of the maximum water droplet. Li et al. [15,16] upgraded the shape factor method: the coverage rate of the maximum water droplet was combined with the shape factor as the joint criterion to recognize the HC of insulators. Sun et al. [17] put forward the suggestion to use the coverage rate of the water droplet, area ratio, shape factor, and eccentricity of the maximum water droplet to recognize the HC. Peng et al. [18] indicated that using the number, uniformity, and coverage of water droplets as joint criterion could also successfully recognize the HC. In these studies, a variety of features were introduced for the purpose of recognizing the HC of insulators from many aspects of the images. In theory, the increase in the amount of features will increase the information content for recognizing the HC, thereby ensuring that the recognition results will be more accurate. However, although there are some features that can reflect the information of hydrophobic images, they may have little correlation with the HC. The increased use of such features cannot help to improve the recognition effect or even reduces the rate of correct recognition results. Therefore, it is necessary to optimize these features to raise the recognition rate. The literature [13] has optimized the brightness and energy features. However, there is no study on the optimization of the geometric features.
In this paper, after the processing of the hydrophobic images, the most widely used seven geometric parameters are extracted including: the number n, mean eccentricity Eav and coverage rate k1 of the water droplets, and the coverage rate k2, perimeter Lmax, shape factor fc, and eccentricity Emax of the maximum water droplet. These features are used to evaluate the HC. Then, the seven features are optimized to obtain the features which are better related to the HC. An HC recognition model of composite insulators based on features optimization and a back propagation (BP) neural network is established. The results of the recognition model are compared with those that were obtained by the spray method and contact angle method.

2. Processing of Hydrophobic Images

2.1. Acquisition of Hydrophobic Images

The FXBW-10/70 composite insulator with a simple structure was selected as the test sample. The physical map and characteristics of the FXBW-10/70 composite insulator are shown in Table 1. The test adopted the quantitative brushing method of artificial contaminated composite insulators [19]. The contaminated insulators were dried for different lengths of time in order to achieve different HCs. The test carried out the spray method on insulators in accordance with the regulations that were proposed by the Swedish Institute (STRI) in the STRI Guide-92/1 [20]. Hydrophobic images of the insulators were taken by a camera.
For the photography, we followed the points outlined below:
(1)
photographing in outdoor areas with enough light; and,
(2)
photographing should be vertical as far as possible, and the distance between the digital camera and the insulator should be consistent each time.
After the photographing, the images were cut to facilitate image processing. The images are 568 (W) × 330 pixels in size. Areas with uniform illumination, high definition, and little reflection should be selected as much as possible during the clipping process.

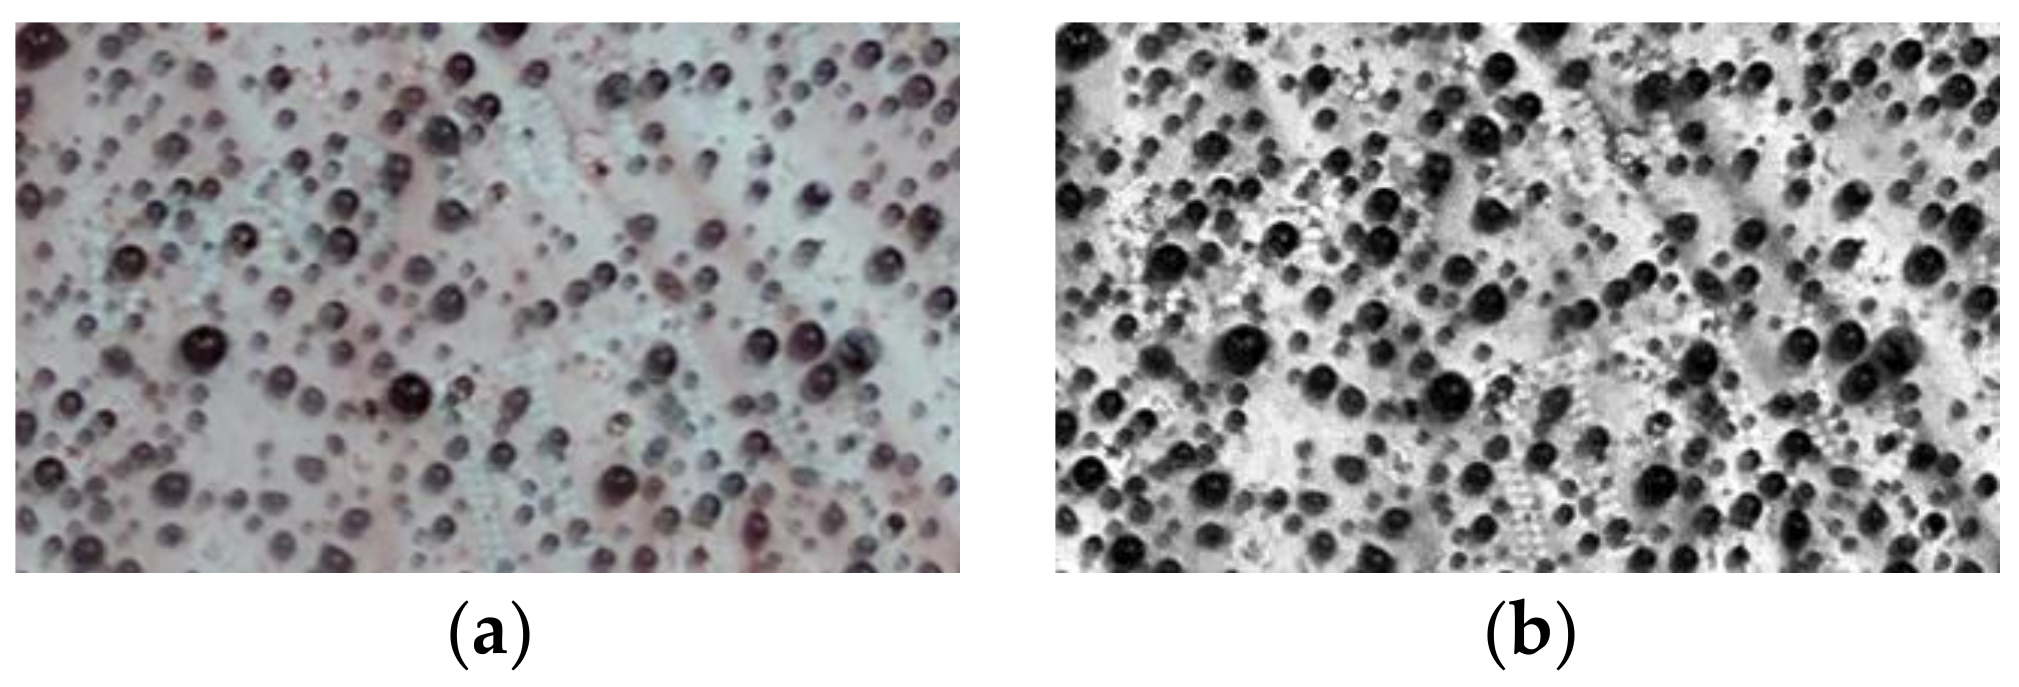
2.2. Image Enhancement

In the experiment, the hydrophobic images were enhanced using gray-scale processing [21,22] and adaptive histogram equalization [23,24].
The idea of image gray-scale processing is to transform the color image composed of red, green, and blue into gray. Gray-scale images contain only brightness information, and this can not only reflect the morphological characteristics of the image, but also reduce the amount of interference information.
Adaptive histogram equalization is based on using each pixel of the gray-scale image as the center, with histogram equalization being performed in a sliding window. The window will be adjusted according to the change in the characteristics of the image itself. This will make the histogram distribution of the image more uniform and improve the quality of the image.
In this paper, gray-scale processing and adaptive histogram equalization were used to process the image, which weakens the interference of complex factors on the recognition of water droplets and makes the details of the image more prominent. The visual effect of the images was therefore significantly improved. Figure 1 shows the enhancement effect of gray-scale processing and adaptive histogram equalization on images. The image contrast of the enhanced image is much higher than that of the original image, and the edge details become clearer.

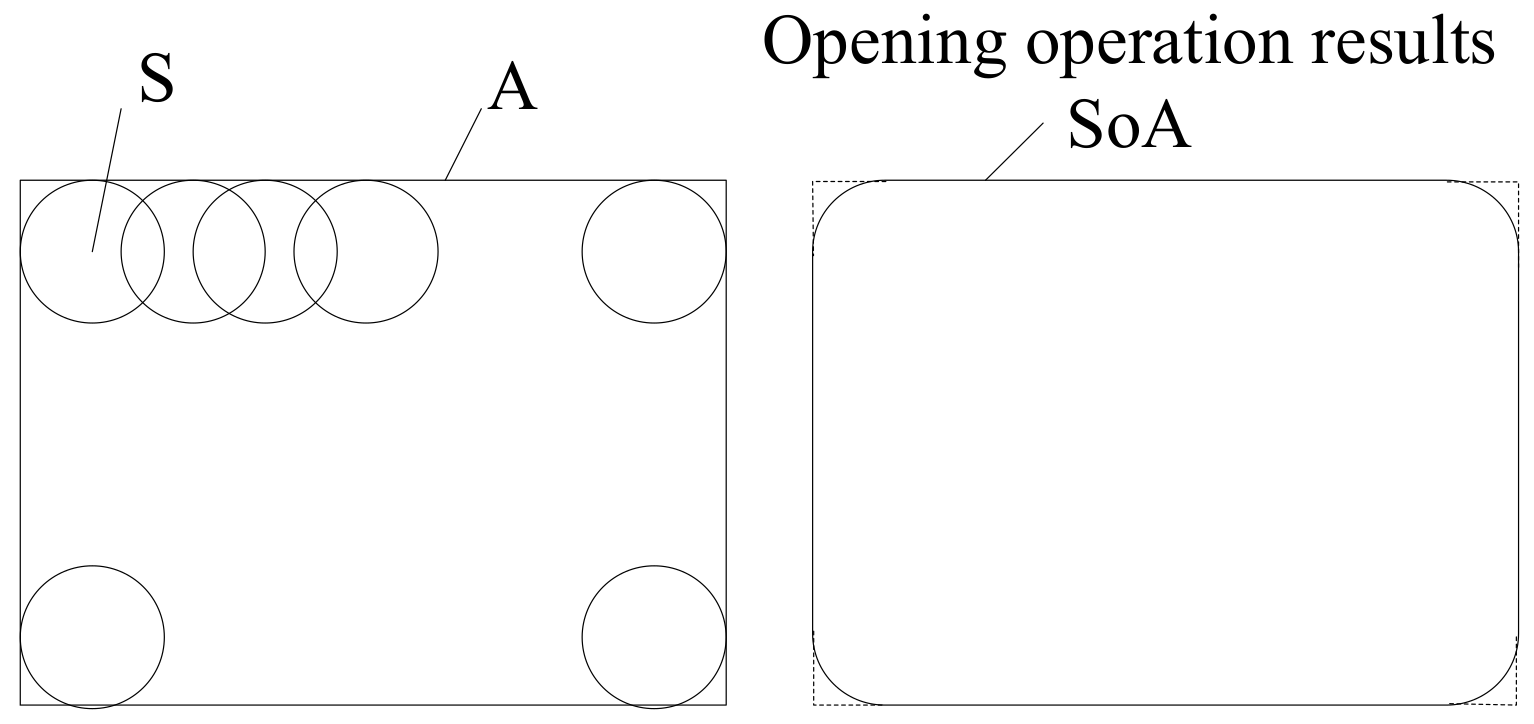
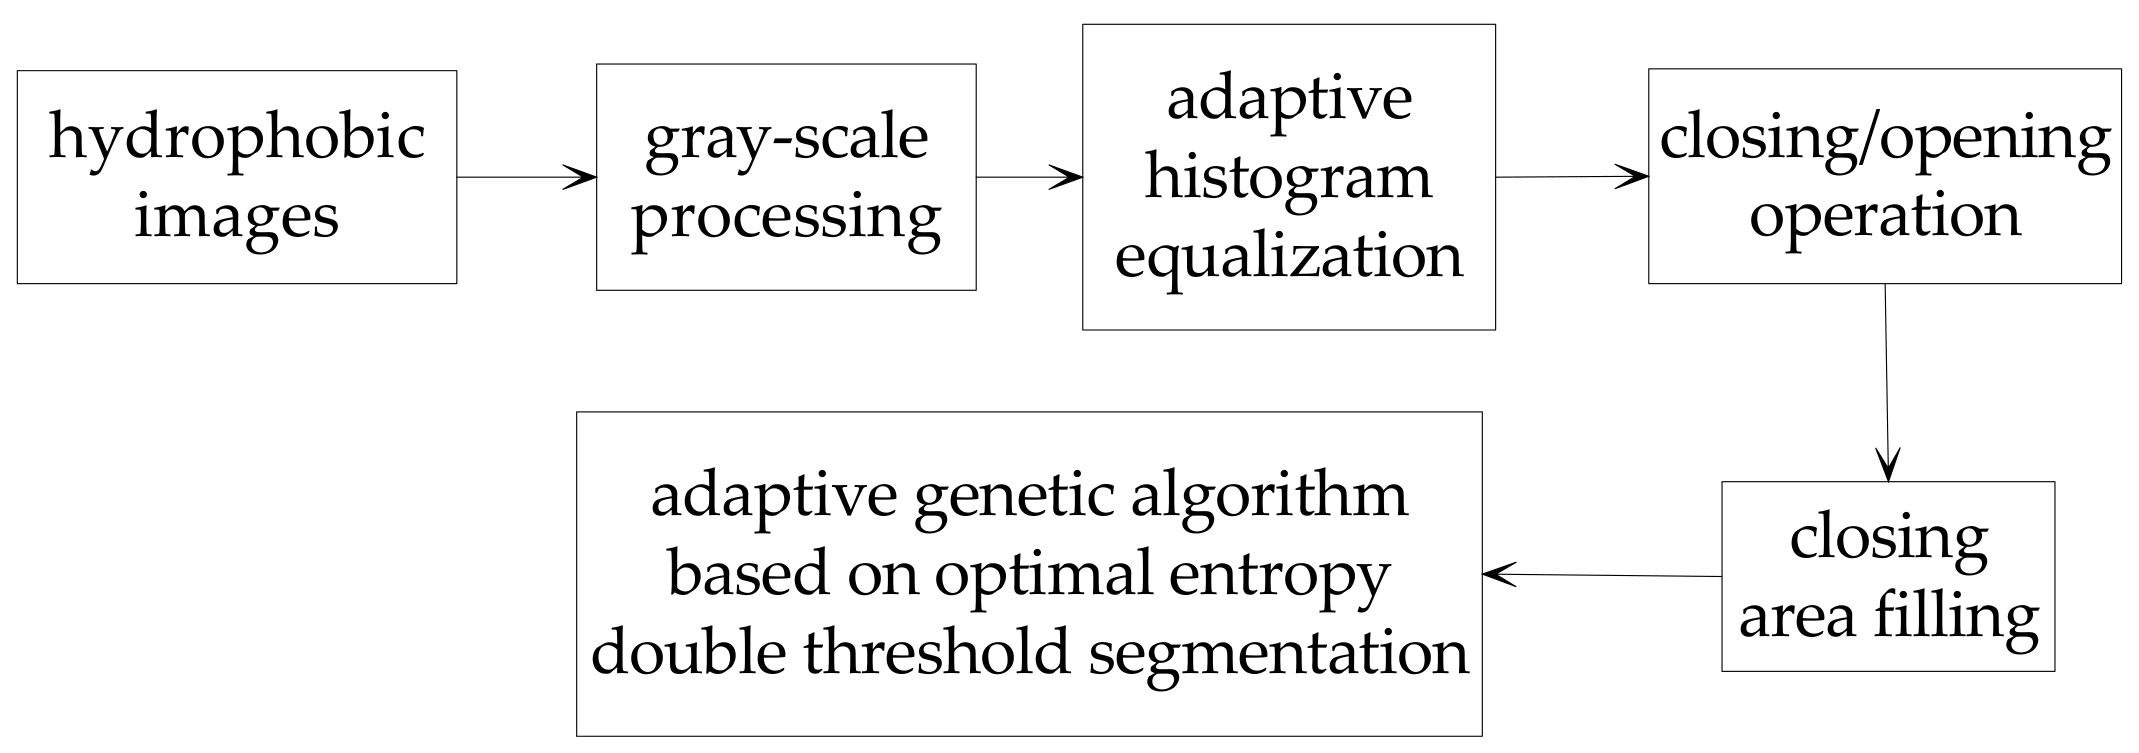
2.3. Morphological Operation

Due to the complexity of hydrophobic images, the water droplets in the image may break and some water droplets may adhere to each other. Due to the effect of reflective light and other light factors, there were small holes in some water droplets. In order to solve these problems, the morphological method [25] (closing/opening operation and closing area filling) was used to correct the image to restore the real water droplets.
The closing operation is as follows: we assume that the structural element S revolves around and clings to the outer boundary of A. So, the outer boundary of S always intersects with the outer boundary of A. In this process, there is always a point closest to the outer boundary of A in S. The set of all such points is the result of the closing operation, as shown in Figure 2.
The opening operation is as follows: we assume that the structural element S is located in A. S revolves around and clings to the inner boundary of A. In this process, there is always a point that is closest to the inner boundary of A in S. The set of all such points is the result of the opening operation, as shown in Figure 3.
The closing area filling is as follows: by filling the closing area of the image, we can fill the hole in the water droplets that is caused by the reflection.

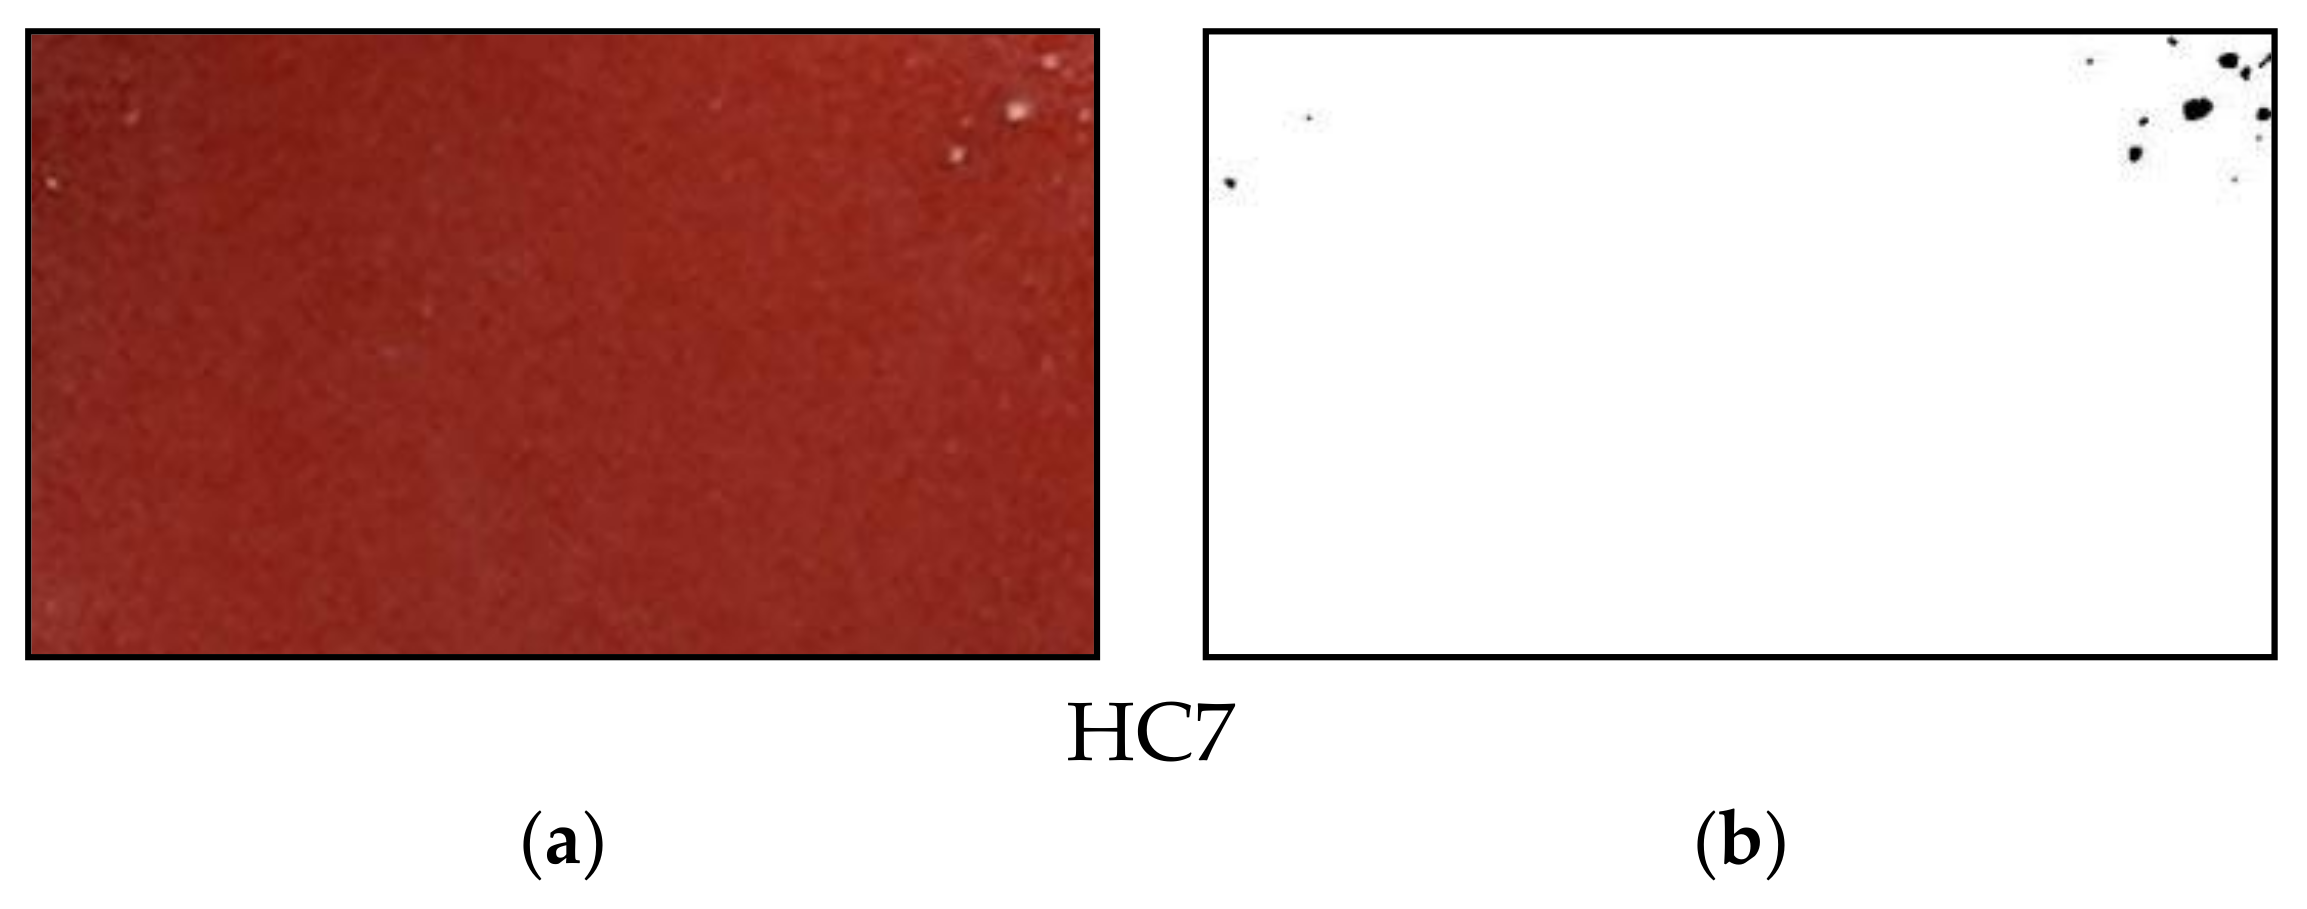
2.4. Images Segmentation

The optimal entropy double threshold segmentation based on a genetic algorithm [26,27] was used to segment the hydrophobic images in this paper.
The chromosome was coded by sixteen bit binary numbers. The initial population was generated randomly, the population size was 30, the maximum propagation algebra was 100, the fitness function was the total entropy of the image, the crossover probability was 0.8, and the mutation probability was 0.01. Mating and breeding were repeated until the maximum reproductive algebra was reached. The optimal individuals in each generation were counted, and the optimal individual in the whole process was selected and decoded as the threshold.
In this paper, the flow chart of the processing of hydrophobic images is shown in Figure 4.
According to the steps above, the images of each HC were processed and the water droplets were extracted, and the results are shown in Figure 5. It can be seen from the figures that the background and water droplets are obviously contrasting, and the water droplets can be clearly recognized.

3. Optimizing Selection of Hydrophobic Image Features

3.1. Features Extraction

In the images of different HCs, the number, shape, size, and other aspects of the water droplets are all different. In this paper, we extracted the water droplets’ geometric parameters. Seven kinds of geometric features, all of which are widely used in hydrophobic image processing, were extracted.
(1) The number of water droplets, n: that is the number of water droplets that are contained in the hydrophobic images.
(2) The coverage rate of water droplets, k1, is calculated by formula (1)
k 1 = i = 0 n S i / S a l l
where Si is the size of the i-th water droplet in pixels, and Sall is the size of the image in pixels.
(3) The coverage rate of the maximum water droplets, k2, is calculated by formula (2)
k 2 = S m a x / S a l l
where Smax is the size of the maximum water droplet in pixels.
(4) The perimeter of the maximum water droplet Lmax. Lmax is the length of the edge of the water droplet in pixels.
(5) The shape factor of the maximum water droplet, fc, is calculated by formula (3)
f c = 4 π S m a x / L m a x 2
(6) The average eccentricity of water droplets Eav and the maximum eccentricity of the water droplets Emax. The water droplets are transformed into the corresponding elliptic. The major axis and minor axis of the ellipse are equivalent to that of the water droplets. Eccentricity is the ratio of the major axis and minor axis, which is calculated by formula (4)
E = a / b
where a represents the major axis and b represents the minor axis. Eccentricity indicates the roundness of the water droplets. The higher the HC, the more rounded the water droplets, and the closer the eccentricity is to 1.
Among these features, n and Lmax are closely related to hydrophobicity. The other five features are not affected by the light conditions, distance and angle of the photographing, but are only related to the HC of insulators.

3.2. Evaluation Indexes for Features Optimization

The correlation between the features and the HCs has an important influence on the recognition of the HC. With the increase of the difference in the value of the feature between adjacent HCs, the effect of the feature that is used to recognize the HCs will be improved. In this paper, the maximum value Δxmax, the minimum value Δxmi, and the average value Δxav of the change rate of each feature value between adjacent HCs, and the volatility Δs of each feature value, were used as the evaluation indexes for the features optimization. The correlation between the features and the HCs will be improved with the increase of the change rate. The change rate of the feature between adjacent HCs is demonstrated by formula (5). Δxmax, Δxmin, Δxav, and Δs are as shown in formulas (6)–(9)
[ x i , x i + 1 ] = | x i + 1 x i | / m a x ( x i , x i + 1 )
Δ x m a x = m a x { [ x 1 , x 2 ] , [ x 2 , x 3 ] , [ x i , x i + 1 ] }
Δ x m i n = m i n { [ x 1 , x 2 ] , [ x 2 , x 3 ] , [ x i , x i + 1 ] }
Δ x a v = { [ x 1 , x 2 ] + [ x 2 , x 3 ] + + [ x i , x i + 1 ] } / i
Δ s = { ( x 1 x ¯ ) 2 + ( x 2 x ¯ ) 2 + + ( x i x ¯ ) 2 } / ( x ¯ 2 × i )
where xi represents the value of the feature at the HCi level.

3.3. Features Optimization

We selected 30 images of each HC that were closest to the standard images given by STRI, from the hydrophobic images obtained by the spray method. We then extracted the seven features from these images. Subsequently, the features were analyzed and counted, and scatter plots of the features at different HCs were obtained, as shown in Figure 6. The average value of each feature of different HCs is shown in Table 2. The evaluation indexes values of each feature are shown in Table 3.
From Figure 6 and Table 2, we reach the following conclusions:
(1)
With the augment of the HC, the water on the insulator surface changes from water droplets to then coexistent water droplets and water traces, until the water traces. As can be seen from Figure 6a, n shows a gradual downward trend. At the same time, the n of each HC demonstrates a segmented condition: HC1–HC3 increases to around 150–300, HC4 and HC5 are centered at around 50–150, and HC6 and HC7 are close to 1 due to the appearance of the whole piece of the water trace.
(2)
As shown in Figure 6b,c, the values of k1 and k2 both increase with the augment of the HC. The values of k1 of different HCs are obviously different, so are the values of k2.
(3)
As shown in Figure 6d, when the HC is 1–3, the water on the insulator surface shows the shape of small water droplets. Lmax of the largest water droplet increases with the augment of HC. When the HC is 7, the number of water traces on the surface is close to 1, as shown in Figure 6a. The largest water trace essentially covers the whole image and the shape of it is usually regular. So, the value of Lmax is close to 1796 which is the perimeter of the whole image. While when the HC is 5, the largest water trace is very irregular and has a lot of concave and convex. The presence of the concave convex greatly increases the perimeter of water trace greatly. So, at this point, Lmax has the maximum value. Lmax increases first and then decreases with the augment of HC, and the difference of Lmax between adjacent HCs is clear.
(4)
As shown in Figure 6e, with the augment of HC, the fc shows the trend of the U type, which decreases first and then increases. The change of fc is regular.
(5)
As shown in Figure 6f, Eav increases gradually with the augment of HC, but this trend is not obvious. The Eav values of different HCs are very similar. As can be seen from Figure 6g, the Emax values of different HCs are very close, too.
From Table 3, we can draw the following conclusions:
(1) The Δxmax of the, qualities n, k1, k2, Lmax, fc and Emax are 93.07%, 33.33%, 80.83%, 76.82%, 88.78%, and 52.50%, respectively. The Δxav of these qualities are 44.14%, 24.23%, 51.14%, 48.82%, 51.57%, and 22.60%, respectively. While Δxmax and Δxav of Eav are only 8.33% and 5.13%, respectively, and are both much smaller than those of the qualities n, k1, k2, Lmax, fc and Emax. Therefore, compared to the qualities n, k1, k2, Lmax, fc and Emax, the difference in the Eav values between adjacent HCs is much smaller. There is little correlation between Eav and the HCs.
(2) The Δxmin of the qualities n, k1, k2, Lmax and fc are 6.93%, 9.10%, 9.10%, 23.73%, and 41.80%, respectively. The Δs of these qualities are 0.6242, 0.2872, 1.2985, 0.8661, and 0.3440, respectively. While Δxmin and Δs of Emax are only 0 and 0.0610, respectively, which are both much smaller than those of the qualities n, k1, k2, Lmax, and fc. There is an almost complete overlap of Emax values between adjacent HCs. Additionally, the volatility Δs of Emax is only 1/5th of that of the qualities n, k1, k2, Lmax, and fc. Therefore, when compared to the qualities n, k1, k2, Lmax, and fc, there is little correlation between Emax and the HCs.
Through the analysis above, we know that the variation trend of n, k1, k2, Lmax, and fc is regular, and the Δxmax, Δxmin, Δxav, and Δs of these five qualities are all above 33%, 6.9%, 24%, and 0.28, respectively. It shows that the changes of n, k1, k2, Lmax, and fc between the adjacent HCs are significant, and the difference is clear. Therefore, these five features can be used as the main criterion to determine the HC. The five features can comprehensively describe the geometric characteristics of water droplets from the number, coverage, perimeter, and shape factor. Adjacent HCs can be effectively distinguished through the combined use of these five features.

4. HC Recognition Model and Experimental Verification

4.1. HC Recognition Model

The BP neural network [28,29] is a multilayer feed forward network trained by an error propagation algorithm. The idea is that the input signal is transmitted in reverse, and the error is transmitted in the opposite direction. After adjusting the weight of the signal several times, the actual output will be close to the expected output.
The BP neural network model is shown in Figure 7, and it consists of three parts: the input layer, the hidden layer, and the output layer. The learning and training processes are divided into three stages, as follows:
(1)
forward transfer of information. The input layer transmits the received input information to the hidden layer. After processing and transformation, the output layer outputs the result to the outside;
(2)
calculation error. If the error requirement or the number of operations is equal to the maximum number of learning times, the training is finished. If not satisfied, enter the third stage; and,
(3)
error back propagation. The error is inverted layer by layer, and the weight correction is carried out using the method of error gradient descent. After correcting the weights of each layer, we take them into the first step.
In this paper, we took five features of hydrophobic images as input information, and HC1–HC7 as the expected output information, in order to establish and train the BP neural network model for the recognition of the HC. The BP neural network has three hidden layers in this design. According to the approximate relation p = 2q + 1, where p represents the number of neurons in the hidden layer and q represents the number of neurons in the input layer, p is 11.

4.2. Experimental Verification

In order to verify the correct rate of the HC recognition model established above, the test results of the recognition model were compared with the spray method and the contact angle method.

4.2.1. Comparison with the Spray Method

According to the spray method given by STRI, a further 210 pieces of hydrophobic images were obtained, including 30 pieces of each HC. The HCs of these hydrophobic images were used as reference values. Through processing of the hydrophobic images, five features were extracted. The obtained features were then inputted into the HC recognition model, before the output HC given by the model was compared with the spray method and the correct rate of each HC level was obtained, as shown in Table 4.
According to Table 4, the correct rate of the HC recognition model that is established in this paper is as high as 98%. The correct rate of recognition of the HC1, HC4, HC6, and HC7 levels reaches 100%. The correct rate of HC2, HC3, and HC5 levels is over 93%, and the misjudgment only occurs between adjacent HCs. The correct rate of this study is clearly improved when compared with the correct rate obtained in previous research [13,17,18], which had fewer qualities or did not optimize the qualities.

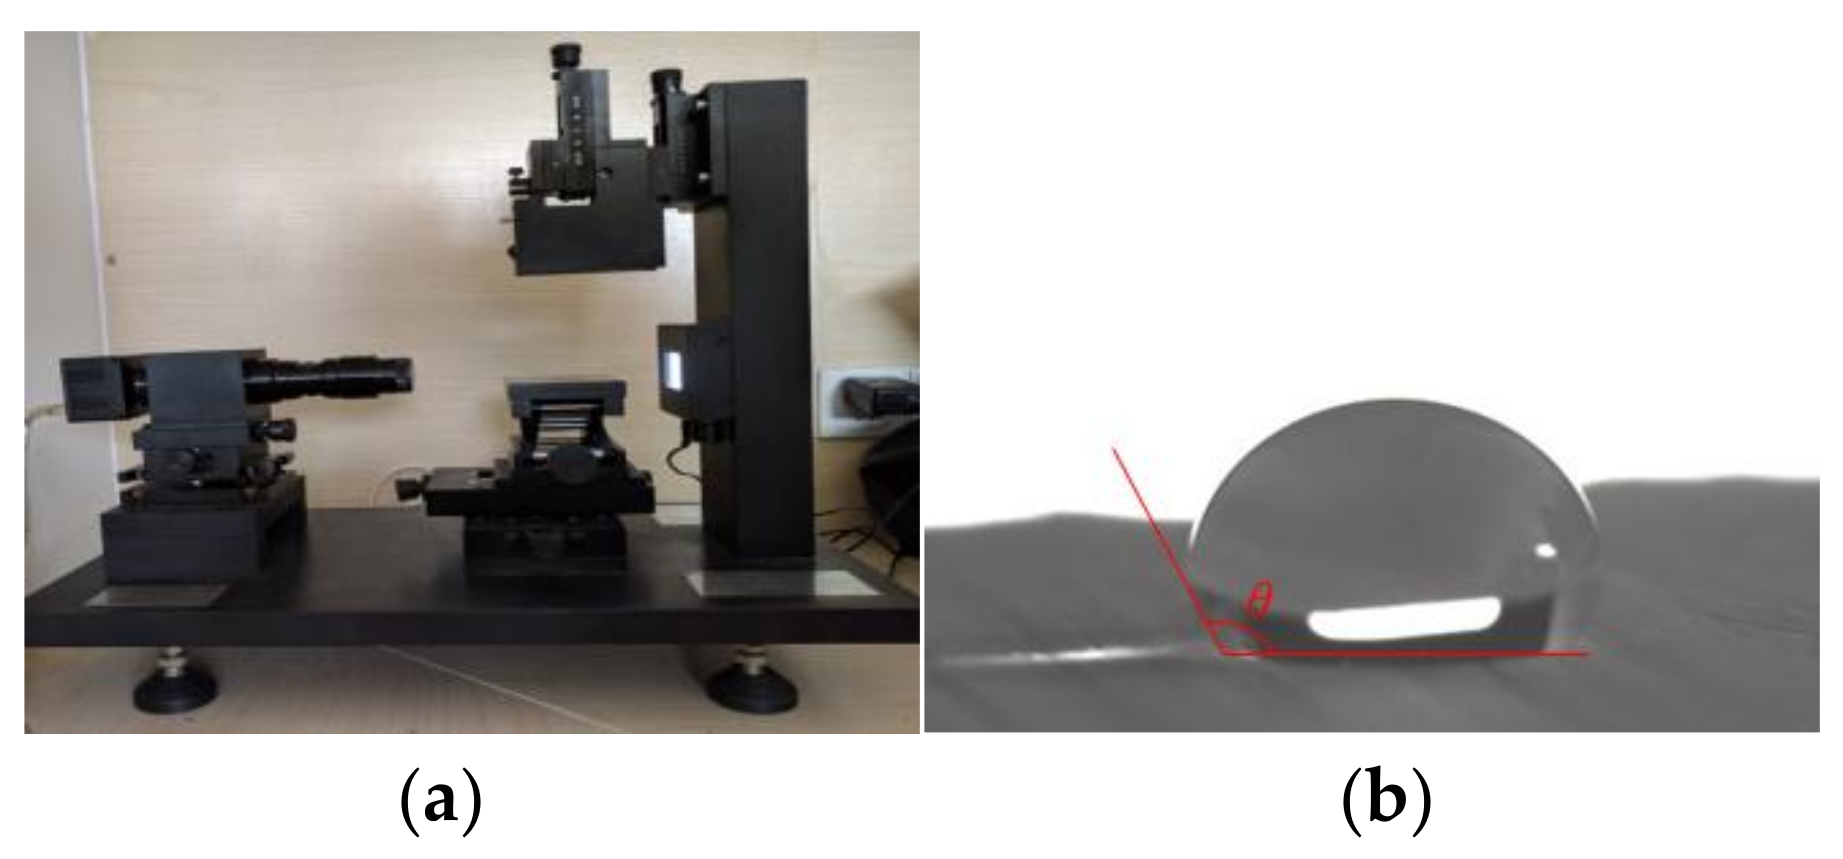
4.2.2. Comparison with the Contact Angle Method

Test pieces were cut from the same type of composite insulator. The test piece and the whole insulator in the same group were placed in the same environment for the same length of time. Then, the static contact angle of test piece, recorded as test value θt, was measured. Hydrophobic images of the whole insulator were obtained by the spray method. Then, the recognition model was used to recognize the HC of the images. The static contact angle was measured by the contact angle measuring instrument POWEREACHJ2000D, as shown in Figure 8a. In the measurement process, the test piece was placed onto the measuring platform. A special pipette was used to drop water vertically on the test piece. The water droplet volume is about 5 μL. We recorded the water droplet, and made a tangent of the water droplet at the intersection of the water droplet and the test piece. The angle between the tangent line and the horizontal line is the static contact angle, as shown in Figure 8b. Each test piece was measured five times in different positions, and the average value was taken as the final static contact angle. Finally, 21 groups of the HC and the corresponding test value θt were obtained. There are three sets of θt of each HC.
Moreover, we used the static contact angle, recorded as θr, produced by the respective HCs given by the spray method, as the reference value to determine the correct rate of the results of recognition model established in this paper. Five groups of reference value θr of each HC were obtained.
The range and average of reference value θr produced by the respective HCs, and the comparison of recognition results of the recognition model with the test value θt of the contact angle method are shown in Table 5.
As shown in Table 5, the hydrophobicity becomes better with an increase of the static contact angle. The finding is in agreement with the existing research results [8,30]. We find that when test value θt is 103.80°, it is in the range of [102.51°, 117.33°] and [101.05°, 110.82°] of reference value θr at the same time, however, but it is closer to the average value of 105.04° of the reference value θr when compared to 111.74°. Therefore, the correct HC corresponding to 103.80° is HC2. While the recognition model established in this paper gave the wrong result HC1. Except for 103.80°, the test value θt of each HC is closest to the average of the reference value θr, which is produced by the same HC level. When compared to the contact angle method, the correct rate of the recognition model is 95.2%.

5. Conclusions

In order to exactly recognize the hydrophobicity of composite insulators, this paper proposed a recognition method of the HC based on image processing and features optimization.
To extract the information of the hydrophobicity image more accurately and to reduce the influence of interference factors on the recognition of water droplets, we carried out image enhancement, morphology reduction, and image segmentation of the hydrophobic images. The image contrast between the image background and the water droplets was improved, and the information of the water droplets could be recognized more easily.
The maximum value Δxmax, the minimum value Δxmin, and the average value Δxav of the change rate of each feature value between adjacent HCs, and the volatility Δs of each feature value were put forward as the evaluation indexes for features optimization. Five features, the difference between adjacent HCs of which was obvious, were optimally selected from the seven features that were widely used in hydrophobic image processing. These features are the number of water droplets n, coverage rate of water droplets k1, coverage rate of the maximum water droplets k2, perimeter of the maximum water droplet Lmax, and shape factor of the maximum water droplet fc. A recognition model of the HC, with the five features as the input and seven HCs as the output, was established.
Experiments using the spray method and the contact angle method were carried out to verify the correct rate of the recognition method proposed in this paper. When compared with the spray method and the contact angle method, the correct rate of the recognition method was as high as 98.1% and 95.2%, respectively.

Acknowledgments

This work was supported by the National Natural Science Foundation of China (51507067) and South Power Grid Corp science and technology project (CSGTRC-K163024).

Author Contributions

Lin Yang conceived, designed and performed the experiments. He also wrote the paper; Yanpeng Hao provided guidance throughout the work, and guided the writing and the data analysis; Jikai Bi worked on the analysis part and helped in writing the paper; Lupeng Nian and Zhijun Zhou helped in program writing; Licheng Li provided guidance on the test and contributed experimental tools; Yifan Liao and Fuzeng Zhang contributed analysis tools and software.

Conflicts of Interest

The authors declare no conflict of interest.

References

  1. Wen, X.S.; Yuan, X.Q.; Lan, L.; Hao, L.; Wang, Y.; Li, S.D.; Lu, H.L.; Bao, Z.H. RTV silicone rubber degradation induced by temperature cycling. Energies 2017, 10, 1054. [Google Scholar] [CrossRef]
  2. Papailiou, K.O.; Schmuck, F. Silicone Composite Insulators: Materials, Design, Applications; Springer: Berlin, Germany, 2013. [Google Scholar]
  3. Du, B.X.; Li, Z.L. Hydrophobicity surface charge and DC flashover characteristics of direct-fluorinated RTV silicone rubber. IEEE Trans. Dielectr. Electr. Insul. 2015, 22, 934–940. [Google Scholar] [CrossRef]
  4. Jia, Z.D.; Gao, H.F.; Guan, Z.C.; Wang, L.M. Study on hydrophobicity transfer of RTV coatings based on a modification of absorption and cohesion theory. IEEE Trans. Dielectr. Electr. Insul. 2016, 13, 1317–1324. [Google Scholar] [CrossRef]
  5. Li, C.R.; Zhao, L.J.; Xiong, J.; Zhang, S.Q.; Yao, J.S. Influence of seasons on hydrophobicity of silicone rubber insulators in semi-wet warm-temperature zone of China. IEEE Trans. Dielectr. Electr. Insul. 2008, 15, 1081–1088. [Google Scholar]
  6. Tu, Y.P.; Gong, B.; Yuan, Z.K.; Wang, C.; Xu, Z.; Li, R.H.; Zhang, F.Z. Moisture induced local heating of overhead line composite insulators. IEEE Trans. Dielectr. Electr. Insul. 2017, 27, 483–489. [Google Scholar] [CrossRef]
  7. Hussain, M.M.; Farokhi, S.; McMeekin, S.G.; Farzaneh, M. Risk assessment of failure of outdoor high voltage polluted insulators under combined stresses near shoreline. Energies 2017, 10, 1661. [Google Scholar] [CrossRef]
  8. Guidance on the Measurement of Wettability of Insulator Surface; IEC/TS 62073; IEC: Geneva, Switzerland, 2003.
  9. Cao, H.W.; Yan, D.; Gan, J.H.; Ren, H.; Lu, M.; Lv, Z.B.; Guo, H.H. Investigation and corroboration of a novel method to estimate the hydrophobicity of composite insulators. IEEE Trans. Dielectr. Electr. Insul. 2012, 19, 2029–2032. [Google Scholar]
  10. Mavrikakis, N.C.; Mikropoulos, P.N. Evaluation of field-ageing effects on insulating materials of composite suspension insulators. IEEE Trans. Dielectr. Electr. Insul. 2017, 24, 490–498. [Google Scholar] [CrossRef]
  11. Berg, M.; Thottappillil, R.; Scuka, V. A digital image processing method for estimating the level of hydrophobicity of high voltage polymeric insulating materials. In Proceedings of the 1999 Annual Report Conference on Electrical Insulation and Dielectric Phenomena, Austin, TX, USA, 17–20 October 1999; pp. 756–762. [Google Scholar]
  12. Berg, M.; Thottappillil, R.; Scuka, V. Hydrophobicity estimation of HV polymeric insulating materials development of a digital image processing method. IEEE Trans. Dielectr. Electr. Insul. 2001, 8, 1098–1107. [Google Scholar] [CrossRef]
  13. Jarrar, I.; Assaleh, K.; El-Hag, A.H. Using a pattern recognition-based technique to assess the hydrophobicity class of silicone rubber materials. IEEE Trans. Dielectr. Electr. Insul. 2014, 21, 2611–2618. [Google Scholar] [CrossRef]
  14. Tokoro, T.; Nagao, M.; Kosaki, M. Image analysis of hydrophobicity of silicone rubber insulator. In Proceedings of the 1999 Annual Report Conference on Electrical Insulation and Dielectric Phenomena, Austin, TX, USA, 17–20 October 1999; pp. 763–766. [Google Scholar]
  15. Li, C.R.; Huang, X.M.; Zhao, L.J. Image analysis on the surface hydrophobicity of polluted silicone rubber insulators. In Proceedings of the 2008 International Conference on Condition Monitoring and Diagnosis, Beijing, China, 21–24 April 2008; pp. 21–24. [Google Scholar]
  16. Zhao, L.J.; Li, C.R.; Xiong, J.; Zhang, S.Q.; Yao, J.S.; Chen, X.J. Online hydrophobicity measurement for silicone rubber insulators on transmission lines. IEEE Trans. Power Deliv. 2009, 24, 806–813. [Google Scholar] [CrossRef]
  17. Wang, Q.B.; Huang, Y.X.; Mo, X.X.; Lai, W.X.; Dong, H.B.; Yang, Y.; Liu, J.M.; Huang, J.W.; Sun, Y.L. The hydrophobic detection of transformer composite insulator bushing based on digital image processing technique. In Proceedings of the 2016 IEEE International Conference on High Voltage Engineering and Application, Chengdu, China, 19–22 September 2016; pp. 1–4. [Google Scholar]
  18. Peng, K.X.; Wang, Q.D.; Wang, X.P. Spray image analysis based measurement of hydrophobic of insulator surfaces. Insul. Mater. 2005, 1, 47–51. [Google Scholar]
  19. Artificial Pollution Tests on High Voltage Insulators to be Used on AC Systems; IEC 60507-1991; IEC: Geneva, Switzerland, 1991.
  20. Spray Method Guide, Swedish Transmission Research Institution; STRI Guide 92/1; IEC: Geneva, Switzerland, 1992.
  21. Li, S.B.; Gao, G.Q.; Hu, G.B.; Gao, T.S.; Wei, W.F.; Wu, G.G. Aging feature extraction of oil-impregnated insulating paper using image texture analysis. IEEE Trans. Dielectr. Electr. Insul. 2017, 24, 1636–1645. [Google Scholar] [CrossRef]
  22. Lee, S.W.; Lee, D.J.; Park, H.S. A new methodology for gray-scale character segmentation and recognition. IEEE Trans. Pattern Anal. Mach. Intell. 1996, 18, 1045–1050. [Google Scholar]
  23. Stark, J.A. Adaptive image contrast enhancement using generalizations of histogram equalization. IET Image Process. 2000, 9, 889–896. [Google Scholar] [CrossRef] [PubMed]
  24. Huang, L.D.; Zhao, W.; Wang, J.; Sun, Z.B. Combination of contrast limited adaptive histogram equalisation and discrete wavelet transform for image enhancement. IET Image Process. 2015, 9, 908–915. [Google Scholar]
  25. Daut, D.G.; Zhao, D.M. A flaw detection method based on morphological image processing. IEEE Trans. Circuits Syst. Video Technol. 1993, 3, 389–398. [Google Scholar] [CrossRef]
  26. Kasilingam, R.; Subbu, N. Genetic algorithm based fault tolerant clustering in wireless sensor network. IET Commun. 2017, 11, 1927–1932. [Google Scholar]
  27. Dai, T.P.; Wang, Y.T.; Xue, X.G.; Liu, X.G.; Liu, B.H.; Guo, X.Y. Research of segmentation method on image of lingwu long jujubes based on a new extraction model of hue. IEEE Sens. J. 2017, 17, 6029–6036. [Google Scholar] [CrossRef]
  28. Xiang, M.; Min, J.; Wang, Z.Q.; Gao, P. A novel fault early warning model based on fault gene table for smart distribution grids. Energies 2017, 10, 1963. [Google Scholar]
  29. Zhu, H.L.; Lian, W.W.; Lu, L.X.; Dai, S.Y.; Hu, Y. An improved forecasting method for photovoltaic power based on adaptive BP neural network with a scrolling time window. Energies 2017, 10, 1542. [Google Scholar] [CrossRef]
  30. Chinese Standard DL/T864-2004. Application Guide of Composite Insulators for AC Overhand Lines with a Nominal Voltage over 1000V; Standards Press of China: Beijing, China, 2004. [Google Scholar]
Figure 1. Enhancement of images by gray-scale processing and adaptive histogram equalization. (a) Original image; and, (b) enhanced image.
Energies 11 00765 g001
Figure 2. Closing operation schematic diagram.
Energies 11 00765 g002
Figure 3. Opening operation schematic diagram.
Energies 11 00765 g003
Figure 4. Flow chart of the processing of hydrophobic images.
Energies 11 00765 g004
Figure 5. Processing results of HC1–HC7 level images. (a) Original image; and, (b) processing result images.
Energies 11 00765 g005aEnergies 11 00765 g005b
Figure 6. Feature extraction results. (a) n; (b) k1; (c) k2; (d) Lmax; (e) fc; (f) Eav; and, (g) Emax.
Energies 11 00765 g006
Figure 7. Model of the back propagation (BP) neural network.
Energies 11 00765 g007
Figure 8. Sketch map of contact angle measurement. (a) The contact angle measuring instrument; (b) static contact angle.
Energies 11 00765 g008
Table 1. Technical parameters of the FXBW-10/70 composite insulator.
Energies 11 00765 i001TypeH/mmL/mmD/mmS/cm2
FXBW-10/70310350120/108/90600
Table 2. Average value of each feature of different hydrophobicity class (HCs).
HC Levelnk1k2LmaxfcEavEmax
HC12760.180.0068162.50.6441.341.62
HC22330.270.0117221.10.5851.431.33
HC32170.330.023456.80.3301.562.80
HC41000.490.121970.90.1171.642.13
HC5830.630.395136.30.0451.651.53
HC650.900.902432.30.4011.591.72
HC710.990.991855.20.6891.711.72
Table 3. Evaluation indexes values of each feature.
Evaluation Indexesnk1k2LmaxfcEavEmax
Δ x m a x 93.07%33.33%80.83%76.82%88.78%8.33%52.50%
Δ x m i n 6.93%9.10%9.10%23.73%41.80%0.61%0
Δ x a v 44.14%24.23%51.14%48.82%51.57%5.13%22.26%
Δs0.62420.28721.29850.86610.34400.00610.0610
Table 4. Comparison of recognition results with the spray method.
HC LevelError Level/
Error Number
Total Error NumberTotal Sample NumberCorrect Rate
HC10030100%
HC2HC1/1HC3/123093.3%
HC3HC2/113096.7%
HC40030100%
HC5HC6/113096.7%
HC60030100%
HC70030100%
total correct rate421098.1%
Table 5. Range and average of reference value θr produced by respective HCs, and the comparison of the recognition results of recognition model with test value θt of the contact angle method.
HC LevelReference Value θrRecognition ResultsTest Value θtError Number
RangeAverage
HC1[102.51°, 117.33°]111.74°HC1116.27°103.80°119.05°1
HC2[101.05°, 110.82°]105.04°HC2106.67°107.25°102.50°0
HC3[94.34°, 102.90°]98.36°HC3101.35°99.27°101.24°0
HC4[88.73°, 96.45°]93.08°HC494.75°92.08°89.95°0
HC5[70.44°, 89.64°]78.39°HC571.92°79.39°85.17°0
HC6[59.82°, 72.69°]63.34°HC662.75°70.18°69.15°0
HC7[52.31°, 63.25°]58.54°HC760.08°59.21°52.09°0
correct rate95.2%

