Article

A New Multi-Conductor Transmission Line Model of Transformer Winding for Frequency Response Analysis Considering the Frequency-Dependent Property of the Lamination Core

1
State Key Laboratory of Electrical Insulation and Power Equipment, Faculty of Electrical Engineering, Xi’an Jiaotong University, Xi’an 710049, China
2
Shaanxi Key Laboratory of Smart Grid, Xi’an 710049, China
*
Author to whom correspondence should be addressed.
Energies 2018, 11(4), 826; https://doi.org/10.3390/en11040826
Submission received: 14 March 2018 / Revised: 26 March 2018 / Accepted: 26 March 2018 / Published: 3 April 2018

Abstract

:
Multi-conductor transmission line (MTL) model of power transformer winding for frequency response analysis (FRA) has been successfully applied for the purpose of studying the characteristics of winding deformations. Most of the time it is considered that, at a frequency above 10 kHz, the flux does not penetrate the core, and the iron core losses due to hysteresis and eddy current can be neglected accordingly. However, in fact, there is still a little flux residing in the core, and it has a significant influence on inductances and resistances of transformer winding even up to approximately 1 MHz. In this paper, by introducing the anisotropic complex permeability of the lamination core into calculating inductances and resistances of the MTL model, a new MTL model considering the frequency-dependent property of the lamination core for FRA is presented. In addition, the accuracy and effectiveness of the MTL model are validated by means of a comparison between measured and emulated FRA results in a wide frequency range from 10 Hz up to 10 MHz. This precise MTL model of the transformer winding provides us a more objective and positive condition for simulation research of winding deformation detection.

1. Introduction

The power transformer is one of the most critical pieces of equipment in a power system. The healthy condition of the transformer can guarantee the uninterrupted operation of the power grid. Deformation and distortion of the transformer winding adequately reduce the capacity of the transformer to undergo the large electromagnetic force and excessive mechanical stress generated by the short-circuit currents. Also, a sudden catastrophic failure of the transformer in service may cause massive economic and life loss. Therefore, testing and finding out the minor winding deformation at an early stage is of great importance. The frequency response analysis (FRA) technique is an external and non-intrusive method used to apply a sinusoidal, low voltage sweep frequency signal to one terminal of the transformer winding and receive the response signal from another terminal. Deformations of the winding and core will change the associated inductances, resistances, and capacitances of the transformer winding, thus also changing the response signals. Then, the deformation will be reflected by the change of the FRA curve. The FRA technique, as a comparative method, has three well-known comparative diagnostic approaches. An analysis of the test results relies on the comparison between previous results and present results. This comparison is time-based. If there is no initial FRA trace, it is also feasible to make a comparison among phases in this transformer. This is called construction-based comparison. A comparison based on an identical transformer that comes from the same factory can be applied as a type-based method. As one of the most reliable techniques used to assess the deformations of a transformer, the FRA method has been widely recognized [1,2,3,4,5,6]. Due to the complex structure and expensive maintenance costs of transformers, the simulation analysis method has become a very effective and economical approach to investigate the impacts of internal faults on the FRA signature and characterize the FRA curve under various winding faults [7,8,9,10,11]. A precise simulation equivalent model of the transformer winding is the first and very crucial factor needed to study the deformation of winding. Therefore, it is essential to carry out in-depth studies on the modeling of the transformer winding for deformation detection based on the FRA technique. To date, various kinds of models have been utilized to obtain accurate FRA simulation results. As a widely used model, the lumped parameter circuit was adopted to model the transformer winding in a number of pertinent studies, such as References [12,13,14]. In References [15,16], a hybrid model of a winding was presented for FRA simulation in order to study winding axial and radial deformation. In this model, each disc of the winding was described by traveling wave equations. However, no matter which model was selected to establish the model of the winding, there is an assumption that the influence of the core on calculating the inductance of the windings can be ignored when the frequency is above 10 kHz [17]. The limitation of neglecting the effect of the core eddy current was studied in Reference [18]. The multi-conductor transmission line (MTL) theory was successfully used for FRA and very fast transient overvoltages (VFTOs) studies [19,20]. Because each turn of the disk was treated as a transmission line, the MTL model was found to be more accurate than others. However, in most cases core losses due to hysteresis and eddy current were neglected at frequencies above 10 kHz, and it was thought that there was no flux penetration into the core at a frequency higher than 1 MHz. Therefore, the relative permeability in the equation employed to determine the inductance was regarded as 1, which was the relative permeability of free space [17,21]. In fact, there was still a little flux residing in the core, and it had an impact on the values of inductance and resistance [22]. Therefore, it is necessary to set up a new MTL model for FRA simulation analysis that can effectively include the influence of the lamination core on the FRA results.
In this paper, starting with a single conductor transmission line equation, the MTL model expressions are primarily deduced. Secondly, by means of introducing theanisotropic complex permeability of the lamination core into calculating inductances and resistances of the MTL model of the transformer winding, the frequency-dependent losses of the transformer core are taken into consideration. By this method, a refined and precise model based on MTL is presented for FRA. Finally, in order to verify this model, a comparison between measured and emulated FRA results is made and a numerical index is used to quantitatively evaluate the advancement of the new MTL model.

2. Multi-Conductor Transmission Line Model of Transformer Winding Used for Frequency Response Analysis

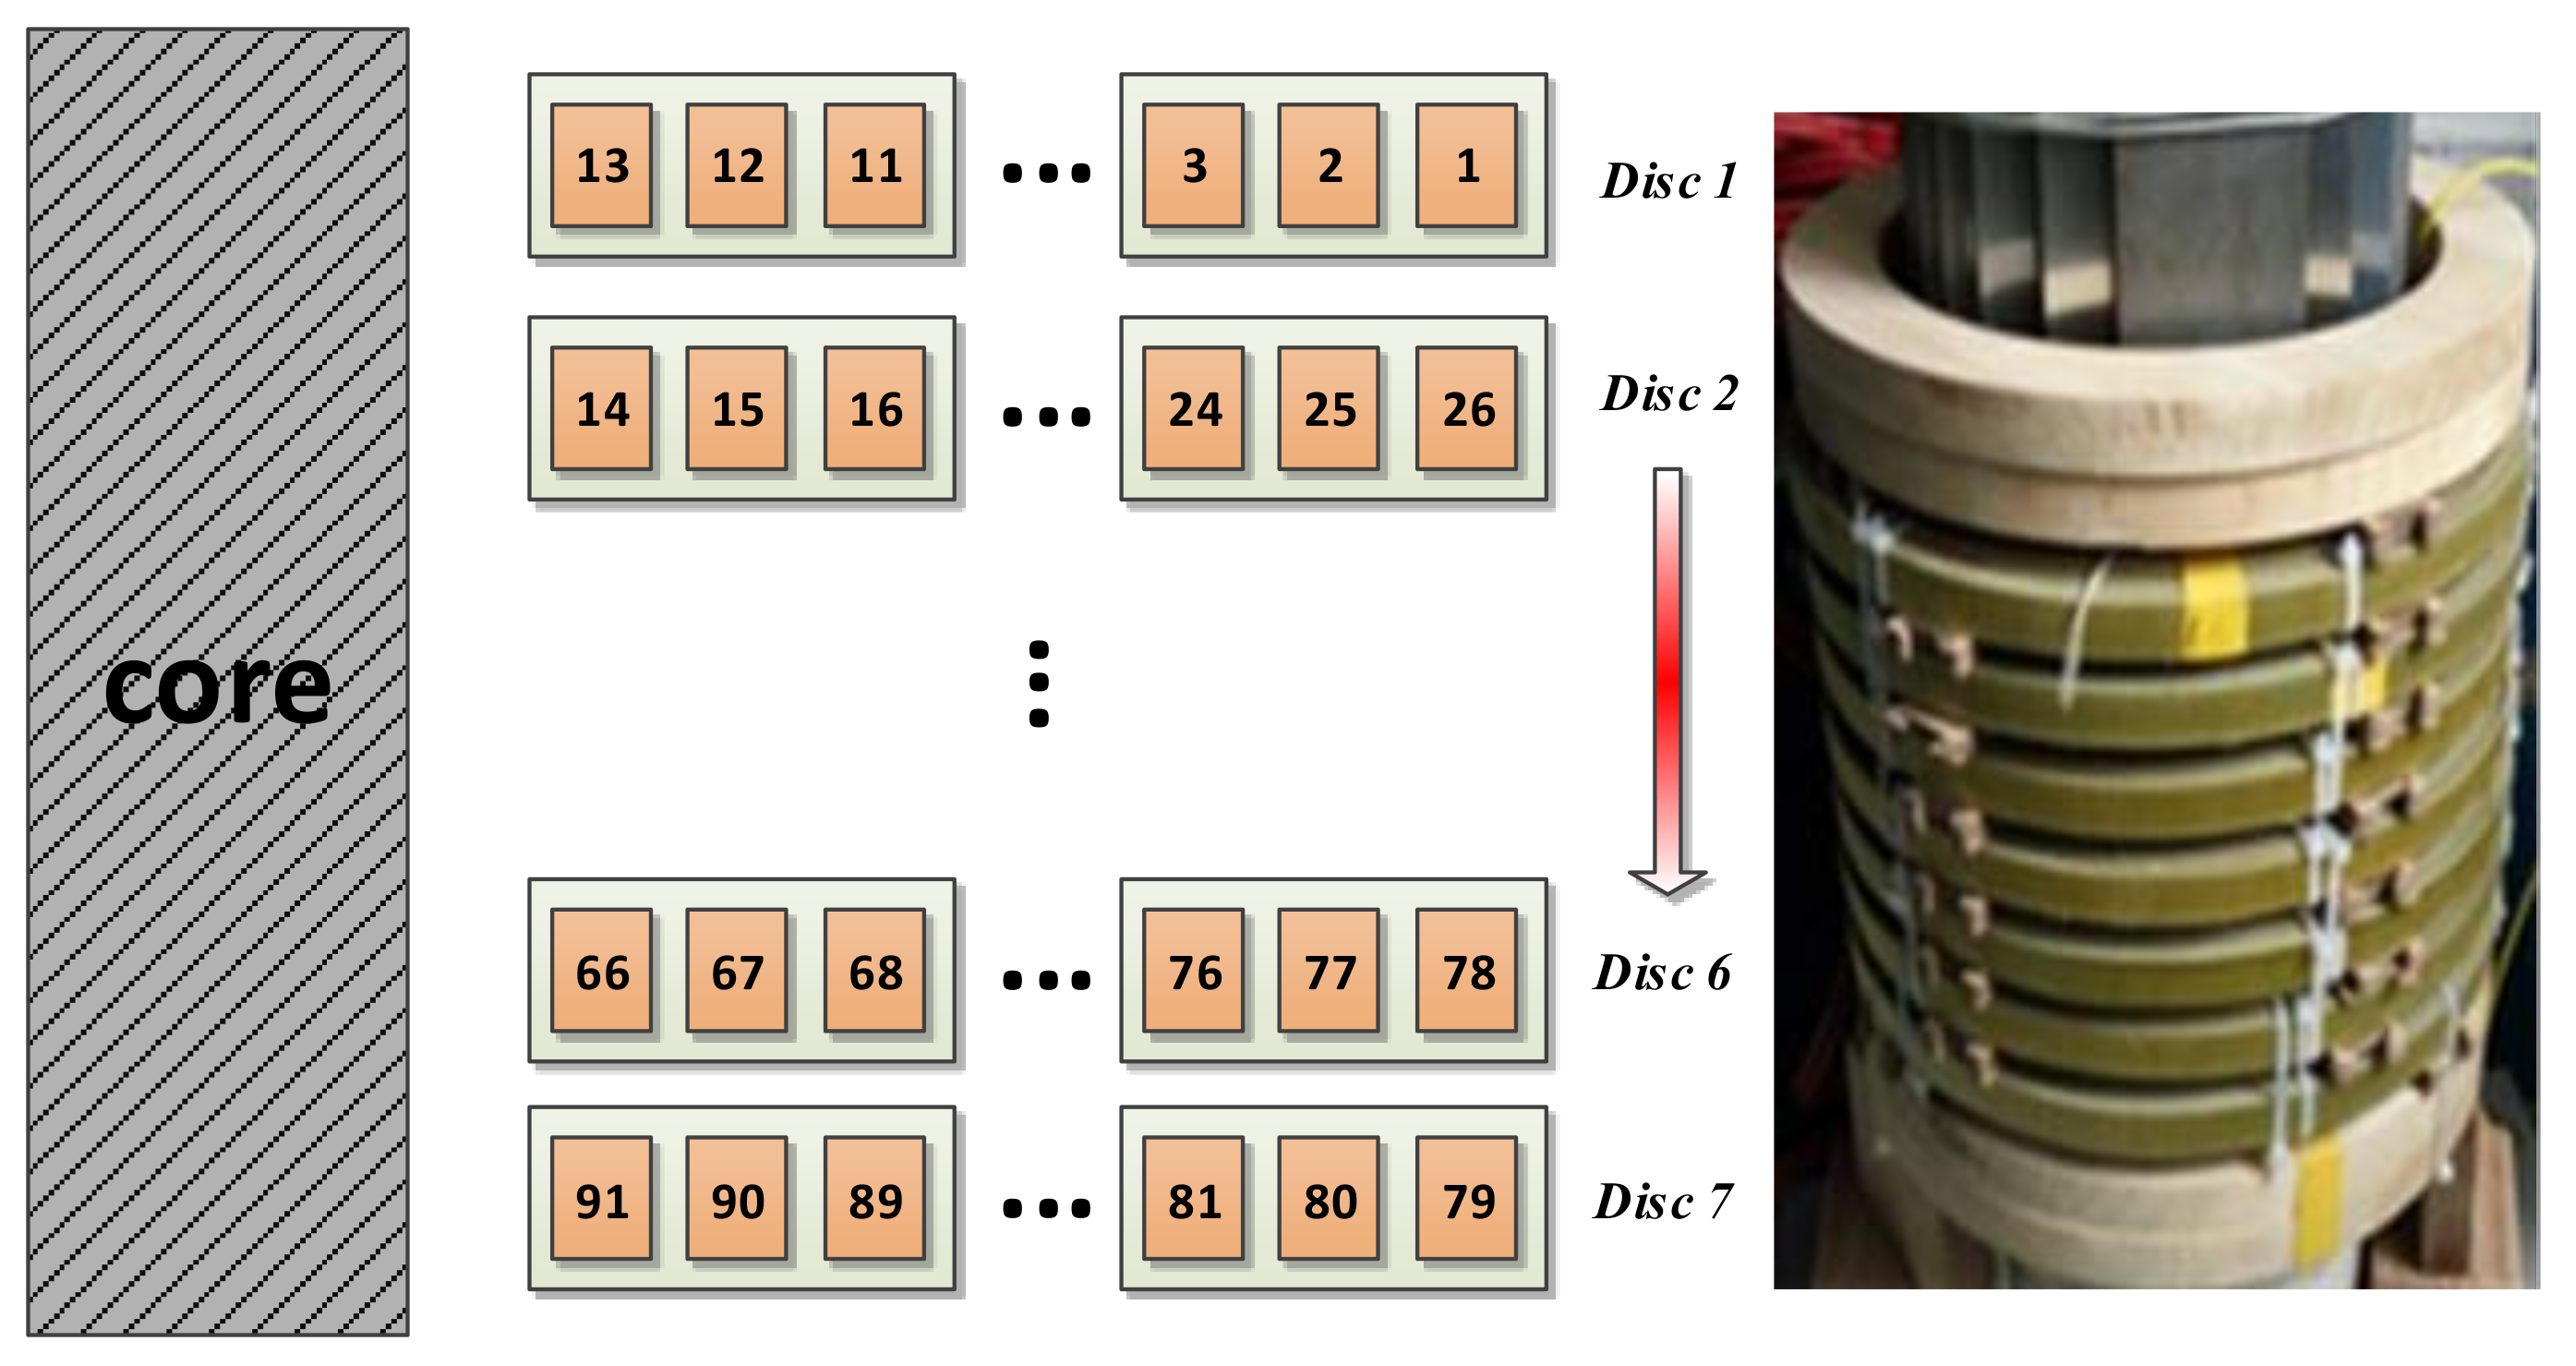
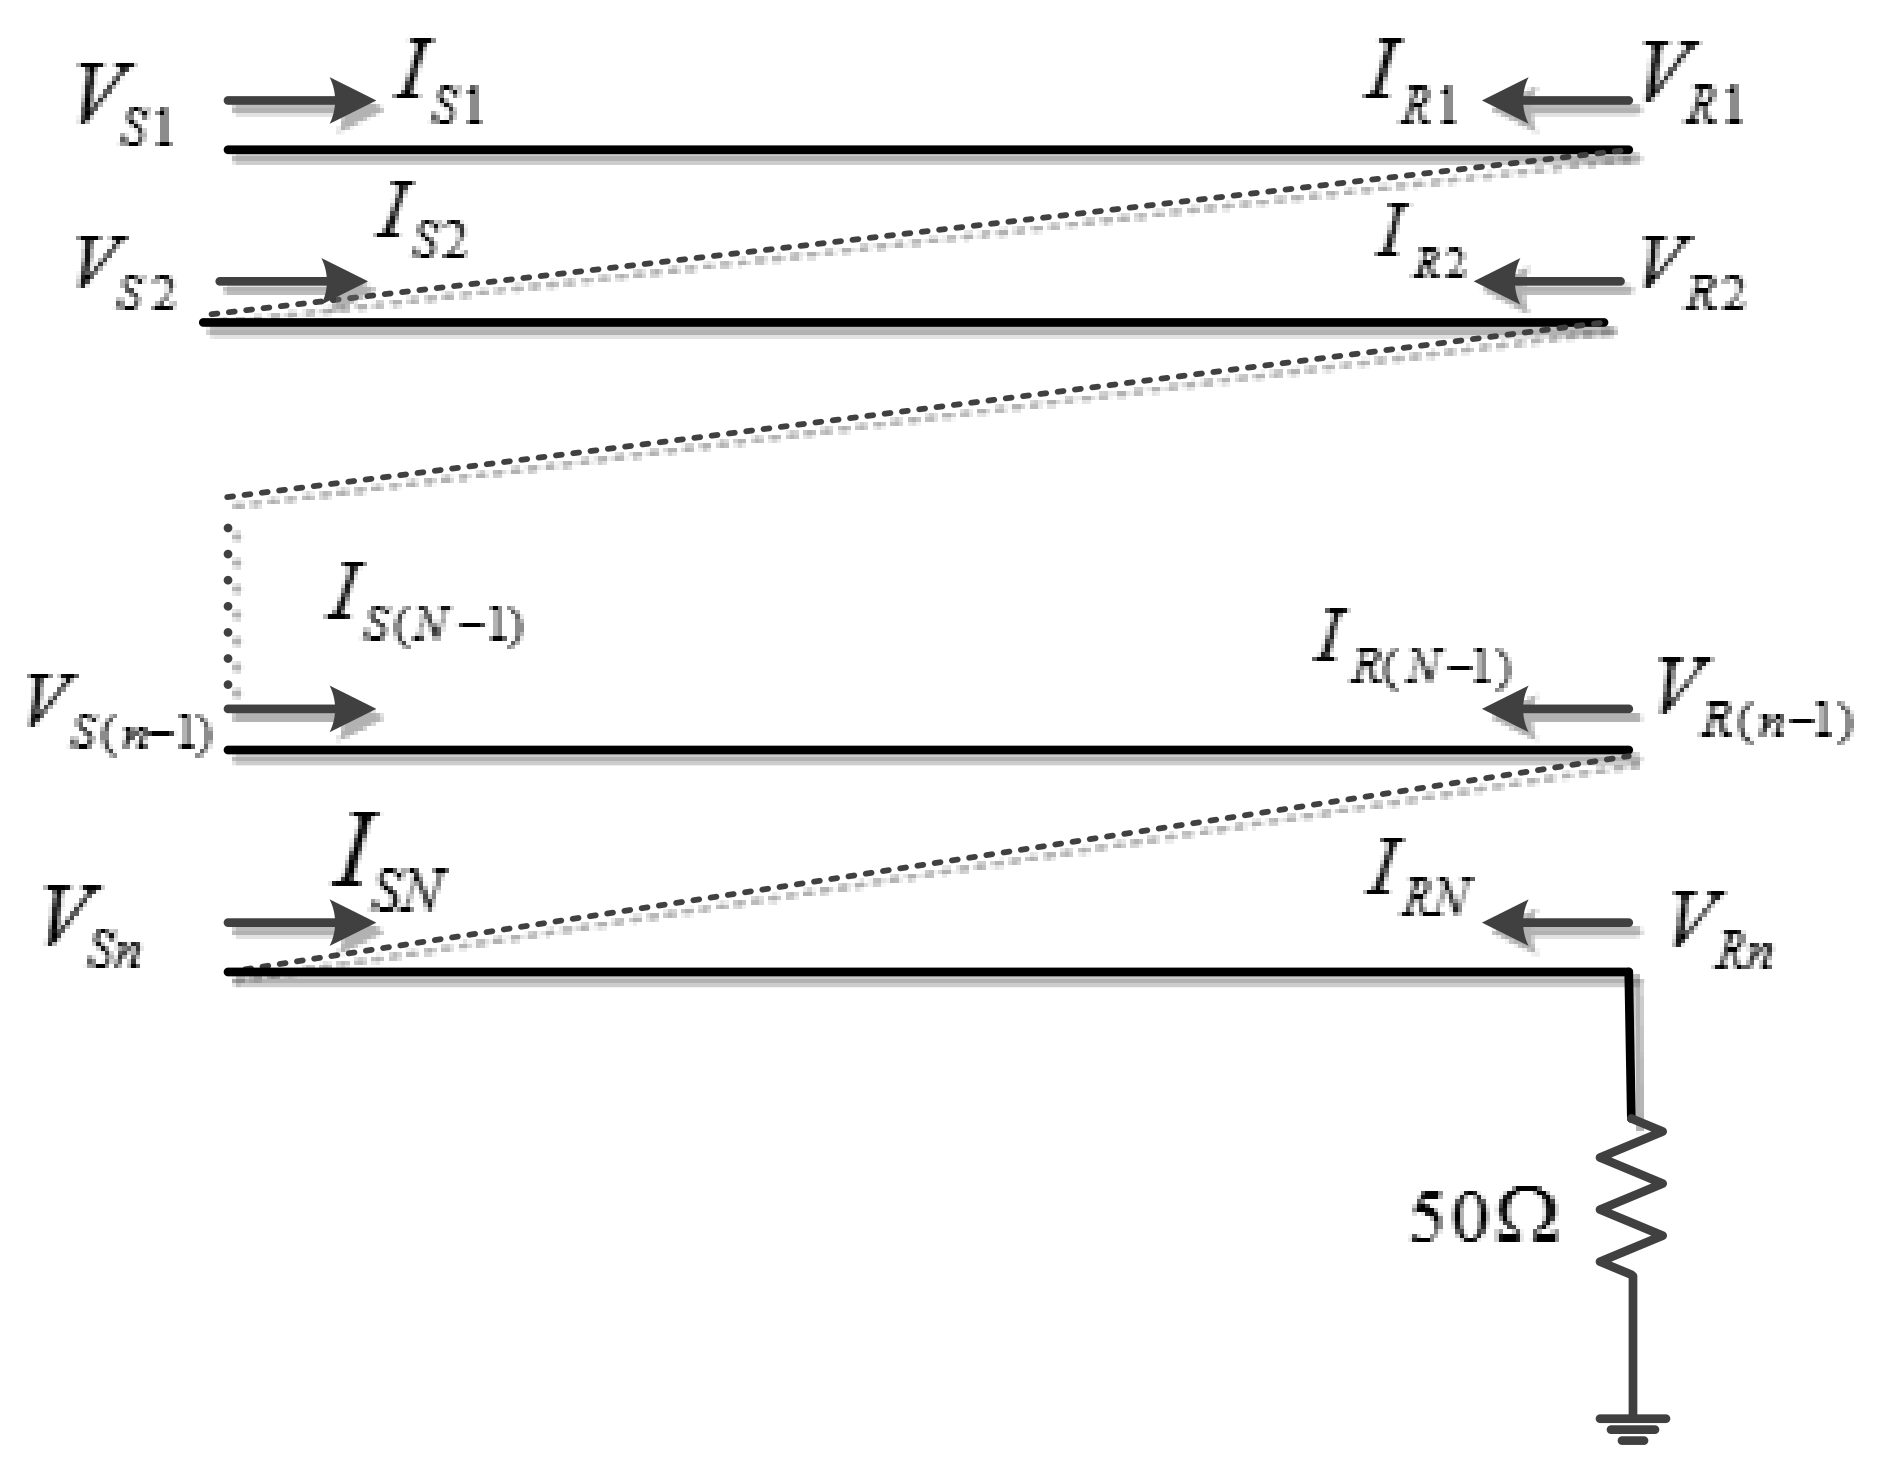
2.1. Construction of the Multi-Conductor Transmission Line Model

In order to obtain the expressions of the MTL model, according to the transmission line theory, the single conductor transmission line in the frequency domain can be expressed as:
d U d x = ( R + j ω L ) I
d I d x = ( G + j ω C ) U
where R and L are series resistance and series inductance in per-unit length, respectively. G and C are shunt admittance and shunt capacitance, respectively.
Then the wave equation can be obtained from Equations (1) and (2):
d 2 U d x 2 = Z Y U
d 2 I d x 2 = Y Z I
where Z = R + jωL, Y = G + jωC.
The voltage and current distribution along this transmission line can be derived from Equations (3) and (4):
U x = U 1 e Γ x + U 2 e Γ x
I x = Y 0 ( U 1 e Γ x U 2 e Γ x )
where Γ = (ZY)0.5. Y0 = (Y/Z)0.5 is the characteristic admittance. U1 and U2 are the undetermined constants.
For the single conductor transmission line, based on Equations (5) and (6), the input voltage US (x = 0) and the output voltage of the transmission line UR (x = l, l is the length of the line) can be obtained as:
U S = U 1 + U 2
U R = U 1 e Γ l + U 2 e Γ l
Through Equations (7) and (8), it is easy to obtain the expressions of U1 and U2, as shown in Equation (9).
{ U 1 = U S e Γ l U R e Γ l e Γ l U 2 = U S e Γ l U R e Γ l e Γ l
Then, the hyperbolic function form of the single transmission line is represented by applying the expressions of U1 and U2 into Equations (5) and (6), as shown in Equation (10).
[ I S I R ] = Y 0 [ e Γ l + e Γ l e Γ l e Γ l 2 e Γ l e Γ l 2 e Γ l e Γ l e Γ l + e Γ l e Γ l e Γ l ] [ U S U R ] = Y 0 [ coth Γ l cos   e c h Γ l cos   e c h Γ l coth Γ l ] [ U S U R ]
In the present study, the structure of a single-winding experiment transformer is shown in Figure 1. It can be seen that there are seven continuous discs in the transformer and that every disc has 13 turns. Detailed parameters of this transformer are listed in Table 1.
Each turn of the winding is regarded as a transmission line. Therefore, the whole MTL model of the transformer winding can be set up by some transmission lines in series, as shown in Figure 2. According to the Figure 2, the terminal conditions of MTL model can be defined as:
I R ( i ) = I S ( i + 1 )   for   i = 1   to   n 1
V R ( i ) = V S ( i + 1 )   for   i = 1   to   n 1
where VS and IS are the sending end voltage and current, respectively. Here, n represents the total number of turns in the winding. VR and IR are the receiving end voltage and current, respectively. Since the response voltage is gathered by a 50 Ω matched impedance, the last terminal (n) in Figure 2 should be connected to a 50 Ω resistor. Therefore, another terminal condition is defined as:
V R ( n ) = 50 I R ( n )
Similar to the single conductor transmission line model, the MTL model can be expressed by the following 2n ports with n number of sending voltages and n number of end voltages:
[ I S I R ] 2 n × 1 = [ [ Y 0 ] coth ( [ Γ ] [ l ] ) [ Y 0 ] cos e c h ( [ Γ ] [ l ] ) [ Y 0 ] cos e c h ( [ Γ ] [ l ] )   [ Y 0 ] coth ( [ Γ ] [ l ] ) ] 2 n × 2 n [ V S V R ] 2 n × 1
[ Γ ] 2 = [ Z ] [ Y ] , [ Y 0 ] = [ Z ] 1 [ Γ ] = [ Y ] [ Γ ] 1
[ Z ] = R [ I n ] + j ω [ L ]
[ Y ] = [ G ] + j ω [ C ]
where [Z] is the impedance matrix, which includes resistance and inductance matrices. [Y] is the admittance matrix of the winding, which comprises conductance and capacitance matrices. Because each turn does not have the same length, [l] = diag(l1, l2, …, ln). li is the length of the ith (i = 1, 2, 3, …, n) turn. Applying Equations (11)–(13) and (15) into (14), the size of (14) is reduced to (n + 1) × 1:
[ V S ( 1 ) V S ( 2 ) V S ( n ) V R ( n ) ] ( n + 1 ) × 1 = T ( n + 1 ) × ( n + 1 ) [ I S ( 1 ) 0 0 I R ( n ) ] ( n + 1 ) × 1
Solving the above equation, the FRA result can be computed as:
F R A = V R ( n ) V S ( 1 ) = 50 T ( n + 1 , 1 ) 50 T ( 1 , 1 ) + T ( 1 , 1 ) T ( n + 1 , n + 1 ) T ( n + 1 , 1 ) T ( 1 , n + 1 )

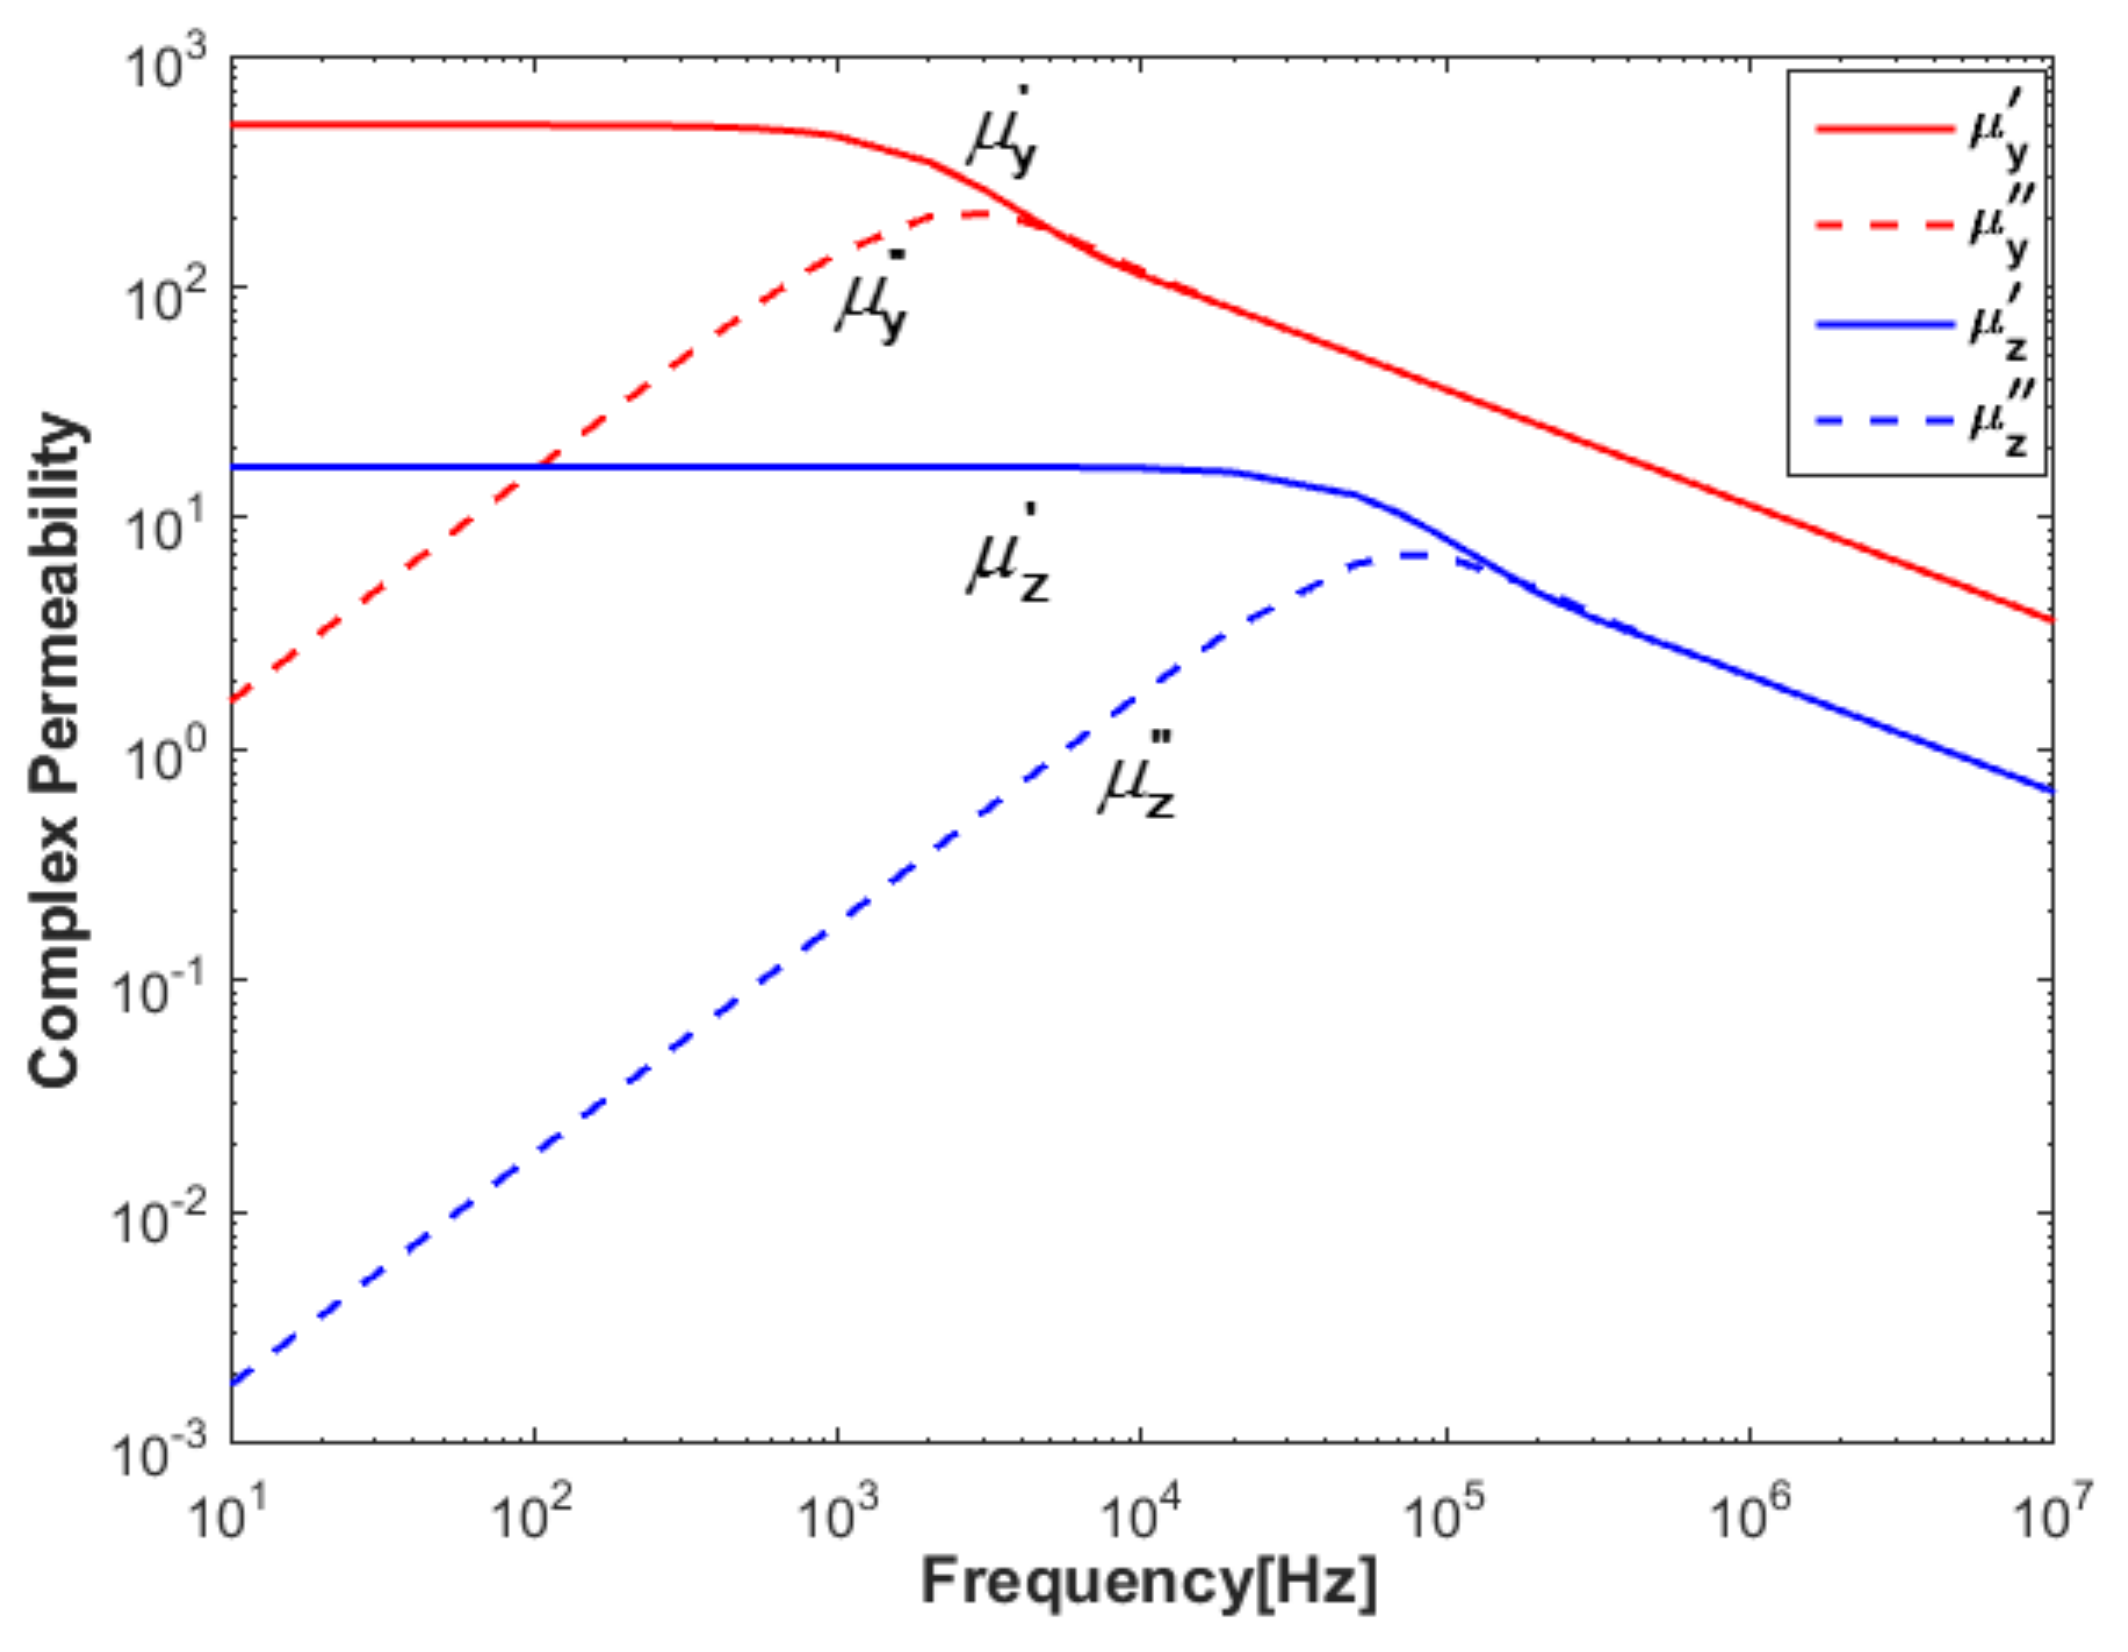
2.2. Anisotropic Relative Complex Permeability of the Lamination Core

The FRA technique is an off-line and non-intrusive method used to apply a sinusoidal, low voltage sweep frequency signal into one terminal of the transformer winding and receive the response signal from another terminal. So, the current flowing in the winding is very small. Because of the small current in the winding, the core is far away from the core saturation state and is regarded as working at the linear area. Based on the above analysis, it is possible to use here a linear anisotropic relative complex permeability tensor.
The core is made of electric steel laminations. The eddy currents in the core can affect the inductances and resistances of the winding. In order to obtain the accurate electrical parameters, a linear anisotropic relative complex permeability tensor is taken into account. It can be expressed as [23]:
μ S = μ S j μ S = k b μ S tanh ( ( 1 + j ) b / δ S ) ( 1 + j ) b / δ S
where μ S is the real part of the anisotropic relative complex permeability μs (H/m), which represents the capacity of energy storage of the magnetization process. μ S is the imaginary part of μs and it shows that the magnetization loss is associated with skin and proximity effects. The skin depth δ (m) = (2/ωσμ0μr)0.5. b (m) is the thickness of a single lamination. kb is the stacking factor.
Because the lamination rolling direction is in the X direction, which is shown in Figure 3, subscript S in Equation (20) is a representative of the Y or Z direction. The relative complex permeability of the core is shown in Figure 4. It can be seen that, upon increasing the frequency, real parts of the relative complex permeability of the Y and Z directions gradually decrease with frequency, but imaginary parts firstly increase and then decrease from a certain frequency.

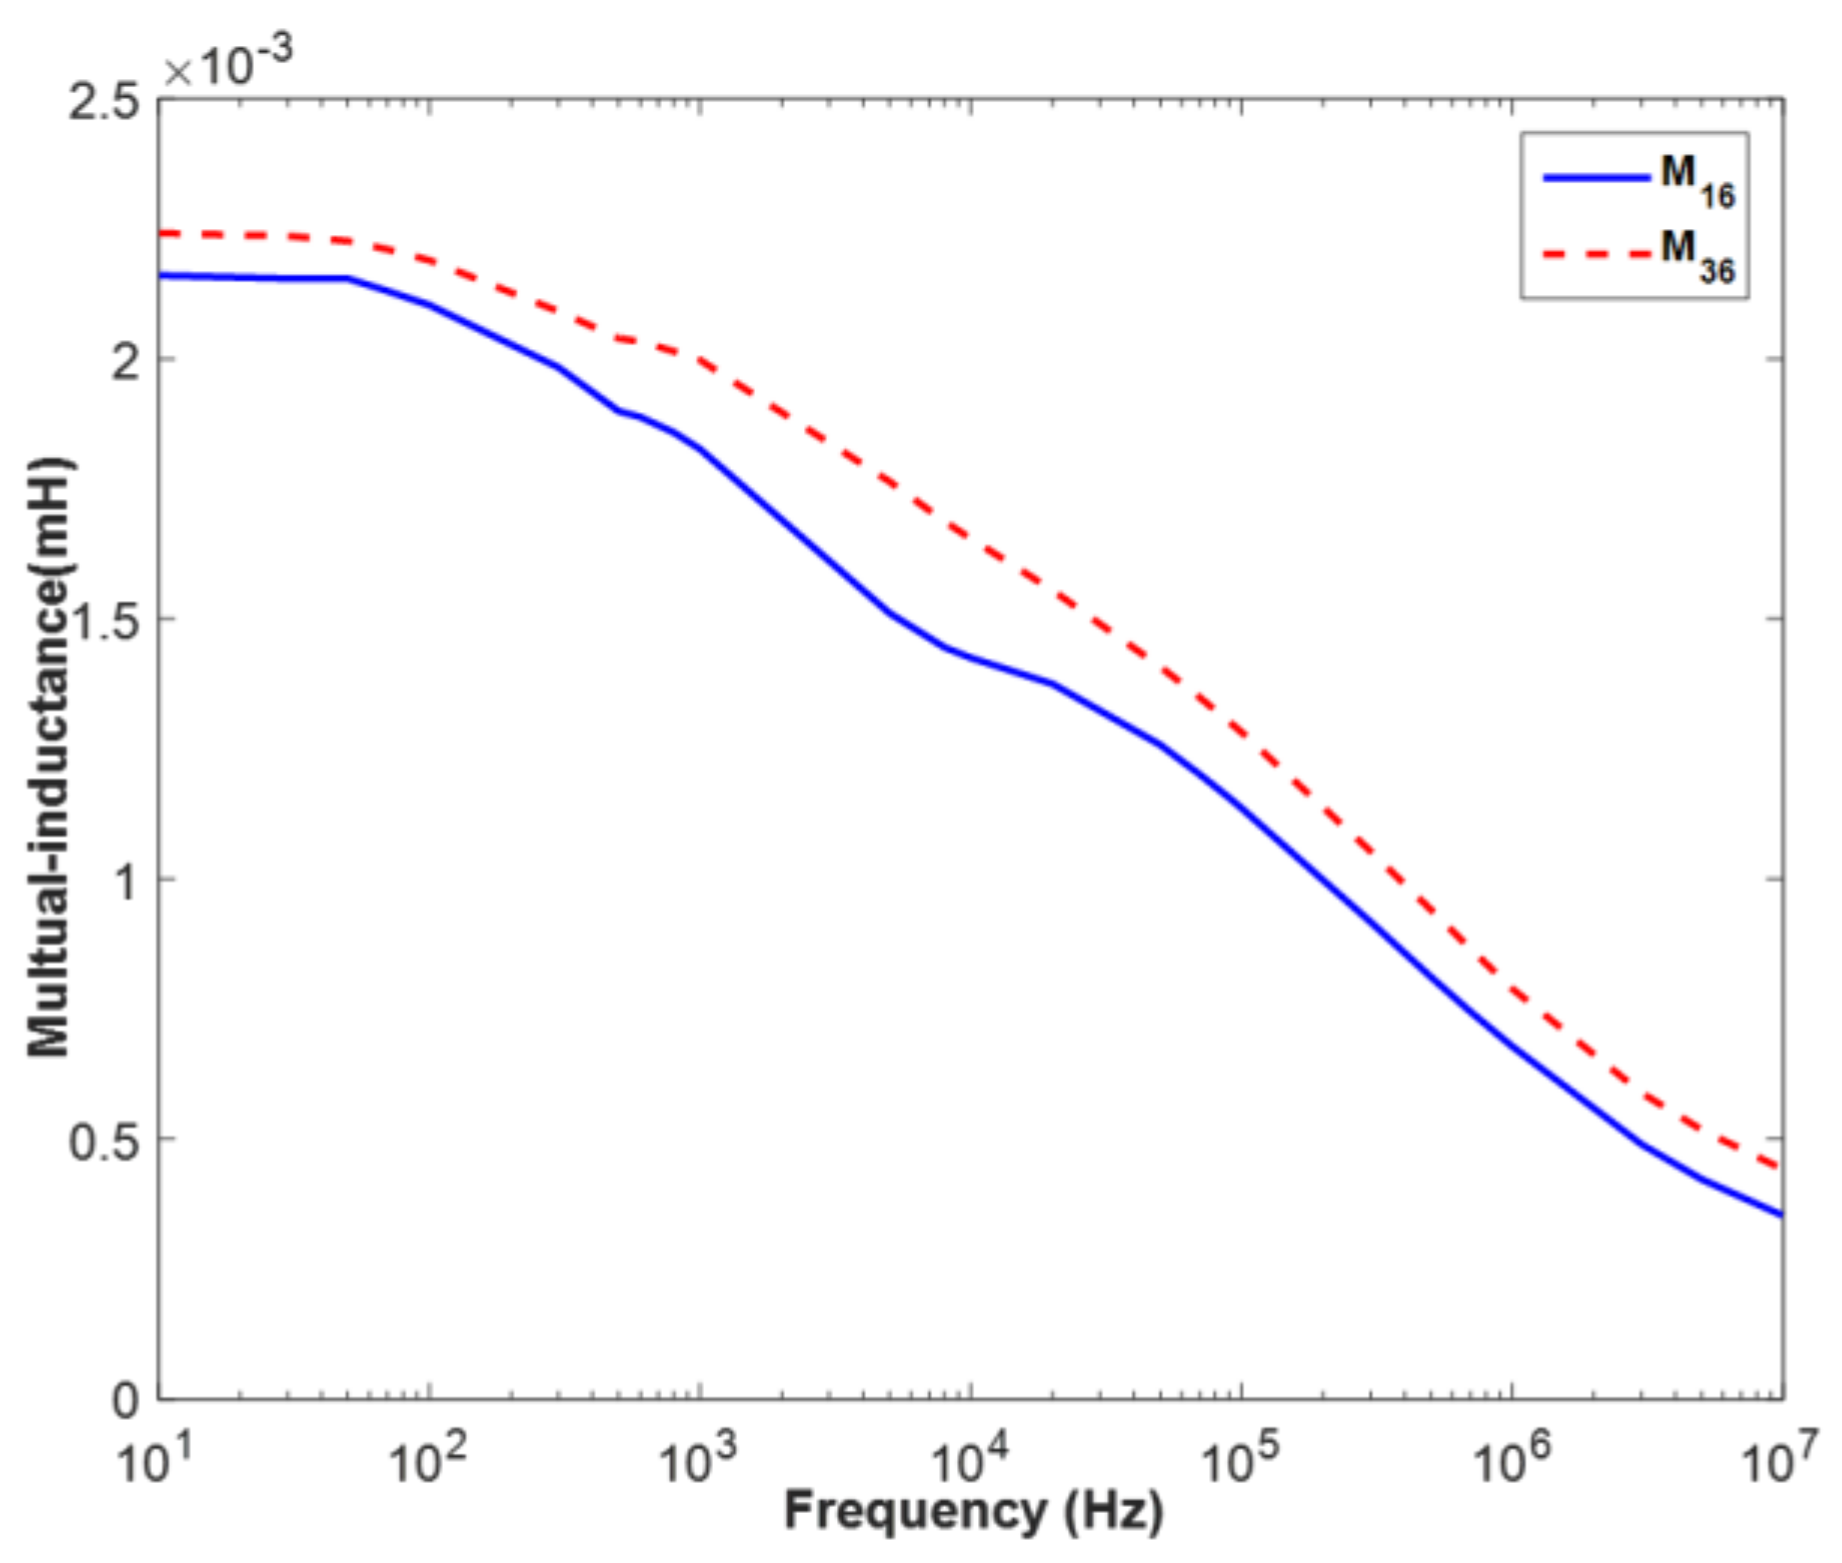
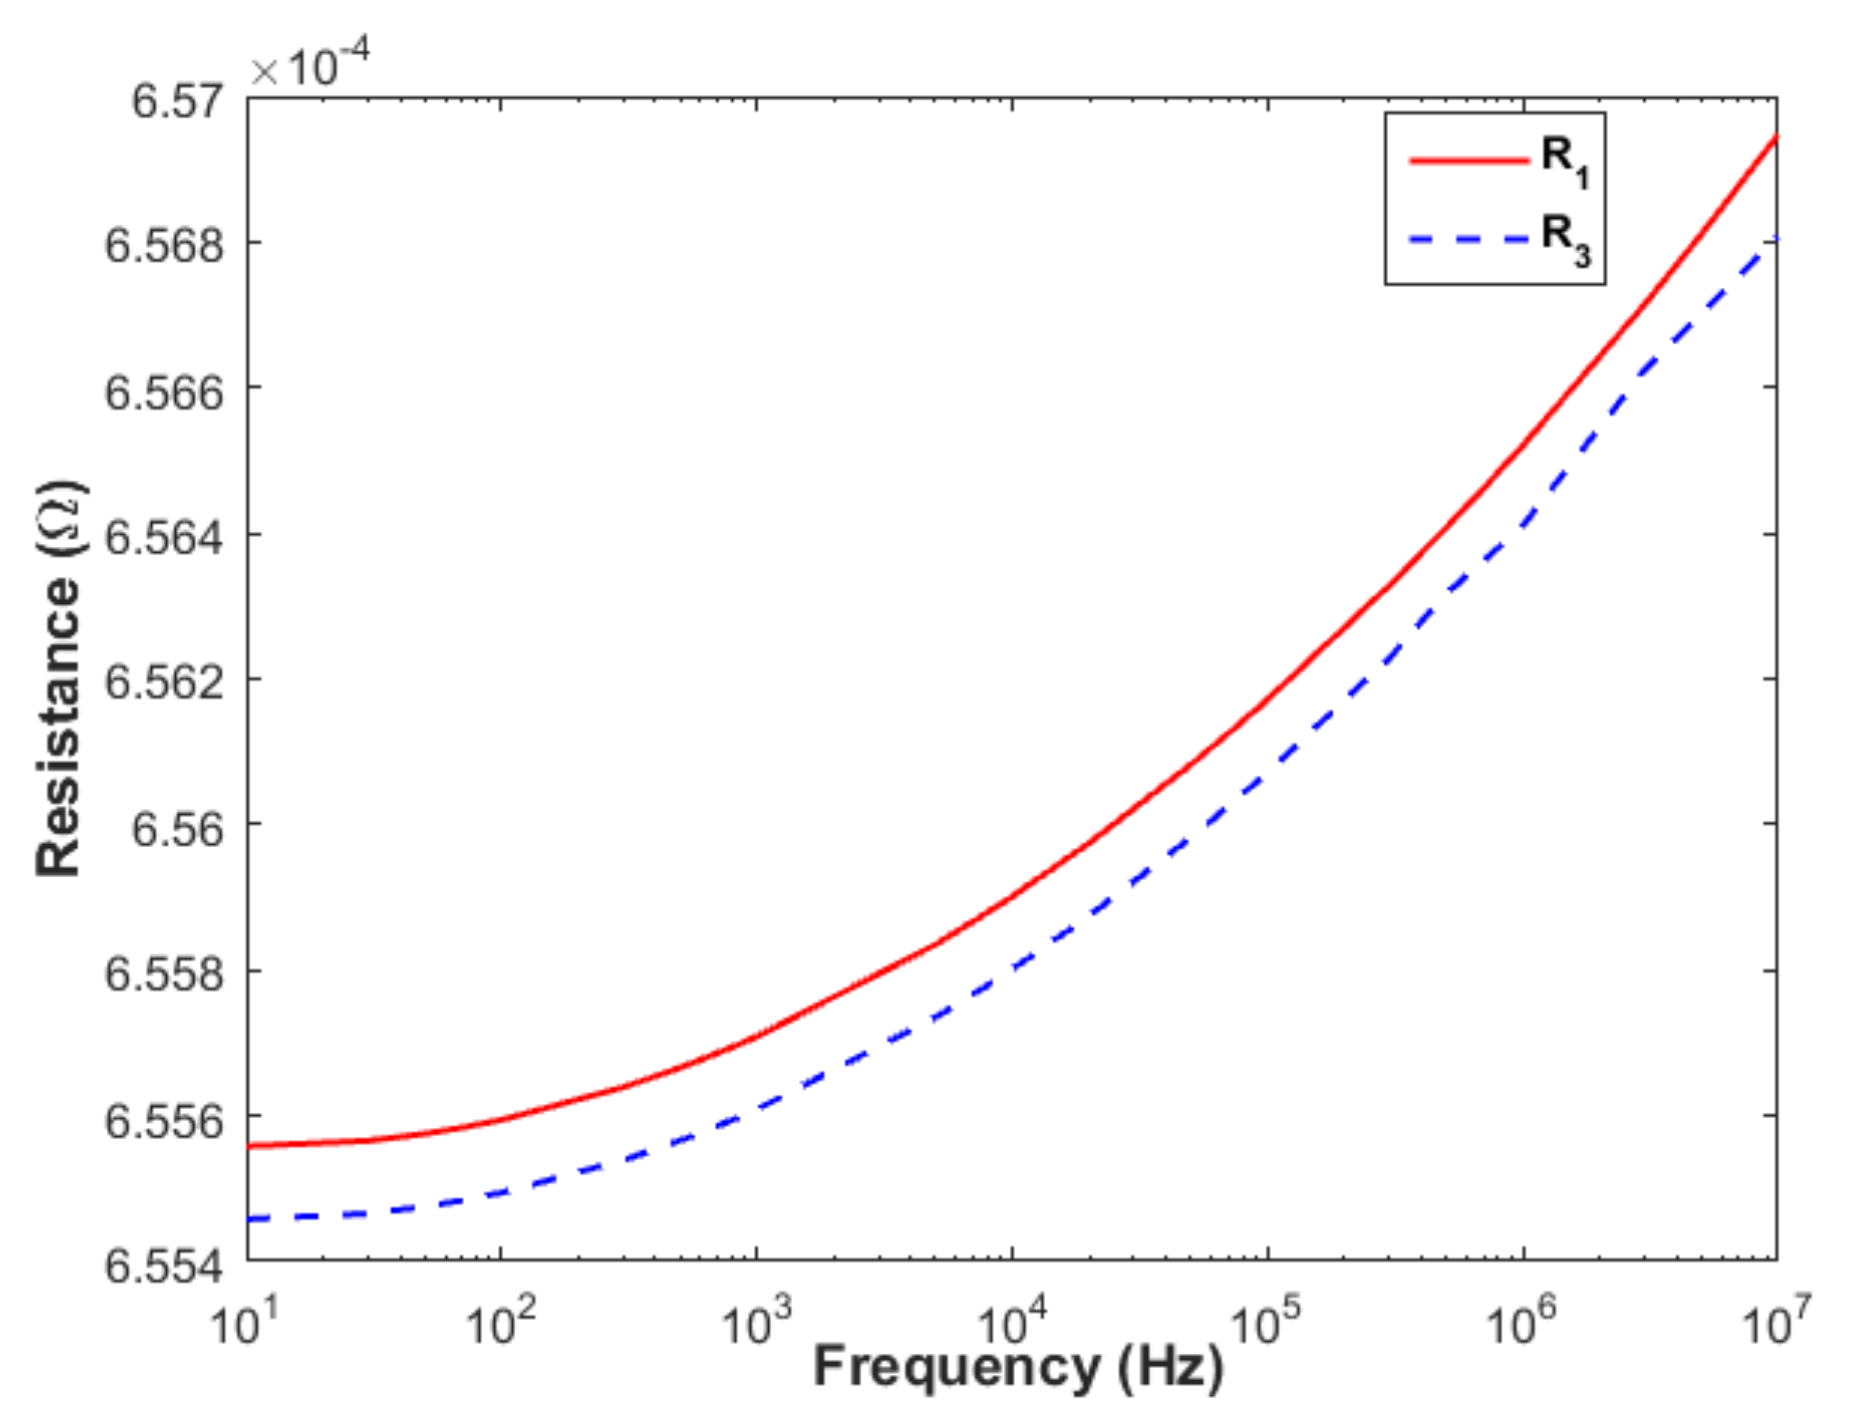
2.3. Calculation of Inductance and Resistance

Because each frequency has a corresponding relative complex permeability, the value of the relative complex permeability of the core includes the frequency-dependent property effects. Therefore, based on the finite element method, values of inductance and resistance in a frequency can be obtained by introducing the corresponding anisotropic relative complex permeability into the calculations by using the magnetostatic mode [23]. Through this method, the frequency-dependent property of the core is taken into consideration. The governing equation can be derived as:
× ( 1 μ S μ 0 × A ) = J s
where A is the magnetic vector potential. Js is the current density of the excitation current used in the FRA test. Because the property of the core was considered in calculating the complex permeability, the above governing equation does not include part of the eddy current.
According to the energy balance method, the inductances and resistances of the winding can be obtained by separately solving the magnetostatic problem for each frequency with the corresponding value of complex permeability [24]:
L i = 2 Im [ j W ^ i i ] / I i 2
R i = 2 ω Re [ j W ^ i i ] / I i 2
M i j = [ Im [ j W ^ i i 0.5 L i I i 2 0.5 L j I j 2 ] ] / ( I i I j )
where Li and Ri are the self-inductance and resistance of the ith turn. Mij is the mutual inductance between the ith and the jth turn. Wii is the complex magnetic energy.
There are seven discs in the transformer winding and every disc has 13 turns, amounting to 91 turns in the transformer. Taking inductance (which contains mutual inductance) as an example, the size of the inductance matrix is 91 × 91 and there are 8281 inductance values. In addition, inductance changes with the frequencies, so there will be an inductance matrix under each frequency point and the number of inductance matrices will be very large. For the above reasons, parts of important equivalent parameters of the MTL model are provided in Appendix A. Here, for simplicity, the characteristics of frequency-dependent self-inductances and mutual inductances for several turns are shown in Figure 5 and Figure 6, respectively, and the frequency points are plotted in logarithmic scale. In Figure 5 and Figure 6, it can be seen that the values of self-inductances and mutual inductances are not constants with respect to the frequency, but that they decrease along with the increase of the frequency. In the frequency range of 10 Hz to 10 MHz, although the values of self- and mutual inductances are very small, they all change by more than 60%. In contrast, at the same frequency range, resistances have the property of increasing with the frequency and they change by less than 1%, as shown in Figure 7. Obviously, it is easy to draw the conclusion that inductances are more sensitive than resistances to the change of frequency. Hence, taking the frequency-dependent property of the transformer winding into account is very necessary.

2.4. Calculation of Conductance and Capacitance

Capacitance calculation is based on the structure of the winding. Using the finite element method (FEM), the capacitance matrix of the MTL model can be computed easily. The details of the calculation process can be seen in Reference [19].
Conductance is due to the dielectric losses and is assumed to vary linearly with frequency. Besides frequency, it depends upon the capacitance matrix [C] and the dissipation factor tanδ. It can be calculated as:
[ G ] = 2 π f [ C ] tan δ
After calculations of the capacitance matrix [C] and conductance matrix [G], [Y] = [G] + jω[C] can be easily obtained.

3. Analysis of Frequency Response Analysis Results

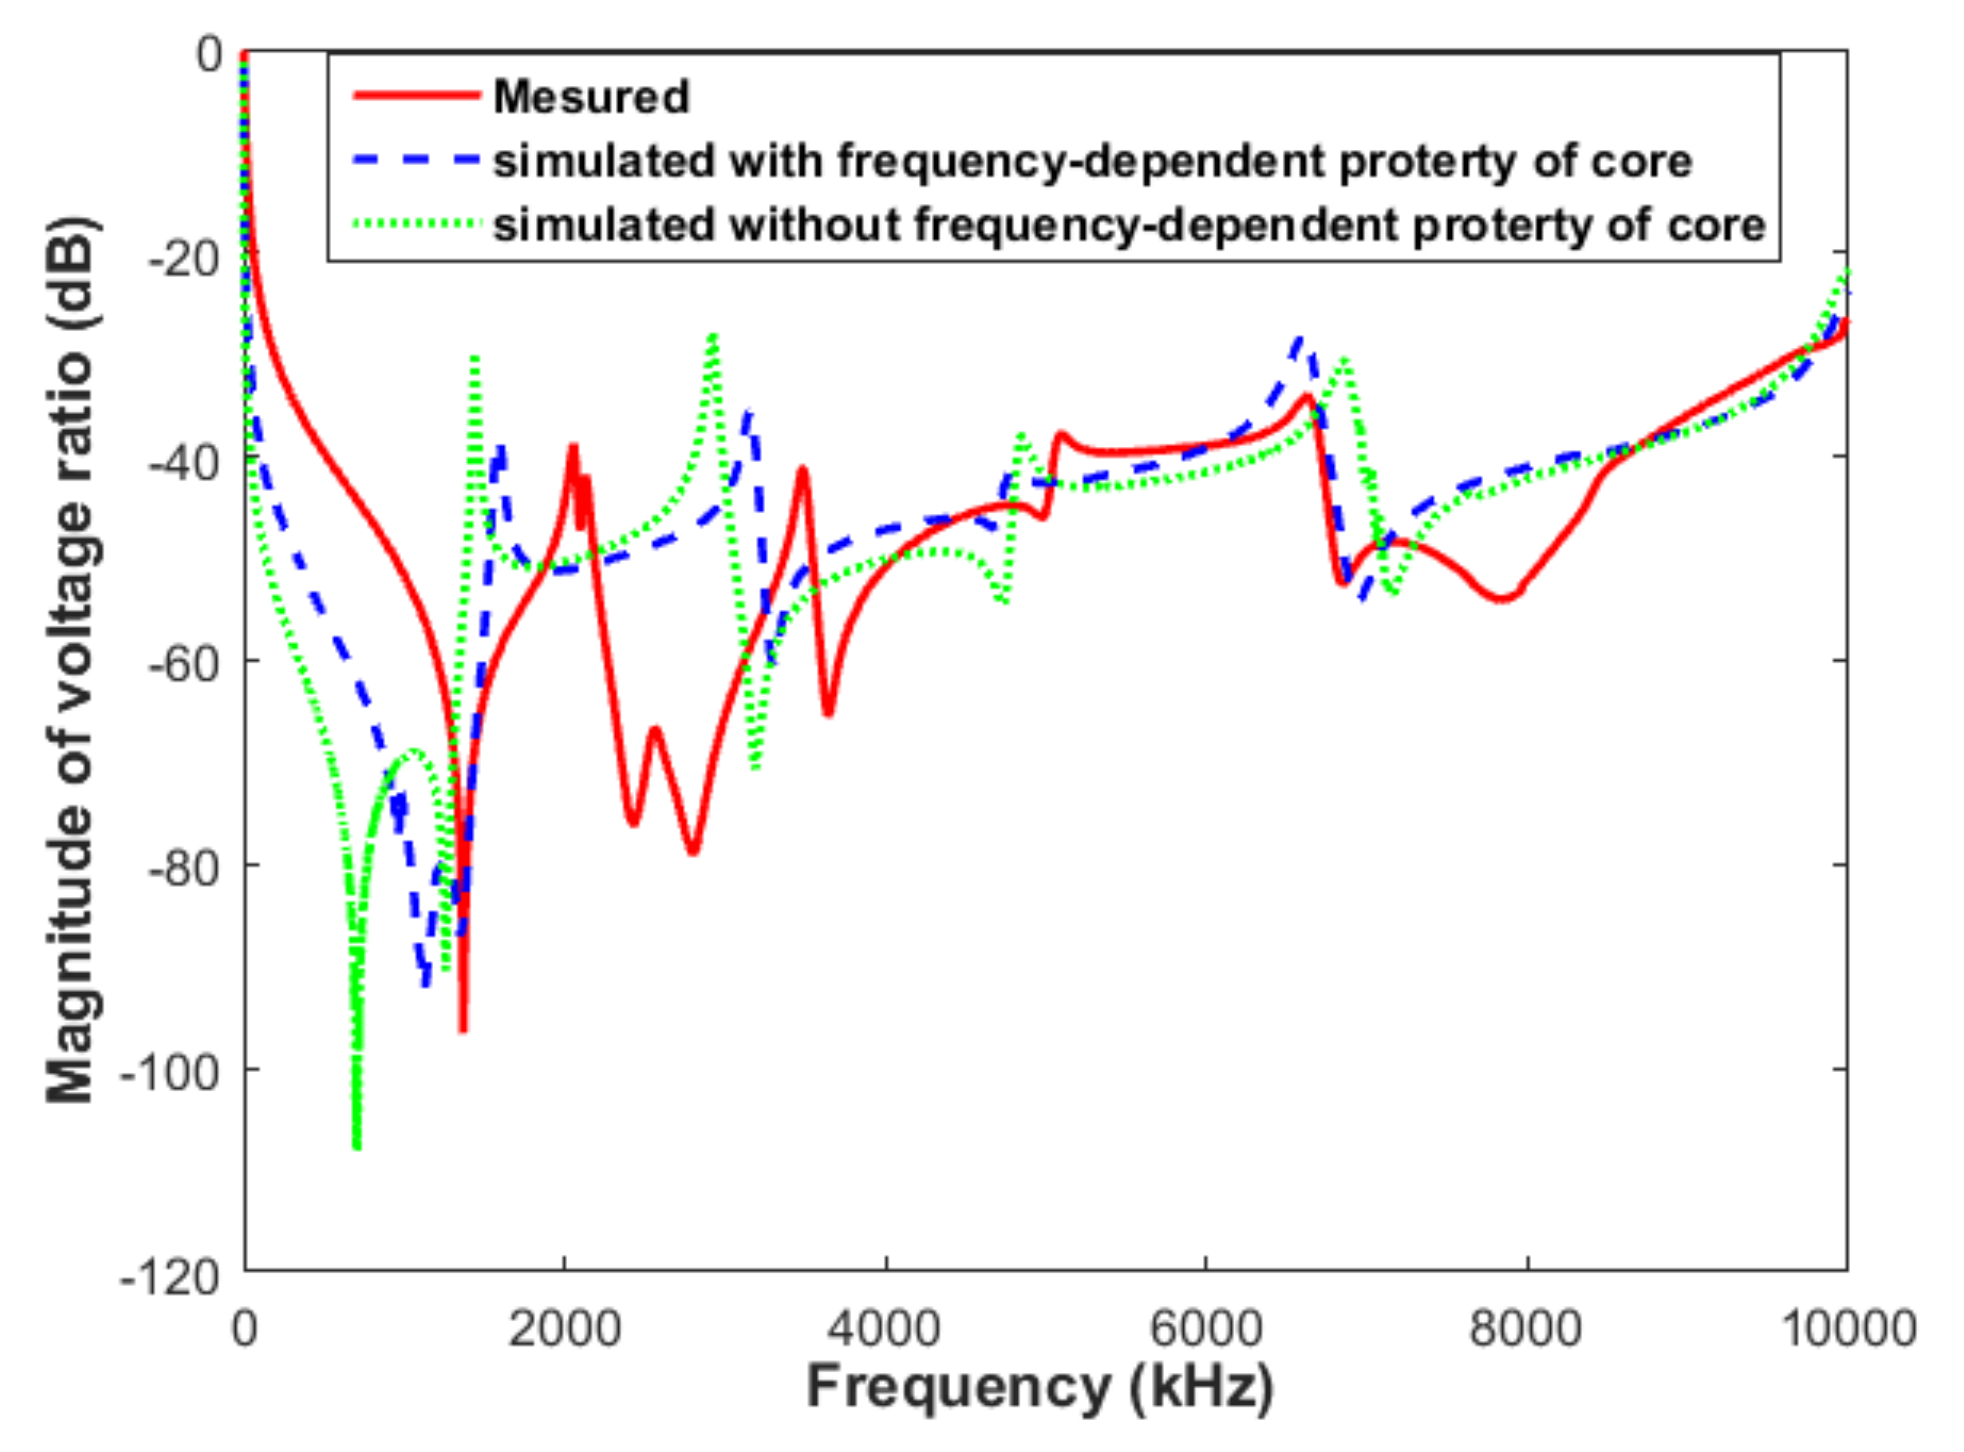
3.1. Comparison of Measurement and Simulation Frequency Response Analysis Results in Visual Inspection

The FRA measurement is conducted by the network analyzer Agilent 4395A (Agilent, Palo Alto, CA, USA). The frequency domain of sweep signal is set from 10 Hz up to 10 MHz. For the simulation of FRA, the transfer function of the transformer is calculated as the ratio of output voltage to input voltage, which can be solved by Equation (19). By coding the program of solving the MTL model equations in Matlab software (R2015b, MathWorks, Natick, MA, USA), the magnitude of the FRA measurement result can be expressed as:
F R A M a g n i t u d e = 20 log 10 | V R ( n ) V S ( 1 ) |
The comparison of simulation and measurement results are shown in Figure 8 and the frequency points are plotted in linear scale. They comprise the measured result and simulation result with and without consideration of the frequency-dependent property of the lamination core. It can be clearly seen that from 10 Hz to 7 MHz the FRA results considering the frequency-dependent property of the lamination core have a visibly better agreement with the measured results than that without considering this property from aspects of both resonance frequency points and magnitude of voltage ratio. In the high frequency range (7 MHz–10 MHz), simulation results considering the frequency-dependent property of the lamination core are not apparently different in comparison to the results achieved without considering the complex permeability property of the lamination core. This is primarily because, from the aspect of the parameters of the MTL model, magnetizing impedance and core loss correspond to the real part and imaginary parts of complex permeability, respectively. In the high frequency range, core loss increases and the magnetizing impedance also increases, but the ratio of core loss and magnetizing impedance decreases due to the high value of the angular frequency. Therefore, in the high frequency range, core loss occupies a very small percentage and has little impact on the FRA results. Secondly, at high frequencies the transformer winding essentially becomes a capacitive network, thus the change of inductance of winding has very little effect on the results. Consequently, in the high frequency range of Figure 8, the simulation results with and without consideration of the frequency-dependent property of the lamination core do not exhibit significant differences. However, overall, it can be clearly seen that the FRA results with the frequency-dependent property of the lamination core have better consistency with the measurement results than the results achieved without considering this property.

3.2. Quantitative Analysis of Measurement and Simulation Frequency Response Analysis Results

In order to provide more objective and explicit comparison results, a new numerical index is employed to quantitatively present the advancement of the new MTL model. The index, which is called the change ratio (CR), is calculated as follows [25]:
C R = 1 2 ( ( ( 1 C C ) ( 1 C C ) min ( 1 C C ) max ( 1 C C ) min ) + ( E D E D min E D max E D min ) ) × 100
C C ( X , Y ) = Σ i = 1 m X ( i ) Y ( i ) Σ i = 1 m [ X ( i ) ] 2 Σ i = 1 m [ Y ( i ) ] 2
E D = X Y = ( X Y ) T ( X Y ) = Σ i = 1 m ( Y ( i ) X ( i ) ) 2
where CC is the correlation coefficient, which can be determined by Equation (28). This illustrates the differences between the measured and simulated FRA results according to the shape of curves. X(i) and Y(i) are the ith elements of the measured and simulated FRA vector, respectively, and m is the number of the frequency points. 1 − CC is an increasing function of the difference between two FRA traces, so when the value of 1 − CC equals zero, it means that the two FRA traces are identical. (1 − CC)min or (1 − CC)max represent the minimum or maximum of (1 − CC) between simulated FRA results with consideration of the frequency-dependent property of the core and simulated FRA results without this consideration. The Euclidean distance (ED) in Equation (27) indicates the distance between the measured and simulated FRA trace, which can be determined by Equation (29). In Equation (29), X = [x1, x2xm] and Y = [y1, y2ym] are the vectors of the measured FRA results and simulated results with m elements, respectively. Also, the definitions of EDmin and EDmax are analogous to (1 − CC)min and (1 − CC)max, respectively. The introduction of EDmin, EDmax, (1 − CC)min, and (1 − CC)max aims to normalize the values of CR among different sets of data.
According to the calculation results of the indices, as listed in Table 2, the values of (1 − CC), ED, and CR when taking the frequency-dependent property of the core into account are much less than those achieved without considering this property. This indicates that whatever the shape or shift distance of the simulated FRA trace, the emulated FRA result with considering the core property shows slighter differences from the experimental results than that obtained without consideration of the core property. This also effectively demonstrates that the new MTL model used for FRA with the frequency-dependent property of the core is superior to that obtained without considering this property.

4. Discussion

In this paper, a new MTL model was investigated in some detail. The following are some thoughts for future study.
(1)
Although it is very complex and time-consuming, applying the simulation model presented and validated here on complete transformers, including different types and scales of windings, is very necessary.
(2)
The measured FRA results may include noises due to the capacitive and the magnetic coupling of the measurement system with external interferences. So, reducing the disturbance of the external environment needs to be further studied to obtain more precise experiment results.
(3)
One factor that has not been considered and may have an effect on the simulation FRA results is the frequency-dependent equivalent capacitance of the MTL model. This factor, if considered, may improve the results in the high frequency range. Therefore, proposals of a method that takes this factor into consideration are worthy of further investigation.

5. Conclusions

In this paper, a new MTL model of transformer winding for FRA that takes into account the frequency-dependent property of the magnetic core is presented. The close agreement of the FRA results obtained from a simulation based on this new MTL model and from an experiment are sufficiently validated by visual inspection and a numerical index. The new MTL model not only can enrich and extend the FRA simulation research, but also it is strongly believed that the contribution of this paper could create a foundation for the analysis and interpretation of FRA research.

Acknowledgments

This work is supported by the Nation Natural Science Foundation of China under Grant No. 51577140.

Author Contributions

This article has five authors: Song Wang, Ze Guo, Ting Zhu, Hanke Feng, and Shuhong Wang. Song Wang and Shuhong Wang wrote the manuscript; Ze Guo and Ting Zhu carried out the experiments; other authors gave their modification suggestions for the manuscript.

Conflicts of Interest

The authors declare no conflict of interest.

Appendix A

A part of the inductance matrix in per-unit-length at 100 Hz is shown in Table A1. Diagonal elements and off-diagonal elements of the matrix are the self-inductances and mutual inductances of the winding, respectively. Table A2 shows a part of the capacitance matrix. Similar to the inductance matrix, diagonal elements and off-diagonal elements of the capacitance matrix are the self-capacitances and mutual capacitances of the winding, respectively. The capacitance and inductance matrices are all diagonal matrices.
Table A1. A part of the inductance matrix at 100 Hz.
Turn Number1579
12.25 × 10⁻⁶ H1.75 × 10−6 H1.63 × 10−6 H1.54 × 10−6 H
51.75 × 10⁻⁶ H2.03 × 10−6 H1.69 × 10−6 H1.62 × 10−6 H
71.63 × 10⁻⁶ H1.69 × 10−6 H1.96 × 10−6 H1.65 × 10−6 H
91.54 × 10⁻⁶ H1.62 × 10−6 H1.65 × 10−6 H1.93 × 10−6 H
Table A2. A part of the capacitance matrix.
Turn Number1579
1197.19 pF−89.79 pF−68.67 pF−46.51 pF
5−89.79 pF284.55 pF−213.68 pF−169.82 pF
7−68.67 pF213.68 pF390.74 pF−267.36 pF
9−46.51 pF−169.82 pF−267.36 pF465.89 pF

References

  1. Dick, E.; Erven, C. Transformer Diagnostic Testing by Frequency Response Analysis. IEEE Trans. Power Appar. Syst. 1978, 6, 2144–2153. [Google Scholar] [CrossRef]
  2. Abeywickrama, K.G.N.; Serdyuk, B.Y.V.; Gubanski, S.M. Exploring possibilities for characterization of power transformer insulation by frequency response analysis (FRA). IEEE Trans. Power Deliv. 2006, 21, 1375–1382. [Google Scholar] [CrossRef]
  3. Alsuhaibani, S.; Khan, Y.; Beroual, A.; Malik, N. A Review of Frequency Response Analysis Methods for Power Transformer Diagnostics. Energies 2016, 9, 879. [Google Scholar] [CrossRef]
  4. Gomez-Luna, E.; Aponte Mayor, G.; Gonzalez-Garcia, C.; Pleite Guerra, J. Current status and future trends in frequency-response analysis with a transformer in service. IEEE Trans. Power Deliv. 2013, 28, 1024–1031. [Google Scholar] [CrossRef]
  5. Cigre, W.G. Mechanical Condition Assessment of Transformer Windings Using Frequency Response Analysis (FRA); Brochure 342; CIGRE: Paris, France, 2008. [Google Scholar]
  6. Jayasinghe, J.A.S.B.; Wang, Z.D.; Jarman, P.N.; Darwin, A.W. Winding movement in power transformers: A comparison of FRA measurement connection methods. IEEE Trans. Dielectr. Electr. Insul. 2006, 13, 1342–1349. [Google Scholar] [CrossRef]
  7. Wang, S.; Wang, S.H.; Feng, H.K.; Guo, Z.; Wang, S.; Li, H.L. A New Interpretation of FRA Results by Sensitivity Analysis Method of Two FRA Measurement Connection Ways. IEEE Trans. Magn. 2018, 54, 1–4. [Google Scholar] [CrossRef]
  8. Hashemnia, N.; Abu-Siada, A.; Islam, S. Improved Power Transformer Winding Fault Detection using FRA Diagnostics—Part 1: Axial Displacement Simulation. IEEE Trans. Dielectr. Electr. Insul. 2015, 22, 556–563. [Google Scholar] [CrossRef]
  9. Hashemnia, N.; Abu-Siada, A.; Islam, S. Improved Power Transformer Winding Fault Detection using FRA Diagnostics—Part 2: Radial Deformation Simulation. IEEE Trans. Dielectr. Electr. Insul. 2015, 22, 564–570. [Google Scholar] [CrossRef]
  10. Abu-Siada, A.; Hashemnia, N.; Islam, S.; Masoum, M.A.S. Understanding Power Transformer Frequency Response Analysis Signatures. IEEE Electr. Insul. Mag. 2013, 29, 48–56. [Google Scholar] [CrossRef]
  11. Satish, L.; Sahoo, S.K. An Effort to Understand What Factors Affect the Transfer Function of a Two-Winding Transformer. IEEE Trans. Power Deliv. 2005, 20, 1430–1440. [Google Scholar] [CrossRef]
  12. Wang, Z.D.; Li, J.; Sofian, D.M. Interpretation of Transformer FRA Response – Part I: Influence of Winding structure. IEEE Trans. Power Deliv. 2009, 24, 703–710. [Google Scholar] [CrossRef]
  13. Islam, S.M. Detection of shorted turns and winding movements in large power transformers using frequency response analysis. In Proceedings of the Power Engineering Society Winter Meeting, Singapore, 23–27 January 2000. [Google Scholar]
  14. Pham, D.A.K.; Gockenbach, E. Analysis of physical transformer circuits for frequency response interpretation and mechanical failure diagnosis. IEEE Trans. Dielectr. Electr. Insul. 2016, 23, 1491–1499. [Google Scholar] [CrossRef]
  15. Ji, T.Y.; Tang, W.H.; Wu, Q.H. Detection of power transformer winding deformation and variation of measurement connections using a hybrid winding model. Electr. Power Syst. Res. 2012, 87, 39–46. [Google Scholar] [CrossRef]
  16. Shintemirov, A.; Tang, W.H.; Wu, Q.H. A Hybrid Winding Model of Disc-Type Power Transformers for Frequency Response Analysis. IEEE Trans. Power Deliv. 2009, 24, 730–739. [Google Scholar] [CrossRef]
  17. Rahimpour, E.; Christian, J.; Feser, K. Transfer function method to diagnose axial displacement and radial deformation of transformer windings. IEEE Trans. Power Deliv. 2003, 18, 493–505. [Google Scholar] [CrossRef]
  18. Wilcox, D.; Hurleyand, W.; Conlon, M. Calculation of self and mutual impedances between sections of transformer windings. IEE Proc. C 1989, 136, 308–314. [Google Scholar] [CrossRef]
  19. Liang, G.S.; Sun, H.; Zhang, X.; Cui, X. Modeling of Transformer Winding under Very Fast Transient Overvoltages. IEEE Trans. Electromagn. Compat. 2006, 48, 621–627. [Google Scholar] [CrossRef]
  20. Jayasinghe, J.; Wang, Z.D.; Jarman, P.N.; Darwin, A.W. Investigations on sensitivity of Fra technique in diagnosis of transformer winding deformations. In Proceedings of the Conference Record of the 2004 IEEE International Symposium on Electrical Insulation, Indianapolis, IN, USA, 19–22 September 2004. [Google Scholar]
  21. Hettiwatte, S.N.; Crossley, P.A.; Wang, Z.D.; Darwin, A.; Edwards, G. Simulation of a transformer winding for partial discharge propagation studies. In Proceedings of the Power Engineering Society Winter Meeting, New York, NY, USA, 27–31 January 2002. [Google Scholar]
  22. Popov, M.; van der Sluis, L.; Smeets, R.P.P. Modelling, simulation and measurement of fast transients in transformer windings with consideration of frequency-dependent losses. IET Electr. Power Appl. 2007, 1, 29–35. [Google Scholar] [CrossRef]
  23. Abeywickrama, N.; Podoltsey, A.D.; Serdyuk, Y. Computation of Parameters of Power Transformer Windings for Use in Frequency Response Analysis. IEEE Trans. Magn. 2007, 23, 4076–4082. [Google Scholar] [CrossRef]
  24. Abeywickrama, N.; Serdyuk, Y.; Gubanski, S. High-Frequency Modeling of Power Transformers for Use in FRA. IEEE Trans. Power Deliv. 2008, 23, 2042–2049. [Google Scholar] [CrossRef]
  25. Samimi, M.H.; Tenbohlen, S.; Shayegani Akmal, A.A.; Mohseni, H. Effect of different connection schemes, terminating resistors and measurement impedances on the sensitivity of FRA method. IEEE Trans. Power Deliv. 2017, 32, 1713–1720. [Google Scholar] [CrossRef]
Figure 1. The structure of the single-winding experiment transformer.
Energies 11 00826 g001
Figure 2. Multi-conductor transmission line model.
Energies 11 00826 g002
Figure 3. Schematic view of a single lamination.
Energies 11 00826 g003
Figure 4. Relative complex permeability of the transformer core.
Energies 11 00826 g004
Figure 5. The frequency-dependent self-inductances of the transformer winding, L11 and L26.
Energies 11 00826 g005
Figure 6. The frequency-dependent mutual inductances of the transformer winding, M16 and M36.
Energies 11 00826 g006
Figure 7. The frequency-dependent resistances of the transformer winding, R1 and R3.
Energies 11 00826 g007
Figure 8. Comparison of frequency response analysis (FRA) results between simulation and measurement.
Energies 11 00826 g008
Table 1. Parameters of the transformer winding and core.
WindingValueCoreValue
Inner radius95 mmLength of core420 mm
Out radius130 mmWidth of core150 mm
Height of the winding260 mmHeight of the core560 mm
Height of disc16 mmThickness of core sheet0.5 mm
Turns of winding13Core materialDW470-50
Table 2. Calculation results of numerical indices.
Item1 − CCEDCR/%
With considering the frequency-dependent property of the core0.03627.0117.47
Without considering the frequency-dependent property of the core0.06963.3550.00

