Abstract
Herein we demonstrate a novel (Pb0.50Ba0.50)ZrO3 (PBZ50) ceramic that exhibits a reentrant relaxor ferroelectric phase transition in an antiferroelectric-based perovskite system. The dielectric measurement has confirmed that the imaginary part of the dielectric constant for the reentrant phase is nearly frequency independent below the freezing temperature. The reentrant behavior could be scaled to a phenomenological equation involving the Vogel–Fulcher relationship. These results were further complemented by the polarization measurements. The PBZ50 was fabricated using a semi-wet synthetic route involving a solid-state thermochemical reaction. We believe this unusual phase transition sequence in the PBZ50 material would be highly useful in high-density data storage devices.
Keywords:
dielectric; ferroelectric; PbZrO3; reentrant; solar cell; superparaelectric; Vogel-Fulcher 1. Introduction
The effect of substitutional impurities in antiferroelectric (AFE) materials with a perovskite structure has been sparsely investigated so far despite the potential application in several electrical devices. Previous investigations have shown that in pure lead zirconate (PbZrO3), the room temperature AFE phase transforms into a ferroelectric (FE) phase above 225 °C which, upon further heating, transforms into the paraelectric (PE) phase above 231 °C [1]. A similar phase transformation (AFE to FE to PE) has also been observed in the (Pb1−xBax)ZrO3 (PBZ) system upon heating until the composition is x ≤ 0.15 [2]. The AFE to FE to PE phase transition has also been reported due to the composition variation of Ba2+ in this system at room temperature [3]. Whereas, for 0.20 ≤ x < 0.30, only the FE to PE phase transition occurred and the AFE phase disappears [2]. On increasing the Ba2+ content further to x = 0.30, the FE phase gives way to a relaxor ferroelectric phase [4]. However, in thin film samples of the PBZ system, the relaxor ferroelectric phase has recently been reported even in the lower compositions of Ba2+ [5]. Relaxor FE behavior has been reported in a variety of perovskite systems such as Pb(Mg1/3Nb2/3)O3 (PMN) [6], Pb(Sc1/2Ta1/2)O3 [7], (Pb0.97(1+x)La0.02)(Zr0.95Ti0.05)O3 [8], (Ba1−xSnx)TiO3 [9], and (Pb0.5Ca0.5)TiO3 [10]. In the PMN type complex perovskites, there is an inbuilt disorder at the ‘B’ site (that is, the Mg2+/Nb5+ site) which is largely believed to be responsible for the relaxor FE behavior [11]. In the other relaxor compositions listed above, the base compound in the absence of disorder is a regular FE phase which gives way to relaxor FE type behavior on increasing the disorder level. The (Pb0.70Ba0.30)ZrO3 is the example of a relaxor FE phase where the ground state of the base compound (PbZrO3) is in an AFE phase [1,4].
Fundamental studies of the dynamics of freezing in relaxor ferroelectrics (RFE) have received considerable attention in recent days as this can provide a conceptual link between dipole glasses and the ferroelectric state. In this work, we have demonstrated an unusual reentrant relaxor ferroelectric transition in (Pb0.50Ba0.50)ZrO3 (PBZ50) ceramics based on the dielectric and polarization measurements. The phenomenon of re-entrance into a low-temperature disordered phase with higher entropy on collapse of a lower entropy long-range ordered high-temperature phase is of considerable interest in statistical mechanics and has been observed in a variety of systems ranging from liquid mixtures [12] and liquid crystals [13] to magnetic [14] and dipolar systems [15]. Despite several theoretical attempts (Reference [16] and the References there in), a satisfactory theory for the reentrant glass transition still eludes us. The Spherical Random-bond-random-field (SRBRF) model of relaxor ferroelectrics also does not lead to the reentrant relaxor phase [17,18,19]. Our findings of the reentrant relaxor ferroelectric phase in the PBZ system would significantly contribute to stimulating further theoretical work. We have shown that the imaginary part of dielectric (ε″(ω,T)) data for the reentrant relaxor ferroelectric phase can be merged into a single master curve using a temperature independent distribution of activation energies linked to the relaxation times by a Vogel–Fulcher distribution law with a non-zero freezing temperature similar to what is known for proton glasses [20] and lead magnesium niobate (PMN) [6]. The Vogel–Fulcher distribution is a model which includes an increasing degree of interaction between random local relaxation processes. It is generally used in the slow relaxation below the transition temperature and is most suitable in the mixed ferroelectric glass phase in which short- and long-range order co-exist. However, the Arrhenius distribution is applicable for the relaxation process where there is a long-range order of dipole glass.
2. Results
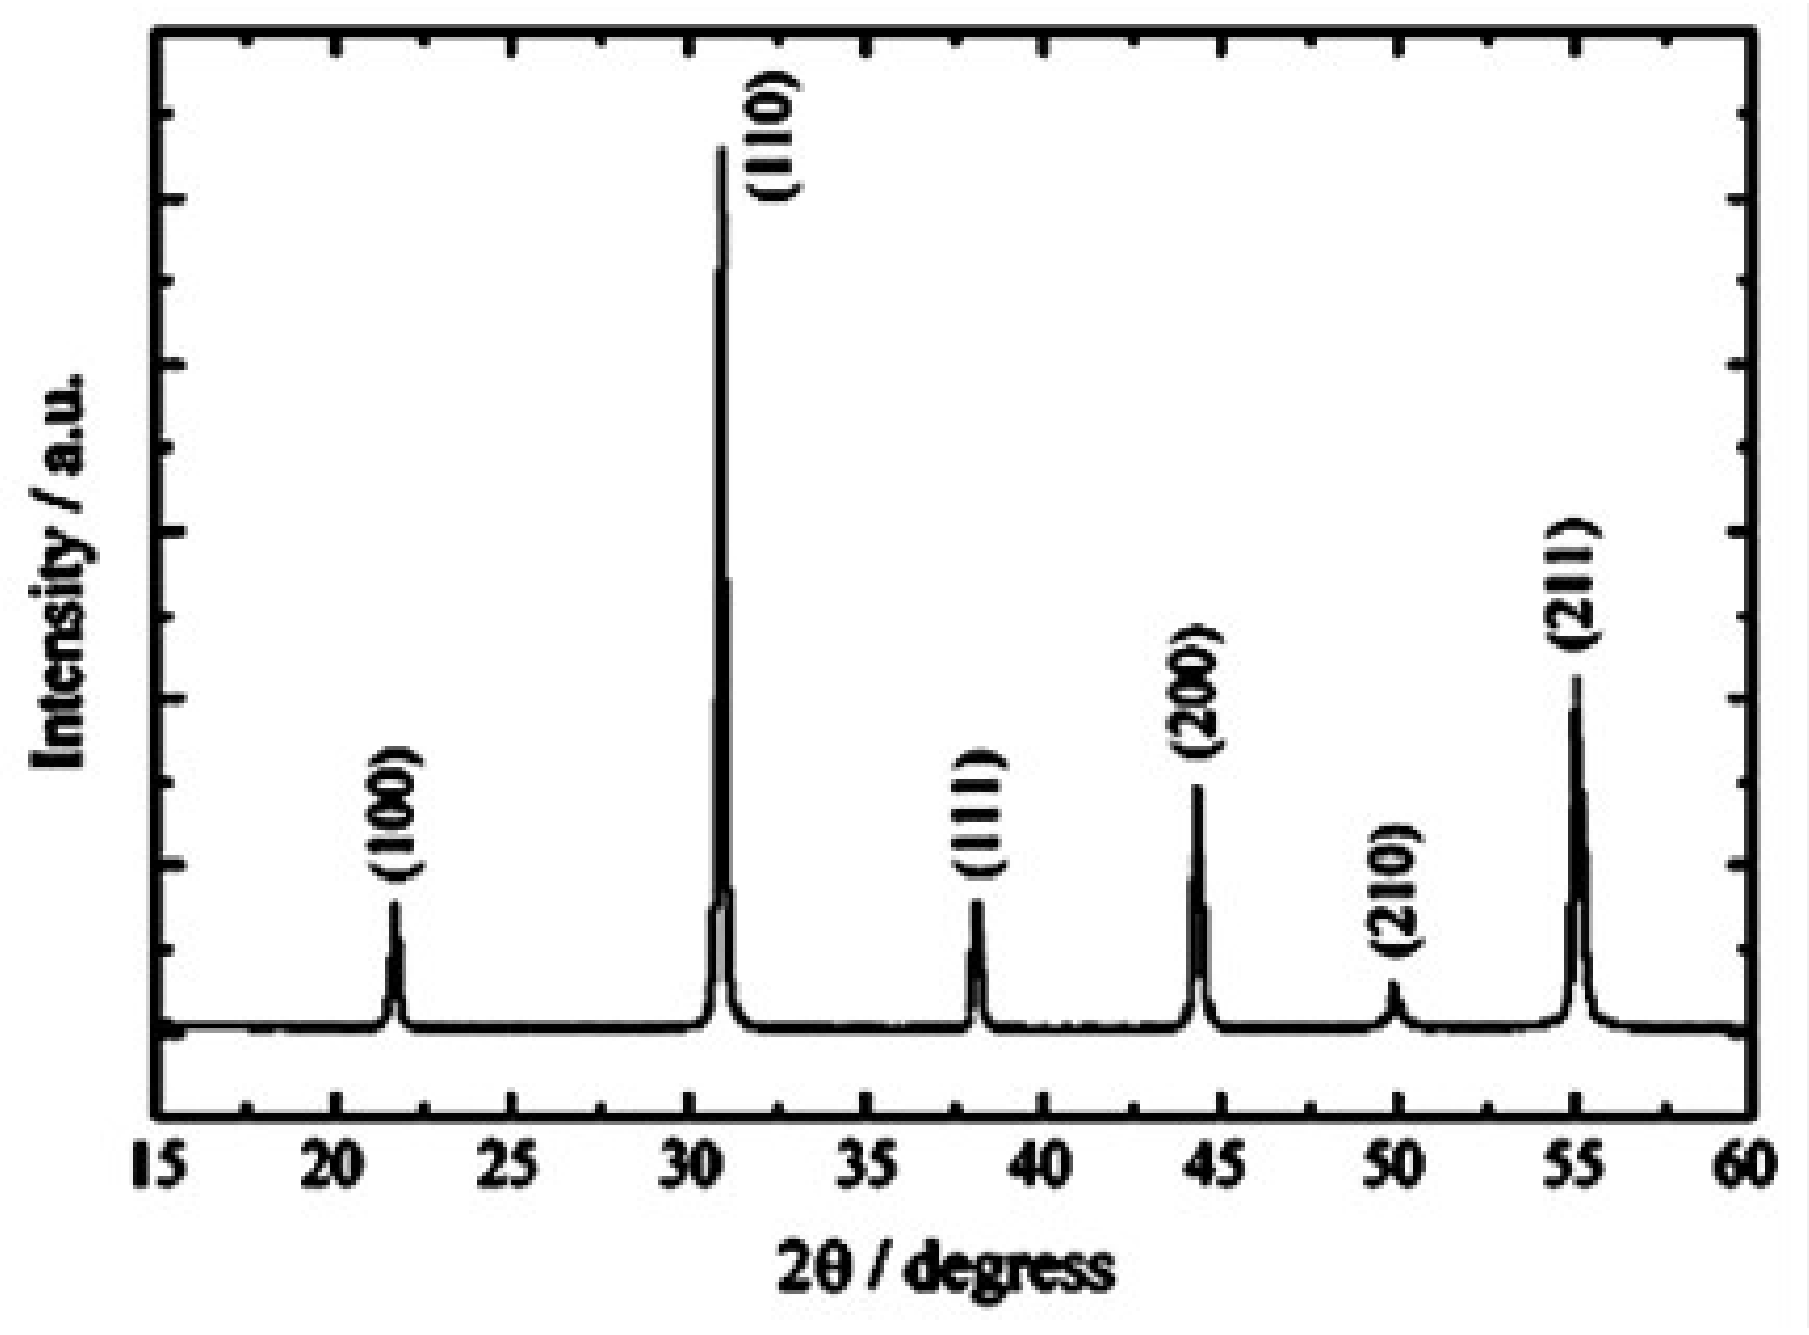
Figure 1 shows the X-ray diffraction profile of PBZ50, which confirms the cubic structure at room temperature. The lattice parameter and unit cell volume obtained by least-squares refinement using the 2θ values of various reflections in the range of 15° ≤ 2θ ≤ 100° for the sample are as follows: Ac = 4.182(2) Å and Vc = 73.1(2) Å3. The Debye-Scherer relation is given by
β(θ) = λ/(Dcosθ)

Figure 1.
The X-ray diffraction pattern of PBZ50.
The XRD data show the crystallite size of D = 213 nm for this semi-wet derived sample, whereas it is 1.53 μm for the conventional dry-route derived sample, where β(θ) is the full width half maximum (FWHM) of the XRD peaks and λ = 1.54055Å.
In our earlier dielectric and structure studies on the (Pb1−xBax)ZrO3 (PBZ) system with x ≤ 0.30, we have shown that the AFE to FE phase transition temperature of pure PbZrO3 (PZ) phase decreases with the increasing Ba2+ content up to x ≈ 0.17, beyond which the AFE phase disappears [2,21]. This was subsequently explained in terms of a phenomenological theory [22]. The FE to PE phase transition temperature decreases with the increasing Ba2+ content until x = 0.30 when the behavior changes from the normal FE phase to the relaxor FE (RFE) type phase.
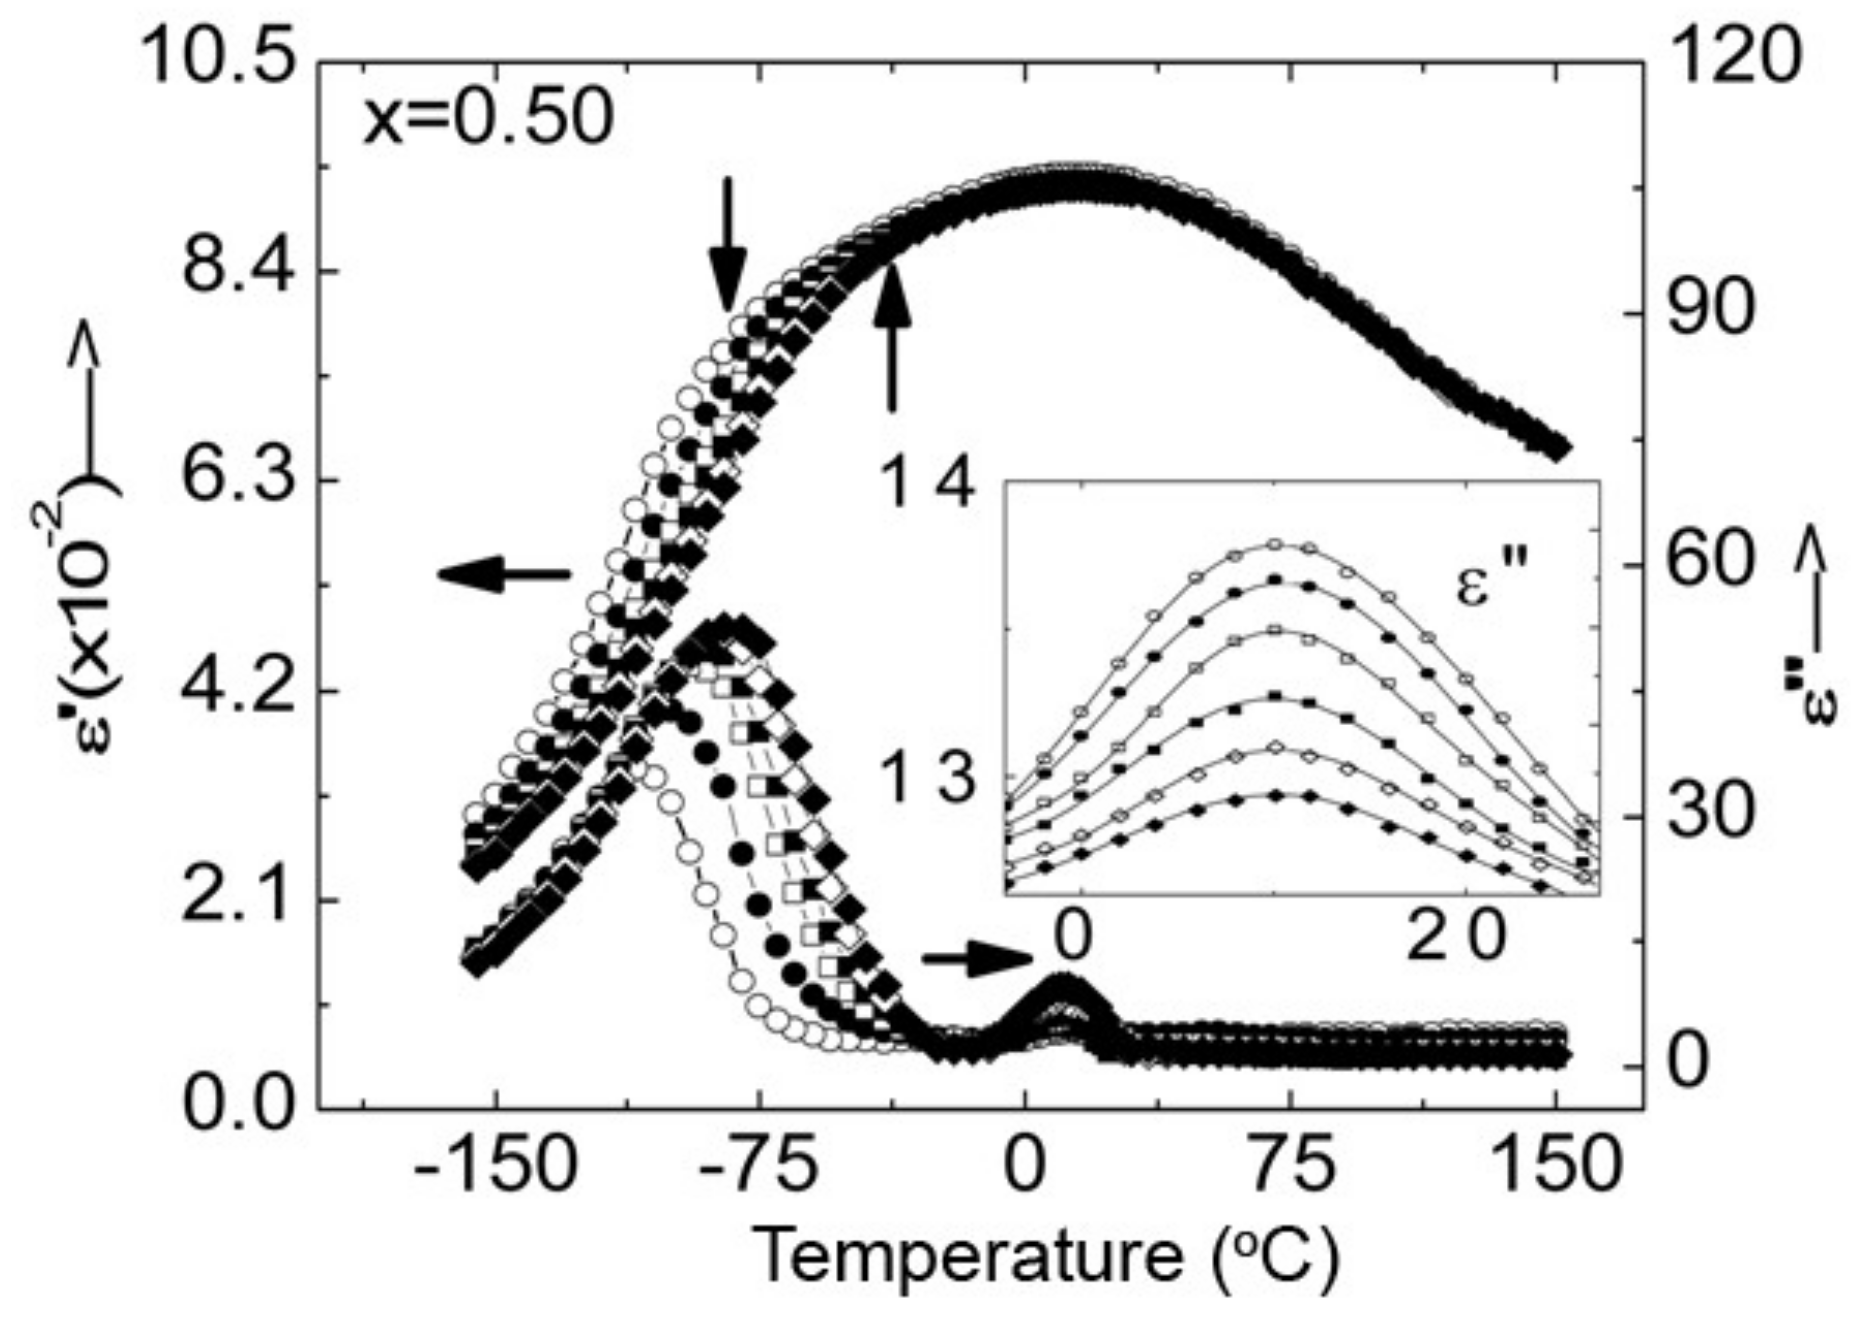
On increasing the Ba2+ contents further, that is, for x = 0.50, we distinctly observed two peaks in the imaginary parts of the dielectric constant (ε″) as shown in Figure 2, which depict the variation of ε′ and ε″ with temperature for various frequencies. We shall use the symbols Tm1″ and Tm2″ to denote the higher and lower temperature anomalies in ε″ as shown in Figure 2. The tail of the peak at Tm2″ overwhelms the other peak at Tm1″ at different frequencies. The two peaks are, however, well resolved at a given frequency as shown in the inset to Figure 2. The difference between Tm1″ and Tm2″, that is, (Tm1″ − Tm2″), at 1 kHz, is 120 °C. Tm2″, on the other hand, exhibits a considerable frequency dispersion similar to what is well known for relaxor ferroelectrics [11]. In particular, Tm2″ shifts to the higher temperature side on increasing the frequency.

Figure 2.
Variation of the real and imaginary parts of the dielectric constant with temperature at various frequencies for PBZ50. The inset shows the frequency independence of the peak temperature for the second ferroelectric (FE2) phase.
Unlike Tm1″ and Tm2″, the two transition temperatures Tm1′ and Tm2′ in the temperature variation of the real part of the dielectric constant (ε′(T)) cannot be resolved visually. We have, therefore, located Tm1′ and Tm2′ by analyzing the change of the slope in the ε′(T) plot, following the procedure adopted by Takashige, et al. [15] for the reentrant glass transition in a Rb1−x(NH4)xH2PO4 system. Tm1′ and Tm2′ are so obtained and shown in Figure 2 with arrows for 1 kHz. It is found that Tm1′ is frequency independent, whereas Tm2′ shifts to a higher temperature on increasing the frequency. Furthermore, the peak in the ε″ (T) plot occurs at a temperature where Tm2″ is lower than Tm2′ (Tm2″ < Tm2′) and coincides with the inflection point in the ε′(T) plot. Tm1′ and Tm1″, on the other hand, are not only frequency independent but also equal (Tm1′ = Tm1″). These observations clearly suggest that the first transition, for which Tm1′ = Tm1″ with no frequency dispersion, is an equilibrium phase transition, whereas the second transition, for which Tm2′ and Tm2″ are frequency dependent and Tm2″ < Tm2′, is of the relaxor ferroelectric type [11]. The peak value of the dielectric constant (ε′) at Tm2′ is around 9 × 10², which is of the same order of magnitude as in relaxor (Pb0.97(1+x)La0.02)(Zr0.95Ti0.05)O3 ceramics [8] and dipole glasses in (K, Li)TiO3 (KLT) [23,24]. However, both the relaxor ferroelectrics and the dipolar glasses exhibit similar frequency dependent peak temperatures and the dipolar glass models have been used to describe the relaxor ferroelectric state [16,17,18,19,25,26,27]. Similarly, the relaxor model has been used to describe the dynamics of freezing in the dipolar glasses of KLT [28]. Whether the relaxor FE phase observed in the PBZ system is a dipole glass type or whether it is due to a random field induced FE domain state is a matter of subsequent investigation.
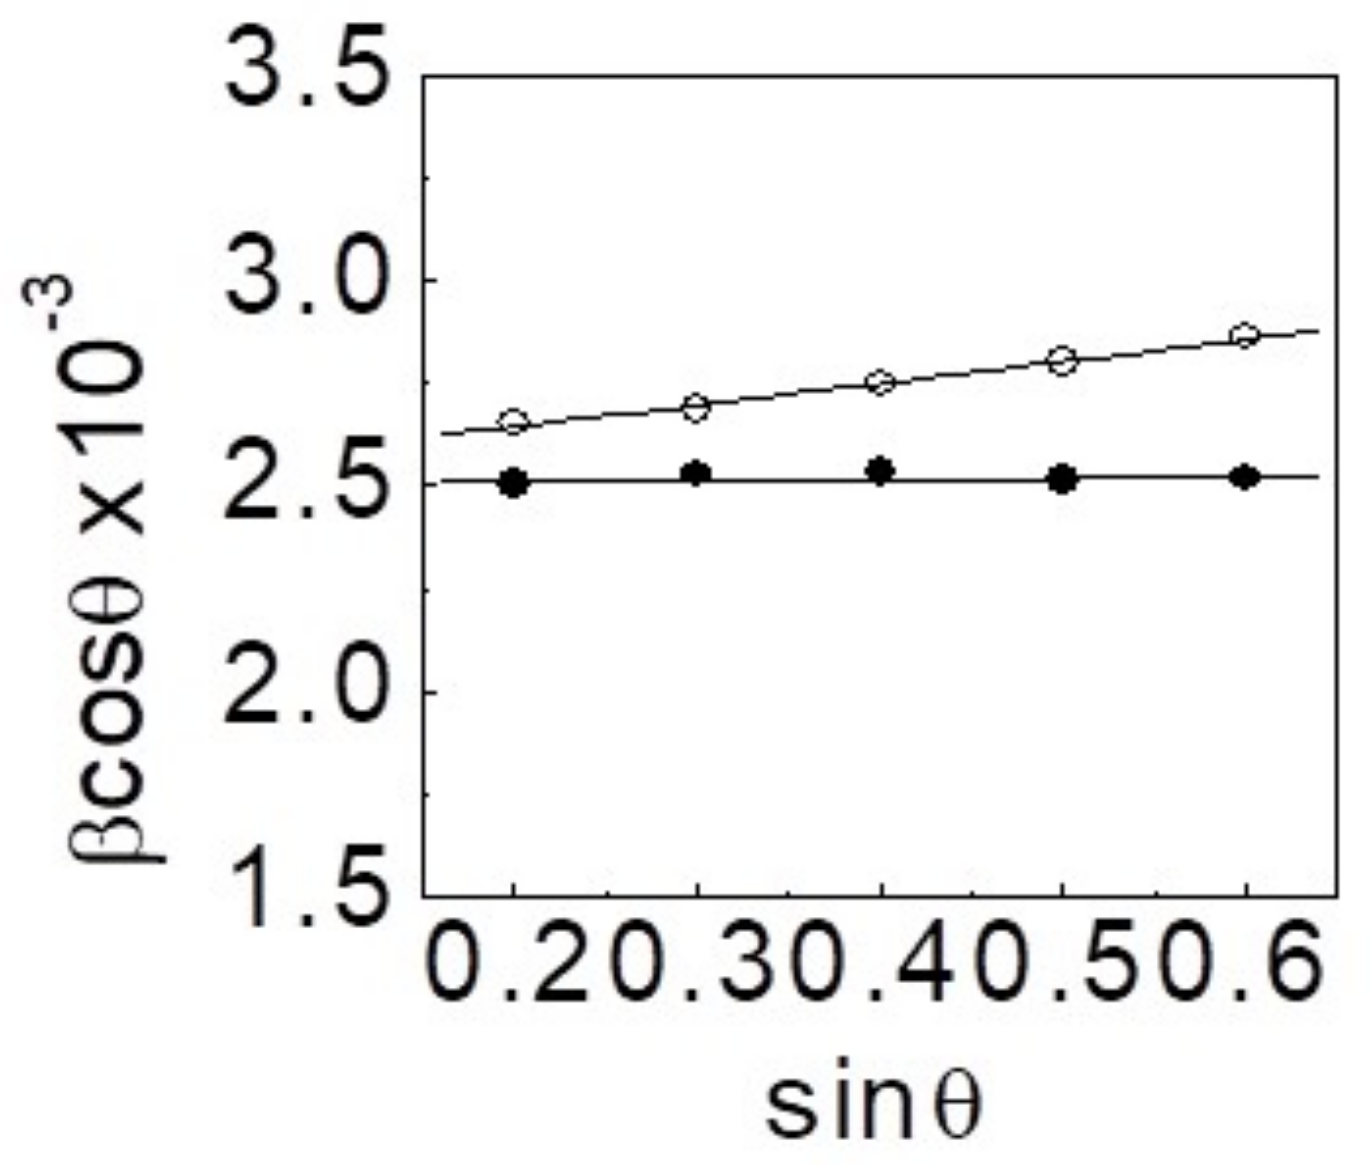
The two transitions revealed by the dielectric measurements for PBZ50 are not due to the presence of two phases with different compositions. The XRD pattern (Figure 1) clearly shows the single phase formation for the composition, and the FWHM (Figure 3) of various reflections in the XRD patterns are, in fact, nearly constant.
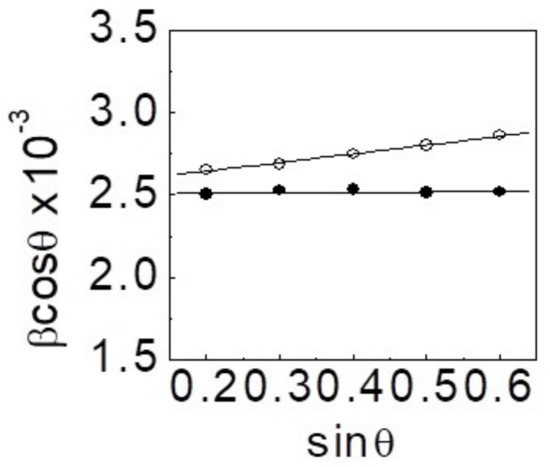
Figure 3.
The plots of βcosθ versus sinθ for semi-wet (●) and dry route (о) derived PBZ50 powder obtained after crushing the pellets.
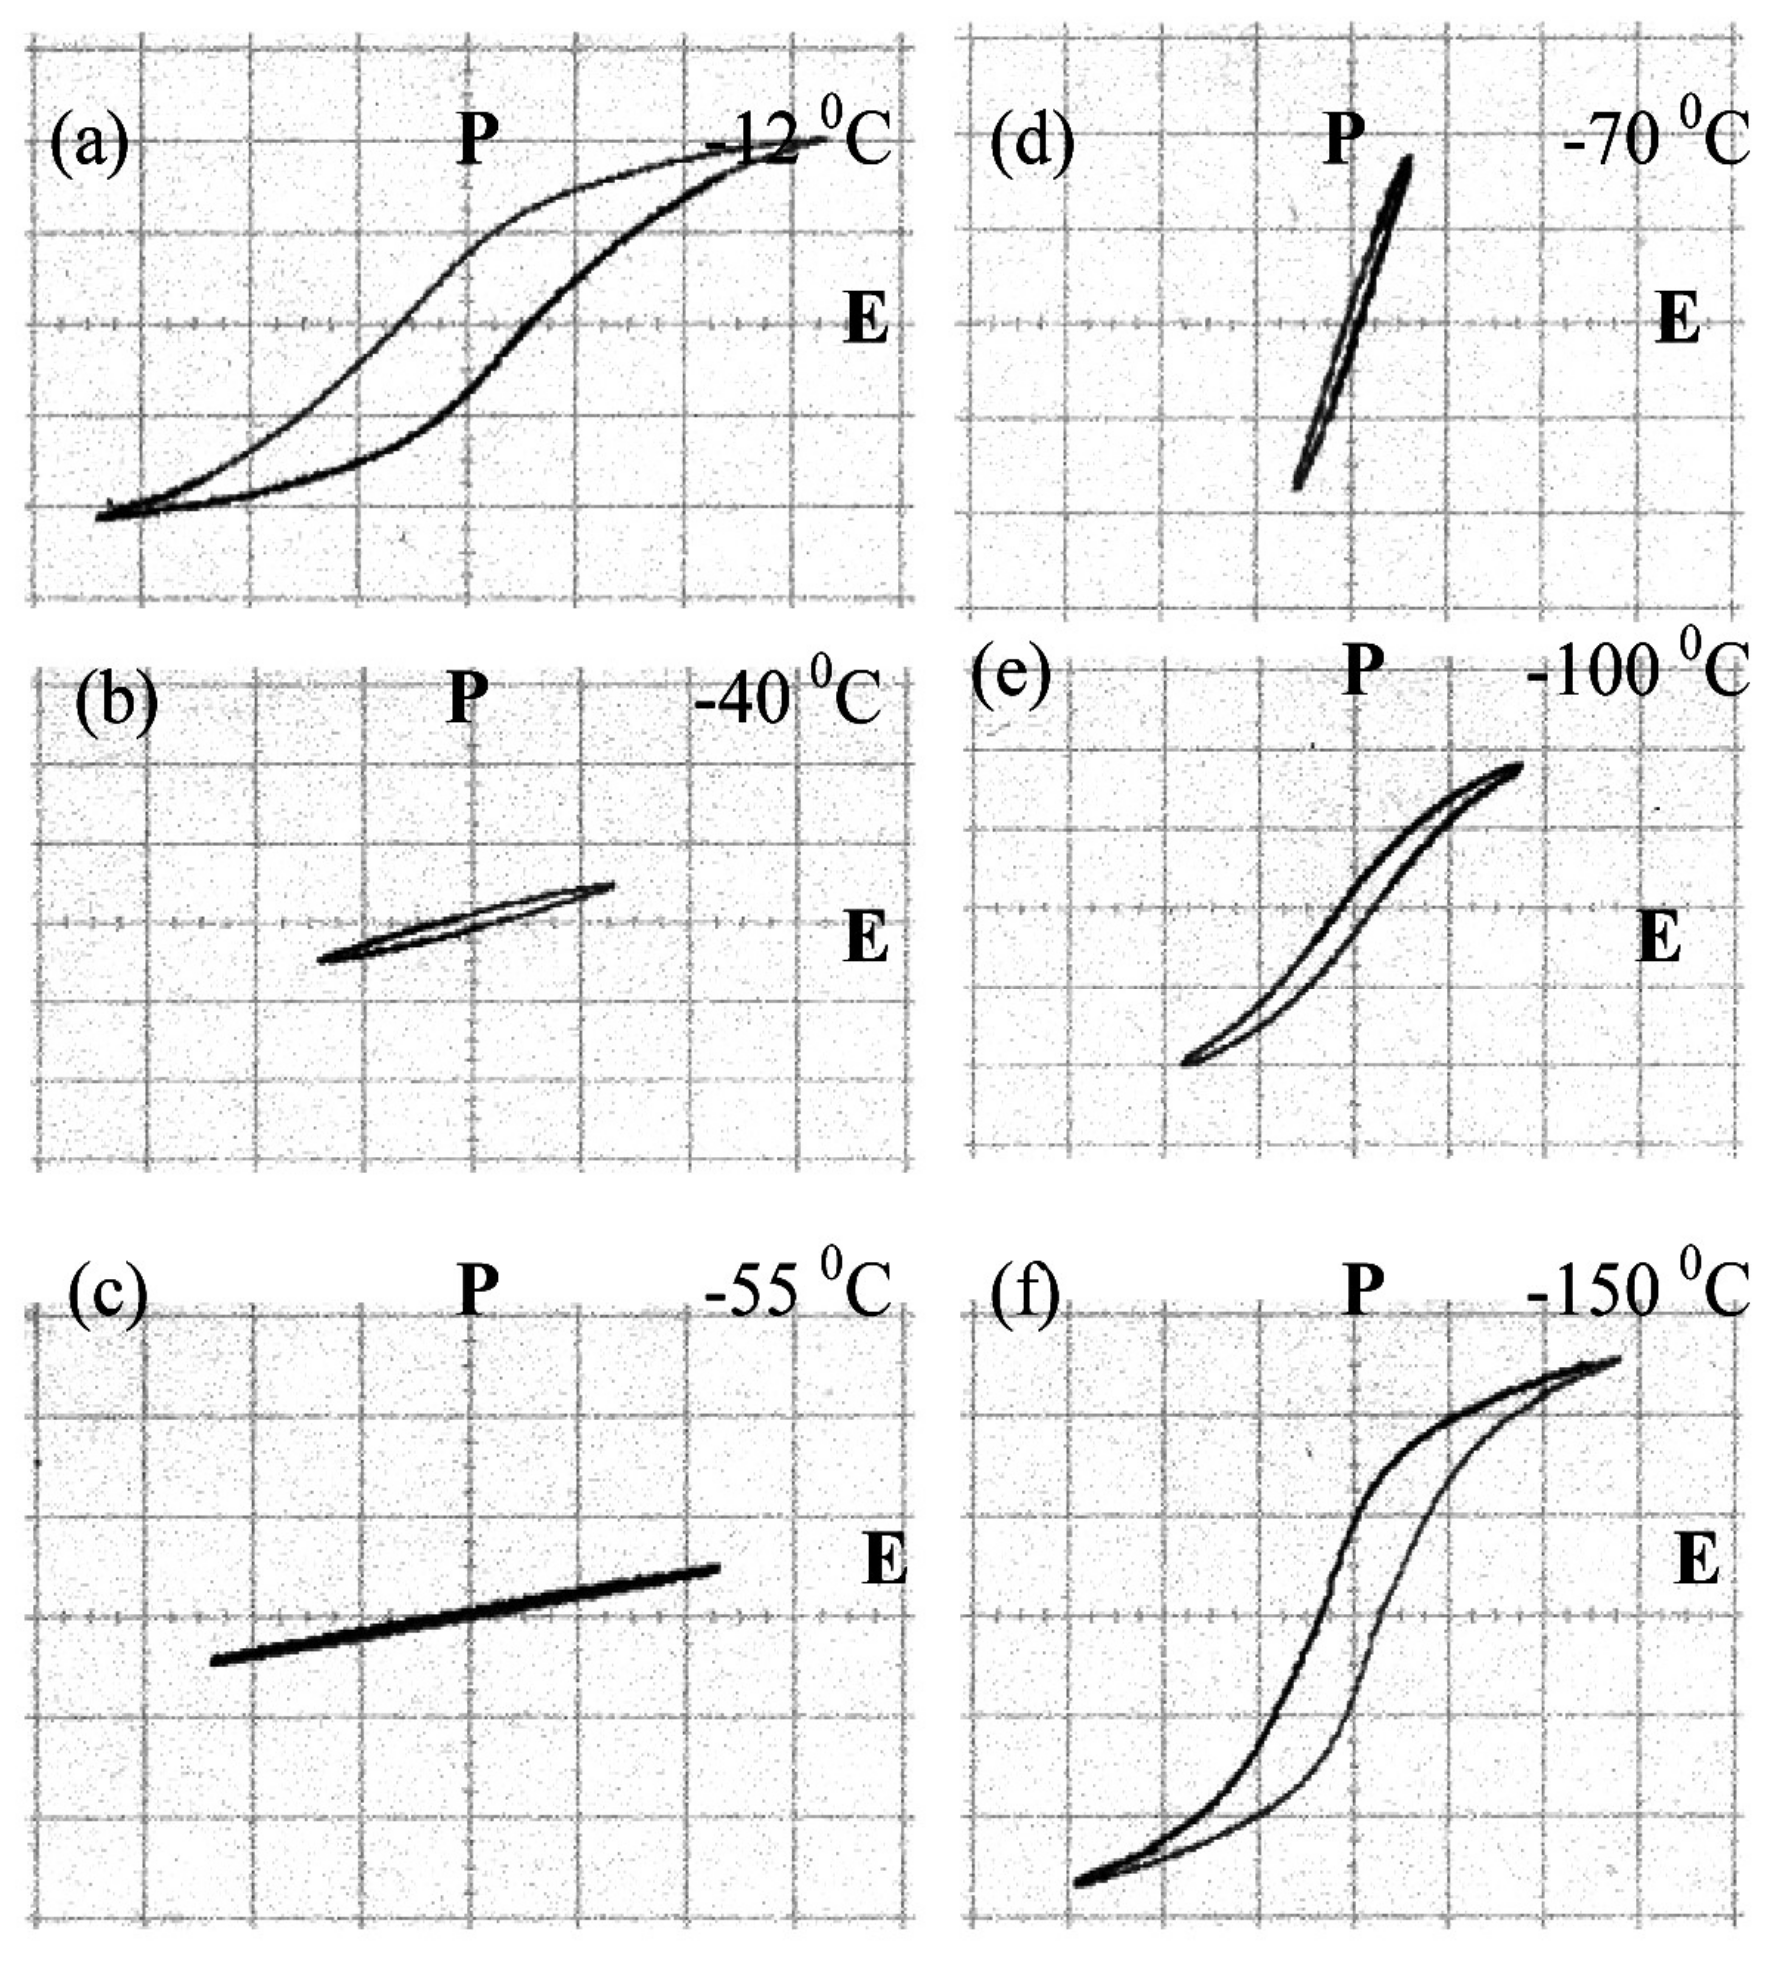
In order to get further insights into the origin of the two dielectric anomalies, hysteresis loop measurements were carried at various temperatures. Figure 4 depicts the evolution of the hysteresis loop with temperature. The variation of polarization (P) at the zero field as obtained from the hysteresis loops measured at various temperatures is shown in Figure 5.
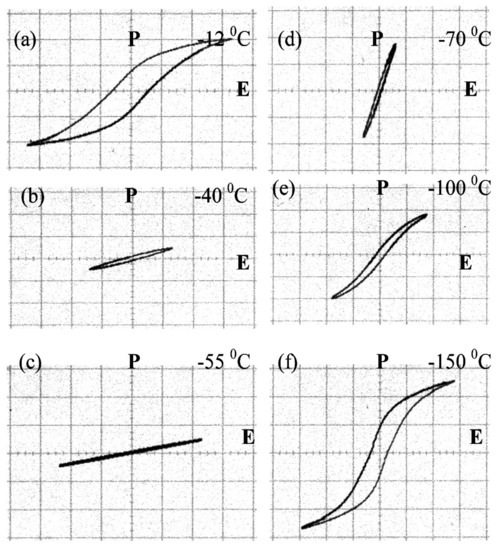
Figure 4.
The hysteresis loop of (Pb0.50Ba0.50)ZrO3 at different temperatures.

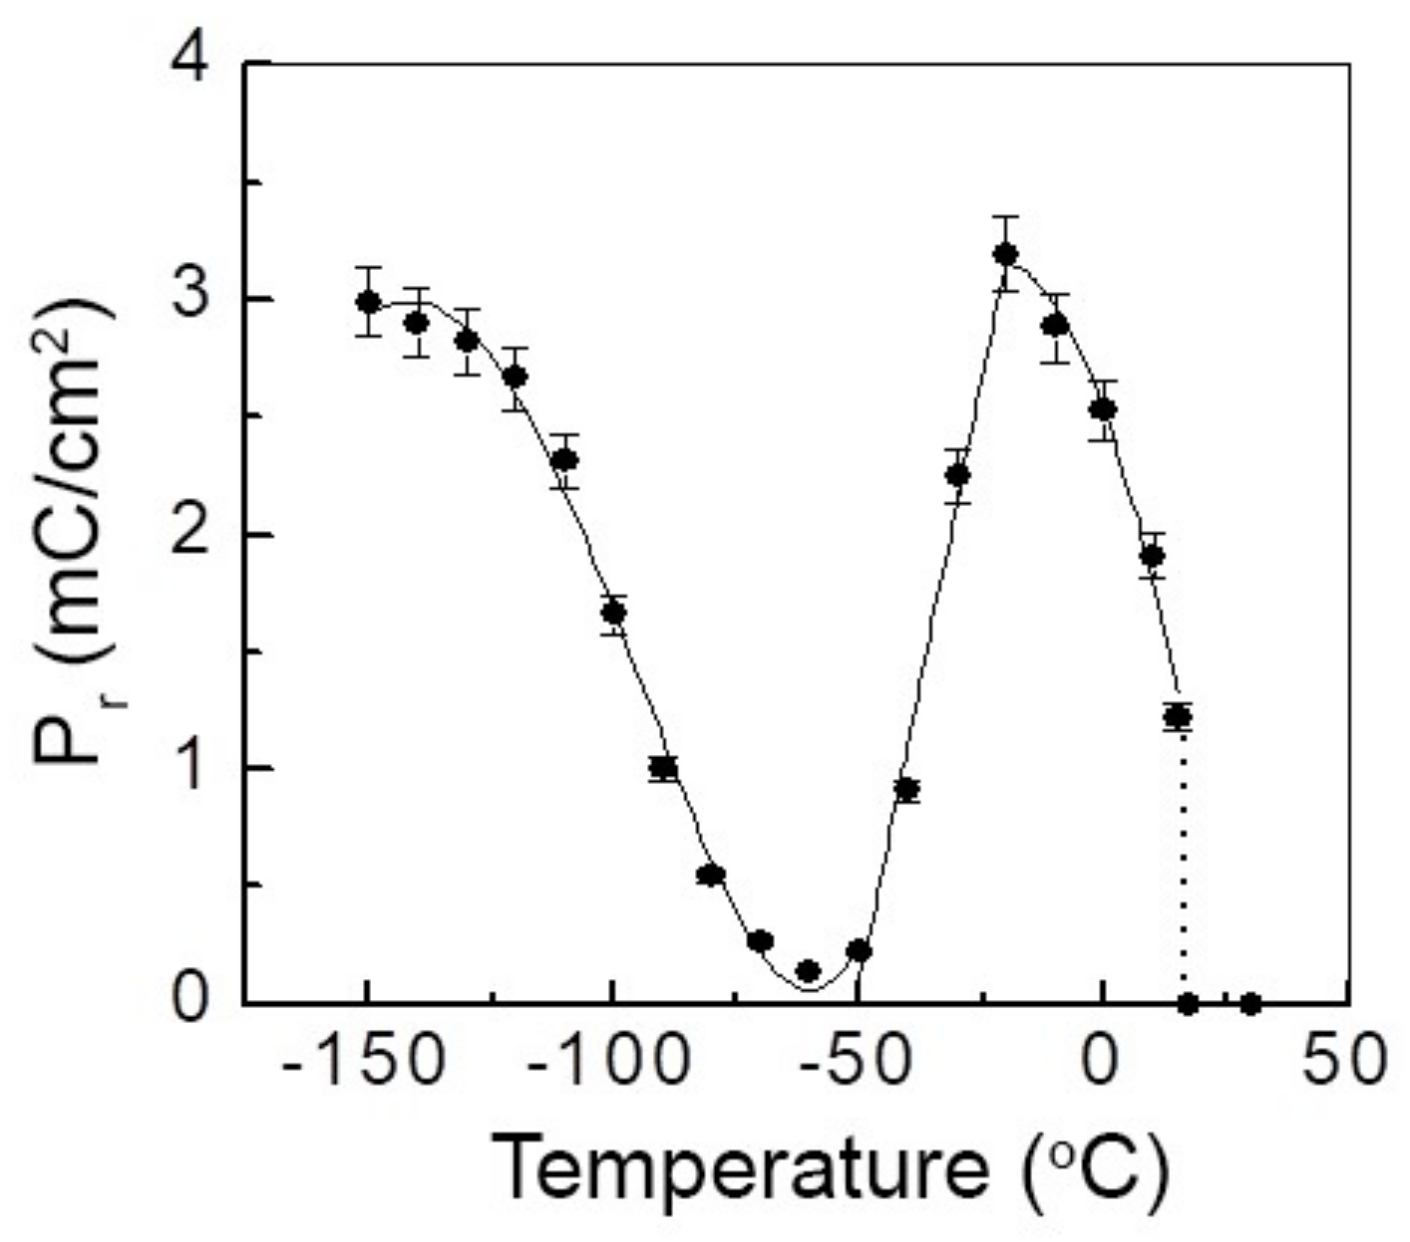
Figure 5.
The variation of the remnant polarization (Pr) of the (Pb0.50Ba0.50)ZrO3 at different temperatures.
In Figure 2, the temperature variation of ε′ and ε″ at 1 kHz is depicted for easy comparison with the temperature variation of P in Figure 5. Comparing Figure 5 and Figure 2, it is evident that the polarization changes discontinuously at Tm1′ = 10 °C, indicating a first order phase transition at 10 °C. With the decreasing temperature, the polarization grows up to about −12 °C. In this temperature range, the saturated hysteresis loop characteristics of the normal ferroelectric phase are observed as shown in Figure 4a for T = −12 °C. On decreasing the temperature below −12 °C, the area within the hysteresis loop starts decreasing until the loop nearly collapses into a straight line at around T = −55 °C (see Figure 4c). The macroscopic order parameter (polarization) becomes zero (or immeasurable within our accuracy) at this temperature as shown in Figure 5. On decreasing the temperature below to −55 °C, the slim loop characteristics of a relaxor FE phase appears as shown in Figure 4d for T = −70 °C. Furthermore, the decrease in temperature leads to the opening of this loop (see Figure 4e) with the concomitant increase in polarization as shown in Figure 5. The increase in polarization shows a thaw around the Vogel–Fulcher freezing temperature (TVF) of −132 °C (see Figure 6).

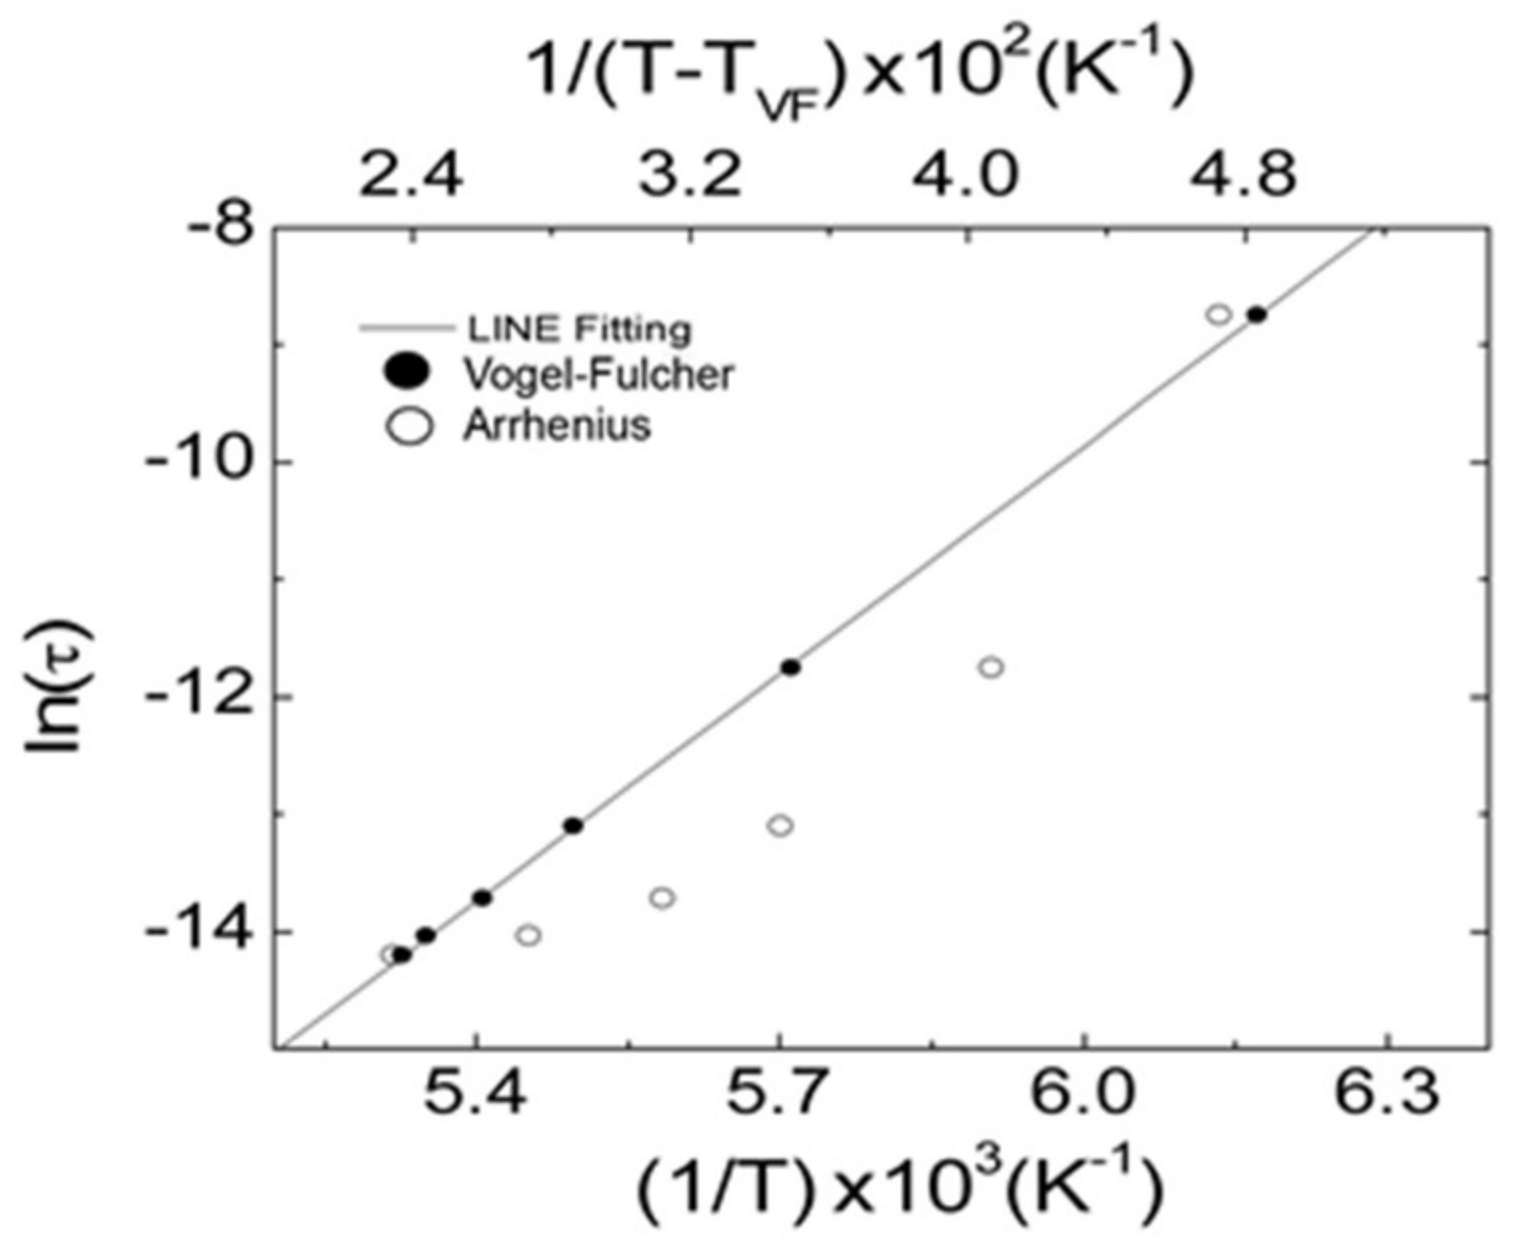
Figure 6.
The variation of relaxation time (τ) with temperature for Arrhenius (о) and Vogel–Fulcher (●) type relaxation freezing for the reentrant relaxor ferroelectric (FE) phase.
Below TVF, the saturated hysteresis loops are observed as shown in Figure 4f at T = −150 °C. The collapse of the macroscopic order parameter (polarization) around T = −55 °C and its subsequent growth on further cooling irrefutably suggests a reentrant behavior whereby a regular ferroelectric order phase reenters into the relaxor ferroelectric disordered phase on cooling.
We have further studied the relaxation time (τ) to analyze the freezing of the polar clusters from the positions of the peaks in the ε″ versus T plots at various measuring frequencies. The variation of lnτ with temperature for the Arrhenius and Vogel–Fulcher type behavior is shown in Figure 6. It is evident from that the relaxation process undergoes Vogel–Fulcher freezing since the fit for Arrhenius type freezing is rather bad, similar to our earlier result reported for PBZ30 [4]. For the Vogel–Fulcher behavior, the freezing temperature (TVF) was taken as the temperature which gives the minimum variance for the fit between lnτ and (T − TVF)−1. The values of the TVF, E, and τ0, so obtained for the sample, are listed in Table 1. The activation energy (E) for this composition in the PBZ sample is comparable to that reported for the Pb(Sc1/2Nb1/2)O3 [7], Pb(Sc1/2Ta1/2)O3 [7] and (1 − x)BaTiO3 − xBiScO3 [18] systems. The value of the inverse of the attempt frequency is also comparable to that for PMN-PT [7,10,17]. We attribute this to the presence of a relaxor ferroelectric phase and a reentrant relaxor FE phase.

Table 1.
The list of transition temperatures of the relaxor ferroelectric (FE) reentrant, the relaxor FE transition, and the coefficient of Vogel–Fulcher relation for PBZ50 ceramics. D is a constant obtained by fitting the hyperbolic tangent function to the observed dielectric data.
For the study of the scaling behavior of frequency dispersion, the ε″(ω,T) versus T plot must be considered where ε″(ω,T), as below TVF is essentially frequency independent as can be seen from Figure 1. The ε″(ω,T) data below TVF can be represented by a function h(T) which describes the contribution of the frozen state (frequency independent part) to ε″. Above TVF, there is an additional dynamic (or frequency dependent) contribution R(u) to ε″(ω,T). Following Courtens [20], the dynamic part of the ε″(ω,T) data for the reentrant relaxor FE phase can be scaled by assuming the following form:
where u(ω,T) is a scaling variable which is expressed as u = EC − E. Here, EC is a constant cut-off energy in the units of T while E is a variable related to τ = 1/ω through the Vogel–Fulcher relation as
ε″(ω,T) ≅ h(T)R(u)
At low temperatures, R(u) ≅ 1, so that ε″(ω,T) = h(T). This, in our case, is well approximated by a third order polynomial in temperature with the a0, a1, a2, and a3 coefficients and can be determined by fitting it into the experimental data at low temperatures (T < TVF). At higher temperatures, R(u) decreases and approaches zero. In the intermediate temperature range (that is, the relaxation region), the polynomial form of h(T) is relaxed by the dynamic contribution from R(u). The entire dynamic contribution to ε″(ω,T) can be collapsed into a single master curve as shown in Figure 7. The scaling function R(u) is well represented by a hyperbolic tangent function given by Courtens [20]:
where d is a constant in eV−1. The solid line in Figure 7 represents the fit obtained using the above scaling function. All the data points lie on the hyperbolic tangent function given by Equation (4). Using the value of d obtained from the fit of the tangent hyperbolic function to the observed data, we have simulated the values of ε″(ω,T). The simulated values of ε″(ω,T), shown with continuous lines in Figure 8, are in excellent agreement with the observed data points, further confirming our scaling procedure.
R(u) = 0.5 [1 + tanh du]
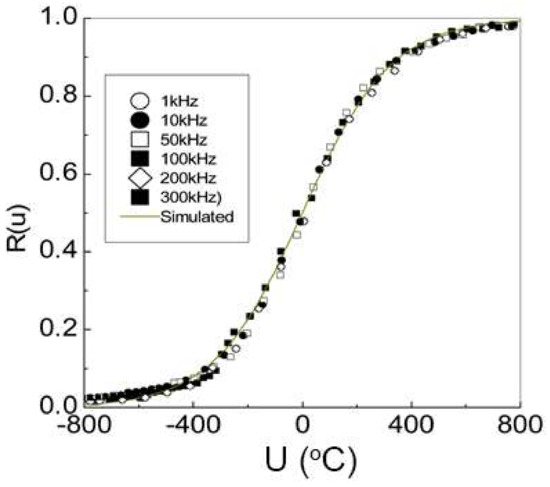
Figure 7.
The scaling function R(u) versus the scaling variable u at various frequencies for the reentrant relaxor FE phase.
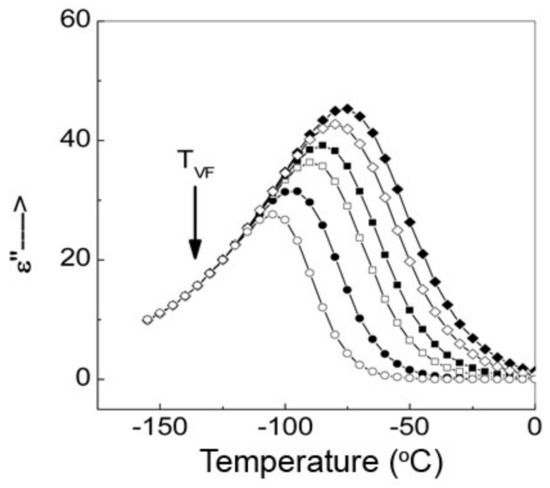
Figure 8.
The phenomenological fitting to the observed imaginary part of the dielectric data (ε″).
To understand the physical significance of the scaling behavior, we note that the peak in ε″ in Figure 2 appears at the temperature corresponding to the inflection point in ε′ in the relaxor regime. This is similar to what is known for the dipole and spin glasses where the dielectric and magnetic responses have been phenomenologically modeled by a sum of Debye relaxators [20].
As argued by Courtens [20], the above result is irreconcilable with growing glass clusters which should have a strongly temperature dependent activation energy distribution. It is more likely that the superparaelectric dipolar clusters, formed after the collapse of the FE phase, freeze-out progressively. The local random dipolar field between the superparaelectric moments may subsequently lead to a freezing of the polarization fluctuations into the relaxor FE state below TVF.
The ionic radius of Pb2+ (1.17 Å) is smaller than that of Ba2+ (1.29 Å) and if we consider from the BaZrO3 (BZ) end to rationalize the reappearance of the FE phase for x = 0.50, we expect the Pb2+ ions to take up off-center positions with respect to the cube corner positions of the elementary perovskite unit cell. This type of off-centered behavior is well known in systems like Ba5RTi3Nb7O3 (R = La, Nd, Sm) [25] and (K,Li)TaO3 [23,24] because of the size difference between the Ba2+, R2+, K1+, and Li1+ ions. In fact, even in pure Pb based perovskites like PbTiO3 [29], PMN [30], and PZT [31], there is a lot of disorder at the Pb site as reflected through the unusually high thermal parameters [32]. The off-centered Pb2+ ions in the BZ matrix will give rise to random site dipoles which seems to freeze below a critical temperature into the second FE phase (also known as the FE 2 phase).
In the PE phase, there is no macroscopic strain or depolarizing field resulting from the random site dipoles, since the off-center displacement of the Pb2+ ions will occur in several crystallographically equivalent directions at random. However, when these random site dipoles tend to freeze into an FE phase, all the Pb2+ ions have to be necessarily displaced in the same direction, which would lead to an increase in the strain energy as well as the depolarization energy of the system. By splitting into domains of size t, the system can reduce its depolarization and strain energies, which are of the order of t3, provided the positive energy cost of the domain walls of the order of t2 can be recovered from the bulk energy. This fixes a critical size for the formation of domains [33]. Such domain formations are well known in regular ferroelectrics such as BaTiO3 and PbTiO3. Now, if the domain size becomes so small that the thermal agitation can prevent their alignment under an external electric field, the polarization can collapse like superparaelectric clusters carrying some giant dipole moment [11]. With the decreasing temperature, the thermal agitation of these clusters decreases, making it again possible for the external electric field to align them. The alignment continues to improve with the decreasing temperature, leading to an increasing value of P with decreasing temperatures, as can be seen from Figure 3. Finally, below the Vogel-Fulcher freezing temperature of about −132 °C, thermal agitation nearly vanishes and the polarization values approach a plateau. Such behavior can be exploited in high-density data storage devices. Dielectric capacitors are well-known for their power density and discharge capacity. Among the dielectrics, ferroelectrics usually possess higher dielectric constants and a fast discharge time that makes them suitable candidates for high energy density storage applications. Our sample is an antiferroelectric based reentrant relaxor ferroelectric ceramic. The short-range order relaxor with a high dielectric constant embedded in the antiferroelectric based matrix has immense potential for high energy storage applications due to their slim polarization-electric field hysteresis. Antiferroelectric (as well as reentrant relaxor ferroelectrics) also have linear, as well as non-linear, P-E hysteresis that yields the largest energy storage area in the loop in polar dielectrics. Among them, lead-based relaxors show the highest energy density [34].
Our future effort will be to look into the detailed study of all compositions of Pb in BaZrO3 systems and the temperature variation of third nonlinear susceptibility which may enable us to distinguish between the two models unambiguously.
3. Materials and Methods
The (Pb0.50Ba0.50)ZrO3 sample used in the present investigation was prepared using a semi-wet route, the details of which are described elsewhere [21]. For getting dense samples, it was found necessary to use a higher sintering temperature of 1200 °C for 3 h in a PbO atmosphere. The typical weight loss due to possible PbO escape at the sintering temperature was less than 0.25%. The density of the sintered pellets measured using the liquid displacement method was found to be 98% of the theoretical x-ray density and the average grain size obtained by an optical microscope was 2 µm. The powders obtained after crushing these pellets were annealed at 500 °C for 12 h to remove the strains induced during crushing. The crystal structure and crystallite size of the sample were checked by a 12 kW rotating anode based Rigaku x-ray powder diffractometer.
For the dielectric measurements, the fired-on silver electrodes were deposited on the pellets. The capacitance (C) and tanδ were measured as a function of the temperature at various frequencies (1, 10, 50, 100, 200, and 300 kHz) using a Hioki-522-532 LCR Hi-tester and was verified by a Solartron 1260 impedance/gain-phase analyzer. The polarization measurements were performed under similar conditions using an indigenously designed hysteresis loop tracer based on a modified Sawyer-Tower circuit operating at switching fields of 50 Hz. The temperature was measured with an accuracy of ±1 °C. An Agilent storage oscilloscope (Model 54624A) was used for recording the hysteresis loop. Both measurements were taken at a heating rate of 1 °C/min.
4. Conclusions
We have carried out a detailed study of the temperature dependent dielectric constants (ε′, ε″) of PBZ50 at various frequencies during the heating cycle. The results conclusively establish, for the first time, a reentrant behavior in antiferroelectric based oxygen perovskite systems. The re-entrance behavior in this system is further confirmed by the polarization measurements. The reentrant relaxor FE phase results because of the fragmentation of the FE regions into small clusters of correlated dipoles to minimize the buildup of the depolarization and strain energy as the lead centered dipoles freeze into the FE state. The notable new features of this composition of the PBZ system are the relaxor FE phase, the reentrant relaxor FE transition, and a new FE phase. The freezing of random site dipoles due to off-centered Pb2+ ions in the BaZrO3 matrix into an FE phase cannot be rationalized in terms of the existing theories describing the freezing behavior of random site dipoles in weakly polarizable media like BaZrO3.
Author Contributions
All the authors equally contributed to prepare the manuscript.
Conflicts of Interest
The authors declare no conflict of interest.
References
- Shirane, G.; Sawaguchi, E.; Takagi, Y. Dielectric properties of lead zirconate. Phys. Rev. 1951, 84, 476–481. [Google Scholar] [CrossRef]
- Pokharel, B.P.; Pandey, D. Dielectric studies of phase transition in (Pb1−xBax)ZrO3. J. Appl. Phys. 2000, 88, 5364–5373. [Google Scholar] [CrossRef]
- Zhang, T.; Tang, X.; Liu, Q.; Jiang, Y.; Hung, X. Oxygen-vacancies-related high temperature dielectric relaxation in (Pb1−xBax)ZrO3 ceramics. J. Am. Ceram. Soc. 2015, 98, 551–558. [Google Scholar] [CrossRef]
- Pokharel, B.P.; Ranjan, R.; Pandey, D.; Siruguri, V.; Paranjpe, S.K. Rhombohedra superlattice structure and relaxor ferroelectric behavious of (Pb0.70Ba0.30)ZrO3 ceramics. Appl. Phys. Lett. 1999, 74, 756–758. [Google Scholar] [CrossRef]
- Peng, B.; Zhang, Q.; Li, X.; Sun, T.; Fan, H.; Ke, S.; Ye, M.; Wang, Y.; Lu, W.; Niu, H.; et al. Large energy storage density and high thermal stability in a highly textured (111)-oriented (Pb0.8Ba0.2)ZrO3 relaxor thin film with the co-existence of antiferroelectric and ferroelectric phases. ACS Appl. Mater. Interfaces 2015, 7, 13512–13517. [Google Scholar] [CrossRef] [PubMed]
- Bokov, A.A.; Ye, Z.-G. Recent progress in relaxor ferroelectrics with perovskite structure. J. Mater. Sci. 2006, 41, 31–52. [Google Scholar] [CrossRef]
- Chu, F.; Reaney, I.M.; Setter, N. Investigation of relaxors that transform spontaneously in ferroelectrics. Ferroelectrics 1994, 151, 343–348. [Google Scholar] [CrossRef]
- Li, B.; Liu, Q.; Tang, X.; Zhang, T.; Jiang, Y.; Li, W.; Luo, J. Antiferroelectric to relaxor ferroelectric phase transition in PbO modified (Pb0.9La0.02)(Zr0.95Ti0.05)O3. RSC Adv. 2017, 7, 43327–43333. [Google Scholar] [CrossRef]
- Shvartsman, V.V.; Lupascu, D.C. Lead free relaxor ferroelectrics. J. Am. Ceram. Soc. 2012, 95, 1–26. [Google Scholar] [CrossRef]
- Ranjan, R.; Singh, N.; Pandey, D.; Siruguri, V.; Krishna, P.S.R.; Paranjpe, S.K.; Banerjee, A. Room temperature crystal structure and relaxor ferroelectric behavior of (Pb0.05Ca0.05)TiO3. Appl. Phys. Lett. 1997, 70, 3221–3223. [Google Scholar] [CrossRef]
- Cross, L.E. Relaxor ferroelectrics. Ferroelectrics 1987, 76, 241–267. [Google Scholar] [CrossRef]
- Anderson, G.R.; Wheeler, J.C. Directionality dependence of lattice models for solutions with closed loop co-existence curves. J. Chem. Phys. 1978, 69, 2082–2088. [Google Scholar] [CrossRef]
- Cladies, P.E.; Bogardus, R.K.; Aadsen, D. High pressure investigation of the reentrant nematic bilayer smectic-A transition. Phys. Rev. A 1978, 18, 2292–2306. [Google Scholar] [CrossRef]
- Kaul, S.N.; Shrinath, S. Irreversibility lines in the H-T phases of re-entrant amorphous ferromagnets. J. Phys. Condens. Matter 1998, 10, 11067–11080. [Google Scholar] [CrossRef]
- Takashige, M.; Terauchi, H.; Miura, Y.; Hoshino, S. A re-entrant glass-like phase in Rb1−x(NH4)x)H2PO4. J. Phys. Soc. Jpn. 1985, 54, 3250–3253. [Google Scholar] [CrossRef]
- Gingras, M.J.P.; Sorensen, E.S. Evidence for a genuine ferromagnetic to paramagnetic reentrant phase transition in a Potts spin-glass model. Phys. Rev. 1998, B57, 10264–10267. [Google Scholar] [CrossRef]
- Pirc, R.; Blinc, R.; Bobnar, V. Dynamics of relaxor ferroelectrics. Phys. Rev. B 2001, 63, 054203–054211. [Google Scholar] [CrossRef]
- Bharadwaja, S.S.N.; Trolier-McKinstry, S.; Cross, L.E.; Randall, C.A. Reentrant dipole glass properties in (1−x)BaTiO3−xBiScO3 0.1 ≤ x ≤ 0.4. Appl. Phys. Lett. 2012, 100, 022906–022908. [Google Scholar] [CrossRef]
- Pirc, R.; Blinc, R.; Kutnjak, Z. Non-linear dielectric response of relaxor ferroelectrics. Phys. Rev. B 2002, 65, 214101–214107. [Google Scholar] [CrossRef]
- Courtens, E. Vogel-Fulcher scaling of the susceptibility in a mixed-crystal proton glass. Phys. Rev. Lett. 1984, 52, 69–72. [Google Scholar] [CrossRef]
- Pokharel, B.P.; Dutta, M.K.; Pandey, D. Influence of calcinations and sintering temperatures on the structure of (Pb1−xBax)ZrO3. J. Mater. Sci. 1999, 34, 691–700. [Google Scholar] [CrossRef]
- Pokharel, B.P.; Pandey, D. Effect of Ba2+ substitution on the stability of the antiferroelectric and ferroelectric phases in (Pb1−xBax)ZrO3: Phenomenological theory considerations. Phys. Rev. B 2002, 65, 214108–214113. [Google Scholar] [CrossRef]
- Hochli, U.T.; Knorr, K.; Loidl, A. Orientational glasses. Adv. Phys. 1990, 39, 405–615. [Google Scholar] [CrossRef]
- Vugmeister, B.E.; Glinchuk, M.D. Dipole glass and ferroelectricity in random site electric dipole system. Rev. Mod. Phys. 1990, 62, 993–1026. [Google Scholar] [CrossRef]
- Li, K.; Zhu, X.L.; Liu, X.Q.; Chen, X.M. Re-entrant relaxor behavior of Ba5RTi3–Nb7O30 (R- La, Nd, Sm) tungsten bronze ceramics. Appl. Phys. Lett. 2013, 102, 112912–112914. [Google Scholar] [CrossRef]
- Kutnjak, Z.; Filipic, C.; Pirc, R.; Levstik, A.; Farhi, R.; Marssi, M.E. Slow dynamics and ergodicity breaking in a lanthanum- modified lead zirconate titanate relaxor system. Phys. Rev. B 1999, 59, 294–301. [Google Scholar] [CrossRef]
- Vugmeister, B.E.; Rabitz, H. Dynamics of interacting clusters and dielectric response in relaxor ferroelectrics. Phys. Rev. B 1998, 57, 7581–7585. [Google Scholar] [CrossRef]
- Yoon, K.H.; Hwang, S.C.; Kang, D.H. Dielectric and field-induced strain behavior of (Pb1−xBax)ZrO3 ceramics. J. Mater. Sci. 1997, 32, 17–21. [Google Scholar] [CrossRef]
- Glazer, A.M.; Mabud, S.A.; Clarke, R. Powder profile refinement of lead zirconate titanate at several temperatures in PbZr0.9Ti0.1O3. Acta Cryst. B 1978, 34, 1060–1065. [Google Scholar] [CrossRef]
- Sicron, N.; Ravel, B.; Yacoby, Y.; Stern, E.A.; Dogan, F.; Rehr, J.J. Nature of the ferroelectric phase transition in PbTiO3. Phys. Rev. 1994, 50, 13168–13180. [Google Scholar] [CrossRef]
- Zhong, W.; Vanderbilt, D. Competing structure instabilities in cubic perovskites. Phys. Rev. Lett. 1995, 74, 2587–2590. [Google Scholar] [CrossRef] [PubMed]
- Pandey, D.; Singh, N.; Mishra, S.K. Particle size effect on ferroelectric behavior of barium strontium titanate ceramics. Ind. J. Pure Appl. Phys. 1994, 32, 616–623. [Google Scholar]
- Binder, K.; Young, A.P. Spin glass experimental facts, theoretical concepts and open questions. Rev. Mod. Phys. 1986, 58, 801–976. [Google Scholar] [CrossRef]
- Dand, Z.-M.; Yuan, J.-K.; Yao, S.-H.; Liao, R.-J. Flexible nano-dielectric materials with high permittivity for power energy storage. Adv. Mater. 2013, 25, 6334–6365. [Google Scholar]


© 2018 by the authors. Licensee MDPI, Basel, Switzerland. This article is an open access article distributed under the terms and conditions of the Creative Commons Attribution (CC BY) license (http://creativecommons.org/licenses/by/4.0/).