Large Swing Behavior of Overhead Transmission Lines under Rain-Load Conditions


Abstract
:1. Introduction
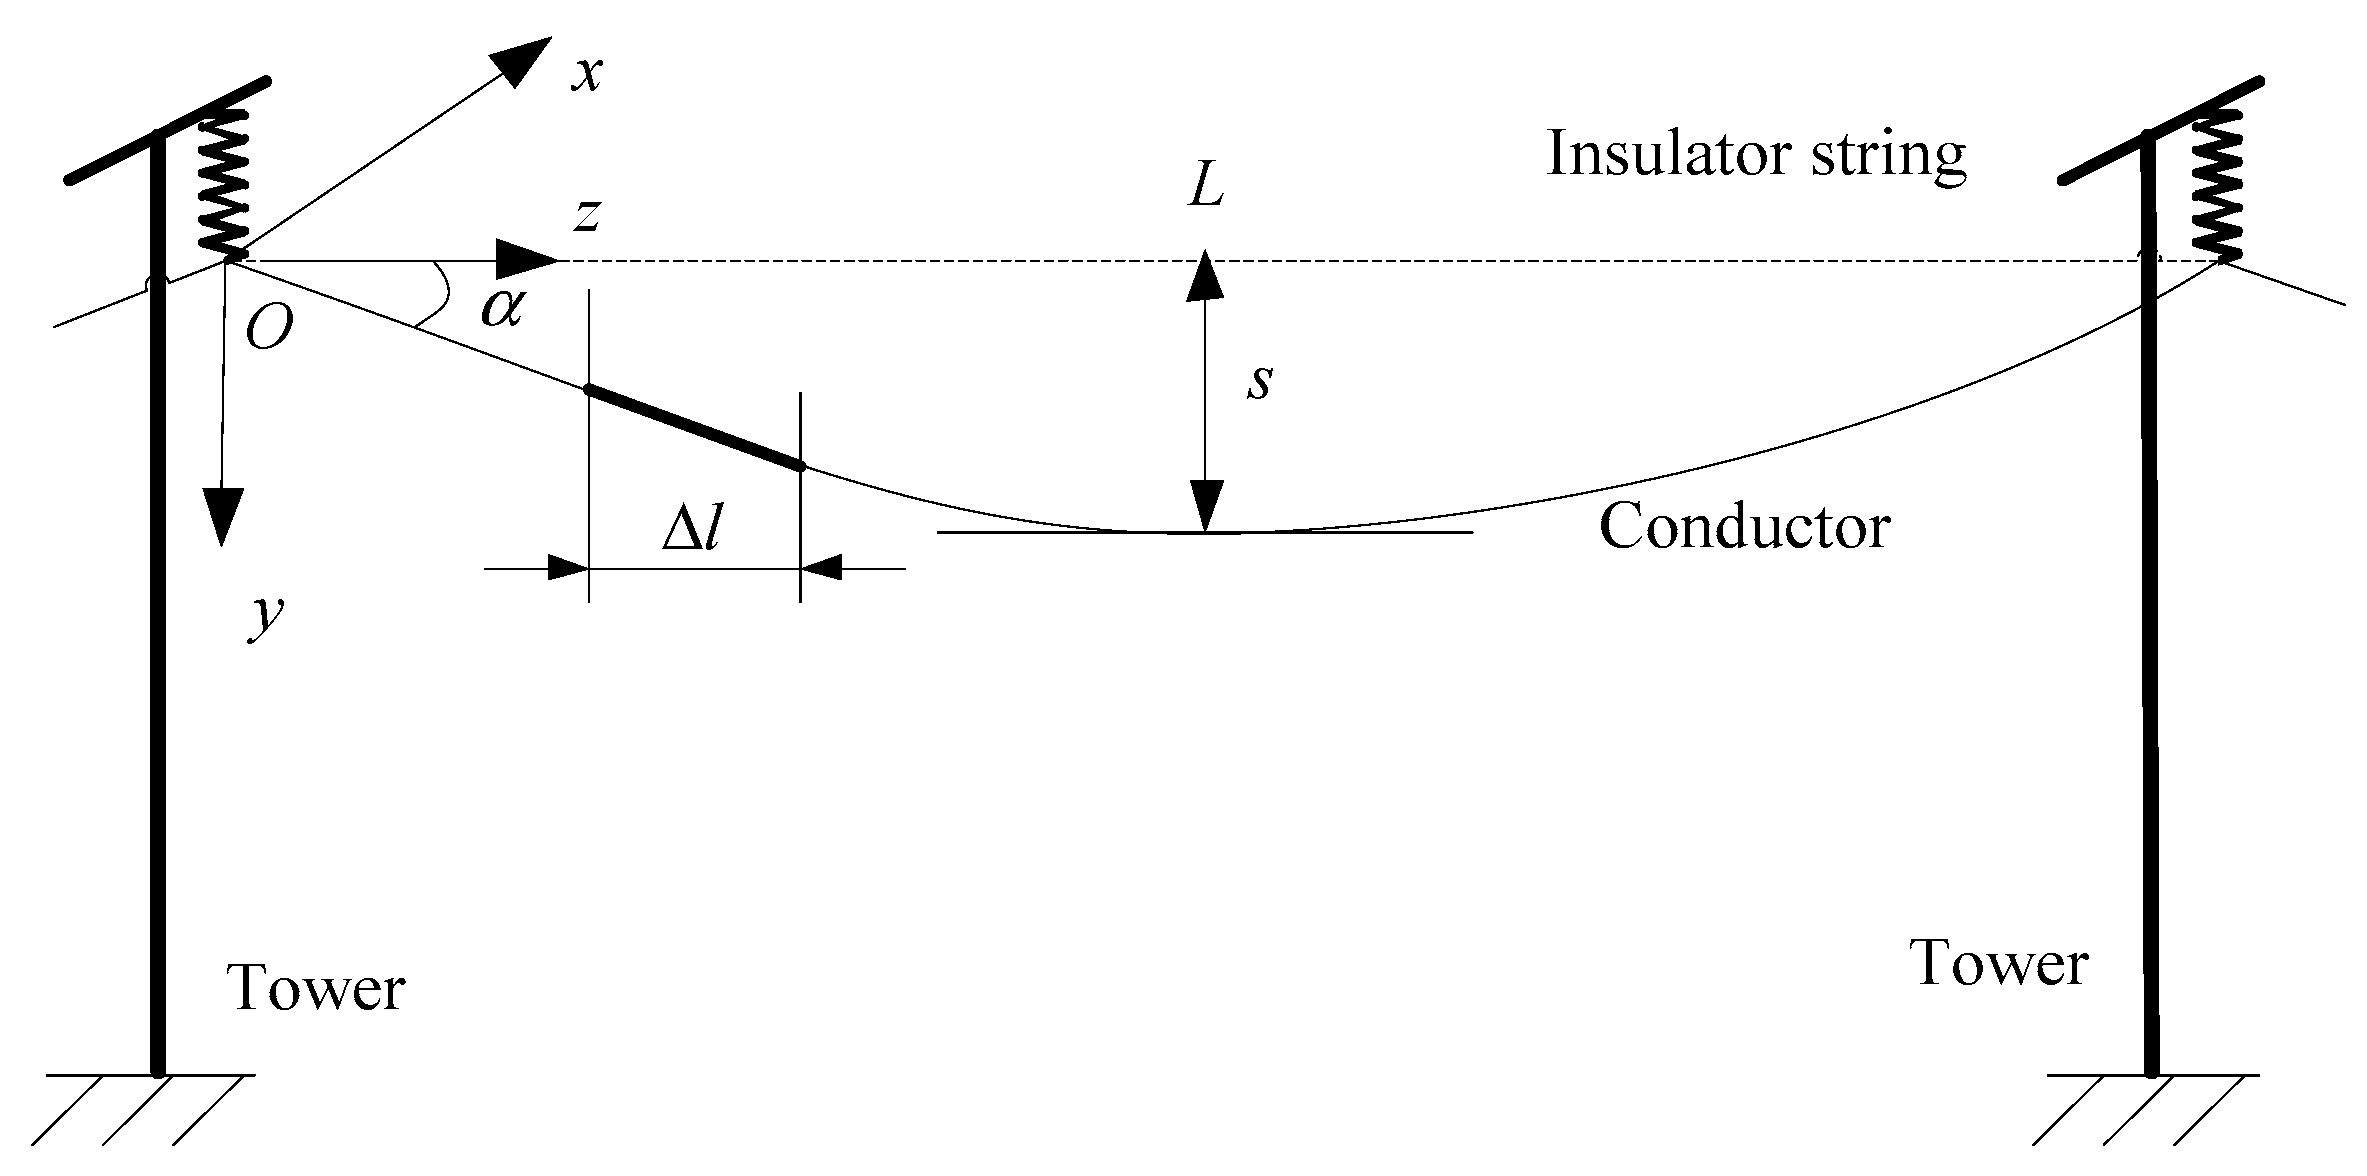
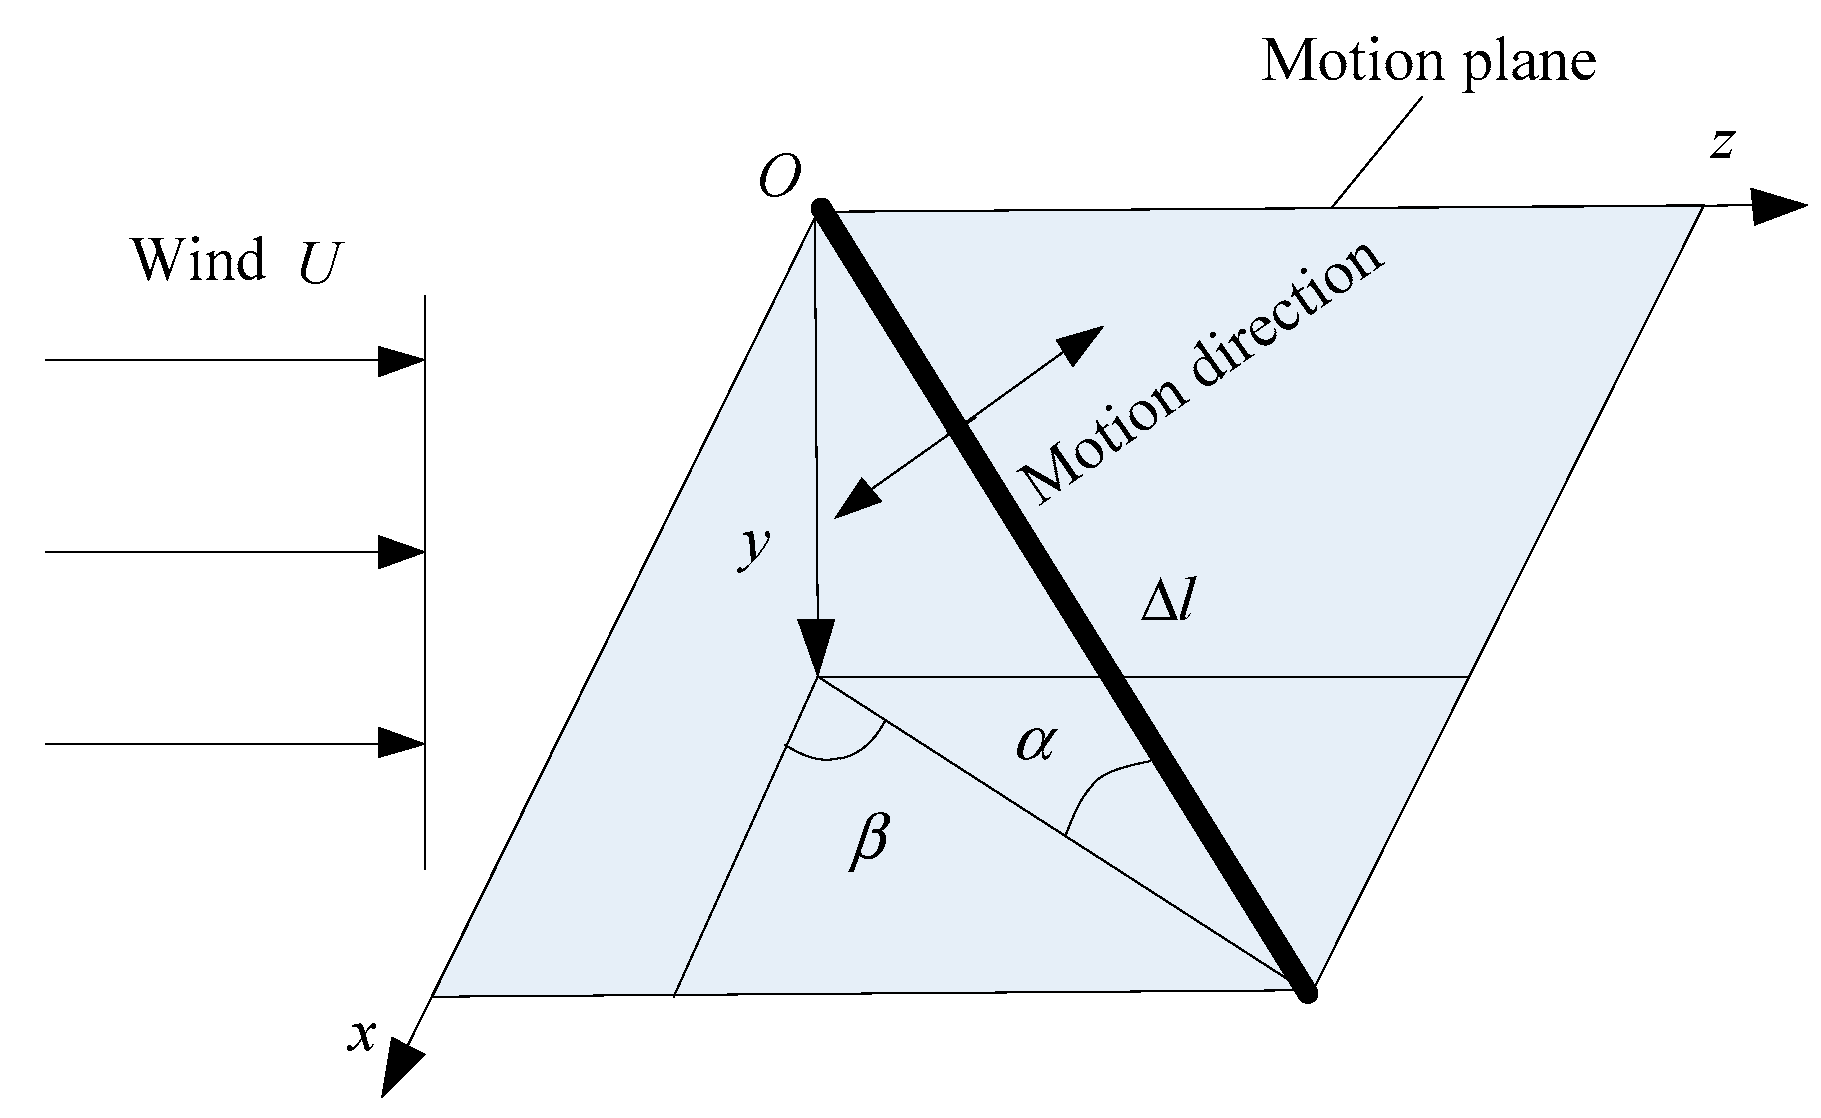
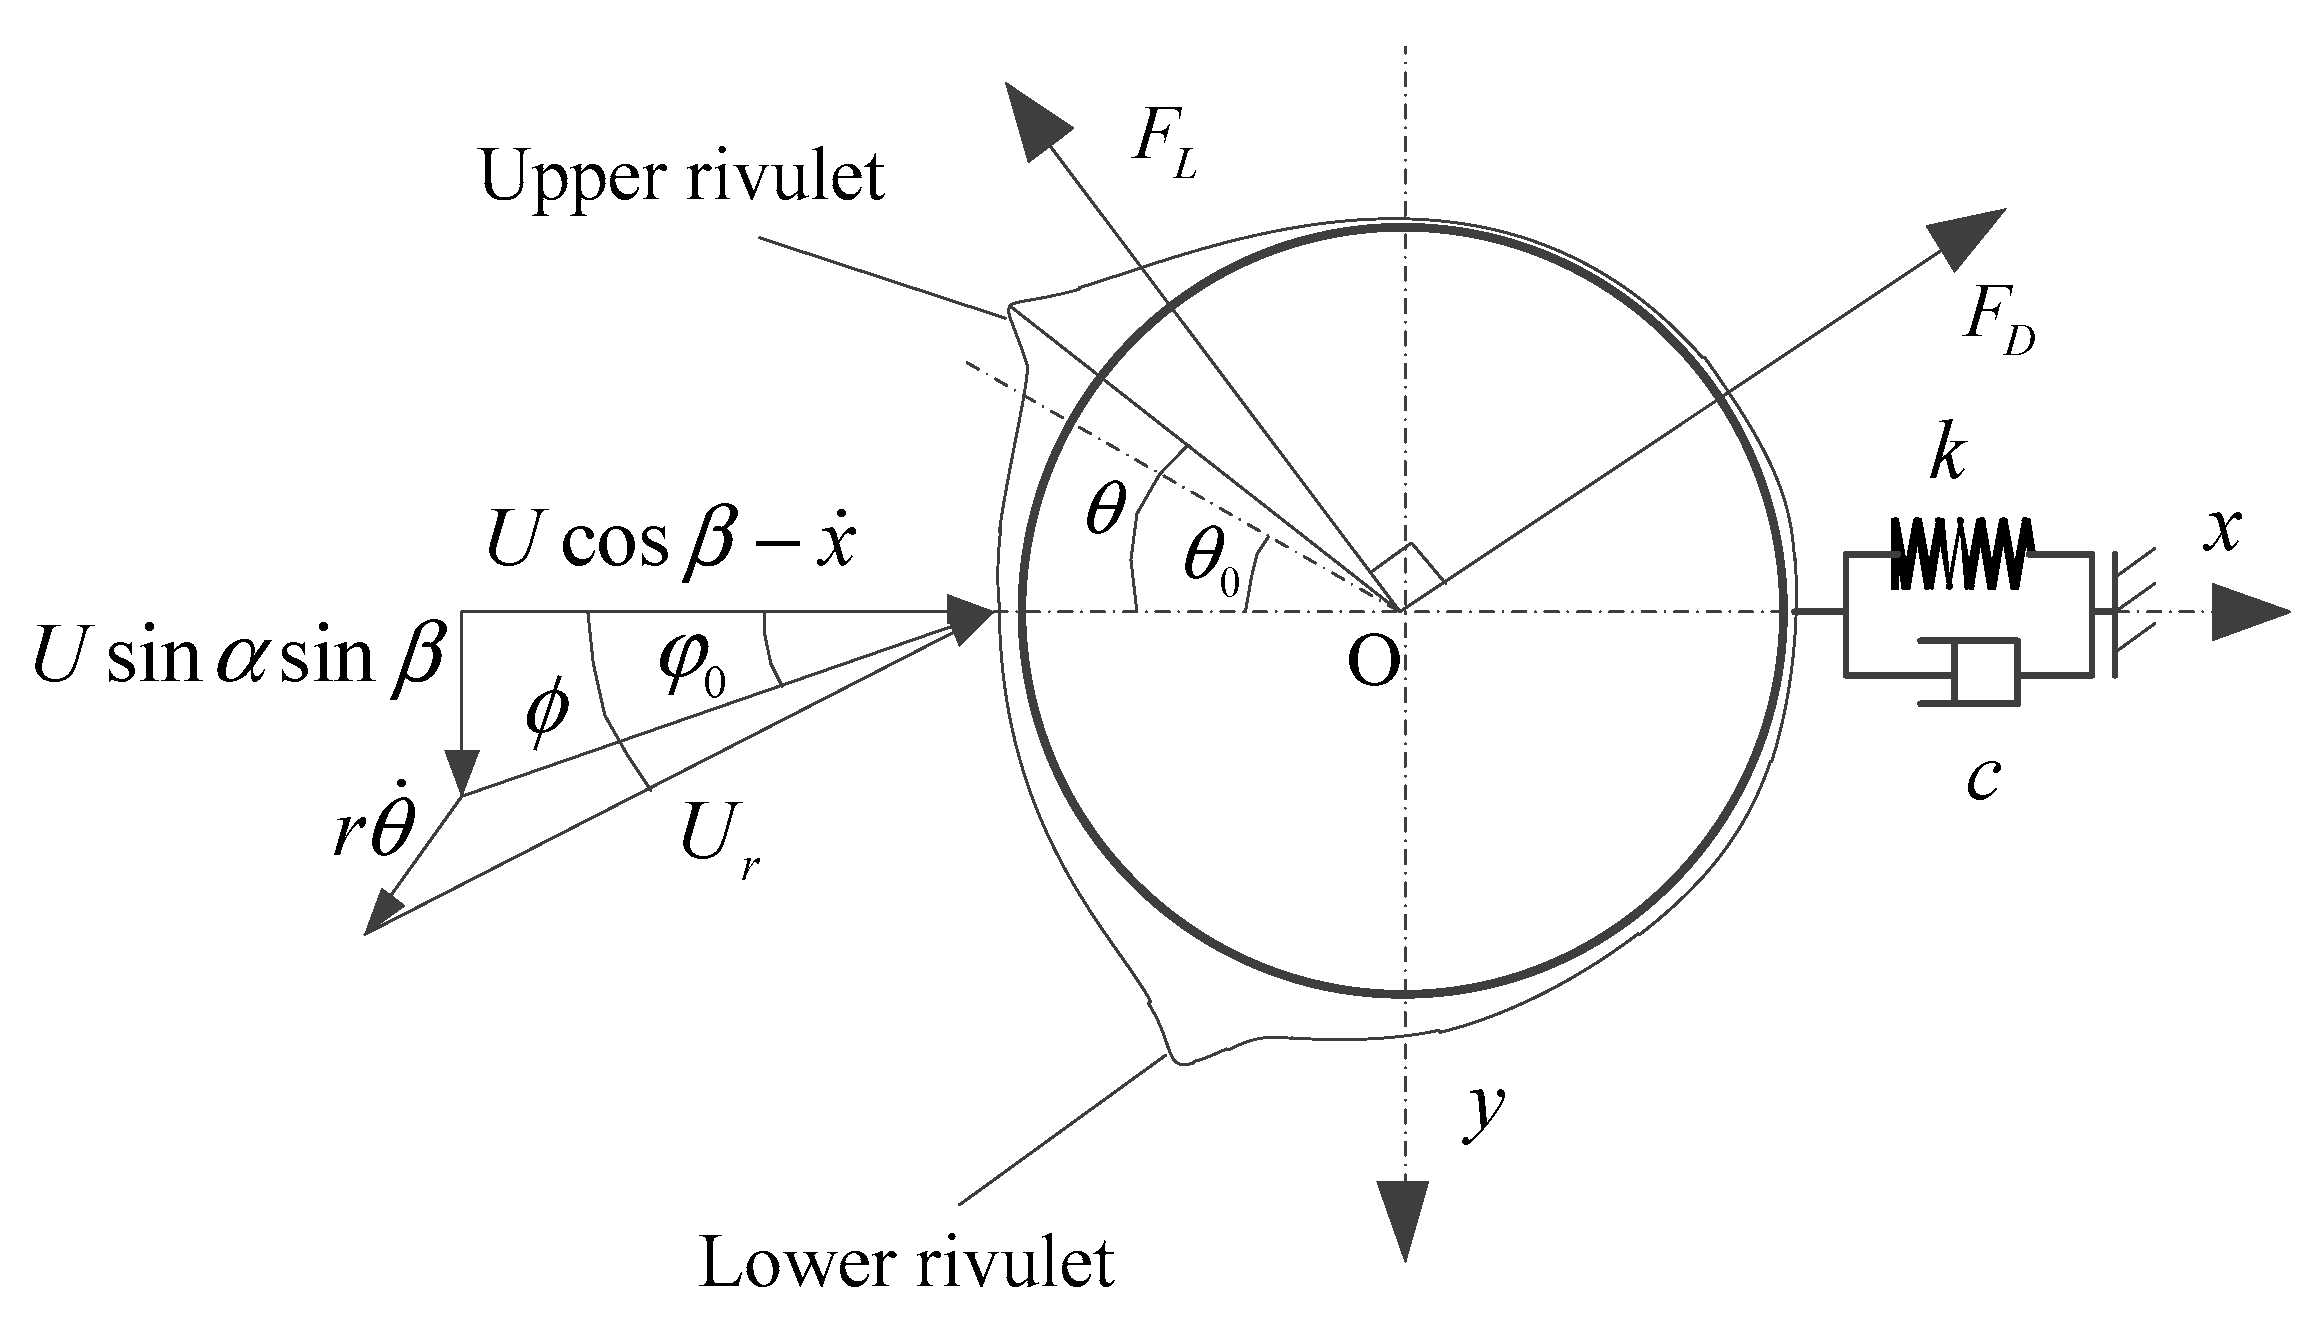
2. Analytical Model of Large Swing of Overhead Transmission Line Induced by Rain-Wind
- (1)
- The rainfall is sufficient to take the form of rivulets on the cylinder with wind. Quasi-steady assumption will be applied.
- (2)
- The lower rivulet is assumed to add little effect on the aerodynamic coefficients of the cylinder, thus, only the upper rivulet will be considered.
- (3)
- The cylinder and upper rivulet are distributed uniformly along the longitudinal axis. Axial vortexes and axial flow along the cylinder will not be taken into account.
- (4)
- Only the swing of the cylinder in along-wind direction will be discussed, whereas in-plane vibration of the cylinder normal to wind direction is not considered.
3. Criterion for the Unstable Swing of the Overhead Conductor
4. Experimental Test
5. Numerical Study
5.1. The Key Factors for the Unstable Swing of the Conductor with the Criteria
5.2. Numerical Calculation of Windage Yaw of the Overhead Conductor
6. Conclusions
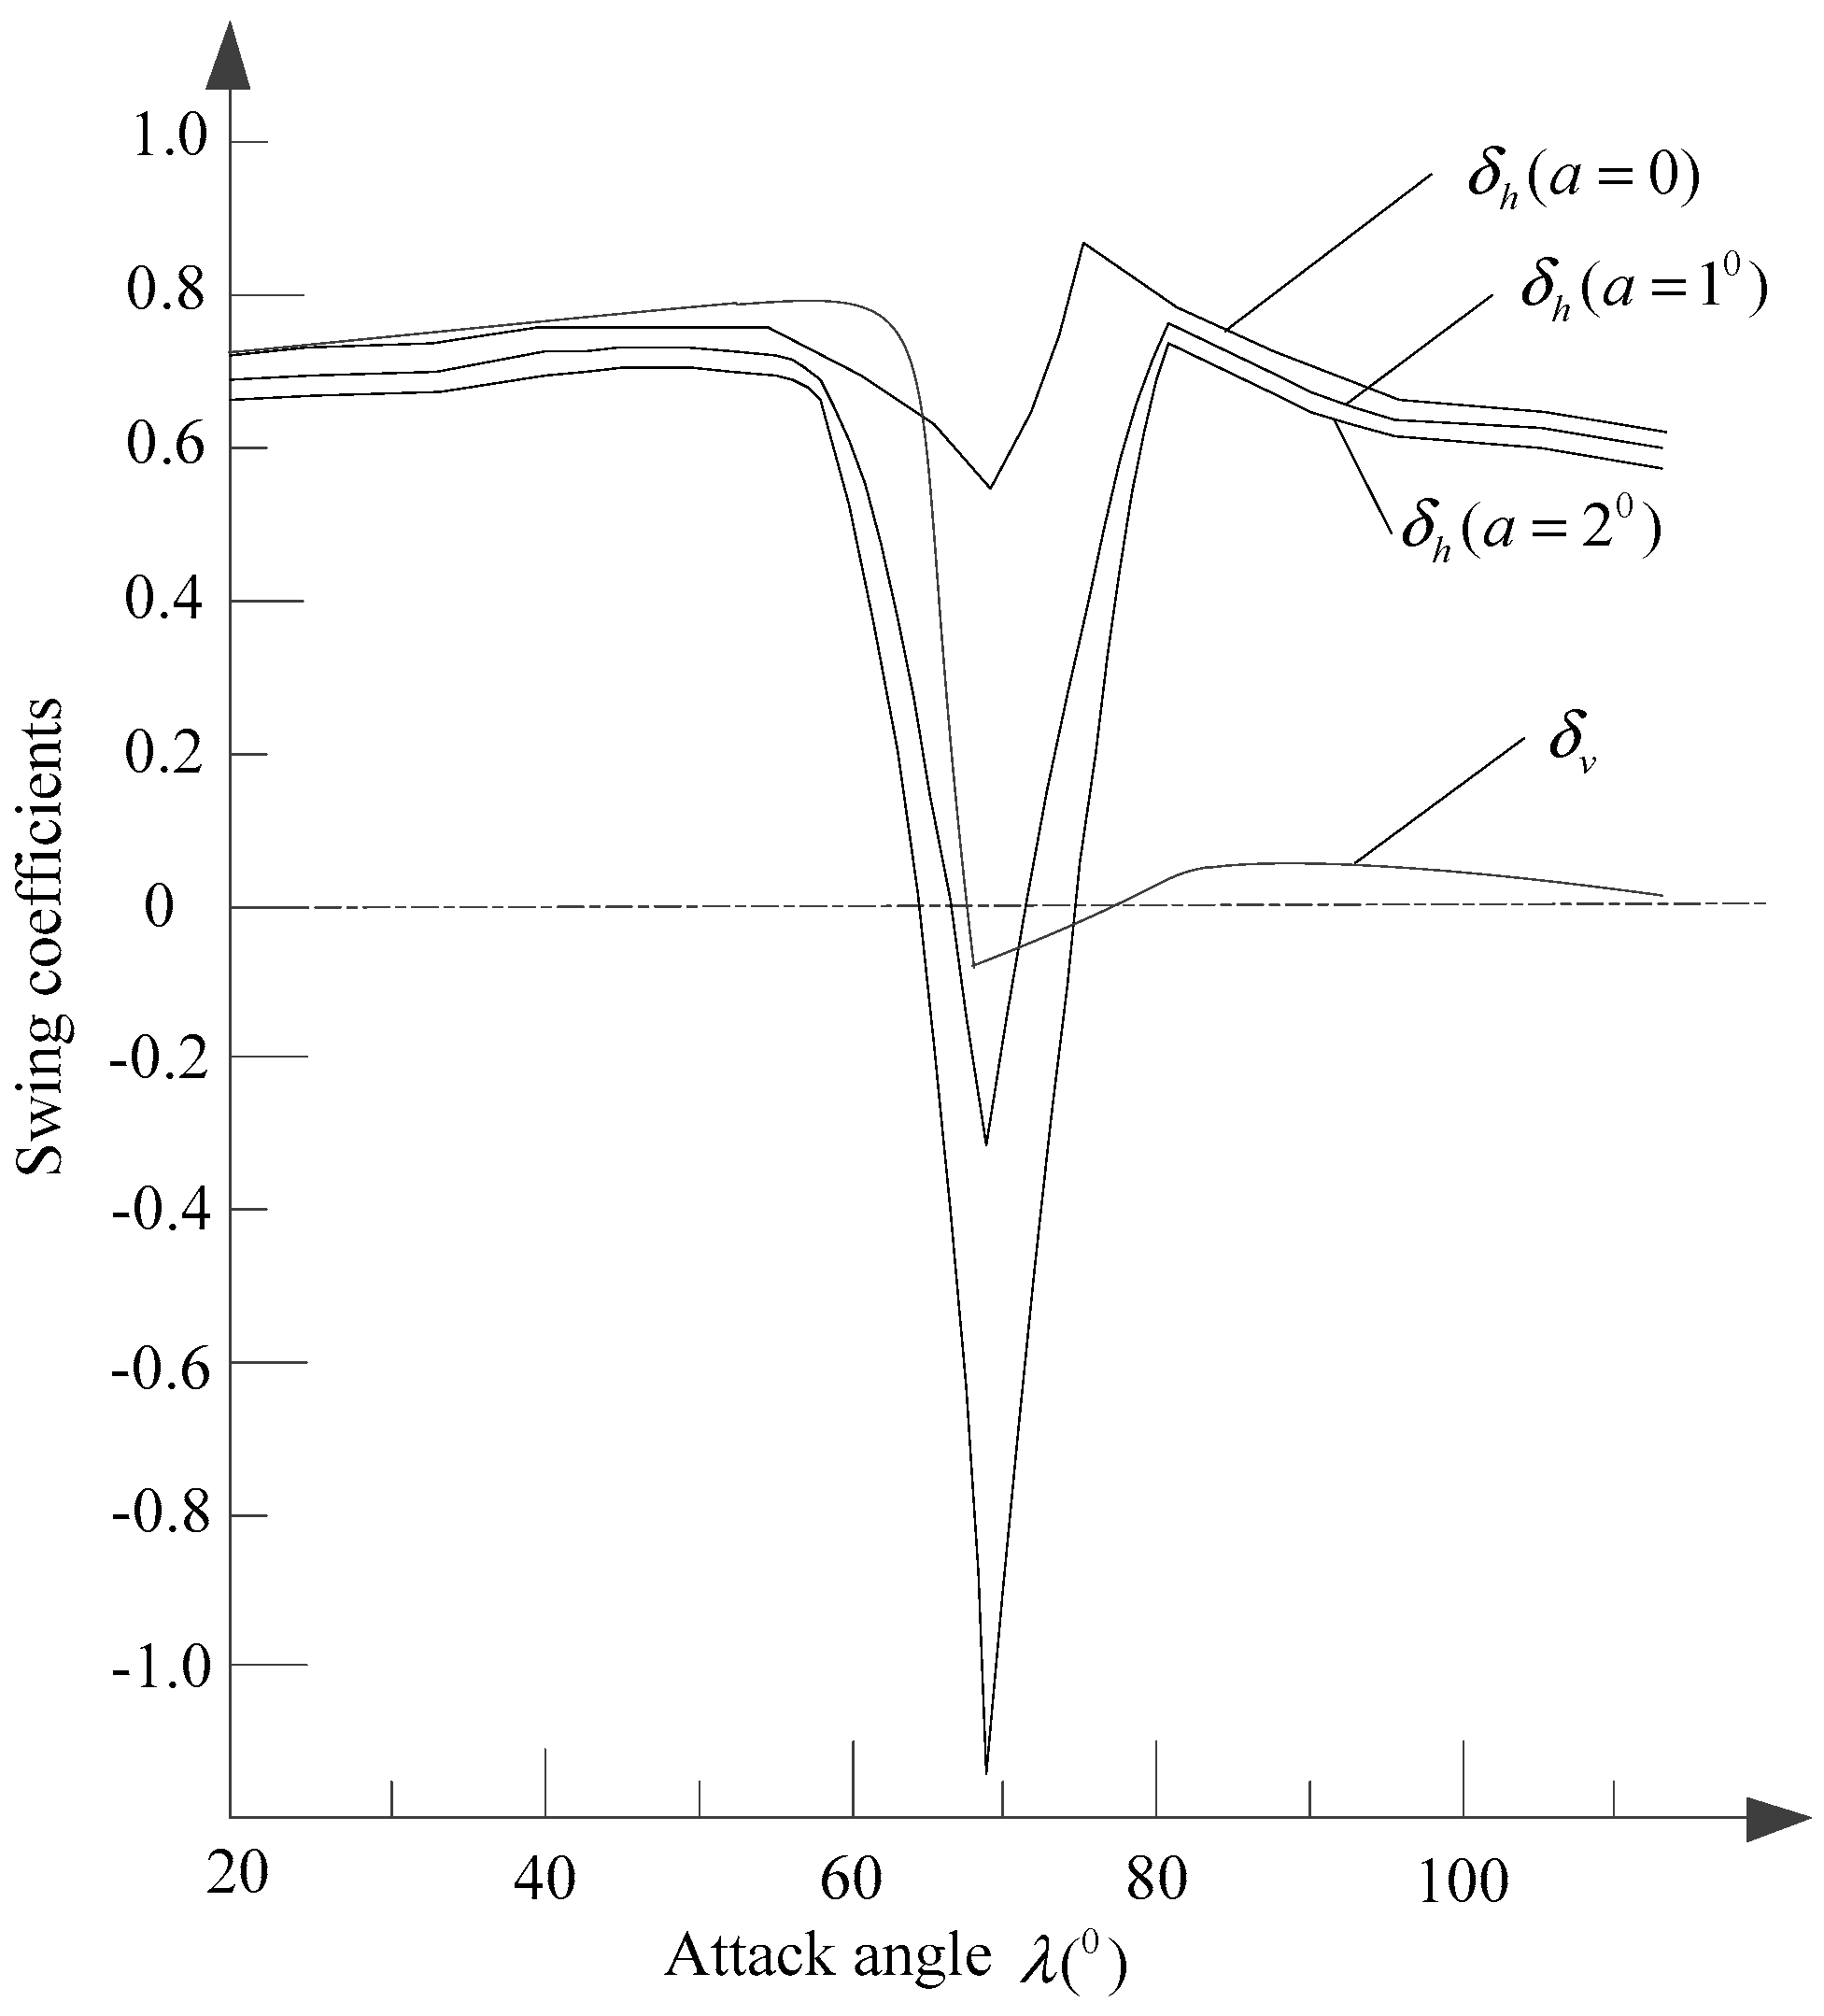
- (1)
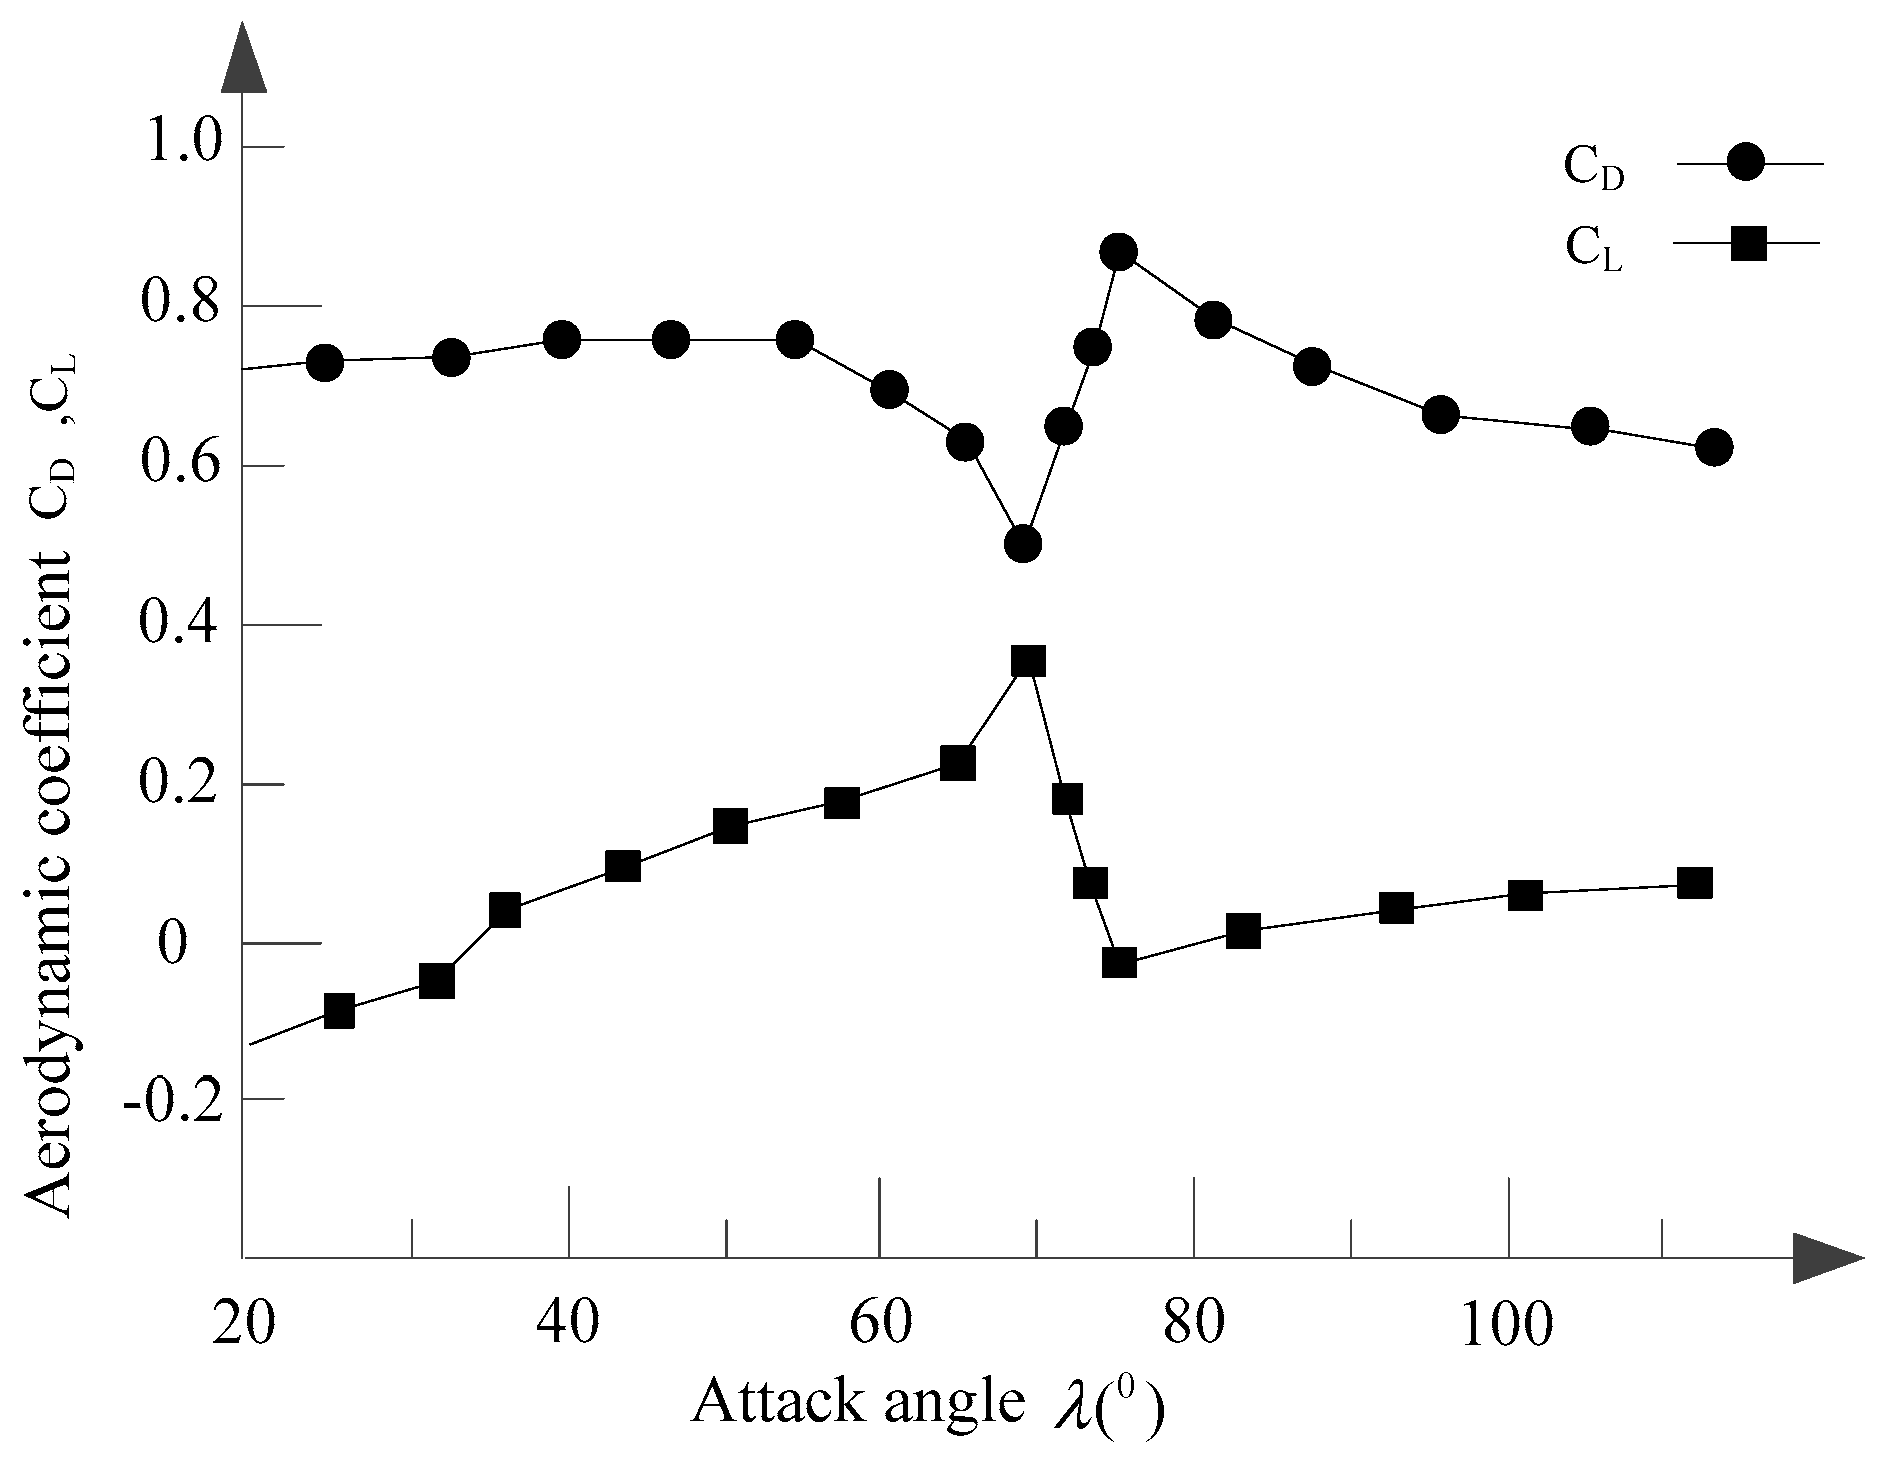
- At the critical angle of , the swing coefficients of get negative values. For fixed upper rivulet, the criterion of the cross-wind swings in wind flow normal to the overhead conductor axis is equivalent to Den Hartog theory. For moving upper rivulet, the unstable region of the swing of the overhead conductor changes with the fluctuation range of the upper rivulet.
- (2)
- When wind velocity is close to 10 m/s, due to the rain-wind vibration, the peak swing amplitude of the overhead conductor under rain-wind condition reaches 3.5 m, nearly 2.5 times that of the swing amplitude of the overhead conductor only subjected to wind.
- (3)
- When the wind velocity approaches 10 m/s, due to the rain-wind vibration, the clearance distance has a sudden drop, down to 1.92 m, which is very close to the clearance distance of flashover 1.83 m. If under strong fluctuation from wind velocity, the clearance distance can easily be less than the clearance distance of flashover. Moreover, at the range of 25 m/s, the clearance distance is 1.83 m, which is obviously larger than the minimum permissible clearance of 1.3 m (500 kV), recommended by the current design code for overhead transmission lines in China, and flashover may occur.
Author Contributions
Acknowledgments
Conflicts of Interest
References
- Hu, Y. Study on trip caused by windage yaw of 500 kV transmission line. High Volt. Eng. 2004, 30, 9–10. [Google Scholar]
- Long, L.H.; Hu, Y.; Li, J.L.; Hu, T. Study on windage yaw of transmission line. High Volt. Eng. 2006, 32, 19–21. [Google Scholar]
- Hardy, C.; Watts, J.A.; Brunelle, J.; Clutier, L.J. Research on the Dynamics of Bundled Conductors at the Hydro-Quebec Institute of Research; Canadian Electrical Association Transactions, Engineering and Operation Division: Ottawa, ON, Canada, 1975. [Google Scholar]
- Hardy, C.; Bourdon, P. The influence of spacer dynamic properties in the control of bundle conductor motion. IEEE Trans. Power Appar. Syst. 1980, 99, 790–799. [Google Scholar] [CrossRef]
- Tsujimoto, K.; Yoshioka, O.; Okumura, T.; Fujii, K.; Simojima, K.; Kubokawa, H. Investigation of conductor swinging by wind and its application for design of compact transmission line. IEEE Trans. Power Syst. 1982, 100, 4361–4369. [Google Scholar] [CrossRef]
- Clapp, A.L. Calculation of horizontal displacement of conductors under wind loading toward buildings and other supporting structures. In Proceedings of the 37th Annual Conference on Rural Electric Power Conference, Kansas City, MO, USA, 25–27 April 1993. [Google Scholar]
- Hu, Y.; Wang, L.N.; Shao, G.W.; Liu, K.; Luo, C.K.; Chen, S.J.; Geng, C.Y. Influence of rain and wind on power frequency discharge characteristic of conductor-to-tower air gap. High Volt. Eng. 2008, 34, 845–850. [Google Scholar]
- Jiang, X.L.; Xi, S.J.; Liu, W.; Yuan, Y.; Dong, Y.; Xiao, D.H. Influence of rain on AC discharge characteristics of rod-plane air gap. J. Chongqing Univ. 2012, 35, 52–58. [Google Scholar]
- Jiang, X.L.; Liu, W.; Xi, S.J.; Yuan, Y.; Bi, M.Q.; Sun, Y.H. Influence of rain on positive DC discharge characteristic of rod-plane short air gap. High Volt. Eng. 2011, 37, 261–266. [Google Scholar]
- Yan, B.; Lin, X.S.; Luo, W.; Chen, Z.D.; Liu, Z.Q. Numerical study on dynamic swing of suspension insulator string in overhead transmission line under wind load. IEEE Trans. Power Deliv. 2010, 25, 248–259. [Google Scholar] [CrossRef]
- Xiong, X.F.; Weng, S.J.; Wang, J.; Li, Z.; Liang, Y. An online early warning method for windage yaw discharge of jumper towards “JG” type strain tower considering corrected by rainfall. Power Syst. Protect. Control 2015, 43, 136–143. [Google Scholar]
- Mazur, K.; Wydra, M.; Ksiezopolski, B. Secure and time-aware communication of wireless sensors monitoring overhead transmission lines. Sensors 2017, 17, 1610. [Google Scholar] [CrossRef] [PubMed]
- Wydra, M.; Kisala, P.; Harasim, D.; Kacejko, P. Overhead transmission line sag estimation using a simple optomechanical system with chirped fiber bragg gratings. Part 1: Preliminary measurements. Sensors 2018, 18, 309. [Google Scholar] [CrossRef] [PubMed]
- Geng, C.Y.; Wei, D.; He, X. Rain effect on frequency breakdown voltage. High Volt. Appar. 2010, 46, 103–105. [Google Scholar]
- Zhu, K.J.; Li, X.M.; Di, Y.X.; Liu, B. Asynchronous swaying character and prevention measures in the compact overhead transmission line. High Volt. Appar. 2010, 36, 2717–2723. [Google Scholar]
- Zhu, K.J.; Di, Y.X.; Li, X.M.; Fu, D.J. Numerical simulation for asynchronous swaying of overhead transmission line. Power Syst. Technol. 2009, 33, 202–206. [Google Scholar]
- Zhang, H.J.; Zhao, J.F.; Cai, D.Z.; Niu, H.W. Wind tunnel test on the influence of col features on wind speed distribution. J. Exp. Fluid Mech. 2014, 28, 25–30. [Google Scholar]
- Holmes, J.D. Along-wind response of lattice tower-II, aerodynamic damping and deflections. Eng. Struct. 1996, 18, 483–488. [Google Scholar] [CrossRef]
- Lou, W.J.; Yang, Y.; Lu, Z.B.; Zhang, S.F.; Yang, L. Windage yaw dynamic analysis methods for transmission lines considering aerodynamic damping effect. J. Vib. Shock 2015, 34, 24–29. [Google Scholar]
- Stengel, D.; Mehdianpour, M. Finite element modeling of electrical overhead line cables under turbulent wind load. J. Struct. 2014, 2014. [Google Scholar] [CrossRef]
- Zhou, C.; Liu, Y.B.; Ma, Z.Y. Investigation on aerodynamic instability of high-voltage transmission lines under rain-wind condition. J. Mech. Sci. Technol. 2015, 29, 131–139. [Google Scholar] [CrossRef]
- Simiu, E.; Scanlan, R.H. Wind Effects on Structures; Wiley: New York, NY, USA, 1996. [Google Scholar]
- Marshall, J.S.; Palmer, W.M.K. The distribution of raindrops with size. J. Atmos. Sci. 1948, 5, 165–166. [Google Scholar] [CrossRef]
- Hikami, Y.; Shiraishi, N. Rain-wind induced vibrations of cables in cable stayed bridges. J. Wind Eng. Ind. Aerodyn. 1988, 29, 409–418. [Google Scholar] [CrossRef]
- den Hartog, J.P. Transmission line vibration due to sleet. Trans. Am. Inst. Electr. Eng. 1932, 51, 1074–1077. [Google Scholar] [CrossRef]
- Roshan, F.M.; McClure, G. Numerical modeling of the dynamic response of ice-shedding on electric transmission lines. Atmos. Res. 1998, 46, 1–11. [Google Scholar] [CrossRef]
- Northeast Electric Power Design Institute of National Electric Power Corporation. Design manual of High Voltage Transmission Lines for Electric Engineering; China Electric Power Press: Beijing, China, 2003. [Google Scholar]
- Geng, C.Y.; Chen, S.J.; Liu, S.Y. Experimental study of the raining effect on frequency breakdown voltage of air-gap. High Volt. Appar. 2009, 45, 36–39. [Google Scholar]


| Rainfall Levels | Rainfall Intensity (mm) | |||
|---|---|---|---|---|
| 24 h | 12 h | 6 h | 1 min | |
| Heavy | 25.0–49.9 | 15.0–29.9 | 6.0–11.9 | 1.00–2.67 |
| Rainstorm | 50.0–99.9 | 30.0–69.9 | 12.0–24.9 | 2.68–4.24 |
| Heavy Rainstorm | 100.0–249.9 | 70.0–139.9 | 25.0–59.9 | 4.25–6.25 |
| Super Rainstorm | ≥250.0 | ≥140.0 | ≥60.0 | ≥6.26 |
| Range | D0 | D1 | D2 | D3 | L0 | L1 | L2 | L3 |
|---|---|---|---|---|---|---|---|---|
| 69° | 1.1 | −0.037 | 0.00055 | −0.000005 | −0.281 | 0.0044 | 0.0001 | 0.0000003 |
| 69° | −32.46 | 1.109 | −0.006 | 0.000006 | 22.082 | −0.722 | 0.0039 | −0.000005 |
| Nominal Voltage (kV) | Rainfall Intensity (mm/min) | ||||
|---|---|---|---|---|---|
| 0 | 2.4 | 4.8 | 9.6 | 14.4 | |
| 110 | 0.25 | 0.263 | 0.282 | 0.302 | 0.311 |
| 220 | 0.55 | 0.640 | 0.669 | 0.697 | 0.711 |
| 330 | 0.90 | 1.076 | 1.110 | 1.138 | 1.153 |
| 500 | 1.20 | 1.833 | 1.863 | 1.880 | 1.891 |
© 2018 by the authors. Licensee MDPI, Basel, Switzerland. This article is an open access article distributed under the terms and conditions of the Creative Commons Attribution (CC BY) license (http://creativecommons.org/licenses/by/4.0/).
Share and Cite
Zhou, C.; Yin, J.; Liu, Y. Large Swing Behavior of Overhead Transmission Lines under Rain-Load Conditions. Energies 2018, 11, 1092. https://doi.org/10.3390/en11051092
Zhou C, Yin J, Liu Y. Large Swing Behavior of Overhead Transmission Lines under Rain-Load Conditions. Energies. 2018; 11(5):1092. https://doi.org/10.3390/en11051092
Chicago/Turabian StyleZhou, Chao, Jiaqi Yin, and Yibing Liu. 2018. "Large Swing Behavior of Overhead Transmission Lines under Rain-Load Conditions" Energies 11, no. 5: 1092. https://doi.org/10.3390/en11051092
APA StyleZhou, C., Yin, J., & Liu, Y. (2018). Large Swing Behavior of Overhead Transmission Lines under Rain-Load Conditions. Energies, 11(5), 1092. https://doi.org/10.3390/en11051092