Article

Study on the Progressive Failure Characteristics of Coal in Uniaxial and Triaxial Compression Conditions Using 3D-Digital Image Correlation

1
State Key Laboratory of Coal Mine Disaster Dynamics and Control, Chongqing University, Chongqing 400044, China
2
State and Local Joint Engineering Laboratory of Methane Drainage in Complex Coal Gas Seam, Chongqing University, Chongqing 400044, China
*
Author to whom correspondence should be addressed.
Energies 2018, 11(5), 1215; https://doi.org/10.3390/en11051215
Submission received: 21 April 2018 / Revised: 1 May 2018 / Accepted: 2 May 2018 / Published: 10 May 2018
(This article belongs to the Section L: Energy Sources)

Abstract

:
To investigate the progressive failure process of coal, a series of uniaxial and triaxial compression tests were conducted and a novel 3D digital image correlation instrument with six cameras combined with a special transparent pressure cell was used for the strain measurement. The stress thresholds of coal were obtained in uniaxial and triaxial compression. The energy evolution during the compression was discussed, coupled with the crack volumetric strain. The field strain of the whole specimen surface and crack propagation at different stress levels were described to study the progressive failure mechanism of coal. The average stress level of crack initiation and crack damage of coal in uniaxial compression are 43.75% and 63.03%, while that in the triaxial compression are 74.53% and 89.84%, respectively. The dissipation energy evolution corresponds to the crack volumetric strain, while the elastic energy release leads to flake ejection and coal failure. The crack evolution and localization of coal indicated the progressive failure process that the coal sample undergoes in tension failure in uniaxial compression and in tension-shear failure in triaxial compression. The findings of this study can serve as a reference to understand the failure process of coal and improve the stability and safety of mining engineering.

1. Introduction

With the continuous development of deep-coal resources and the construction of deep mines, the deformations of coalfaces and pillars have become increasingly complicated. As a special rock, having more than 90% organic matter content, coal contains various primary cracks and defects. The mechanical characteristics of the progressive failure behavior of coal, especially under confined pressures, are essential factors in the investigation of the stability of mining systems in mining engineering. Furthermore, they are vital factors for the efficient design of coal mines, disaster prevention, and environmental preservation.
During compression, the progressive failure of brittle rocks can be divided into five stages based on the stress thresholds of crack closure, crack initiation, crack damage, and peak stress [1,2]. These stress thresholds are essential and useful parameters for engineering projects. For example, the crack initiation stress can be used to estimate the lower limit value of spalling rock mass strength [3,4]. Some brittleness indices have strong correlations with the crack damage stress and peak stress [5]. Moreover, the lower and upper limits of long-term strength can be obtained from the crack initiation stress and crack damage stress [6]. Accordingly, the progressive failure characteristics and crack propagation in rocks have been studied by many researchers in detail [7,8,9]. However, investigations on progressive failure and stress thresholds of coal are scarce, especially in triaxial compression.
New experimental methods for measuring the progressive failure and crack propagation of rock mainly include X-ray computed tomography (CT) developed by Hounsfield [10] and digital image correlation (DIC) proposed by a group at the University of South Carolina [11,12,13,14]. Although CT can be used to observe the internal cracks during rock failure, CTs are larger and more expensive than a DIC instrument. DIC has been employed in experimental studies on rock materials but is mostly used in unconfined [15,16,17], Brazilian split [18,19] tests with the two-dimensional DIC method. Owing to the limitation of the pressure cell of the loading apparatus, which is usually made of metal, DIC is less favored in the triaxial compression testing of rock or coal. While the fractured rocks are observed after testing, the failure process and crack evolution mechanism only can be conjectured. Thus, it is necessary to apply DIC in triaxial compression to fully understand the failure mechanism and crack evolution under confining pressures.
A novel 3D-DIC instrument with six cameras combined with a special transparent pressure cell was used to carry out the triaxial compression tests of coal, which, to the best of our knowledge, is used for the first time in the triaxial compression tests of rocks. Uniaxial compression tests were also conducted. The progressive failure characteristics and stress thresholds were analyzed and the full-field strain patterns and crack propagation on the whole surface of coal were obtained in uniaxial and triaxial compression. Furthermore, the energy evolution, which is closely related to coal damage [20], was analyzed. The results make significant contributions toward understanding the coal failure mechanism and helping engineers understand the deformation behavior of coal in situ.

2. Materials and Methods

2.1. Specimens and Test Method

The material used in the sample test was coal obtained from the Zhulinshan coalmine in the Shanxi province of China. Proximate analyses [21] were conducted and the results are presented in Table 1.
The coal had a uniaxial compressive strength of 35.45 MPa, a Young’s modulus of 5.24 GPa, a Poisson’s ratio of 0.27, and a density of 1.59 g/cm3. The test specimens were obtained from a block and cut into 25-mm-diameter cylinders measuring 50 mm in height. The specimen surfaces were subsequently ground to meet the flatness, verticality, and parallelism standards prescribed by the International Society for Rock Mechanics (ISRM). Three-dimensional DIC measurements were performed based on random speckle patterns developed on the specimen surface. Generally, speckle patterns were formed using a black and white spray lacquer, which adheres to the specimen surface and deforms in-line with the specimen [5]. For accurate measurements, the speckle patterns must be irregular, randomly distributed, and possess high contrast. The specimens were subjected to a constant strain rate of 10−4/s, with a confining pressure of 0 MPa in uniaxial compression and a 9 MPa in triaxial compression. The images were continuously recorded during the test at 1 fps; in addition, the collection frequency of stress was 1 Hz.

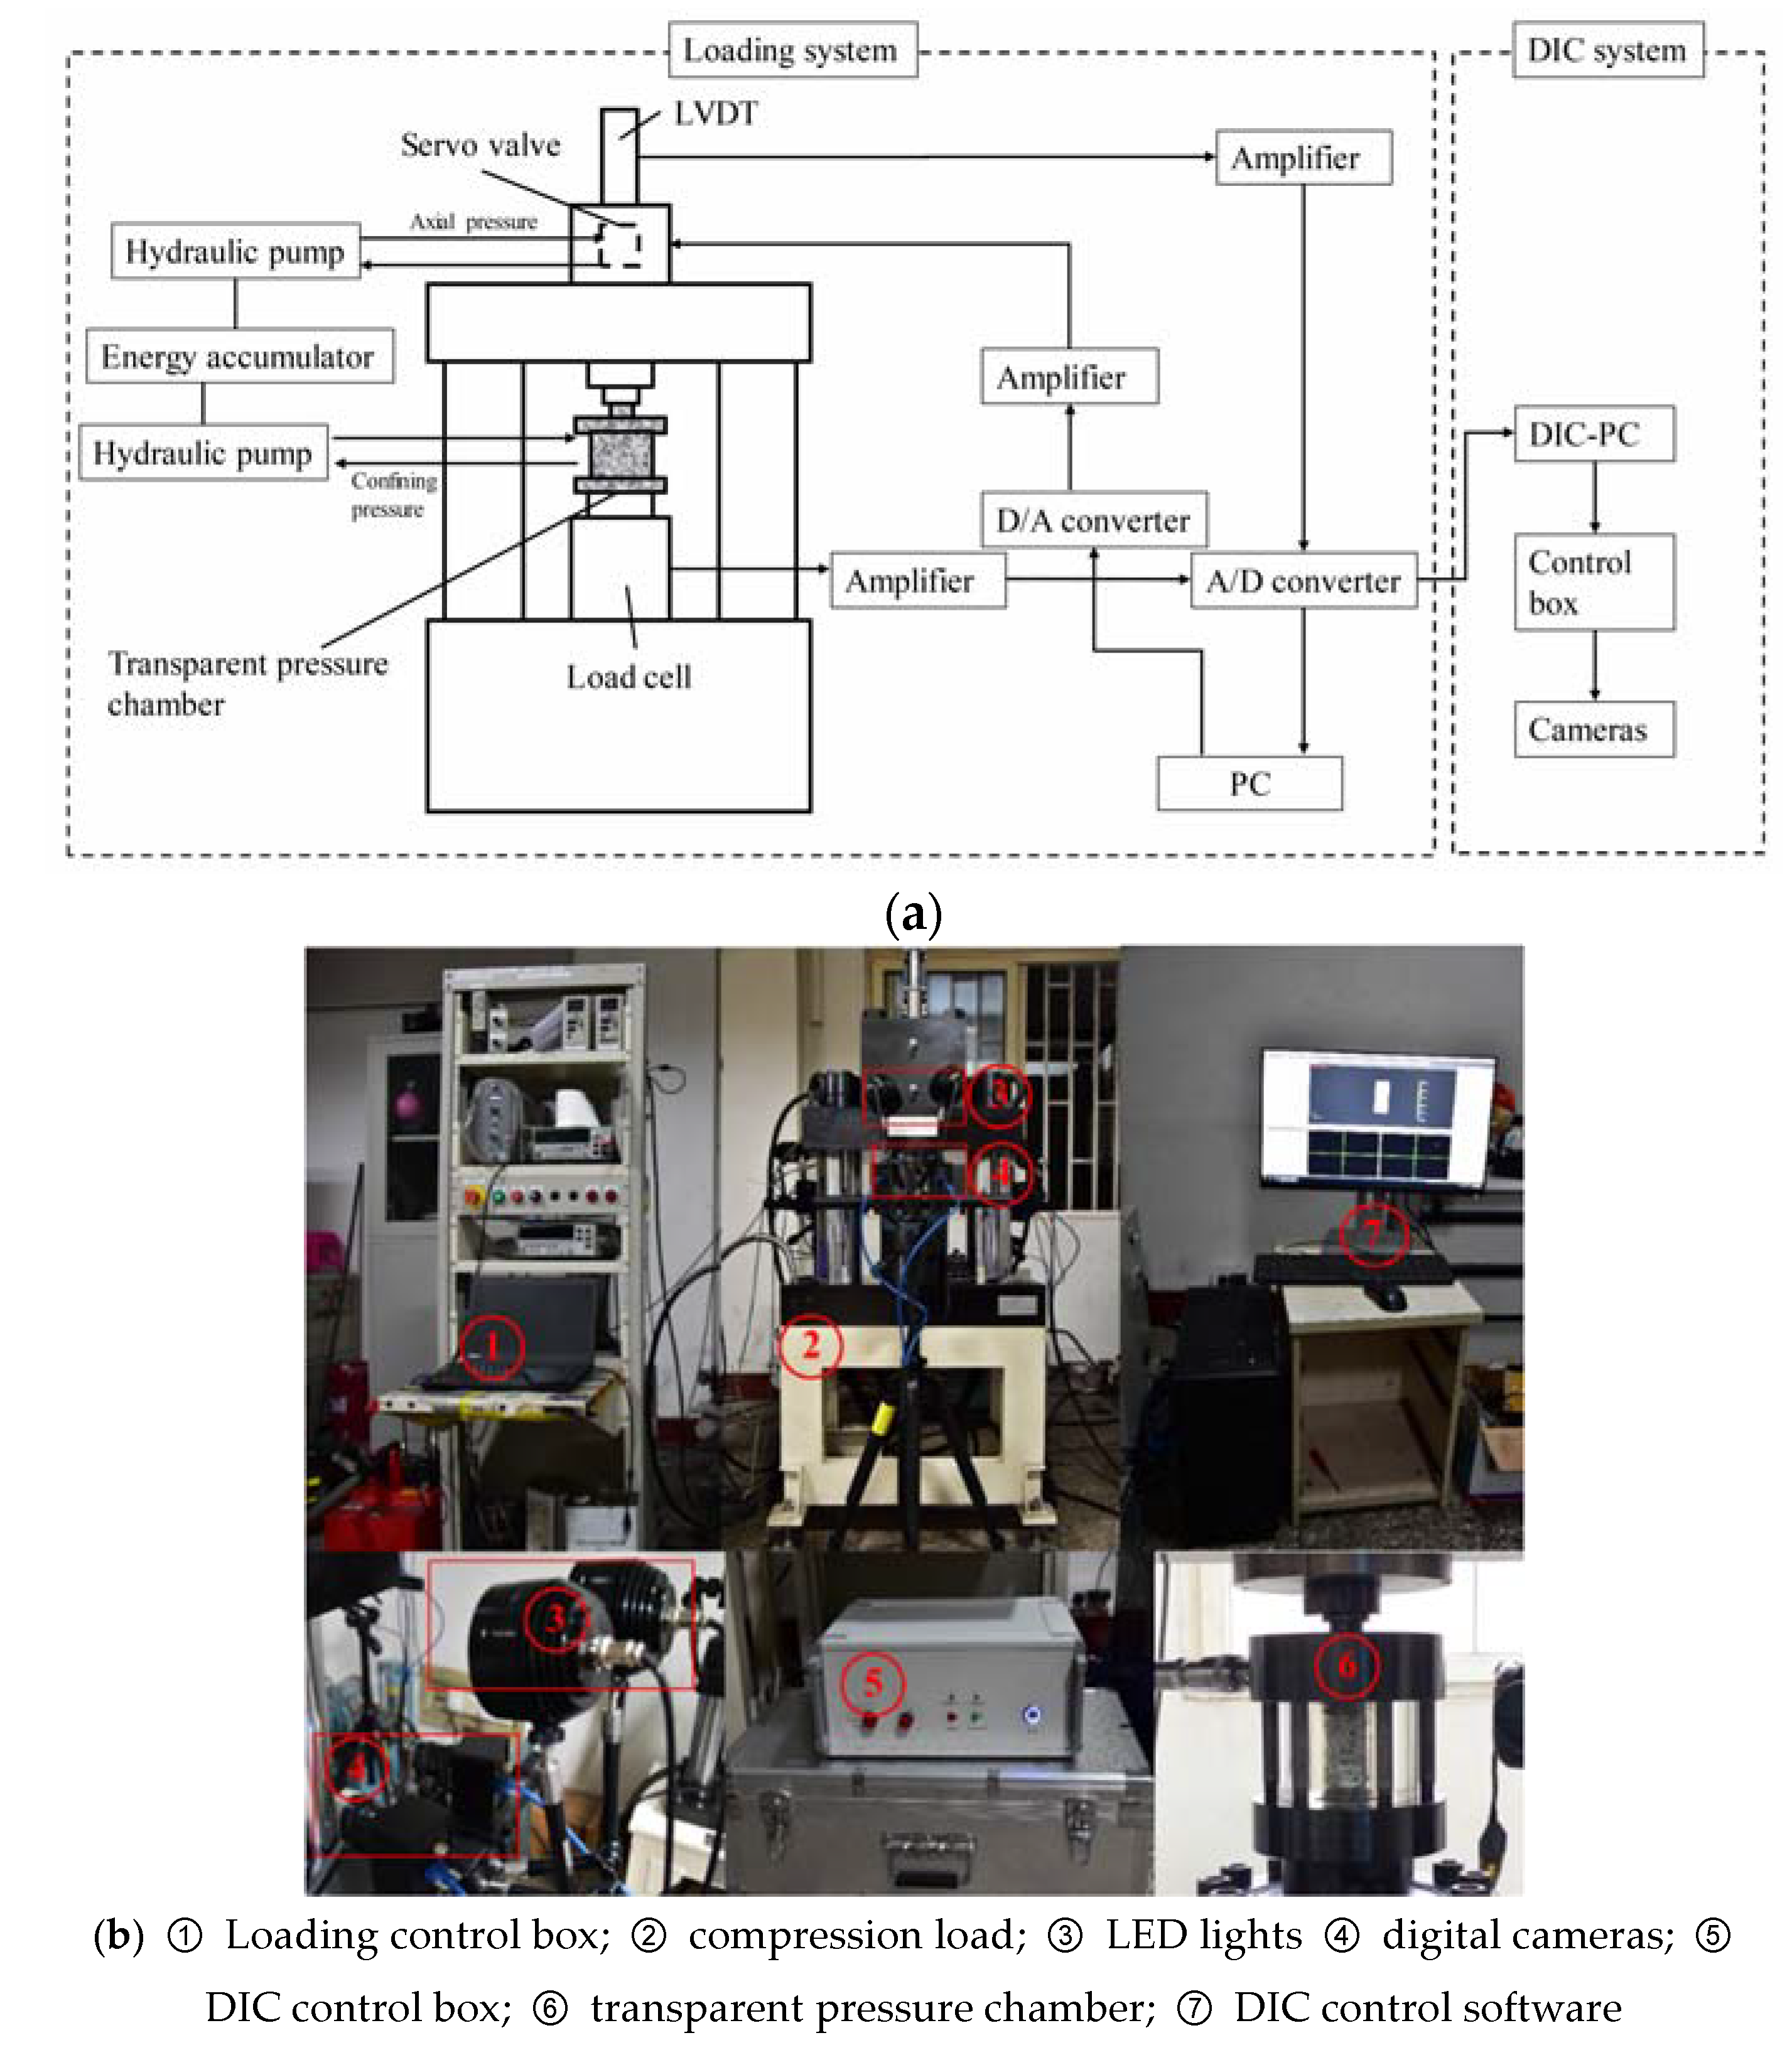
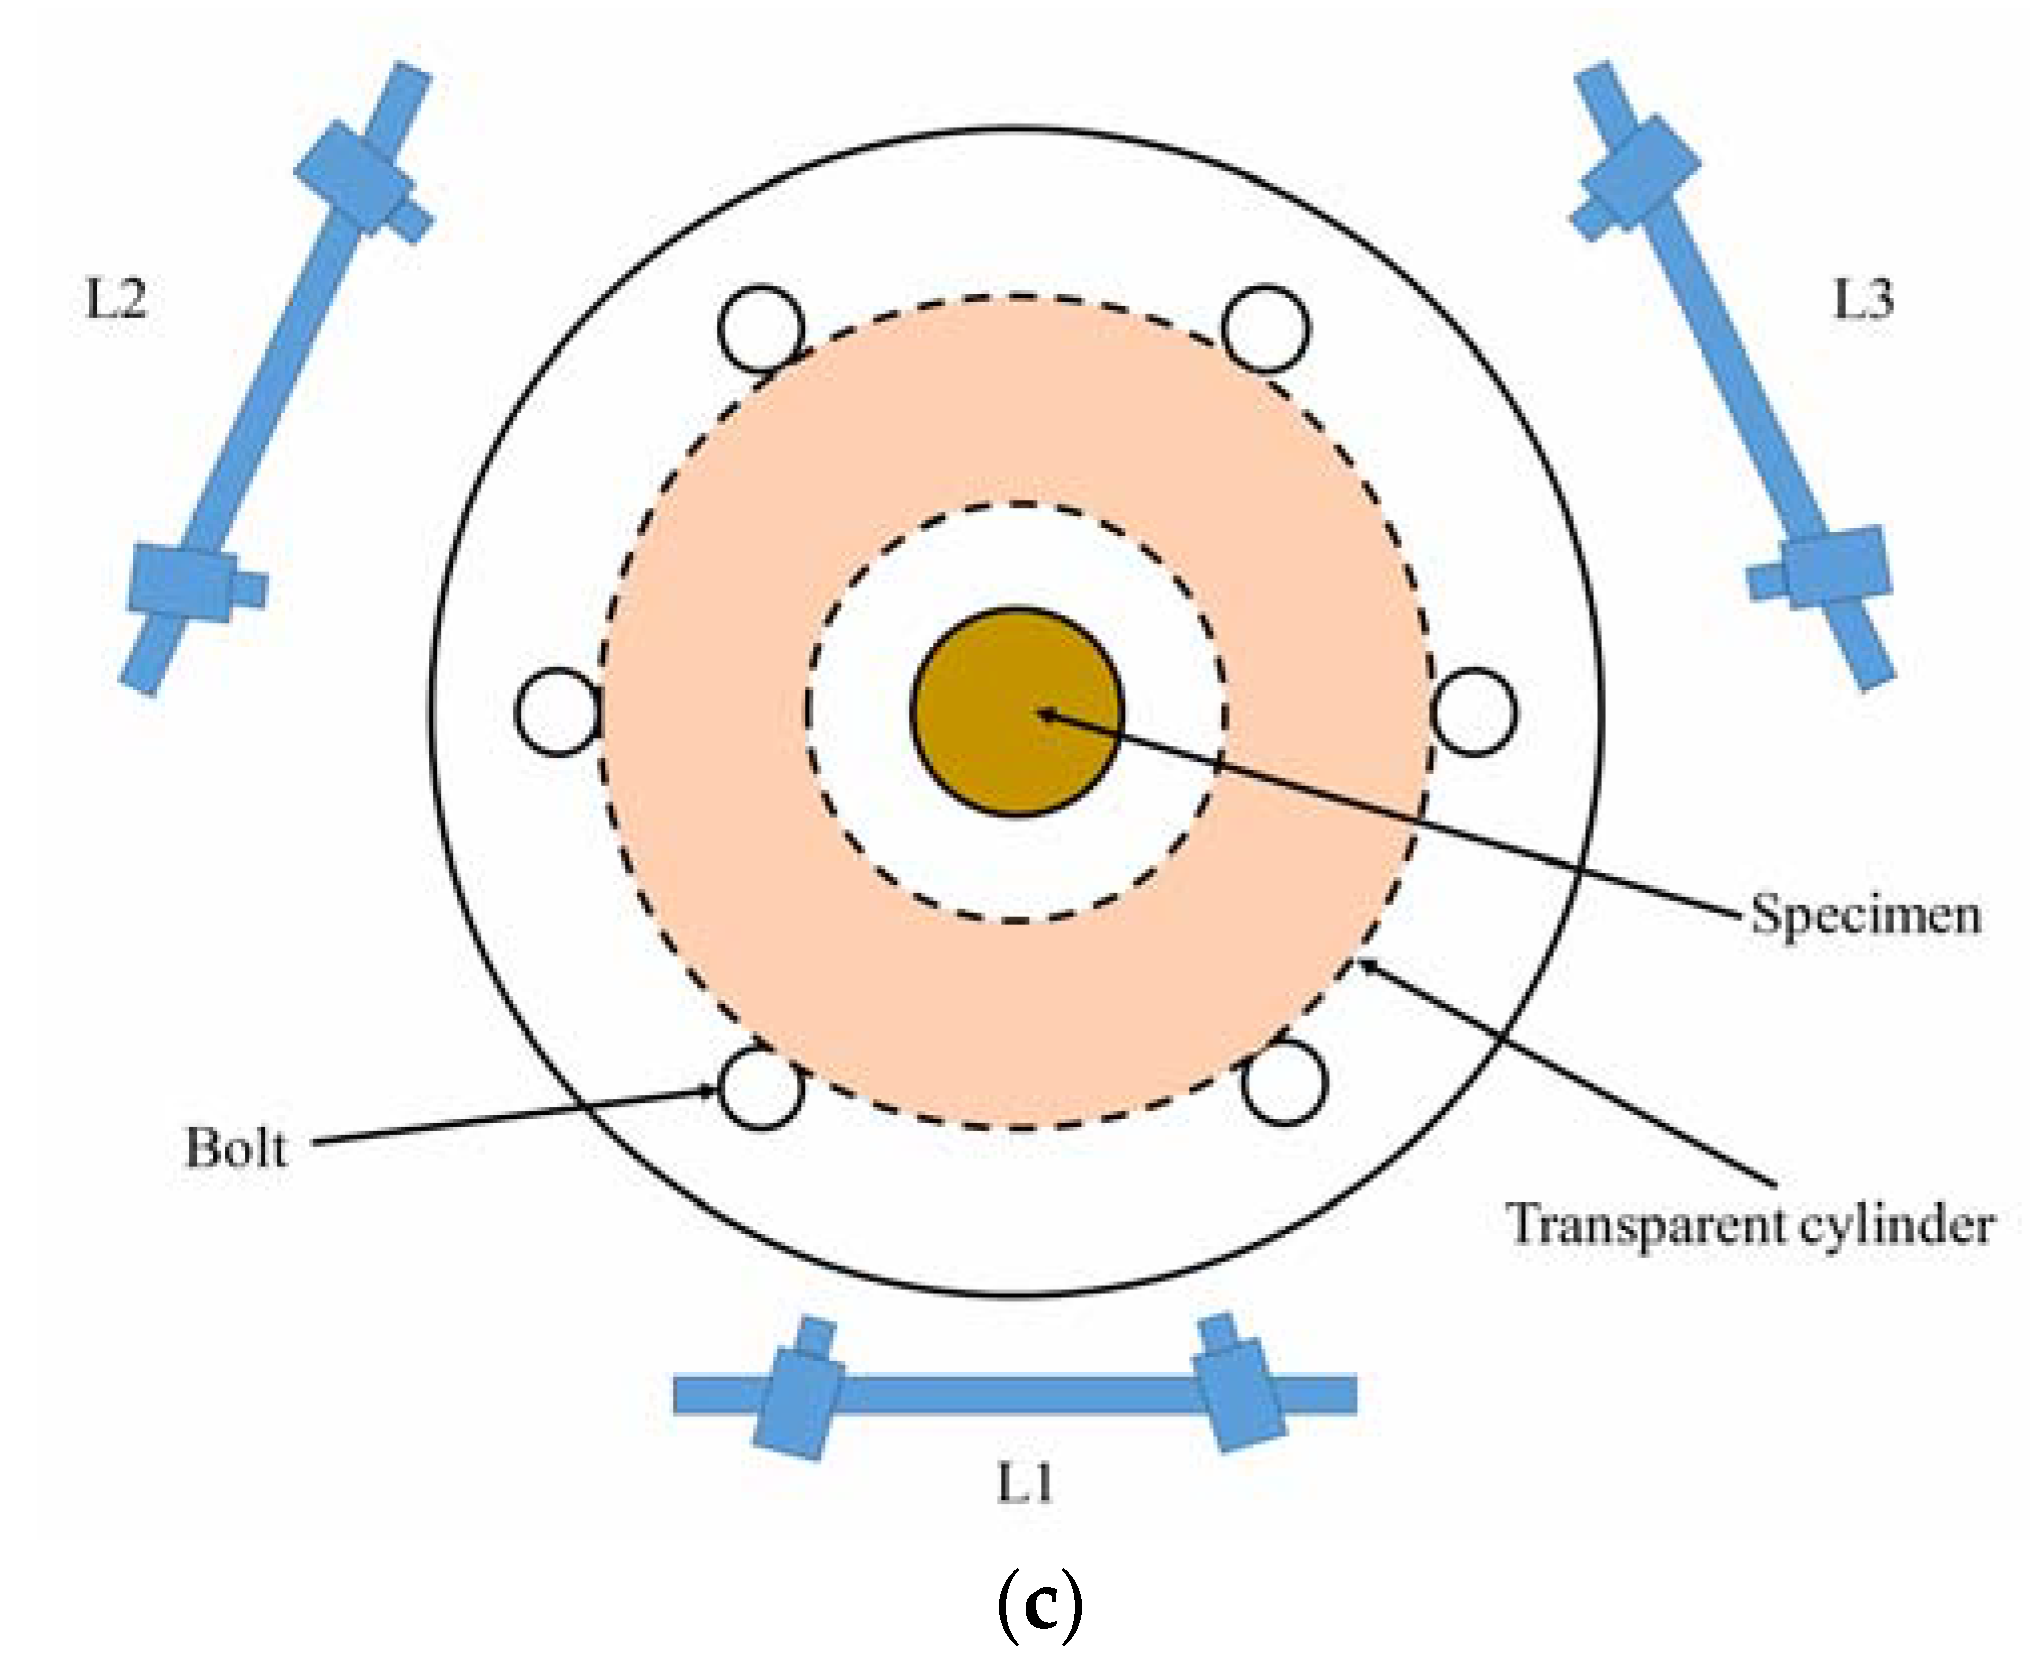
2.2. Loading System and Transparent Pressure Cell

A schematic and experimental setup of the system including the loading system and DIC system are depicted in Figure 1a,b, respectively. A transparent triaxial compressive servo-control test system [22] was used for loading; the system can operate in the following modes: strain controlled, stress-controlled, and a linear combination of stress and strain control [23]. The maximum axial load is 500 kN, measured with the load cell, and the maximum axial displacement is 10 mm, measured with an internal linear variable differential transformer (LVDT) (Shinko Electric Industries CO., LTD., Nagano, Japan.).
A transparent pressure cell is an essential requirement for the 3D-DIC-system-based tri-axial compressive testing of rock, as depicted in Figure 1b. The procedures for installing the transparent cell are similar to those corresponding to the installation of a traditional metal cell. Although the maximum confining pressure corresponding to the failure of a transparent cylinder exceeds 55 MPa, special attention must be paid to safety. As such, the largest confining pressure in daily use is no more than 10 MPa.

2.3. Instrumentation of 3D-DIC System

The 3D-DIC system mainly comprises of an image acquisition system (IAS), analysis and control system (ACS), and a calibration system (CS).
The IAS comprised of six CMOS cameras (Basler, Ahrensburg, Germany), having a resolution of 2448 × 2048 pixels, and a bit rate of 10, along with lenses, six light-emitting diodes (LEDs), and three support devices for 3D measurements. In the laboratory test for the triaxial compression of rock, three groups of the 3D acquisition unit (L1, L2, and L3) were set around the cell to cover the maximum possible surface area of a cylindrical specimen. Each unit comprised a pair of cameras and lenses set on a tripod; each camera was connected along with LED lights to a control box via a transmission cable. To avoid capturing the overexposed images, a polaroid filter was placed on each lens. The six cameras are located as shown in Figure 1c.
The ACS comprised of a control box, control and analysis software, and a computer. The control box comprised of eight data channels, six of which collected image data. One channel was used to output stress data collected from the test machine, thereby facilitating instantaneous image acquisition and synchronous loading to ensure one-to-one correspondence; the last channel was used as a spare. All eight data channels could be controlled at the same time, thereby facilitating the simultaneous collection of stress and displacement signals. The control box was connected to the computer, and image collection was controlled via software. The software accomplished functions such as signal control, image collection and analysis, system calibration, and data output.
The CS accomplished functions of exact target calibration using the software. The detailed calibration steps are described in the next section.

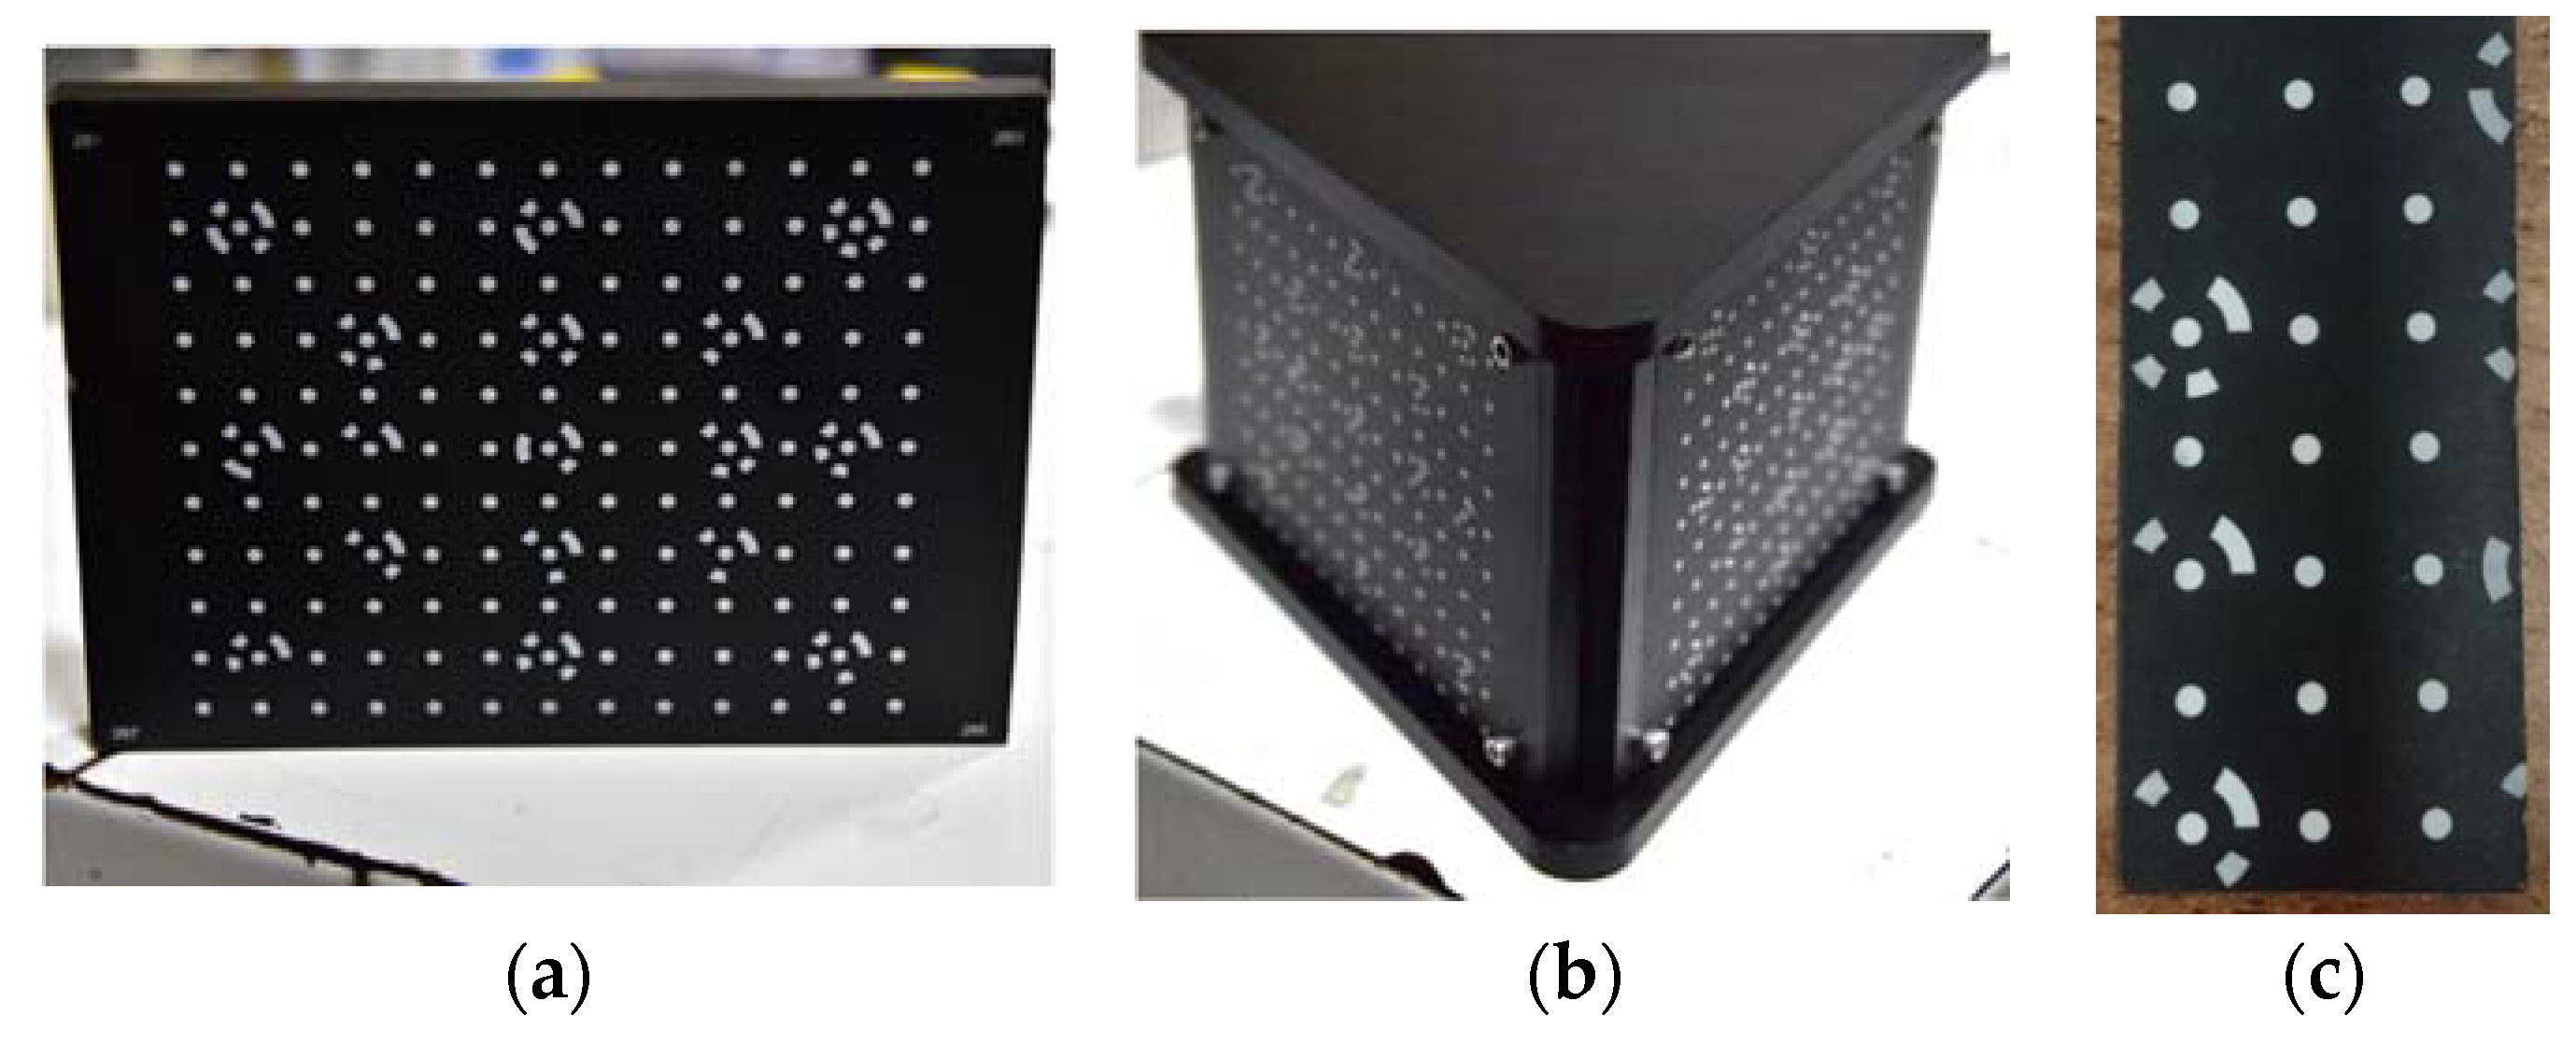
2.4. Calibration of Cameras

Prior to the compression tests, the calibration of each acquisition unit was necessary at relative spatial locations. Because six cameras were divided into three acquisition units, the calibration process was rather complex. First, a plane standard target, as depicted in Figure 2a, was used to exclusively calibrate units L1, L2, and L3; the calibration process involved 24 steps for each unit. Subsequently, a triangular prism standard target, as depicted in Figure 2b, was used to confirm the relative spatial locations of the three units by simultaneously calibrating them all.
The specimen without the chamber and oil is depicted in Figure 3a, while Figure 3b,c depict the specimen along with a chamber that is partly and completely filled with oil, respectively. The figures clearly depict the distortion. As observed, the horizontal distortion was much larger compared to the vertical distortion. Thus, a small target measuring 25 mm in width, as depicted in Figure 2c, was placed in the cell for calibration to obtain the distortion factor caused by the oil and the cell. The average distortion factor in the horizontal direction is 1.4430, with a standard deviation (SD) of 0.0059, and a coefficient of variation (CV) of 0.0041. For the vertical direction, the average distortion factor is 1.0331, the SD is 0.0040, and the CV is 0.0038. However, this was easy to correct.

3. Results

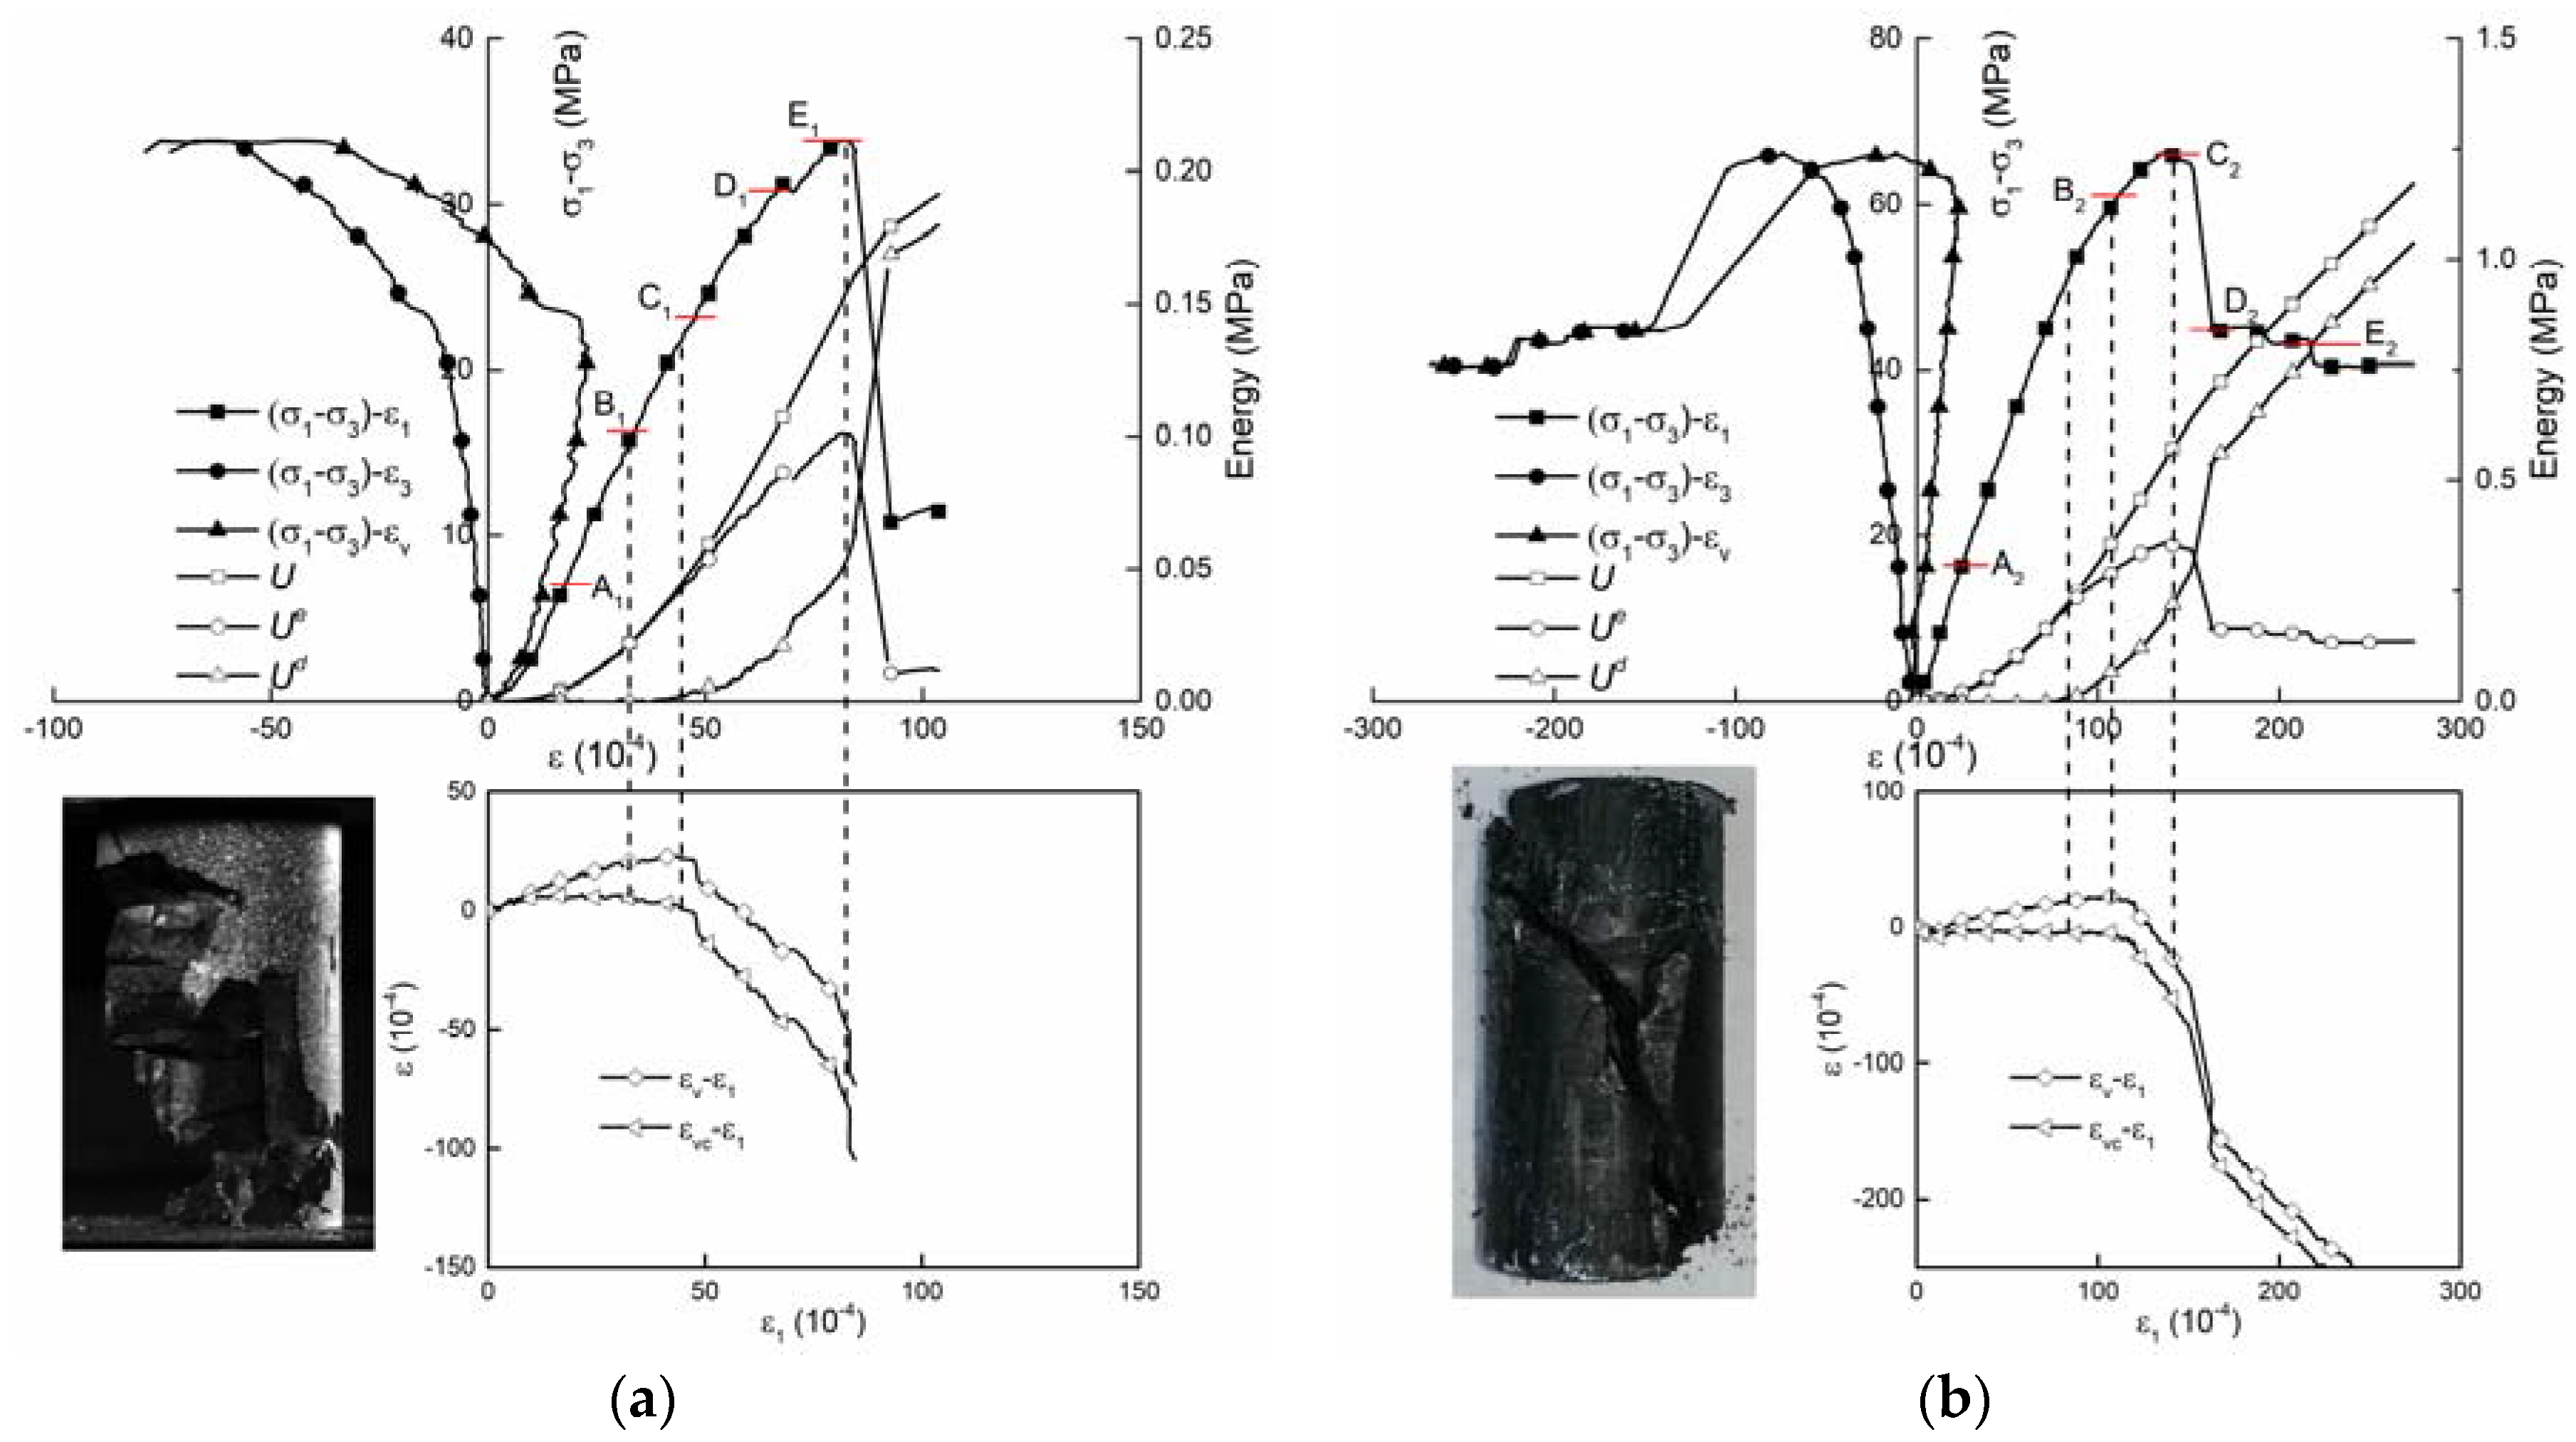
3.1. Progressive Failure Characteristics and Energy Evolution

It is generally accepted that the volumetric strain ε v is calculated using axial strain ε 1 and lateral strain ε 3 as follows:
ε v = ε 1 + 2 ε 3
Martin and Chandler [1] indicated that the volumetric strain ε v is composed of elastic volumetric strain ε v e and crack volumetric strain ε v c and proposed the following formulas:
ε v = ε v e + ε v c
ε v e = 1 v E ( σ 1 σ 3 )
Based on the σ1-ε1 curve, εv-ε1 curve, and εvc-ε1 curve, the stress thresholds as crack initial stress σci, crack damage stress σcd, and peak stress σc can be obtained using the method described by Martin and Chandler [1].
The energy per rock element under an external load can be obtained from the complete stress–strain curves on the premise that there is no heat conversion during the test [20]. Essentially, the total absorbed energy of the rock element at the peak strength involves elastic energy and dissipation energy and is expressed as follows. The dissipation energy per rock element is evaluated to be the area under the stress-strain curve enclosed by the loading-unloading curve. These energies are given as follows [20,24]:
U = U e + U d
where U is the total energy produced because of the external load, U e is the elastic energy accumulated in the pre-failure region, U d is the irreversible dissipation energy, which leads to internal damage and irreversible plastic deformation; the unit of energy is MPa, which is equivalent to that expressed in J/cm3 [24].
The typical results of uniaxial and triaxial compression tests are presented in Figure 4a,b, respectively. The axial strain ε 1 , the lateral strain ε 3 , and the volumetric strain ε v versus the deviator stress ( σ 1 σ 3 ) curves are presented in the figures. Further, the ε v - ε 1 curve, the ε v c - ε 1 curve, and the energy evolution curve are also presented in the figures. The specimens after failure are depicted in the bottom-left of Figure 4. The stress thresholds were calculated based on the above formulas, and are listed in Table 2.
The uniaxial compression test results indicate that the crack-initiation stress level (σci/σc) is 43.75% and the crack damage stress level (σcd/σc) is 63.03%. Initially, the axial deviator stress versus axial strain curve is concave upward, which indicates crack closure, that is, the increase in rock density. Before the stress reaches 14.80 MPa, the strain increments are proportional to the stress increments; the crack volumetric strain has no obvious variation and is nearly constant, which indicates the elastic deformation stage of coal. During this stage, the dissipation energy shows almost no increase. By further increasing the axial yield stress to 14.80 MPa, the rock deforms non-linearly and the stable crack propagates. The rock loses the features of the elastic body. The crack volumetric strain increases in the negative direction, while the dissipation energy increases at the same time; the rate of increase in elastic energy become slower. Microscopic observations of the laboratory-fractured specimen indicated that new micro-cracks develop at the end of pre-existing defects and the stress exceeds the tensile strength of the material [25,26]. These micro-cracks mostly extended parallel to the axial stress and grew at a stable rate [27]. Once extended, these micro-cracks grew in size and number and began to coalesce; the damage evaluation was continued until the stress reached 21.31 MPa, which is the critical stress for the onset of crack damage. Beyond the damage stress, the crack propagation is unstable, fast, and the volumetric strain increases in the negative direction; the rate of increase in the elastic energy decreases and part of the elastic energy is released, which increases the cracks, and the unstable, uncontrolled propagation of microcracks. Flake spalling and ejection from the specimen occurs with a loud sound. Eventually, when the peak stress (33.82 MPa) becomes equal to the elastic energy, the stress decreases abruptly and the specimen reaches the post-failure region. While the elastic energy was released rapidly, many blocks and flakes were ejected at a high rate and with a loud sound; the specimen failed violently, several seconds after reaching peak stress. The location of the crack propagation and flakes spalling will be presented in the next section.
The triaxial compression test results reveal that the crack initiation stress level (σci/σc) is 74.53% and the crack damage stress level (σcd/σc) is 89.84%, which are both larger than the stress thresholds in uniaxial compression [28]. Compared with the results in uniaxial compression, the differences are that the axial deviator stress versus the axial strain curve during the initial stage have no obvious upward concave region owing to the effect of the confining pressure. After the peak point, the stress reduction is less than that in the uniaxial compression and that in uniaxial compression residual strength is higher than that in the uniaxial compression. There are no blocks and flakes ejected owing to the constraint imposed by the confining pressure. The failure mode is regular and simple compared to that in the uniaxial compression.

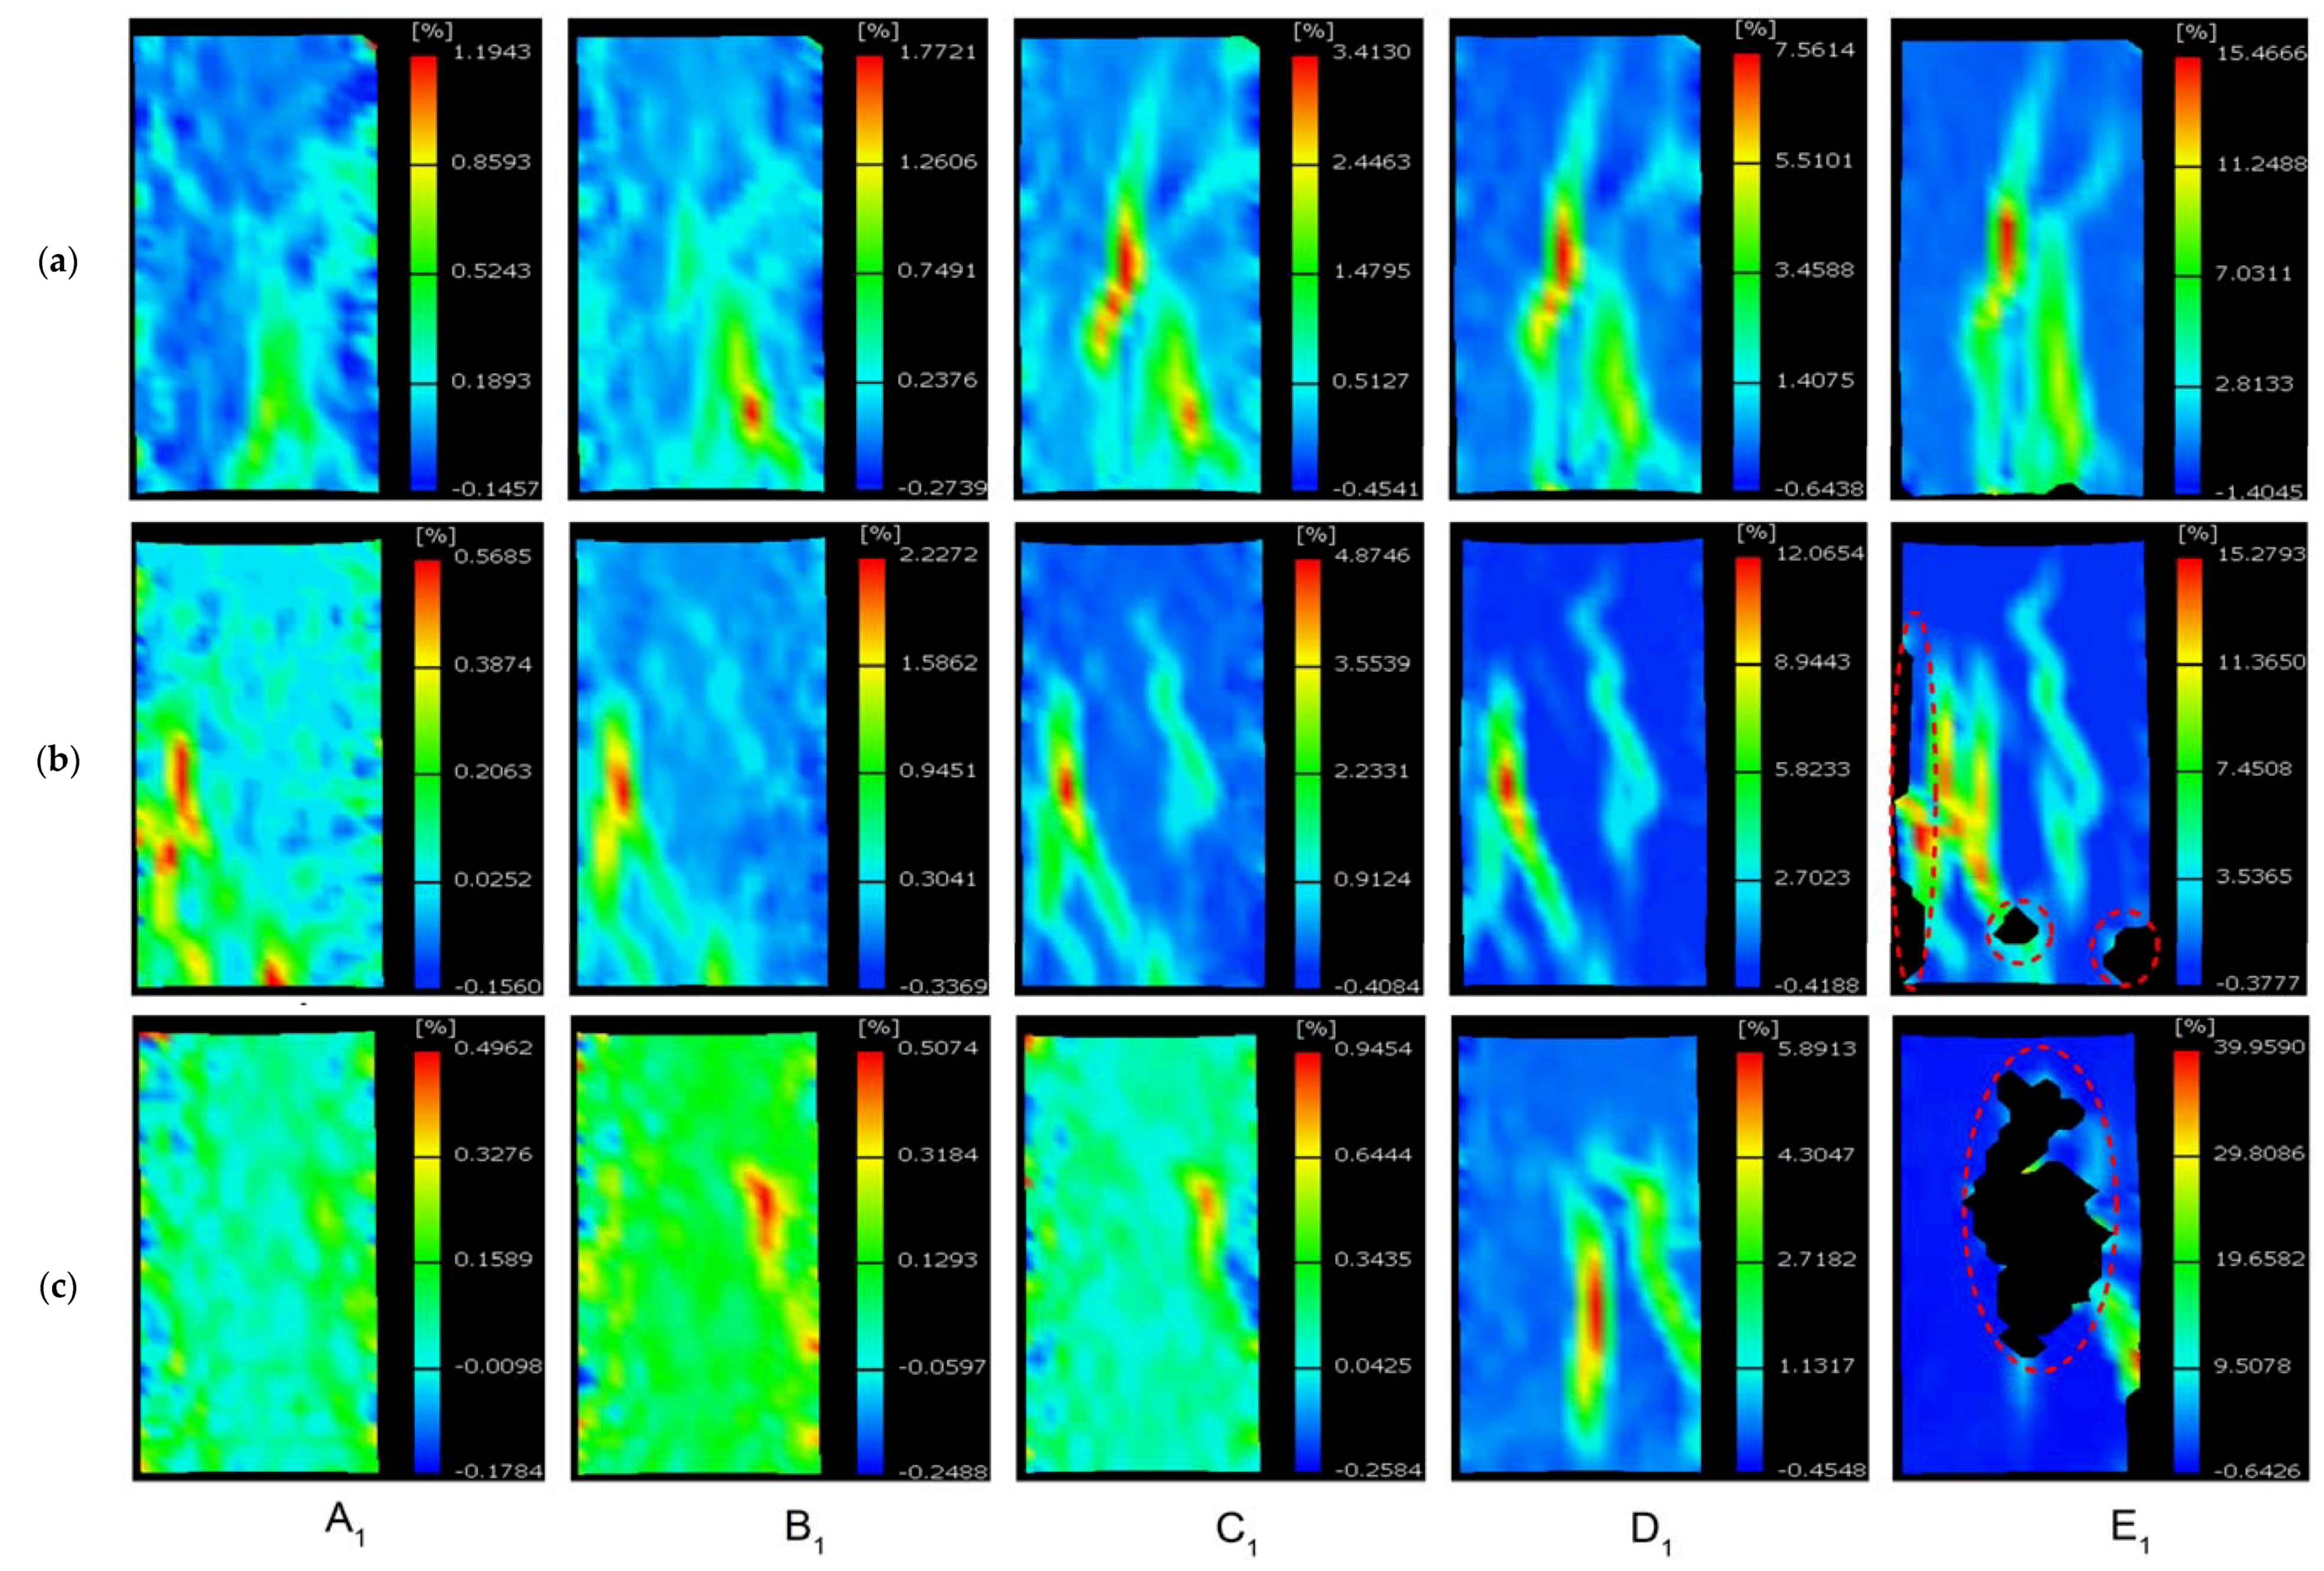
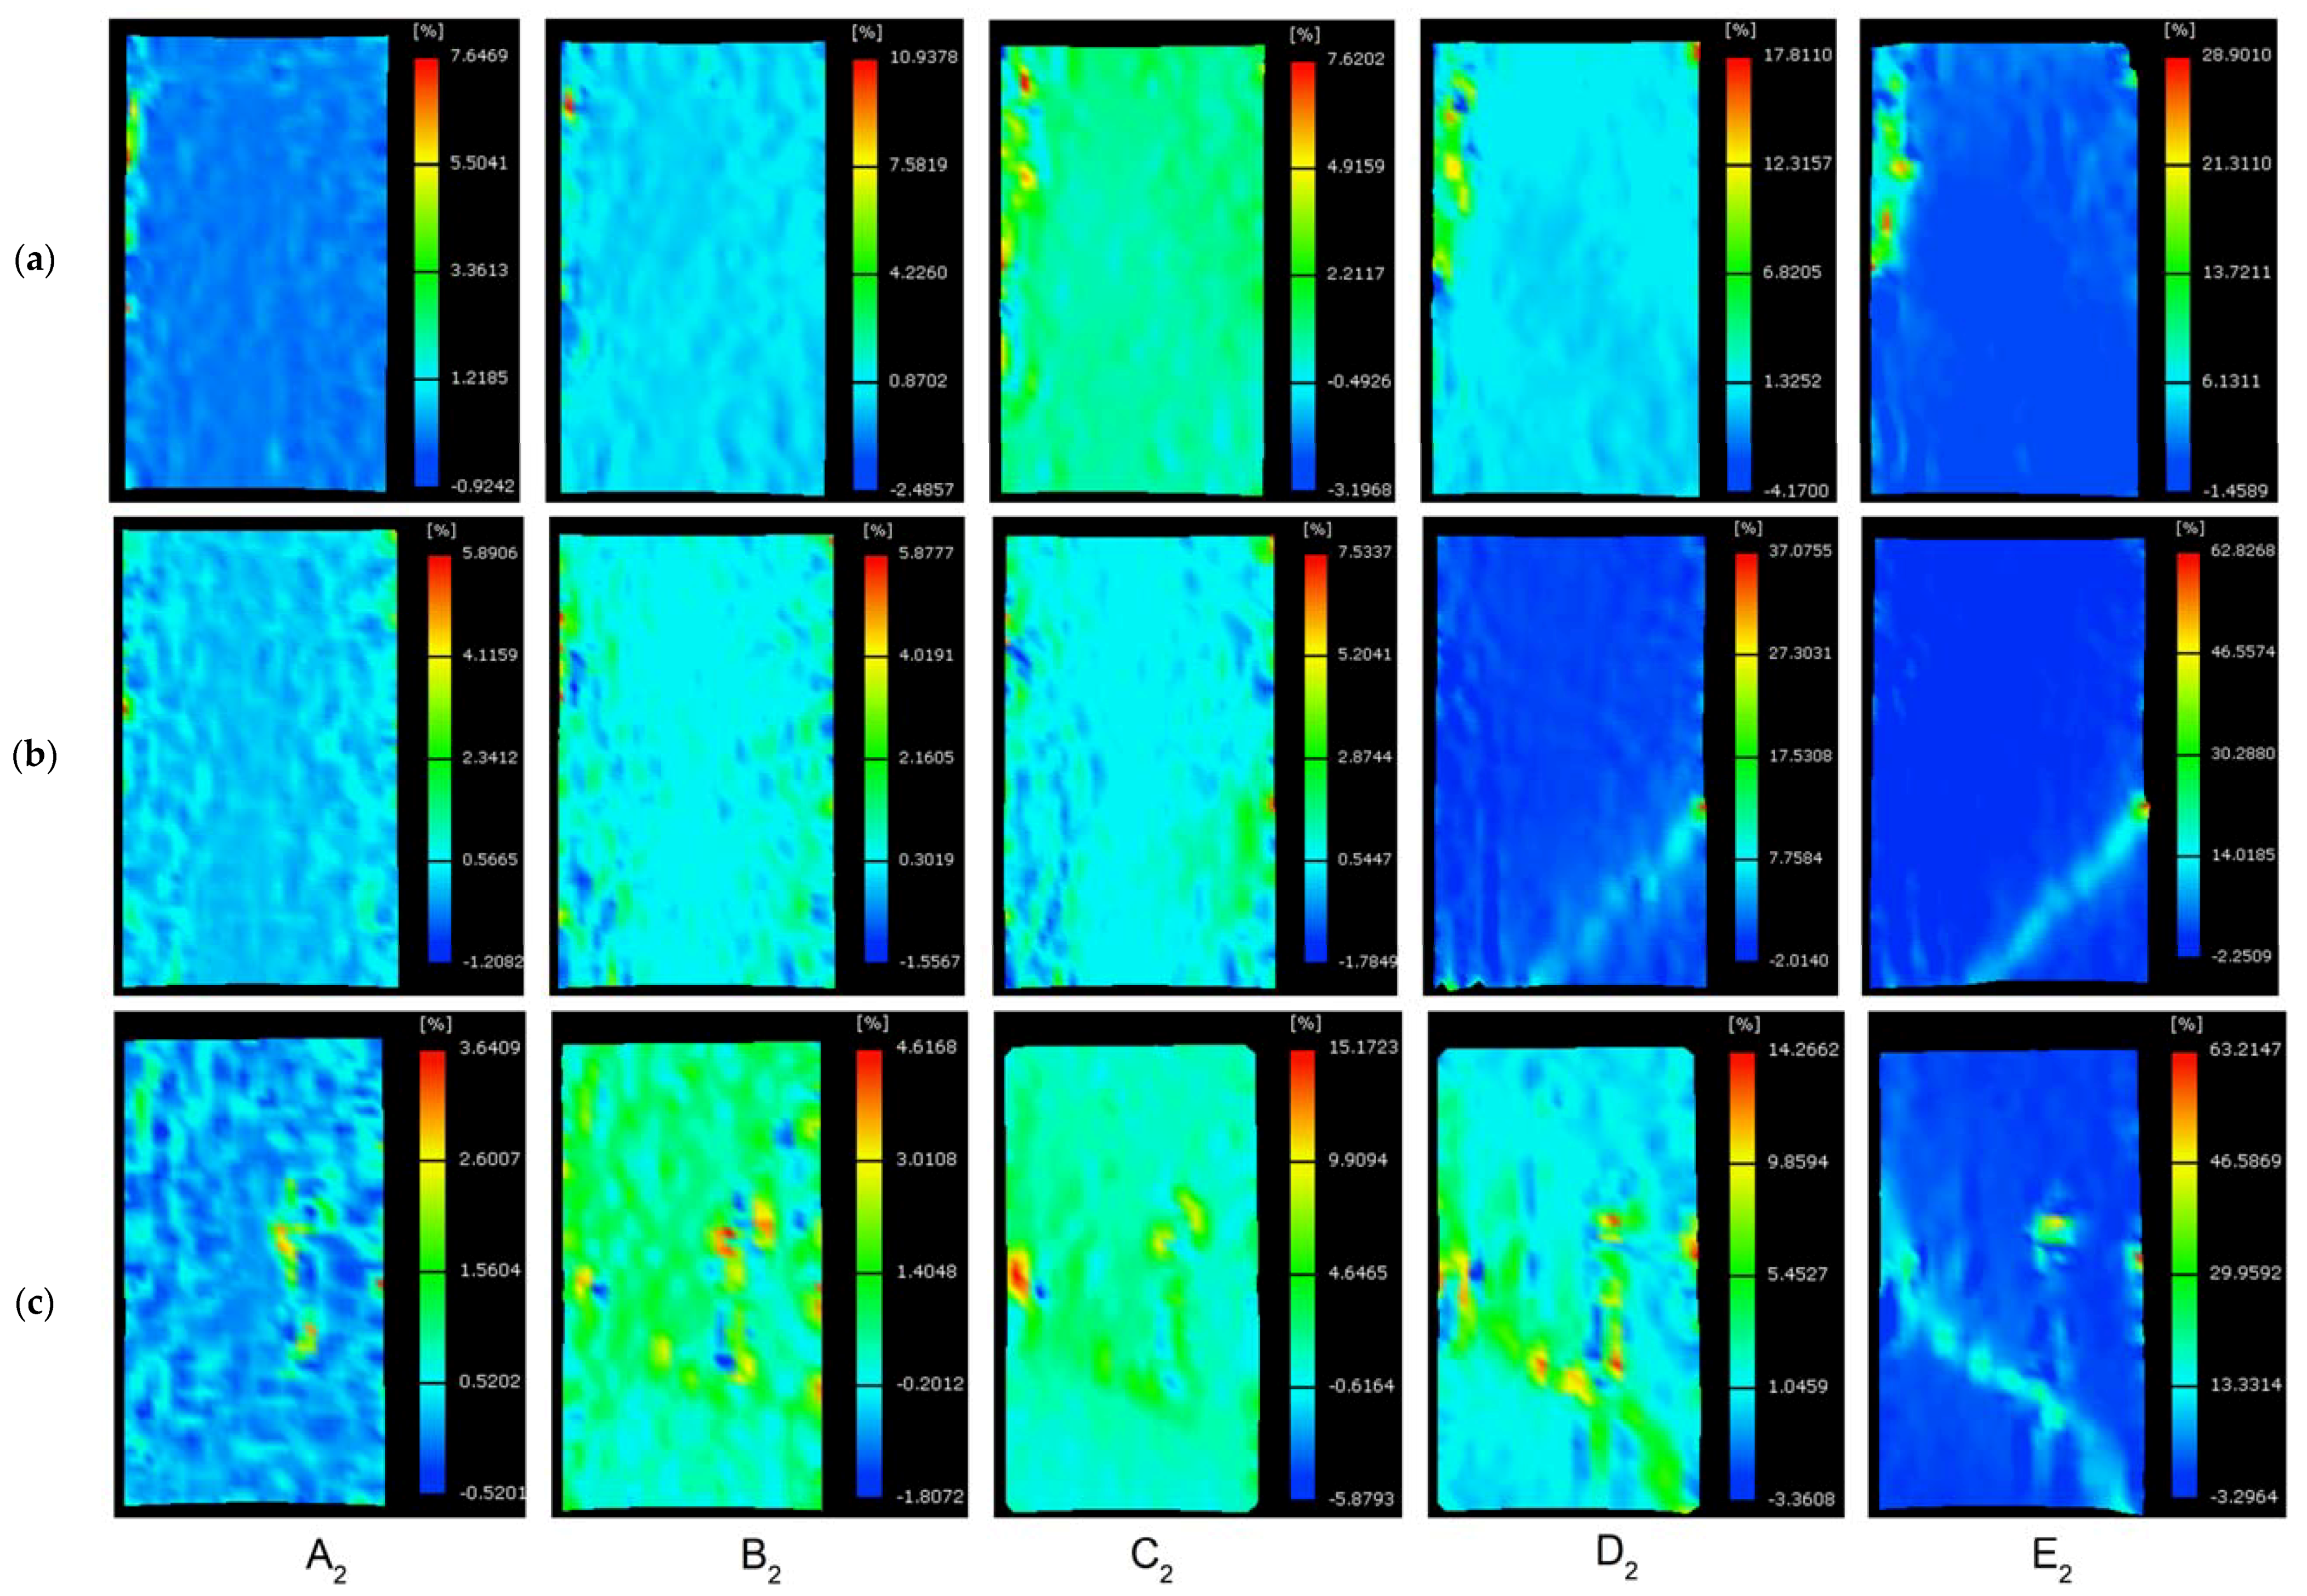
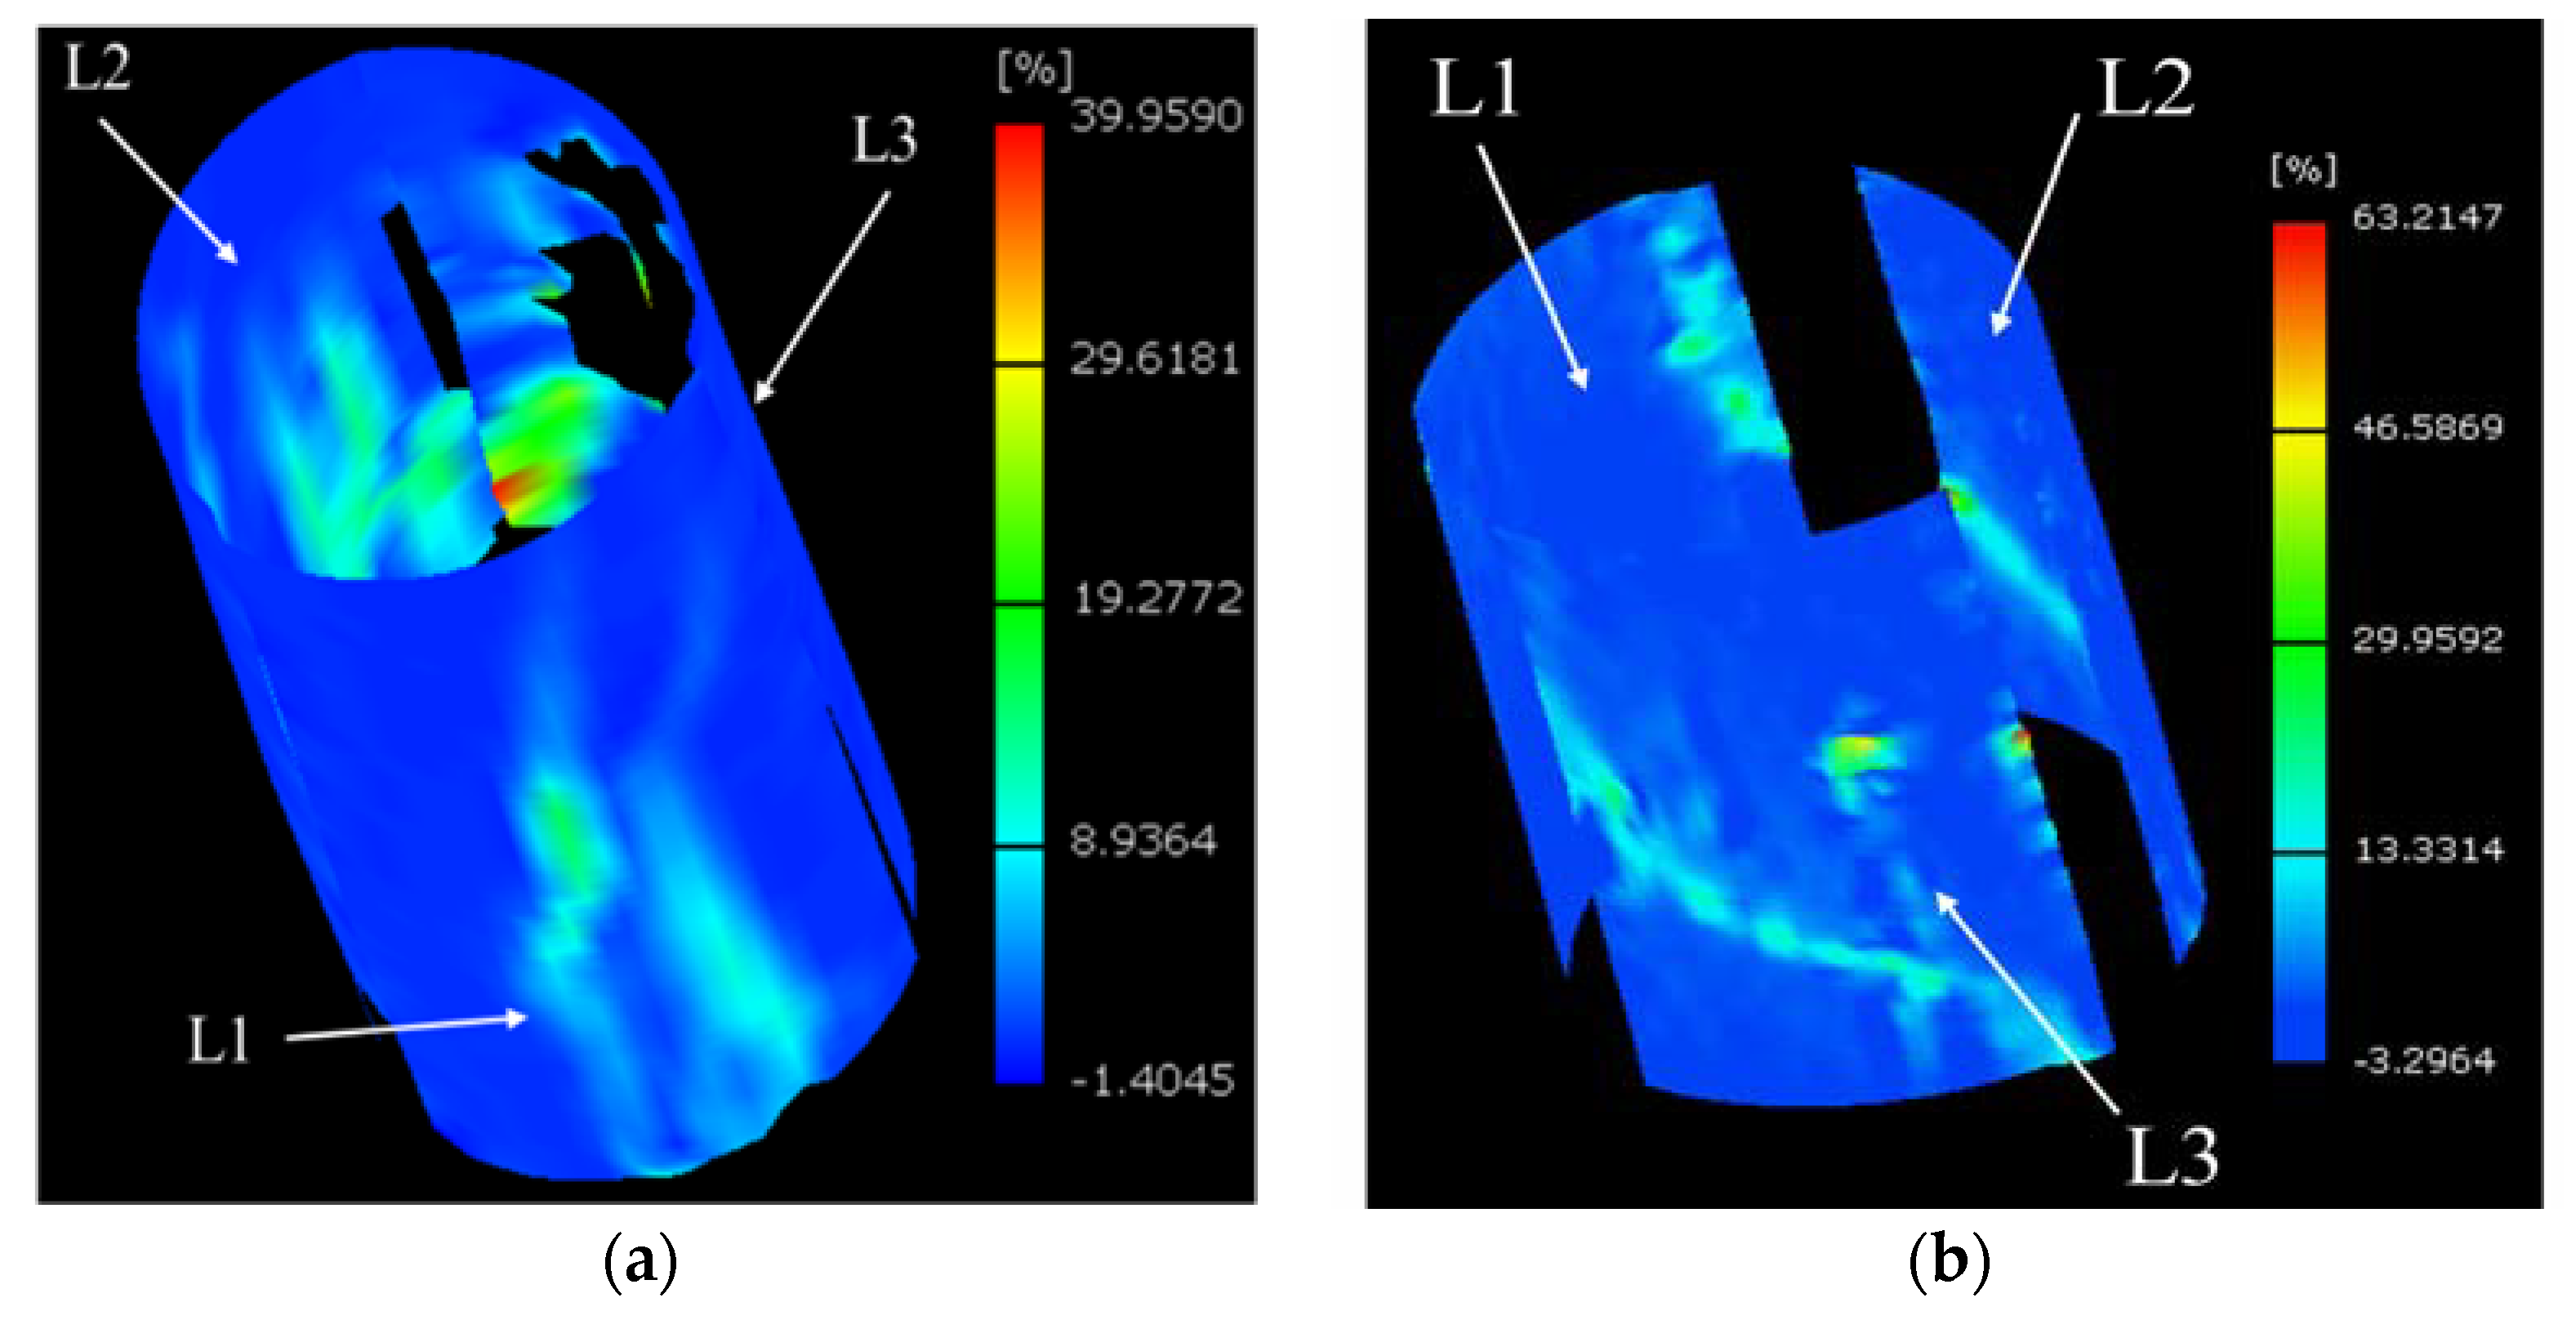
3.2. Field Strain Patterns and Crack Propagation

To observe the propagation of the field strain and cracks, we selected five stress levels corresponding to the peak strength of coal damage. They are labeled A1 (17.47%), B1 (45.18%), C1 (71.61%), D1 (91.34%), and E1 (100%) in the uniaxial compression as shown in Figure 1a; these levels are located in the pre-peak and peak regions. Because of the specimen fracture, speckle patterns on the specimen surface are spalled in the post-peak region and the images could not be processed. Similarly, five stress levels are labeled A2 (12.02%), B2 (83.89%), C2 (100%), D2 (68.62%), and E2 (65.95%) in triaxial compression, as shown in Figure 4b and located in the pre- and post-peak regions.
It is worth mentioning that the strain here should be understood as an apparent one, which reflects crack propagation. Figure 5 depicts the major strain at the selected stress levels in uniaxial compression, measured at the three acquisition units. Cracks develop from the bottom to the top of the specimen and are almost parallel to the loading direction. The regions of apparent strain concentration and localization bands may represent the damaged area. Because of the existing original cracks and defects, a slight strain concentration occurs at the end of the original cracks after the initial stress increment, as shown in Figure 5a,b, while being nearly uniform, as shown in Figure 5c. With the increasing stress, tension cracks develop quickly. In the observed region of L1 shown in Figure 5a, two main tension cracks, nearly parallel to each other, extend from the center to the ends, but the growth rates of these cracks are different. In the observed region of L2 shown in Figure 5b, the first crack develops from the middle-left of the specimen. When the stress level increases from C1 to D1, another crack develops quickly near the first crack, and obvious localization occurs, as shown in Figure 5b. Finally, the stress reaches the peak point (E1), cracks open toward the left, and flake spalling and ejection occur in the region enclosed by the red ellipse shown in Figure 5b, leading to eventual failure. Similar to the observed region of L2, Figure 5c shows the crack propagation process in the observed region of L3; spalling and ejection occur in the middle of the specimen. Figure 5 indicates that coal exhibits strong anisotropy owing to the original cracks. This leads to complicated crack propagation during compression. Flake spalling and ejection indicate coal failure and can even lead to in-situ coal bursts.
Figure 6 depicts the major strains at the selected stress levels in triaxial compression. The original cracks were closed after applying the confining pressure. Thus, the fields of major strains obtained by L1 and L2 almost increase uniformly before the stress reaches point C2, as shown in Figure 6a,b; this phenomenon was also observed by Taheri and Munoz [29] and Li et al. [8] in uniaxial compression. Further, strain localization—a symptom of rock damage—began to emerge from point B2 to point C2 in the area of L3. This indicates that cracks will grow and extend and the coal specimen will be damaged in this region, as shown in Figure 6c. At the peak strength of the coal specimen, localization can be realized but macroscopic cracks do not form. After the peak stress, inclined cracks begin to coalesce, causing eventual failure. The shear bands could be clearly observed with increased strain accumulation, as shown in Figure 6b,c. Moreover, spalling in the middle of the specimen can be observed at point E1, as shown in Figure 6c. Apart from the shear cracks, tension cracks parallel to the axial stress also exist in the top left, as shown in Figure 6a; this crack connected with the shear crack in Figure 6b.

4. Discussion

The previous work indicated that the crack initiation stress level (σci/σc) ranged from 0.3–0.7 for different types of rocks [30]. Xue et al. [6] analyzed the published results of igneous, metamorphic, and sedimentary rocks and showed that the crack damage stress level (σcd/σc) ranged between 0.73–0.85. In this study, we obtained σci/σc as 43.75% in uniaxial compression, which corresponds to the published results. The crack damage stress level σcd/σc = 63.03% is slightly lower than the published results of rock; this may be caused by the primary cracks. Although there is a discussion on the effect of confining pressure on stress thresholds of rock [29,31], the published results discussing coal are scarce. In this paper, the stress thresholds of coal in the triaxial compression are larger than that in the uniaxial compression.
We intended to compare and analyze the failure modes of coal in uniaxial and triaxial compression. Therefore, all field-strain maps obtained from the three units at stress levels E1 and E2 in the same coordinate system were combined, as depicted in Figure 7. The failure mechanisms of coal are different in uniaxial and triaxial compression. They mainly involve complex tension failure and tension-shear failure, respectively. It is easy to observe the crack evolution process on the whole specimen surface during the compression test from beginning to end via video or image playback. This is also the main advantage of this method compared with other 3D-DIC methods.
As described in Section 1, coal contains various primary cracks and defects. Thus, the failure behavior of coal is different from that of compact rocks due to the effect of primary cracks and defects. Munoz et al. [15] conducted a uniaxial compression test of sandstone and realized that the strain field increased uniformly and localization did not appear in the pre-failure region. However, in the uniaxial compression test of coal, localization appeared earlier in the pre-failure region, as shown in Figure 5. It indicated that the crack propagation of coal was more complex than that of compact rocks. The 3D-DIC method showed significant advantages for investigating the effect of pre-existing weak portions and crack extension.

5. Conclusions

The deformation and failure processes of coal are not only important in studies concerning coal mechanics, but they also play a significant role in the prediction and prevention of engineering disasters in mining engineering. In this study, a new 3D-DIC system, which could cover the entire specimen surface with six cameras, was used to investigate the progressive failure of coal in uniaxial and triaxial compression. Crack propagation as well as strain characteristics were observed and described using the captured images. The main conclusions drawn from this study are as follows:
  • The average stress level of crack initiation and crack damage of coal in uniaxial compression are 43.75% and 63.03%, while that in triaxial compression are 74.53% and 89.84%, respectively. The dissipation energy evolution corresponds to the crack volumetric strain, while the elastic energy release leads to flake ejection and coal failure.
  • Through the analysis of digital images, the apparent field strain and crack propagation of coal were obtained under a confining pressure for the first time. Localization takes place progressively in the pre-peak region, which indicates coal failure in uniaxial compression; localization mainly occurs in the post-failure region in triaxial compression, which indicates shear sliding.
  • In uniaxial compression, the original cracks and defects have a large influence on damage evolution. New cracks extend from the end of original cracks and are parallel to the loading direction. Flake ejection with sound occurred near the peak strength of coal. Thus, the coal sample undergoes failure in tension. In the triaxial compression, the original cracks were compacted by the confining pressure and the inclined cracks extended and combined with each other; further, there were also tension cracks, which reduced the coal strength. Thus, coal samples undergo tension-shear failure.
  • By analyzing the full-field strain and crack evolution, we can correctly understand the progressive failure process and mechanism of coal. This study is an important contribution toward the safety and stability of mining engineering.

Author Contributions

Each author has contributed to the present paper. Y.T., S.O., and J.X. conceived and designed the experiments; Y.T. and S.P. performed the experiments and analyzed the experimental data.

Acknowledgments

The authors would like to thank the National Natural Science Foundation of China (51434003) and Basic and Frontier Research Projects of Chongqing (cstc2016jcyjA0117) for the financial support.

Conflicts of Interest

The authors declare no conflicts of interest.

References

  1. Martin, C.D.; Chandler, N.A. The progressive fracture of Lac du Bonnet granite. Int. J. Rock Mech. Min. Sci. Geomech. Abstr. 1994, 36, 643–659. [Google Scholar] [CrossRef]
  2. Bieniawski, Z.T. Mechanism of brittle fracture of rock. Part I—Theory of the fracture process. Int. J. Rock Mech. Min. Sci. Geomech. Abstr. 1967, 4, 395–406. [Google Scholar] [CrossRef]
  3. Diederichs, M.S.; Kaiser, P.K.; Eberhardt, E. Damage initiation and propagation in hard rock during tunnelling and the influence of near-face stress rotation. Int. J. Rock Mech. Min. Sci. 2004, 41, 785–812. [Google Scholar] [CrossRef]
  4. Martin, C.D.; Christiansson, R. Estimating the potential for spalling around a deep nuclear waste repository in crystalline rock. Int. J. Rock Mech. Min. Sci. 2009, 46, 219–228. [Google Scholar] [CrossRef]
  5. Munoz, H.; Taheri, A.; Chanda, E.K. Fracture Energy-Based Brittleness Index Development and Brittleness Quantification by Pre-peak Strength Parameters in Rock Uniaxial Compression. Rock Mech. Rock Eng. 2016, 49, 4587–4606. [Google Scholar] [CrossRef]
  6. Xue, L.; Qin, S.; Sun, Q.; Wang, Y.; Lee, L.M.; Li, W. A Study on Crack Damage Stress Thresholds of Different Rock Types Based on Uniaxial Compression Tests. Rock Mech. Rock Eng. 2014, 47, 1183–1195. [Google Scholar] [CrossRef]
  7. Munoz, H.; Taheri, A. Local Damage and Progressive Localisation in Porous Sandstone During Cyclic Loading. Rock Mech. Rock Eng. 2017, 50, 3253–3259. [Google Scholar] [CrossRef]
  8. Li, X.; Duan, Y.; Li, S.; Zhou, R. Study on the Progressive Failure Characteristics of Longmaxi Shale under Uniaxial Compression Conditions by X-ray Micro-Computed Tomography. Energies 2017, 10, 303. [Google Scholar] [CrossRef]
  9. Wu, Y.; Li, X.; He, J.; Zheng, B. Mechanical Properties of Longmaxi Black Organic-Rich Shale Samples from South China under Uniaxial and Triaxial Compression States. Energies 2016, 9, 1088. [Google Scholar] [CrossRef]
  10. GN, H. Method of and Apparatus for Examination of a Body by Radiation Such as X-ray or Gamma Radiation. United States Patent Number US3924131, 2 December 1975. [Google Scholar]
  11. Bruck, H.A.; McNeill, S.R.; Sutton, M.A.; Peters, W.H. Digital image correlation using Newton-Raphson method of partial differential correction. Exp. Mech. 1989, 29, 261–267. [Google Scholar] [CrossRef]
  12. Sutton, M.A.; Mingqi, C.; Peters, W.H.; Chao, Y.J.; McNeill, S.R. Application of an optimized digital correlation method to planar deformation analysis. Image Vis. Comput. 1986, 4, 143–150. [Google Scholar] [CrossRef]
  13. Chu, T.C.; Ranson, W.F.; Sutton, M.A.; Peters, W.H. Applications of Digital-Image-Correlation Techniques to Experimental Mechanics. Exp. Mech. 1985, 25, 232–244. [Google Scholar] [CrossRef]
  14. Peters, W.H.; Ranson, W.F. Digital Imaging Techniques in Experimental Stress Analysis. Opt. Eng. 1982, 21, 427–431. [Google Scholar] [CrossRef]
  15. Munoz, H.; Taheri, A.; Chanda, E.K. Pre-Peak and Post-Peak Rock Strain Characteristics during Uniaxial Compression by 3D Digital Image Correlation. Rock Mech. Rock Eng. 2016, 49, 2541–2554. [Google Scholar] [CrossRef]
  16. Zhang, H.; Song, H.; Kang, Y.; Huang, G.; Qu, C. Experimental Analysis on Deformation Evolution and Crack Propagation of Rock Under Cyclic Indentation. Rock Mech. Rock Eng. 2013, 46, 1053–1059. [Google Scholar] [CrossRef]
  17. Song, H.; Zhang, H.; Kang, Y.; Huang, G.; Fu, D.; Qu, C. Damage evolution study of sandstone by cyclic uniaxial test and digital image correlation. Tectonophysics 2013, 608, 1343–1348. [Google Scholar] [CrossRef]
  18. Ma, S.; Yan, D.; Wang, X.; Cao, Y. Damage Observation and Analysis of a Rock Brazilian Disc Using High-speed DIC Method. Appl. Mech. Mater. 2011, 70, 87–92. [Google Scholar] [CrossRef]
  19. Patel, S.; Martin, C.D. Evaluation of Tensile Young’s Modulus and Poisson’s Ratio of a Bi-modular Rock from the Displacement Measurements in a Brazilian Test. Rock Mech. Rock Eng. 2017, 51, 361–372. [Google Scholar] [CrossRef]
  20. Xie, H.; Li, L.; Peng, R.; Ju, Y. Energy analysis and criteria for structural failure of rocks. J. Rock Mech. Geotech. Eng. 2009, 1, 11–20. [Google Scholar] [CrossRef]
  21. Yan, F.; Lin, B.; Xu, J.; Wang, Y.; Zhang, X.; Peng, S. Structural evolution characteristics of middle-high rank coal samples subjected to high-voltage electrical pulse. Energy Fuels 2018, 32, 3263–3271. [Google Scholar] [CrossRef]
  22. Okubo, S.; Tang, Y.; Xu, J.; Peng, S.J.; Zhang, H.L. Improvement and application of transparent triaxial compression servo-control test system. Chin. J. Rock Mech. Eng. 2017, 36, 3351–3358. [Google Scholar]
  23. Okubo, S.; Nishimatsu, Y. Uniaxial compression testing using a linear combination of stress and strain as the control variable. Int. J. Rock Mech. Min. Sci. Geomech. Abstr. 1985, 22, 323–330. [Google Scholar] [CrossRef]
  24. Munoz, H.; Taheri, A.; Chanda, E. Rock cutting performance assessment using strain energy characteristics of rocks. Trans. Inst. Min. Metall. Sect. A Min. Technol. 2017, 126, 191–199. [Google Scholar] [CrossRef]
  25. Hoek, E.; Bieniawski, Z.T. Brittle fracture propagation in rock under compression. Int. J. Fract. 1984, 26, 276–294. [Google Scholar] [CrossRef]
  26. Perras, M.A.; Diederichs, M.S. A Review of the Tensile Strength of Rock: Concepts and Testing. Geotech. Geol. Eng. 2014, 32, 525–546. [Google Scholar] [CrossRef]
  27. Pepe, G.; Mineo, S.; Pappalardo, G.; Cevasco, A. Relation between crack initiation-damage stress thresholds and failure strength of intact rock. Bull. Eng. Geol. Environ. 2017, 1–16. [Google Scholar] [CrossRef]
  28. Turichshev, A.; Hadjigeorgiou, J. Triaxial compression experiments on intact veined andesite. Int. J. Rock Mech. Min. Sci. 2016, 86, 179–193. [Google Scholar] [CrossRef]
  29. Taheri, A.; Munoz, H. Pre-peak Damage Thresholds of Different Rocks in Confined and Unconfined Conditions. In Proceedings of the International Conference on Geomechanics, Geo-Energy and Geo-Resources, Melbourne, Australia, 28–29 September 2016. [Google Scholar]
  30. Brace, W.F.; Paulding, B.W.; Scholz, C. Dilatancy in Fracture of Crystalline Rocks. J. Geophys. Res. 1966, 71, 3939–3953. [Google Scholar] [CrossRef]
  31. Walton, G.; Alejano, L.R.; Arzua, J.; Markley, T. Crack Damage Parameters and Dilatancy of Artificially Jointed Granite Samples Under Triaxial Compression. Rock Mech. Rock Eng. 2018, 1–20. [Google Scholar] [CrossRef]
Figure 1. The setup of the loading system and DIC system: (a) schematic; (b) overview; (c) arrangement of the six cameras.
Energies 11 01215 g001aEnergies 11 01215 g001b
Figure 2. The three types of calibration targets: (a) the plane standard target; (b) the triangular prism standard target; (c) the small target.
Energies 11 01215 g002
Figure 3. Photographs of the specimen showing distortion: (a) the empty cell; (b) the cell partly filled with oil; (c) the cell fully filled with oil.
Energies 11 01215 g003
Figure 4. The typical stress–strain curves of coal in (a) uniaxial compression; (b) triaxial compression.
Energies 11 01215 g004
Figure 5. The major strain fields obtained by (a) L1; (b) L2; (c) L3 in uniaxial compression.
Energies 11 01215 g005
Figure 6. The major strain field obtained by (a) L1; (b) L2; (c) L3 in triaxial compression.
Energies 11 01215 g006
Figure 7. The spatial distribution of the major strains on specimen surface: (a) uniaxial compression; (b) triaxial compression.
Energies 11 01215 g007
Table 1. The properties of the coal samples.
Proximate Analysis (%)Ro,max (%)Coal Rank
MadAadVadFCad
1.4412.697.6278.252.7anthracite
Mad, mosture content (air-dried basis); Aad, ash content (air-dried basis); Vad, volatile matter content (air-dried basis); FCad, fixed carbon (air-dried basis).
Table 2. The coal properties and threshold stresses for progressive failure.
TestE (GPa)vσci (MPa) σcd (MPa)σc (MPa)σci/σcσcd/σc
UC5.660.2314.8021.3133.8243.75%63.03%
TC6.140.3649.3859.5166.2574.53%89.84%
UC uniaxial compression, TC triaxial compression, E Young’s modulus, v Poisson’s ratio.

