Article

Comparison and Evaluation of the Potential Energy, Carbon Emissions, and Financial Impacts from the Incorporation of CHP and CCHP Systems in Existing UK Hotel Buildings

1
Department of Civil Engineering and Built Environment, School of Computing and Engineering, University of West London, London W5 5RF, UK
2
Research Department, The Chartered Institution of Building Services Engineers (CIBSE), London SW12 9BS, UK
3
Energy and Environment, Engineering Operations EMEA, Hilton, Maple Court, Reeds Crescent, Watford WD24 4QQ, UK
4
Engineering Operations EMEA, Hilton, Maple Court, Reeds Crescent, Watford WD24 4QQ, UK
*
Author to whom correspondence should be addressed.
Energies 2018, 11(5), 1219; https://doi.org/10.3390/en11051219
Submission received: 3 April 2018 / Revised: 4 May 2018 / Accepted: 7 May 2018 / Published: 10 May 2018

Abstract

:
In recent years there has been an increasing interest in the incorporation of distributed energy resource (DER) systems such as combined heat and power (CHP) and combined cooling, heating, and power (CCHP) in commercial building applications as they have shown considerable environmental and financial benefits when compared to conventional energy generation. This paper aims to investigate the potential energy, carbon emissions, and financial impact of the size of co/tri-generation systems on a real case scenario of an existing UK hotel. The analysis is carried out using Thermal Analysis Simulation software (TAS) and a payback methodology is adopted to carry out the financial analysis. The results show that the average percentage decrease in carbon emissions with CHP is 32% and with CCHP it is 36%. Whilst both CHP and CCHP systems increase energy consumption in the building, the costs are reduced, and a CHP system contributes to a higher percentage of cost savings and shorter payback periods. The incorporation of a CCHP system leads to lower energy consumption for a similar-sized CHP system. Further simulations under future climate projections revealed that a CCHP system outperforms a CHP system.

1. Introduction

A projected increase in energy demand combined with a growing energy supply gap means that energy generation must be optimised. Traditionally, energy consumption loads are supplied by electricity from the national grid and/or heat generated via fuel burning in a boiler. This conventional approach to generating energy ‘separately’ tends to have a low efficiency of 30–45% [1]. Consequently, in recent years there has been an increasing interest in the incorporation of distributed energy resource (DER) systems, ranging from renewables to co/tri-generation systems, in residential and commercial buildings. Combined heat and power (CHP) or cogeneration is an alternative method that utilises by-product heat, which can amount up to 80% of total primary energy during electricity generation [1]. Studies have shown CHP can improve efficiency by over 30% and deliver primary energy savings of more than 50% when compared to conventional energy generation [2,3]. Combined cooling, heating, and power (CCHP) also known as tri-generation originated from CHP. The difference between the two systems is that CCHP further utilises by-product heat to provide cooling [4].
CHP benefits from more than 100 years of experience in both commercial and residential applications and is usually described as the generation of electricity and thermal energy using one primary energy source. Since the introduction of the 2004 EC Directive on the promotion of cogeneration [5] the UK government has actively supported and promoted the development of cogeneration in the UK by introducing the initiative ‘CHP Focus’. The initiative aims to inform and guide residential and commercial users regarding CHP as a technology and provide approaches to financing a CHP plant [6]. Consequently, between 2007 and 2016 the UK has seen an increase in the installation of CHP units by 48.97% [7].
The development of CCHP technology and on-site application gained popularity in the last two decades and have been widely introduced in research into commercial building applications, such as hospitals, office buildings, and hotels [8,9]. Air conditioning and cooling systems are standard in many commercial buildings, even in countries with a cooler climate, such as the UK [10]. A CCHP unit will allow the utilisation of excess heat for cooling by creating water at sufficiently low temperatures to be used for air conditioning [4]. Due to this, the overall efficiency of a CCHP unit is significantly higher in comparison to the CHP plant and tri-generation systems can reach overall efficiencies up to 93% [11].
With an occupancy rate of 90% and constant electric and heat demand and seasonal cooling loads, the case study building, the Hilton Reading hotel, is a suitable candidate for the comparison of CHP and CCHP systems. This paper aims to investigate the potential benefits/costs associated with co/tri-generation systems in terms of energy consumption, carbon emissions, and financially on a real case scenario of a UK hotel. To analyse the effects of the CHP and CCHP systems on the building case study, Thermal Analysis Simulation (TAS) software will be used to develop a comprehensive model using relevant building data such as floor plans, building operating data, and building fabric/HVAC/system information. Once the baseline model has been generated the system modelling results will be validated by comparing against actual building energy consumption. The next phase of analysis requires the incorporation of various-sized CHP and then CCHP units into the building model. Based on this, the performance of the building in terms of energy consumption, and carbon emissions will be compared for the CHP systems against the CCHP systems. Subsequently, the systems will be simulated with the 2020s and 2050s TRY weather files to examine their performance under future climatic scenarios. To conduct the financial analysis, a payback methodology is adopted.

2. Literature Review

The UK government is committed to reducing carbon emissions by 80%, comparative to the 1990 baseline, by 2050. In addition, the recast 2010 Energy Performance Building Directive (EPBD) requires all new buildings (including buildings that will undergo renovations) to be nearly zero energy buildings (NZEBs) by 2020. The building sector is currently the largest consumer of energy across Europe, meaning that it plays a vital role in aiding to reach this target [12]. Several studies have suggested that the implementation of cogeneration and tri-generation systems have a great potential to improve the energy efficiency of buildings [9,12,13,14,15,16]. An investigation of the energy, economic, and environmental benefits of CHP-heat pump hybrids in a hotel and a hospital reference building [17] concluded that when units are selected with a focus on cost-savings, lower energy savings are achieved. Therefore, units should be selected based on a balance of cost and energy savings.
Mago and Smith [18] evaluated the benefits from the use of CHP in various commercial building applications and suggested that when a CHP is designed to provide a larger percentage of the thermal demand of the building, better emissions, costs, and primary energy consumption savings are reached. A 2017 feasibility study of an organic Rankine cycle (ORC)-type CHP and CCHP systems in Spain concluded that whilst CHP offered the most profitability in medium-severe to severe-winter climate zones, the CCHP performed the best in medium-to-severe winter climate zones [19]. The work of Mago, Fumo, and Chamra [20] highlighted the difference between the performance of CHP and CCHP systems following either the thermal load (FTL) or the electric load (FEL). It was observed that FTL-focused CHP and CCHP and FEL-focused CCHP reduced the primary energy consumption and carbon emissions for the various US cities evaluated, while the FEL-focused CHP increased the primary energy consumption and carbon emissions.
The size of CHP and CCHP systems, their module efficiencies, various systems’ components, and operation load are factors which directly influence the overall output and performance of the units. Typically, in studies and real-life applications a CHP system is sized to deliver a thermal load matching the building’s base heat load [21,22]. This method ensures that heat is efficiently utilised, and if additional electricity is needed or generated, then this can be purchased or sold to the grid, respectively. Santini and Romito [23] investigated the sizing of cogeneration and tri-generation systems on a commercial building. They suggest that both CHP and CCHP plants should be sized based on the base heat load of the building. Likewise, several studies [24,25,26,27,28] have shown that ‘properly sizing’ a CHP and CCHP is essential to effectively reducing primary energy consumption and that reductions can be more than 33% compared to a reference building. Based on this, it can be concluded that the units should be sized based on the baseload heat requirements of the building and this will be applied for the case study presented in this paper.
A case-study approach is adopted; therefore, it is essential that the selected case-study is representative of other UK hotel buildings. As it stands, the main limitation associated with the case-study approach would be the variations found between the architectural design of the case-study and the existing building stock. Wei et al. [29] investigated the influence of architectural design on building energy use in cold climates. The work concluded that cooling and electricity use are predominantly affected by the overall building scale; meanwhile, annual heating energy consumption is influenced by the number of floors. With regards to the influence of the geometrical parameters of the buildings, Zhang et al. [30] found that a window-to-wall ratio (WWR) of 20–40% had the best performance in terms of energy demand and thermal comfort. The selected case study falls within this category as it has a WWR of 30%. In addition, it was concluded that the energy demand of the building is not affected by orientation, unlike thermal comfort. Therefore, although a case-study approach has been adopted for this paper, the applicability of the results to similar-sized UK hotel buildings remain.
From the reviewed literature, it can be seen that there are a considerable number of studies on both CHP and CCHP systems which consider the energy, emissions, and cost savings. However, the majority of studies do consider the systems separately and the two systems are typically only directly compared theoretically.

3. Methodology

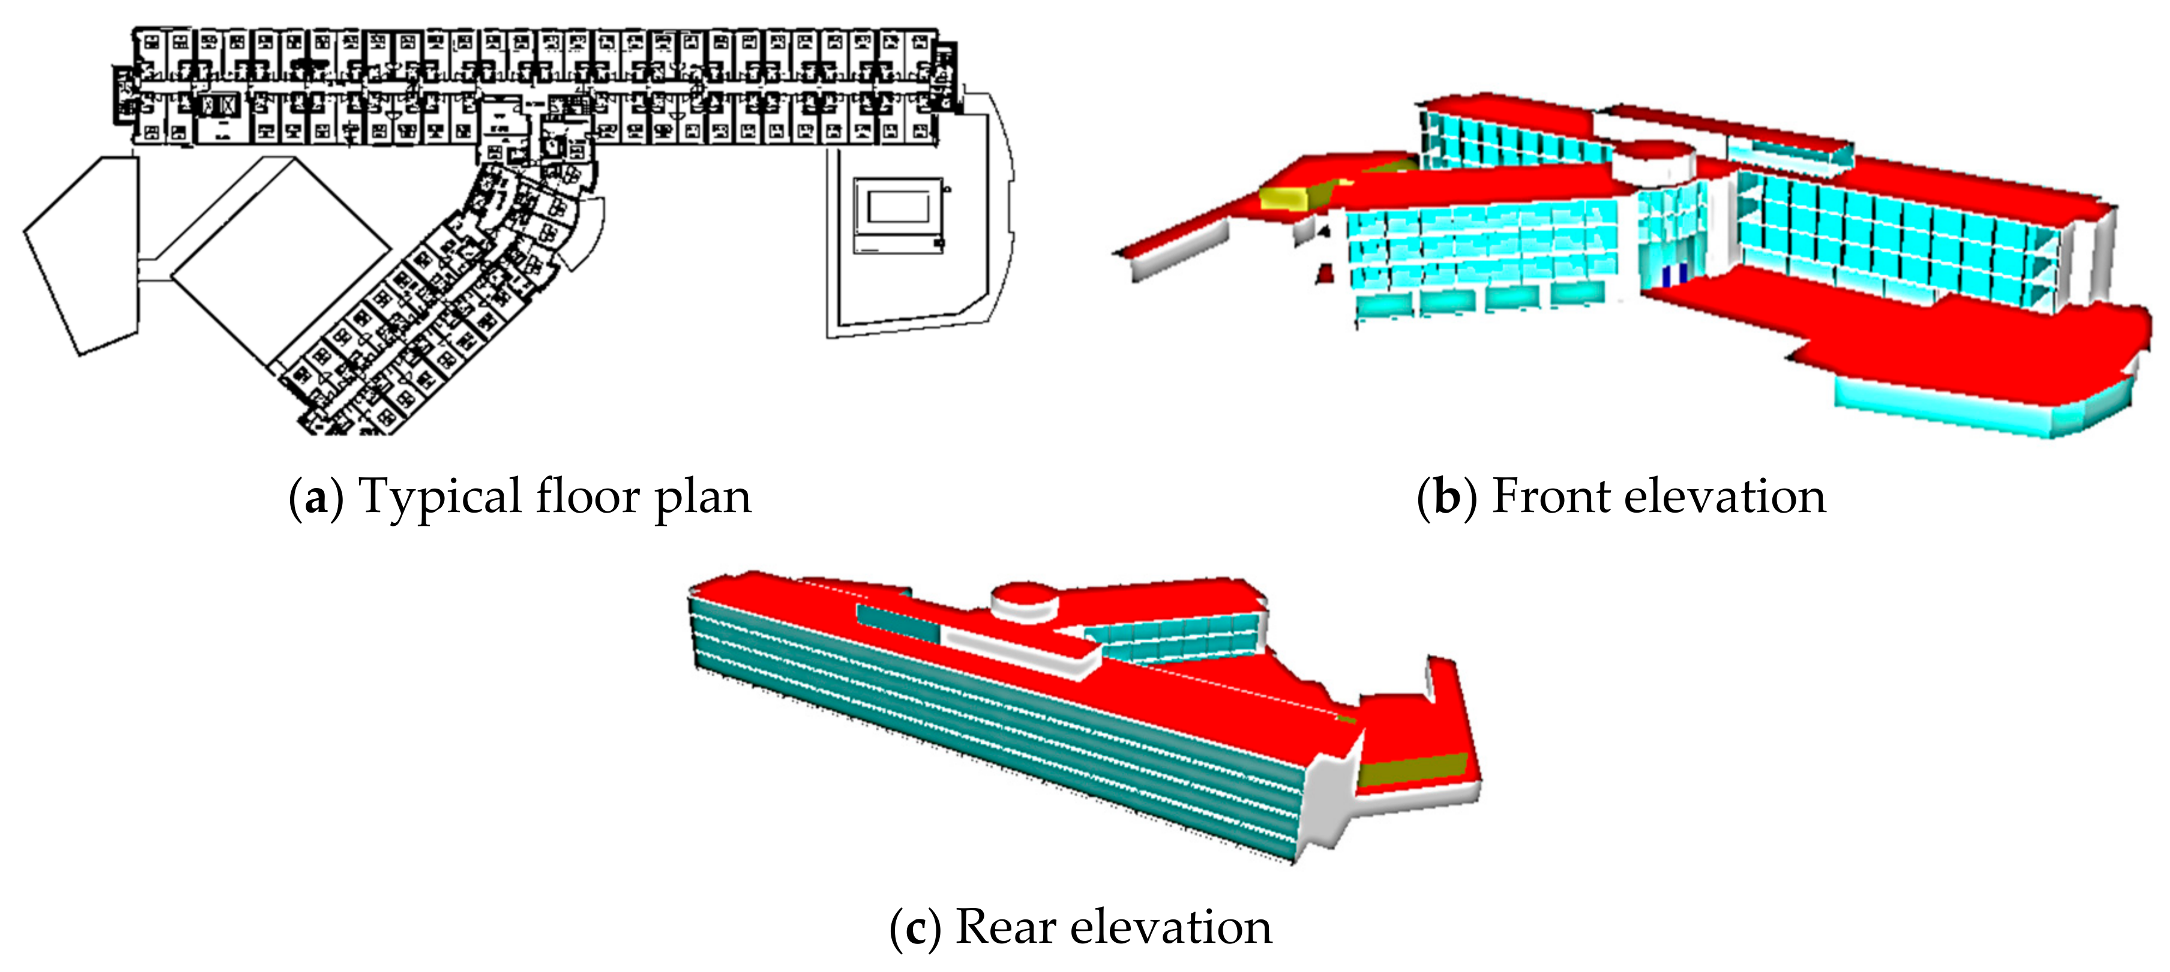
3.1. Building Description and Modelling

The selected case study is the Hilton Reading hotel located in Reading, Berkshire and constructed in 2009. It is a four-storey hotel, with a total floor area of 12,365 m2, and a curtain wall glazed façade system. The windows are double glazed—4 mm clear pane; 50 mm air gap and 4 mm clear pane. Figure 1a shows the typical floor plan of the hotel for the first, second, and third floors, which are made up of en-suite bedrooms. The ground floor is comprised of the reception area, offices, meeting and conference rooms, changing rooms, kitchen/restaurant/bar, and fitness/sauna/pool area. The building complies with the 2006 UK building regulations; it is sealed and fully air conditioned. Air handling units (AHU) and fan coil units (FCU), located on the rooftop, provide heating/cooling to all building floors and individual bedrooms/ meeting rooms, respectively. To meet the domestic hot water (DHW) demand across the hotel, six gas fired boilers are in use.
Building modelling and simulation software TAS is used to predict energy performance, baseline, and mitigated CO2 emissions [31]. To match the actual orientation of the building, the latitude is changed to 51.43 degrees north, the longitude is −0.98 degrees east, and the UTC to +0.00. Initially, the model created in TAS is a replica of the existing state of the building as shown in Figure 1b,c. Refer to [32] for a detailed description of the modelling process in TAS.
The type of weather file selected for carrying out the analysis is the London Test Reference Year (TRY). This is selected because the Design Summer Year (DSY) weather file is suitable for overheating analysis. Meanwhile, the Test Reference Year (TRY) is suitable for “energy analysis and compliance with the UK Building Regulations (Part L)” [33].
Part of the analysis involves the examination of the units under various climatic scenarios. These will be based on future projections. For each scenario, there are three emission cases: ‘low’, ‘medium’, and ‘high’. The projected emissions scenarios range from low-energy usage and carbon emissions to high fossil fuel usage and carbon emissions [34]. According to the Climate Change Committee the ‘medium emissions’ scenario represents a ‘business as usual’ increase in consumption of fossil fuels and carbon emissions and will be selected for all time periods. The lifespan of C/CHP units are typically more than 15 years [35], therefore, the weather files to be simulated are the ‘TRY London’ adapted to UKCP09 ‘medium’ scenarios for 2020s and 2050s projections [36].
The co/tri-generation circuit is designed in TAS by inputting relevant component details, such as ‘fuel source’, ‘heat: power ratio’, ‘heating/cooling source capacity’, ‘distribution efficiency’, etc. Absorption chillers have been selected to deliver the tri-generation. With water operating as the refrigerant and lithium bromide salt operating as the absorbant. The lowest temperature range to be achieved throughout the hotel should be in the range of 6–12 °C. A coefficient of performance (CoP) of 0.80 is used for the absorption chiller and an efficiency of 0.85 is used for the air handling unit (Cibse, 2012). The total efficiency of the heating component is, therefore, estimated to be 80% (the efficiency of the AHU) and the total efficiency of the cooling components is calculated as (0.80 × 0.85) × 100 = 68%.

3.2. Modelling Assumptions

  • It is assumed that the hotel is occupied 24 h, seven days a week. This is selected based on average occupancy patterns in the hotel.
  • The National Calculation Method (NCM) database will be used to represent all zones, including circulation, reception, and toilets, as shown in Table 1. It will be assumed that these conditions are the actual current conditions of the hotel.
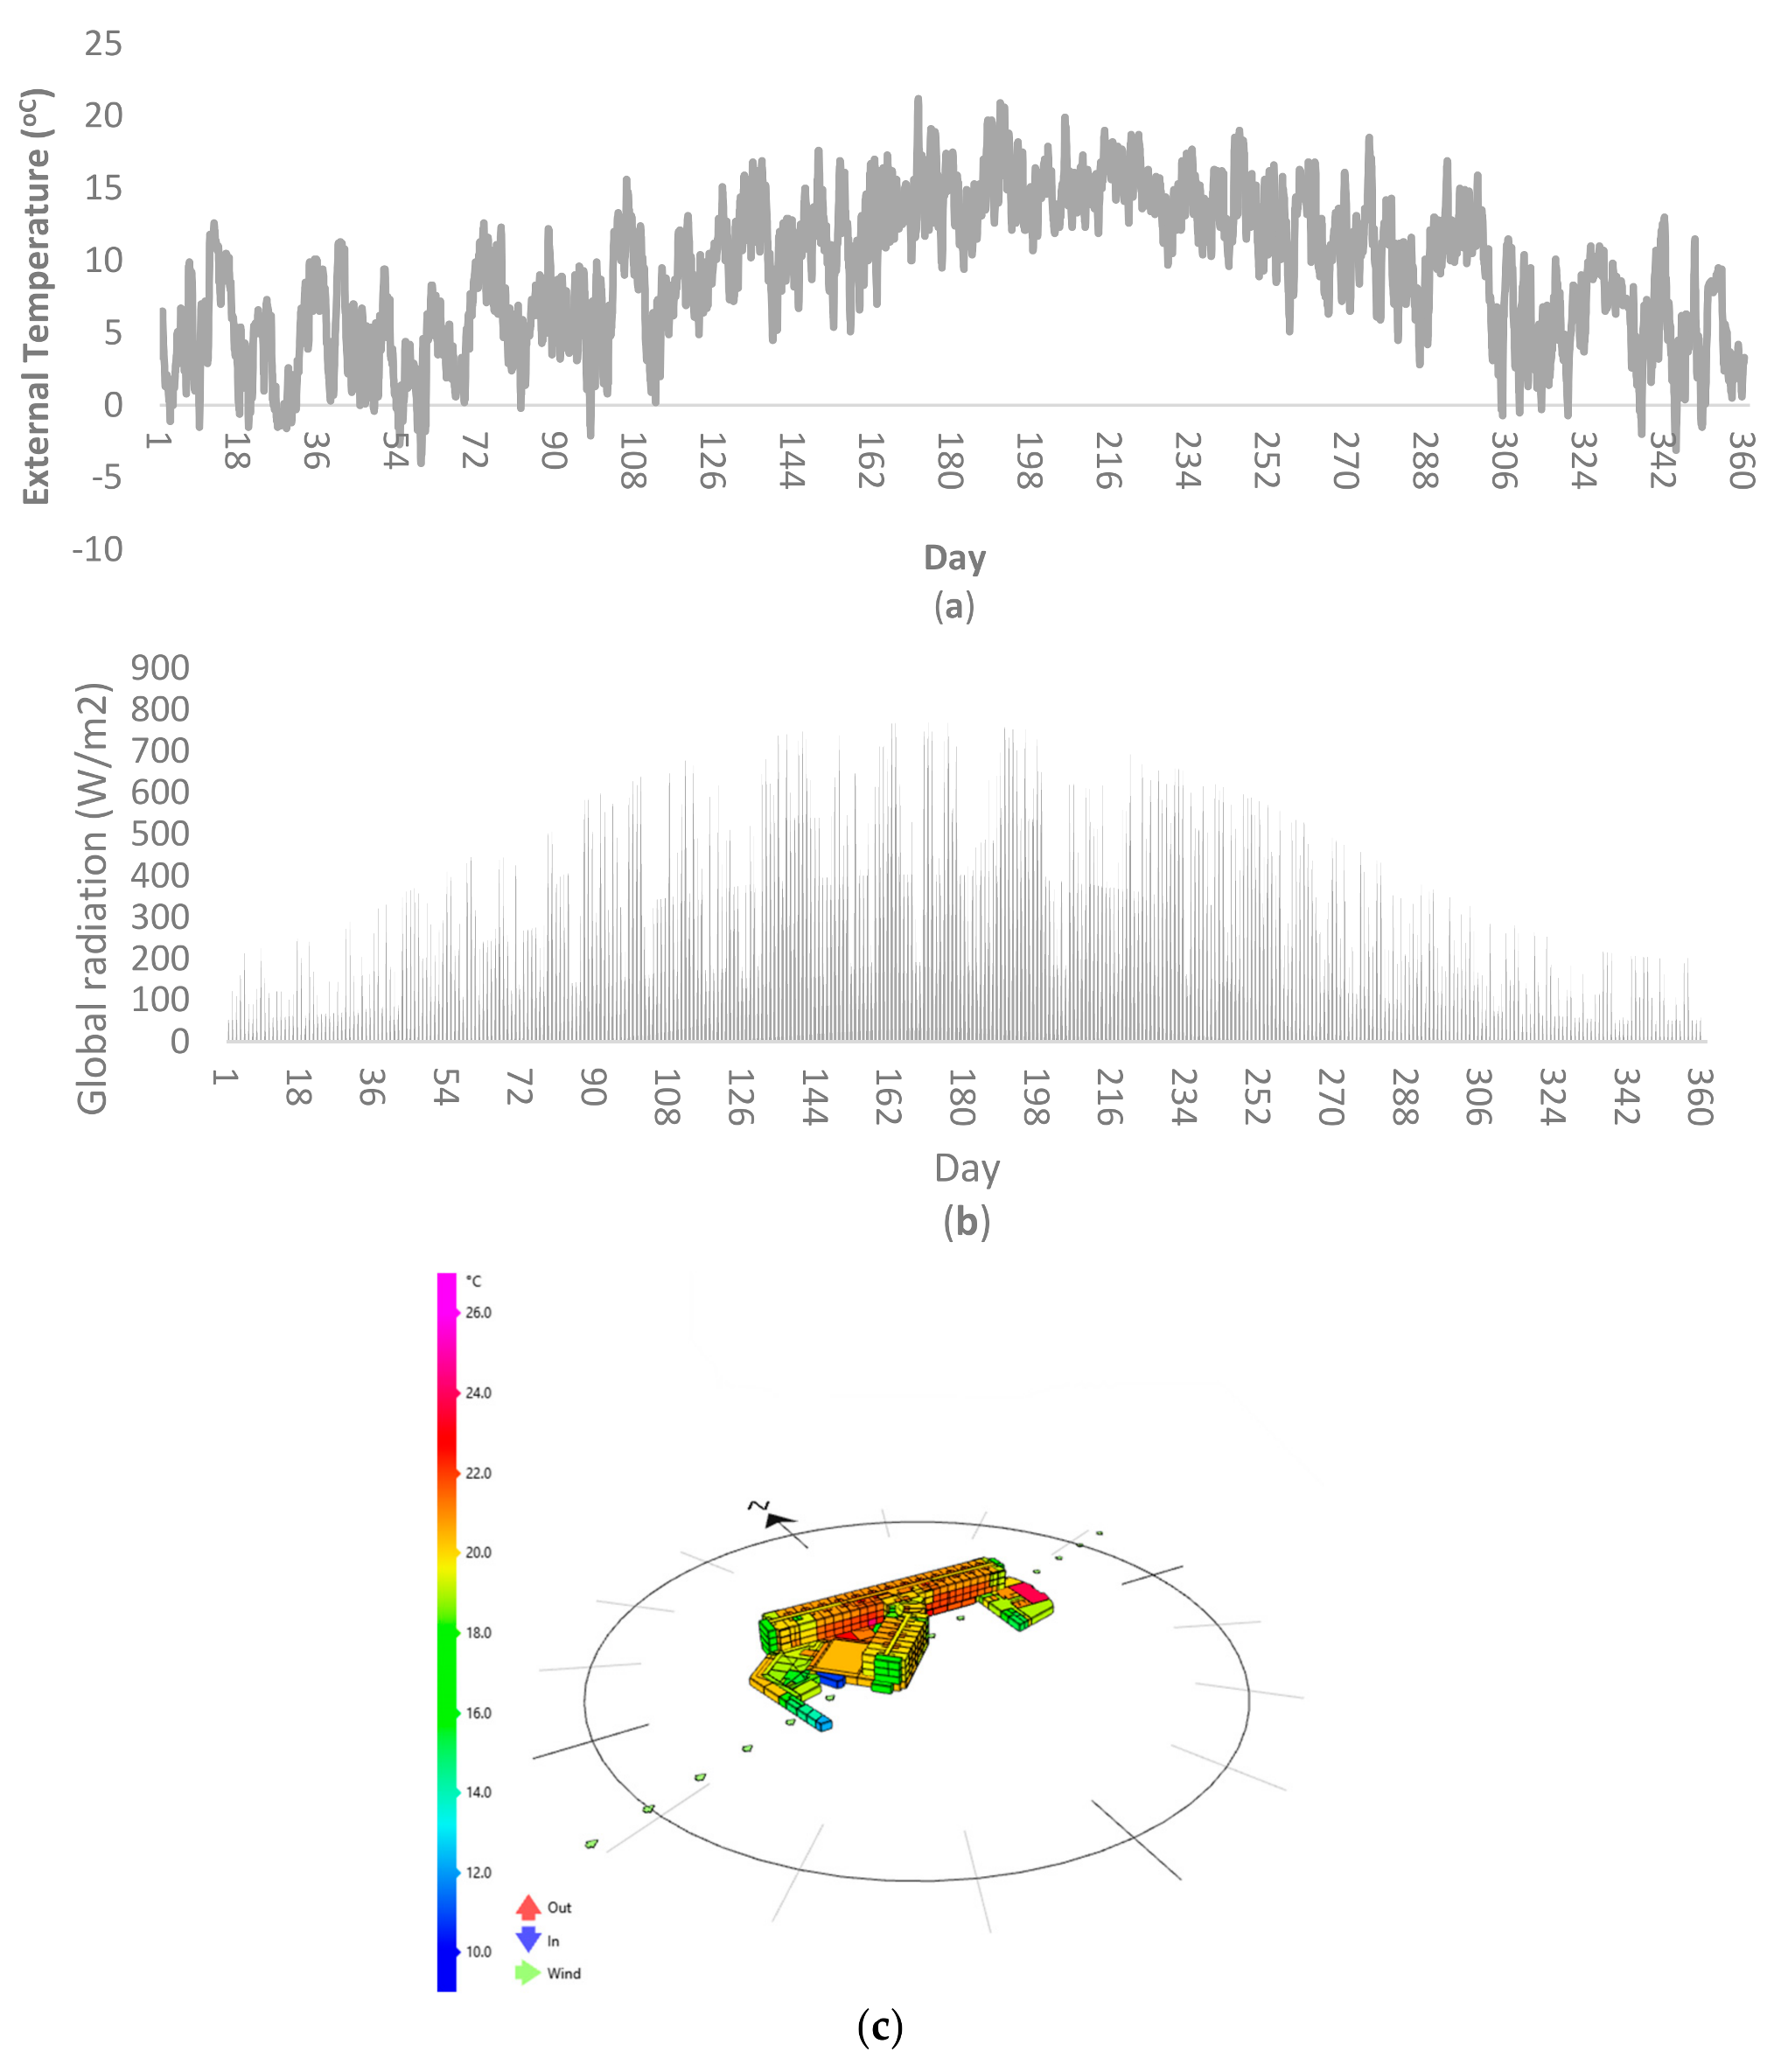
  • Fully adopting the CIBSE TRY weather files without any alterations and assuming that they are valid and relevant to the microclimate of Reading.
  • Figure 2 shows the external temperature and global solar radiation of the simulation weather data and the 3D visualisation of the resultant temperature on the building case study.

3.3. Financial Analysis

Although the capital investment cost of C/CHP systems is considerably higher in comparison to conventional boilers, these systems have been proven to yield significant cost savings [37,38]. However, this is highly dependent on whether the system is implemented in an application where the heat is efficiently utilised. A payback methodology is adopted to carry out the financial analysis because this type of analysis is a useful tool in assessing the economic viability of the systems and suitability of the selected size [11,23]. Net benefits per annum is, therefore, calculated to determine whether investing in the systems is a beneficial and practical option financially. The payback period is calculated following Equations (1)–(4a) which have been adopted and reproduced from Cibse GPG 388 [39]:
P a y b a c k   ( y e a r s ) = C a p i t a l   C o s t ( £ ) N e t   b e n e f i t   p e r   a n n u m
N e t   b e n e f i t   p e r   a n n u m = s a v i n g s C o s t s
s a v i n g s = D i s p l a c e d   E l e c t r i c i t y   s a v i n g s × D i s p l a c e d   B o i l e r   F u e l   S a v i n g s
= [ E l e c t r i c i t y   O u t p u t   [ k W e × h r s   r u n ] × E l c e t r i c i t y   c o s t ] × D i s p l a c e d   B o i l e r   F u e l   [ k W t × h r s   r u n e f f i c i e n c y   o f   e x i s t i n g   b o i l e r   ] × G a s   C o s t
C o s t s = C / C H P f u e l   c o s t × M a i n t e n a n c e   C o s t
= [ G a s   i n p u t   [ k W t × h r s   r u n ] × G a s   C o s t ] × [ E l e c t r i c i t y   o u t p u t × M a i n t e n a n c e   C o s t ]
Possible grants/loans were not taken into consideration, however, the Climate Change Levy (CCL) exemption rates have been applied. CCL rates (2018) have been obtained as shown in Table 2 and incorporated into the final calculations because all the examined systems reach the threshold criteria for Good Quality CHP [40]. The CHP Quality Assurance programme (CHPQA) evaluates systems (<2 MWe) on having a Quality Index (QI) rating of at least 100, and a power efficiency greater than 20% [41,42]. The units will operate for 17 h per day between 07:00–00:00 because operating outside those hours would lead to financial losses.

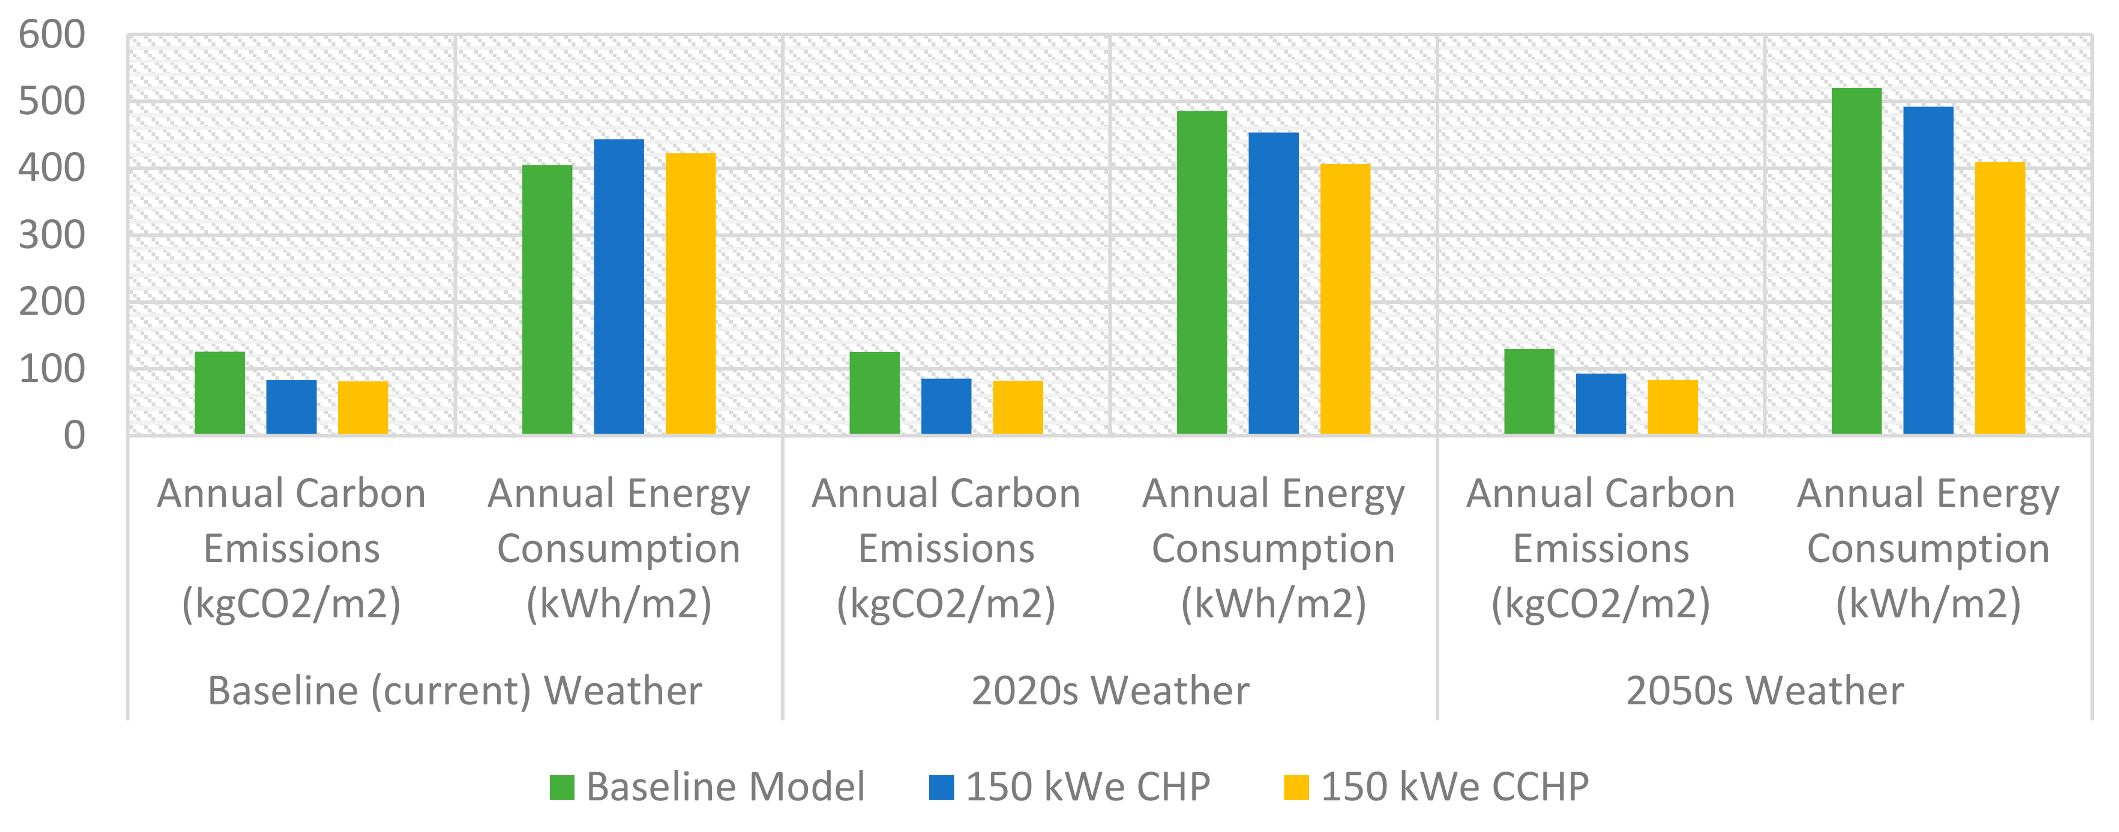
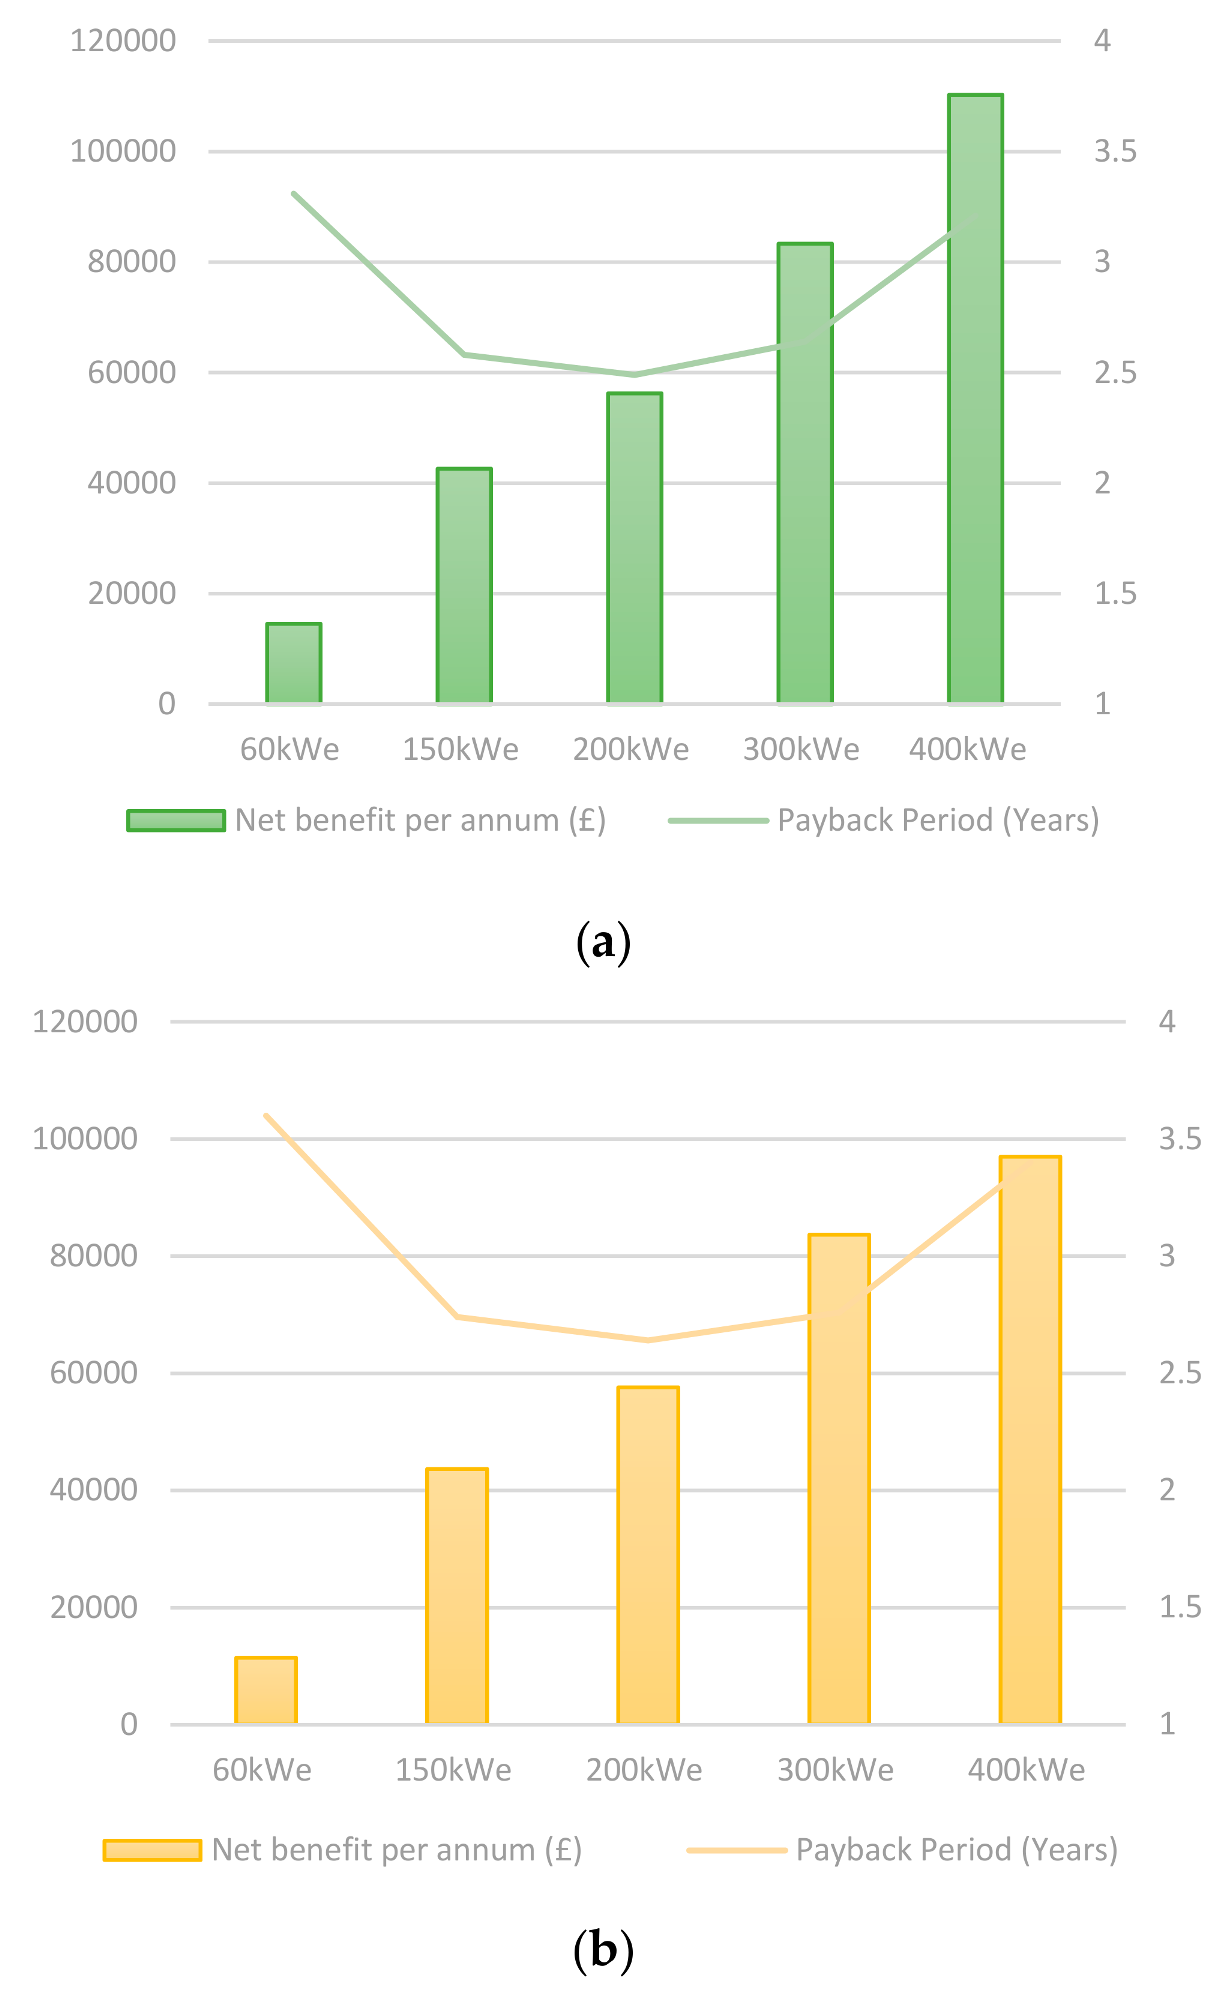
4. Results and Discussion

To evaluate the impact of the systems to be incorporated on the case-study building, the initial simulation is conducted to reflect the actual current state of the hotel without any alterations. To validate the simulation results obtained from TAS the simulated energy consumption value is compared with the actual building’s energy consumption. The simulation model was thoroughly populated to reproduce all the characteristics and systems of the building as built. The total energy consumption value considers heating, cooling, auxiliary, lighting, DHW, equipment, and is the net of any electrical energy displaced by the C/CHP generators (if applicable). The carbon emissions are calculated based on considerations, such as the type of building systems, air/plant side HVAC control(s), building envelope elements (insulation, glazing etc.), lighting/daylighting interaction(s), energy consumption, occupancy schedule, and fuel type [31]. Despite this, from Figure 3, it can be seen that the energy consumption of the baseline model obtained from TAS is lower than the building’s actual consumption by almost 30%, which is mainly due to the omission of energy uses, such as catering services. Catering services are one of the main energy-consuming activities in hotels after heating, including hot water, cooling, and, lighting [43]. This is corroborated by Rotimi et al. [44] who demonstrated that the performance gap between actual data and the simulation model can be significantly improved by considering catering energy use.
Thus, to improve the result obtained for the baseline model and decrease the discrepancy between simulation and actual consumption, the catering energy use is considered by adopting a benchmark value from Cibse TM50: energy efficiency in commercial kitchens [45]. The operational energy usage benchmark per meal served for a ‘good practice, business/holiday hotel’ facility is 1.46 kWh for electricity and 2.54 kWh for fuel. This benchmark, along with the actual average number of meals served in the hotel, have contributed to a significant improvement in the estimated energy consumption value with the percentage error being reduced to 10%.
P e r c e n t a g e   E r r o r :   353.10 445.91 353.10 × 100 = 26.28 %
P e r c e n t a g e   E r r o r   ( I n c l .   c a t e r i n g   e n e r g y   u s e ) :   404.75 445.91 404.75 × 100 = 10.17 %
Even though this 10% is an underestimation of the actual average energy consumption of the building, it should be noted that the accuracy of the simulation results also depends on factors, such as the weather data used for the simulation, which should ideally replicate the microclimate of the building’s location and actual occupancy rates. This is challenging to achieve and can lead to the variation between simulated and actual energy consumption.
After validating the baseline model, the CHP and CCHP systems were initially sized to deliver a constant base heat load for the building, as discussed previously. To do so, the breakdown of the monthly energy consumption is explored to identify the month when the base heat load consumption is likely to occur. Looking at Figure 4a it can be seen that, for both the TAS system model and actual building consumption, July has the lowest energy consumption in comparison to other months. Subsequently, the hourly heat consumption, obtained from TAS, is examined to identify the base load and select the initial system size. It is recommended that the base heat load is selected from the estimated hours of use for the unit. Therefore, looking at Figure 4b the base heat load between 07:00–00:00 h occurs at 16:00 h and is 246 kWh. Based on this, the initial system will be sized as a 150 kWe unit, which is selected by examining typical C/CHP unit ratings and matching their thermal output to the base heat load of the building [7,39]. Although the monthly heating consumption could have been examined to identify the base heat load, it is recommended for maximum accuracy that the hourly (and, if possible, half-hourly) consumption is utilised instead [39]. Once the initial size was established, smaller and larger sized systems were trialled to assess the impact this would have on the performance of the building in terms of energy consumption, carbon emissions, and for the financial analysis.
From Figure 5 the general trend observed is that as the size of the CHP and CCHP systems increase, the energy consumption of the building increases. The comparison of Figure 5a,b illustrates that incorporating a CCHP system leads to a lower energy consumption value for a similar-sized CHP system when the energy consumption of the existing chiller is considered. If the baseline building did not have an existing chiller, the energy consumption with the CCHP would have been higher. This suggests that the CCHP system is an advantageous solution when incorporated in a building with existing constant or seasonal cooling demand. On average, the CHP system contributed to a 10.4% increase in energy consumption.
Looking at the carbon emission reductions both systems contribute to considerable reductions. The average percentage decrease of carbon emissions with CHP is 32% and with CCHP it is 36%. The larger-sized systems contributed to a larger percentage of carbon emission reductions, despite the increase in fuel input, because of two main reasons: firstly, the thermal energy produced by the systems displaces combustion of the fuel that would otherwise be consumed in an onsite boiler. Therefore, a larger-sized system increases the boiler fuel emission savings; Secondly, the carbon emission production with C/CHP units considers the grid displaced electricity emission savings, therefore, as the size of the unit increases, the savings also increase [41]. Despite this, the average difference, in terms of emission reductions, between the smallest unit and the largest unit is less than 13%. Meaning that the larger systems’ contribution towards reducing emissions is not significant enough to justify their incorporation. This, in addition to the excess heat generation that occurs with the larger units, illustrates the importance of selecting an appropriately-sized unit that matches the building’s energy requirements as opposed to over-sizing or under-sizing the selected system.
Figure 6 presents the results of the performance of the building with and without the 150 kWe CHP and CCHP systems under future climatic projections. The purpose of simulating the building once again with the two systems is to consider the impact of a changing climate on key building performance parameters. The projections showed a constant increase in temperature over stipulated timelines. Whilst this caused the annual heating demand and carbon emissions due to heating to marginally decline, the cooling demand increased substantially.
It was interesting to observe that between the CHP system and the CCHP, the latter’s performance in terms of energy consumption and carbon emissions, remained unaffected under future climatic timelines. In fact, the CCHP unit’s useful power output increased by approximately 12% under future climatic projections (particularly during the summer months) with very little/no increase in fuel consumption. Looking at Figure 6 there is an increasing trend of energy consumption and carbon emissions as future timelines are simulated regardless of whether a co/tri-generation system is in place. The key findings from this were that the average percentage increase for the annual energy consumption with CHP was 13.48% and 16.65% for the 2020s and 2050s weather projections, respectively. Meanwhile, the average percentage increase for the annual energy consumption with CCHP is almost negligible; with the largest difference between the baseline weather file and the 2080s weather projection being 1.10%. A similar increasing trend in the case of the building emission rate was observed with CHP of 4.28% and 12.04% for the 2020s and 2050s weather projections, respectively. Contrariwise, the average percentage increase for the annual carbon emissions with CCHP was 0.95% and 1.62% for the 2020s and 2050s weather projections, respectively.
It should however be noted that the results generated do not consider the projected decarbonisation of the grid. According to International Tourism Partnership’s (ITP) Hotel Decarbonisation Report [46] if the ‘Sectoral Decarbonisation Approach’ scenario to meet the limiting of global temperature rise to 2 °C is accomplished, then it is expected that a 40% decarbonisation of the grid will occur by 2050. Moreover, the Department of Business Energy and Industrial Service’s (BEIS) Energy and Emissions Projection (EEP) report [47] has projected that the Grid Carbon Factor will decrease from 212 g to 66 g between 2017 and 2035. Furthermore, DEFRA [48] reported that, in 2016, it was already cheaper to run electric heating than gas heating (if using a ground source heat pump) and it is expected that, by 2020, using grid electricity will lead to lower emissions in comparison to burning natural gas on site. This may indicate that, eventually, C/CHP units will no longer make an effective contribution to reducing emissions. Nonetheless, this should not undermine the potential energy and cost benefits of incorporating C/CHP systems because it has been recognised that those systems can be seen as vital “transitional measures” that have the potential to offer significant contributions in the long-term towards a sustainable and low-emission energy system [49,50,51].
Furthermore, it is worth noting that the baseline model (without C/CHP) had a percentage increase of 30% in energy consumption from the baseline weather scenario to the 2050s weather projection. Even though the ‘medium’ emissions timeline scenario is selected and not the ‘high’. Selection of the ‘high’ timeline scenario would have contributed to an even more significant increase in energy consumption and carbon emissions. This is because of the considerable increase in projected temperatures from the ‘medium’ to the ‘high’ timeline scenario. Nonetheless, this demonstrates that the incorporation of either the CHP or CCHP system is advantageous to maintaining the overall performance of the building even under potentially different climatic conditions.
Figure 7 presents the results for the payback period calculations for all the evaluated C/CHP systems. The relationship between the payback period and the size of the system is highlighted. That is, an ‘appropriately’ sized system will lead to shorter payback periods when compared to an under-sized or over-sized system.
For both the CHP and CCHP systems, the 300 and 400 kWe units had the longest payback period in comparison to all the other units, despite the considerable savings accrued. This is because when an over-sized system is incorporated the sum of the cost increases, leading to longer payback periods. Moreover, whilst this did not occur for any of the examined systems, it is possible that a grossly over-sized system will not qualify for the CCL exemption as the QI and power efficiency will be lowered.
Despite the lower costs, the 60 kWe units had a longer payback period in comparison to the 150 and 200 kWe units because of the significant reductions in total savings which lead to reduced net benefits and longer payback periods. In addition, the need to purchase electricity and rely on supplementary heat from the boilers further decreases the energy and financial benefits.
The 200 kWe CHP and CCHP units had the shortest payback period in comparison to all the other units, suggesting that to obtain maximum financial benefits the 200 kWe system would be the most efficient solution for this hotel.
Between the CHP and CCHP units, the payback period for the CCHP units is longer. Furthermore, the comparison of the net benefits between the CHP and CCHP systems from Figure 7a,b shows that between the two systems, the CHP system offers a 5% increase in net benefits. This is because of the added capital investment costs and operating costs associated with the absorption chiller for the CCHP units.
Overall, the payback analysis indicates that regardless of which system is selected it is, in fact, cost-effective and will offer financial benefits. Furthermore, the results highlight that looking for a solution with the lowest initial capital investment cost is an inadequate indicator of actual cost effectiveness. Consequently, it is essential that the cost analysis is fully explored so that the true risks and benefits may be investigated, rather than just taking into consideration surface values, such as the initial investment, because this type of analysis does not represent the true financial viability of the measures.

5. Conclusions

The main objective of this paper was to compare the performance of CHP and CCHP systems on an existing UK hotel to assess which of the two systems offer the best solution depending on energy, financial, and carbon emissions savings. A simulation model that is simulated with five differently-sized CHP and CCHP systems was presented. The case study used is the Hilton Reading hotel, and the simulation was conducted using TAS software. The baseline model was validated with the actual building data to substantiate the accuracy of the generated model.
The incorporation of both the CHP and CCHP systems contributed to an increase in the energy consumption and a decrease in the carbon emissions. It was also clear that a CCHP system contributed to lower energy consumption values for a similar-sized CHP system, due to the decreased use of the existing chiller. On average, the CHP systems reduced carbon emissions by 32% whilst the CCHP systems led to a 36% decrease.
Simulation of the baseline model and the model with C/CHP systems under different climatic scenarios showed a progressive increase in the energy consumption and carbon emissions of the building. Currently, most of the energy consumption is a result of heating demand, which is expected due to the UK’s cold-dominant climate. However, because the most optimistic future projections quote an increase in temperatures, it is plausible that there will be a shift from high heating demand to high cooling demand. Therefore, whilst the CHP system was a viable solution under current climatic conditions; if average temperatures do rise, as projected, incorporation of a CHP unit is no longer an advantageous solution. This was clear since the CCHP unit led to a higher building performance under future timelines in comparison to the CHP unit. This, in turn, indicates the CCHP system is more appropriate when incorporated in a building located in a hotter climate/shorter wintry conditions; meanwhile, the CHP system is more efficient with longer periods of wintry conditions. It should also be noted that the type of building being assessed and its ‘form’ (architectural style, detailing, and material) will contribute to variations in results.
The results of the financial analysis demonstrate the importance of carefully selecting the size of a C/CHP system so that the true benefits can be attained rather than under/oversizing the systems and dealing with energy and cost losses. Based on the payback period, it was also apparent that, from a financial point of view, the 200 kWe system would be the best solution for this hotel.
Overall, selection of a CHP or a CCHP system will depend on several factors, in particular, the heating and cooling demand of the building. A CHP system will be more appropriate and should be incorporated in a building with considerable heating demand and moderate/no cooling demand. On the other hand, a CCHP system will be more appropriate in applications with equally considerable heating and cooling demands, and it is essential that the cooling demand is not omitted.
On a final note, to address the main limitation of the case-study methodology adopted for this paper, further research should focus on the comparison of the systems on several buildings. In this way the influence of architectural design and its significance on the results obtained may be examined.

Author Contributions

A.B.-J., A.M., P.G., and D.C. conceived and designed the project; R.S. performed the experiments and analysed the data. R.S. and A.B.-J wrote the paper. A.B.-J., A.M., P.G., and D.C. reviewed the paper.

Conflicts of Interest

The authors declare no conflict of interest.

References

  1. American Council for Energy Efficient Economy (ACEEE). Combined Heat and Power (CHP). Available online: https://aceee.org/topics/combined-heat-and-power-chp (accessed on 25 January 2018).
  2. DFIC. Cogeneration & Trigeneration—How to Produce Energy Efficiently. Available online: https://www.giz.de/expertise/downloads/giz2016-en-energy-cogeneration-trigeneration-guide.pdf (accessed on 28 January 2018).
  3. Jing, Y.; Bai, H.; Wang, J.; Liu, L. Life cycle assessment of a solar combined cooling heating and power system in different operation strategies. Appl. Energy 2012, 92, 843–853. [Google Scholar] [CrossRef]
  4. Medved, D. Trigeneration Units. Available online: http://home.zcu.cz/~tesarova/IP/Proceedings/Proc_2011/Files/Medved.pdf (accessed on 10 February 2018).
  5. Directive 2004/8/EC. Directive 2004/8/EC of the European Parliament and of the Council of 11 February 2004 on the Promotion of Cogeneration Based On a Useful Heat Demand in the Internal Energy Market and Amending Directive 92/42/EEC. Off. J. Eur. 2004, 52, 50–60. [Google Scholar]
  6. Department of Energy and Climate Change (DECC). Combined Heat and Power. Available online: https://www. gov.uk/guidance/combined-heat-and-power (accessed on 28 January 2018).
  7. DUKES. UK Energy in Brief 2017. Available online: https://www.gov.uk/government/uploads/system/uploads/attachment_data/file/631146/UK_Energy_in_Brief_2017.pdf (accessed on 3 February 2018).
  8. Arcuri, P.; Florio, G.; Fragiacomo, P. A mixed integer programming model for optimal design of trigeneration in a hospital complex. Energy 2010, 32, 1430–1447. [Google Scholar] [CrossRef]
  9. Smith, A.D.; Mago, P.J.; Fumo, N. Benefits of thermal energy storage option combined with CHP system for different commercial building types. Sustain. Energy Technol. Assess. 2013, 35, 32–45. [Google Scholar] [CrossRef]
  10. Chartered Institute of Building Services Engineers (CIBSE). Absorption Cooling. Available online: https://www.cibse.org/getmedia/5c9a9e15-5103-4b70-8aa1-1b7456fdf9a5/Datasheet-7-Absorption-Cooling.pdf.aspx (accessed on 5 February 2018).
  11. Desideri, U.; Manfrida, G.; Sciubba, E. Cost optimisation, and simulation of CCHP units. In Proceedings of the 25th International Conference on Efficiency, Cost, Optimization and Simulation of Energy Conversion Systems and Processes, Perugia, Italy, 26–29 June 2012; pp. 131–140. [Google Scholar]
  12. D’Agostino, D. Assessment of the progress towards the establishment of definitions of Nearly Zero Energy Buildings (nZEBs) in European Member States. J. Build. Eng. 2015, 1, 20–32. [Google Scholar] [CrossRef]
  13. Barbolini, F.; Cappellacci, P.; Guadigli, L. A design strategy to reach nZEB standards integrating energy efficiency measures and passive energy use. In Proceedings of the 8th International Conference on Sustainability in Energy and Buildings, Turin, Italy, 11–13 September 2016; pp. 205–214. [Google Scholar]
  14. Carbon Trust. Energy Efficiency in Non-Domestic Buildings. Available online: www.carbontrust/new/2016/08/energy-efficiency-in-non-domestic-buildings/ (accessed on 22 February 2018).
  15. Paepe, M.; D’Herdt, P.; Mertens, D. Micro-CHP systems for residential applications. Energy Convers. Manag. 2006, 47, 3435–3446. [Google Scholar] [CrossRef]
  16. Rosato, A.; Sibilio, S. Calibration and validation of a model for simulating thermal and electric performance of an internal combustion engine-based micro-cogeneration device. Appl. Therm. Energy 2012, 45, 79–98. [Google Scholar] [CrossRef]
  17. Cardona, E.; Piacentino, A.; Cardona, F. Matching Economical, Energetic and Environmental Benefits: An Analysis for Hybrid CHCP-Heat Pump Systems. Energy Convers. Manag. 2006, 47, 3530–3542. [Google Scholar] [CrossRef]
  18. Mago, P.J.; Smith, A.D. Evaluation of the potential emissions reductions from the use of CHP systems in different commercial buildings. Build. Environ. 2012, 53, 74–82. [Google Scholar] [CrossRef]
  19. Maria, U.; Jose, I.L.; Eva, A. Feasibility assessment of an Organic Rankine Cycle (ORC) cogeneration plant (CHP/CCHP) fuelled by biomass for a district network in mainland Spain. Energy 2017, 133, 969–985. [Google Scholar]
  20. Mago, P.J.; Fumo, N.; Chamra, L.M. Performance analysis of CCHP and CHP systems operating following the thermal and electric load. Int. J. Energy Res. 2009, 33, 852–864. [Google Scholar] [CrossRef]
  21. Wang, H.; Yin, W.; Abdollahi, E.; Lahdelma, R.; Jiao, W. Modelling and optimization of CHP based district heating system with renewable energy production and energy storage. Appl. Energy 2015, 159, 401–421. [Google Scholar] [CrossRef]
  22. Magnani, S.; Pezzola, L.; Danti, P. Design Optimization of a Heat Thermal Storage Coupled with a Micro-CHP for a Residential Case Study. Energy Procedia 2016, 101, 830–837. [Google Scholar] [CrossRef]
  23. Santini, E.; Romito, D.Z. Sizing and economic analysis of a trigeneration and CHP system in a commercial site. In Proceedings of the IEEE International Energy Conference, Dubrovnik, Croatia, 13–16 May 2014; pp. 1156–1161. [Google Scholar]
  24. Pedram, H.; Eshraghi, J.; Ahmadi, P.; Sattari, A. Evaluation and sizing of a CCHP system for a commercial and office buildings. J. Build. Eng. 2016, 5, 67–78. [Google Scholar]
  25. Gu, Q.; Ren, H.; Gao, W.; Ren, J. Integrated assessment of combined cooling heating and power systems under different design and management options for residential buildings in Shanghai. Energy Build. 2012, 51, 143–152. [Google Scholar] [CrossRef]
  26. Kazempoor, P.; Dorer, V.; Weber, A. Modelling and evaluation of building integrated SOFC systems. Int. J. Hydrog. Energy 2011, 36, 13241–13249. [Google Scholar] [CrossRef]
  27. Harrod, J.; Mago, P.J.; Luck, R. Sizing analysis of a combined cooling, heating, and power system for a small office building using a wood waste biomass-fired Stirling engine. Int. J. Energy Res. 2012, 36, 64–74. [Google Scholar] [CrossRef]
  28. Cuviella-Suárez, C.; Colmenar-Santos, A.; Castro-Gil, M. Tri-generation system to couple production to demand in a combined cycle. Energy 2012, 40, 271–290. [Google Scholar] [CrossRef]
  29. Wei, L.; Tian, W.; Zuo, J.; Yang, Z.; Liu, Y.; Yang, S. Effects of Building Form on Energy Use for Buildings in Cold Climate Regions. Procedia Eng. 2016, 146, 182–189. [Google Scholar] [CrossRef]
  30. Zhang, A.; Bokel, R.; van den Dobbelsteen, A.; Sun, Y.; Huang, Q.; Zhang, Q. The Effect of Geometry Parameters on Energy and Thermal Performance of School Buildings in Cold Climates of China. Sustainability 2017, 9, 1708. [Google Scholar] [CrossRef]
  31. EDSL (Environmental Design Solutions Limited). Available online: http://www.edsl.net/ (accessed on 10 February 2018).
  32. Amoako-Attah, J.; B-Jahromi, A. Impact of standard construction specification on thermal comfort in UK dwellings. Adv. Environ. Res. 2014, 3, 253–281. [Google Scholar] [CrossRef]
  33. Eames, M.E.; Ramallo-Gonzalez, A.P.; Wood, M.J. An update of the UK’s test reference year: The implications of a revised climate on building design. Build. Serv. Eng. Res. Technol. 2016, 37, 316–333. [Google Scholar] [CrossRef] [Green Version]
  34. Hacker, J.; Capon, R.; Mylona, A. TM48: Use of Climate Change Scenarios for Building Simulation: The CIBSE Future Weather Years; Cibse: London, UK, 2009; ISBN 978-19-068-46015. [Google Scholar]
  35. Marsland, C. The Role of Small Scale CHP in Energy-Efficient Buildings. Available online: http://www.modbs.co.uk/news/archivestory.php/aid/15648/The_role_of_small_scale_CHP__in_energy-efficient_buildings.html (accessed on 6 February 2018).
  36. CIBSE. CIBSE Weather Data Sets; CIBSE: London, UK, 2016. Available online: http://www.cibse.org.uk/knowledge/cibse-weather-data-sets (accessed on 9 February 2018).
  37. Gu, W.; Wu, Z.; Bo, R.; Liu, W.; Zhou, G.; Chen, W.; Wu, Z. Modelling, planning and optimal energy management of combined cooling, heating and power microgrid: A review. Int. J. Electr. Power Energy Syst. 2014, 54, 26–37. [Google Scholar] [CrossRef]
  38. Maraver, D.; Sin, A.; Sebastian, F.; Royo, J. Environmental assessment of CCHP (combined cooling heating and power) systems based on biomass combustion in comparison to conventional generation. Energy 2013, 57, 17–23. [Google Scholar] [CrossRef]
  39. CIBSE Good Practice Guide 388 (GPG). CHP for Buildings. Available online: http://www.cwp-ltd.com/wp-content/uploads/2012/03/UKGoodPracticeGuide.pdf (accessed on 9 February 2018).
  40. UK GOV. Climate Change Levy Rates. Available online: https://www.gov.uk/government/publications/rates-and-allowances-climate-change-levy/climate-change-levy-rates (accessed on 11 February 2018).
  41. Carbon Trust. Cogeneration & Trigeneration. Available online: https://www.carbontrust.com/media/19529/ctv044/ (accessed on 3 February 2018).
  42. Burns, C. CHP QA—How to Achieve ‘Good Quality CHP’ and Gain Access to Fiscal Incentives. Available online: http://chpblog.energ-group.com/managing-cogeneration-emissions-and-compliancem/ (accessed on 4 February 2018).
  43. HES. Analysis on Energy Use by European Hotels. Available online: http://hes.unwto.org/sites/all/files/docpdf/analysisonenergyusebyeuropeanhotelsonlinesurveyanddeskresearch2382011-1.pdf (accessed on 6 February 2018).
  44. Rotimi, A.; Bahadori-Jahromi, A.; Mylona, A.; Godfrey, P.; Cook, D. Estimation and Validation of Energy Consumption in UK Existing Hotel Building Using Dynamic Simulation Software. Sustainability 2017, 9, 1391. [Google Scholar] [CrossRef]
  45. Chartered Institute of Building Services Engineers (CIBSE). Energy Efficiency in Commercial Kitchens; CIBSE TM50; Chartered Institute of Building Services Engineers: London, UK, 2009. [Google Scholar]
  46. International Tourism Partnership (ITP). ITP Global Hotel Decarbonisation Report. Available online: https://www.tourismpartnership.org/blog/itp-carbon-report-provides-hotel-sectors-goal-mitigate-climate-change/ (accessed on 17 February 2018).
  47. Department for Business, Energy and Industrial Strategy (BEIS). Energy and Emissions Projections. Available online: https://assets.publishing.service.gov.uk/government/uploads/system/uploads/attachment_data/file/671187/Updated_energy_and_emissions_projections_2017.pdf (accessed on 20 February 2018).
  48. DEFRA, Government GHG Conversion Factors for Company Reporting. Methodology Paper for Emission Factors. Available online: https://assets.publishing.service.gov.uk/government/uploads/system/uploads/attachment_data/file/553488/2016_methodology_paper_Final_V01-00.pdf (accessed on 18 February 2018).
  49. Hawkes, A.D. Estimating marginal CO2 emissions rates for national electricity systems. Energy Policy 2010, 38, 5977–5987. [Google Scholar] [CrossRef]
  50. Harrison, J. The Role of Micro CHP within a Decarbonizing Energy System. Available online: http://www.decentralized-energy.com/articles/print/volume-12/issue-4/features/the-role-of-micro-chp-within-a-decarbonizing-energy-system.html (accessed on 24 February 2018).
  51. Staffell, I. Measuring the progress and impacts of decarbonising British electricity. Energy Policy 2017, 102, 463–475. [Google Scholar] [CrossRef]
Figure 1. Typical floor plan and TAS 3D modelling results of the hotel building.
Energies 11 01219 g001
Figure 2. (a) External temperature and (b) global solar radiation of the simulation weather data, and (c) 3D visualisation of the resultant temperature on the building case study.
Energies 11 01219 g002
Figure 3. Annual energy consumption of TAS baseline model against actual building consumption.
Energies 11 01219 g003
Figure 4. (a) Model monthly energy consumption and actual building energy consumption and (b) Model July hourly heat consumption.
Energies 11 01219 g004
Figure 5. (a) Comparison of the performance of various sized CHP and (b) CCHP systems in terms of energy consumption and emissions.
Energies 11 01219 g005
Figure 6. Comparison of building performance for baseline and future climatic scenarios without C/CHP against with CHP and CCHP.
Energies 11 01219 g006
Figure 7. (a) Comparison of net benefit per annum and payback calculation for CHP and (b) CCHP.
Energies 11 01219 g007
Table 1. Summary of the modelling and simulation assumptions.
1a. Building Fabric & Fuel Source Data
ElementUa-calc (W/m2K)
Wall0.35
Floor0.25
Roof0.25
Windows2.67
Doors1.30
Air permeability rate (m3/h/m2 @50 Pa)5.0
Ua-calc = Calculated area-weighted average U-values (W/m2K)
- Fuel Source: Natural gas—CO2 factor, 0.216 Kg/kWh
- Grid Supplied electricity—CO2 factor, 0.519 Kg/kWh
1b. NCM Internal Conditions Database
ZoneOccupancy Levels, People Density, Lux Level
Car Park0.0059 person/m2, 100 lux
Bedroom0.094 person/m2, 100 lux
Toilet0.1188 person/m2, 200 lux
Plant Room0.11 person/m2, 50 lux
Changing room0.112 person/m2, 100 lux
Reception0.105 person/m2, 200 lux
Hall0.183 person/m2, 300 lux
Food prep/kitchen0.108 person/m2, 500 lux
Eat/Drink area0.2 person/m2, 150 lux
Office0.106 person/m2, 400 lux
Meeting room0.094 person/m2, 100 lux
Swimming pool0.14 person/m2, 300 lux
Gym0.14 person/m2, 150 lux
Circulation0.115 person/m2, 100 lux
Store0.11 person/m2, 50 lux
Laundry0.12 person/m2, 300 lux
Table 2. Summary of financial assumptions.
Gas Cost (Pence/kWh)3.50
Electricity Cost (pence/kWh)10.30
Maintenance Cost (pence/kWh) [39,41]0.90
Climate Change Levy (CCL) rate for gas (pence/kWh) [40]0.203
CCL rate for Electricity (pence/kWh) [40]0.583
C/CHP installation cost (£/kWe) [39,41]500–1200
Anticipated running hours17 h per day

