1. Introduction
Bioenergy has a primary role in achieving the target set in the national Renewable Action Plans (nREAP), accounting for almost 54.5% of these [
1]. The development of the bio-based economy has resulted in an increased demand for biomass, also for non-energy purposes, so that there is a competition between the alternative uses [
2]. The bioeconomy fosters the hierarchical utilization of biomass, based on the “cascade principle” [
3]. Namely, biomass should be used according to its pyramid value (pharmaceutical and fine chemicals, food and feed, chemicals and materials, transportation fuels, power and heat). As a last resort, at the bottom of the cascade, the low-value bulk biomass should be used for biofuels and the production of electricity and heat [
4]. In this framework the evaluation of biomass availability is crucial for accurate planning for a sustainable supply of a renewable, but not inexhaustible source [
5].
The recent guidelines of the European energy strategy, transposed in the national legislation, address more and more the development of bioenergy for the predominant use of residual biomass, by-products and wastes from the agro-forest and agro-industry sectors, restricting the use of biomass specifically produced (energy crops) in compliance with strict sustainability criteria [
6]. The exploitation of agricultural residues for energy production fits fully the new vision, avoiding competition for farmland utilization.
Among agricultural residues, prunings are an important energy resource, both in quality and quantity [
7]. According to recent estimates, in Europe more than 13 million tons (over dry basis) of pruning biomass is available from the main orchards each year [
8], in Italy around 6 million tons are produced yearly (including uprooted biomass) [
9]. However, this resource is still minimally exploited due to the absence of an organized chain and, above all, a clear knowledge of its availability over time and space.
In the last years several studies have assessed the biomass potential in Europe and in Italy from agricultural residues, including prunings. Their results are often discordant or not directly comparable due to the different purposes (research oriented, decision making support), scale (national, regional, local level) and methodologies applied.
As explained by the referential EU projects BEE (BEE—Biomass Energy Europe) and CEUBIOM (CEUBIOM—Classification of European Biomass Potential for Bioenergy Using Terrestrial and Earth Observations), whose aim was to harmonize and improve the consistency, accuracy and reliability of biomass assessments, current methods use a wide range of approaches (theoretical, technical, economical and sustainable potential), methodologies (statistical or GIS based), assumptions and datasets that leads to different estimates of biomass potentials [
10].
The use of ratios in biomass production is quite extended, usually expressed in terms of production per hectare (t ha
−1) or per unit of product (kg of pruning per kg of fruit). The former is usually referred to as the residue to surface ratio (RSR), and the latter as the residue to product ratio (RPR). However, such indices represent an average of the conditions, and are extremely variable, as explained by García-Galindo et al. in 2007 and 2016 [
8,
11], which was empirically recorded in several places or obtained from the literature; their application gives a rough estimate and is not accurate of the real potential when aiming to better know the local potentials in a downscaling approach.
The amount of prunings depends, in fact, on several factors that are on one hand directly correlated to crop characteristics, such as species, cultivar, rootstock and age, and, and on the other to agronomic practices, often associated to local habits and conditions (training system, planting pattern, density, pruning methods, irrigation regime, type of soil and climate). For instance, the layout for grapevines can be extremely variable: the plants per ha may vary from 1000 in arid zones to 4000 in fertile soils, to 6000 in intensive rich soils [
12]. The density of olive orchards in the Mediterranean area varied from 70 to 150 trees ha
−1 in traditional plantations to higher densities (200–450 trees ha
−1) and higher yields, and finally, a new type of olive orchard (super-high-density hedgerow) with densities ranging between 1500 and 2500 trees ha
−1 [
13,
14].
The choice of rootstock is one of the main factors directly driving the growth and the vigor of fruit trees [
15,
16,
17]. The scion–rootstock couple determines the root-to-shoot signaling, resulting in different lengths of the shoot, degree of branching, and crown volume [
17,
18]. In apples, the Malling rootstocks (M and MM series) were of pivotal importance in producing a range of tree sizes [
15,
18]. The adoption of intensive systems in olives relies on the availability of low-vigor rootstock with high rooting ability and the ability to control scion vigor [
19,
20,
21]. However, the target of rootstock selection has been not limited to the size of the canopy, but is involved in other issues such as disease/pest resistance and abiotic tolerance [
16,
22]. Grapevines are one of the most glaring examples of the successful use of
Phylloxera-resistant rootstocks to grow susceptible varieties in presence of the destructive aphid [
16,
23]. However, recent works have emphasized in grapevines the role of rootstock in determining the response of the scion to drought [
24,
25], and different abiotic stressors [
22].
The EuroPruning Project was assigned a specific task, decided at the first stage to explore possible correlations with pruning material. The aim is to obtain regression models for different crop species or guides for zoning Europe into areas where different biomass production ratios can be applied when preparing Pan-European biomass inventories of pruning potentials [
26].
Previous works on biomass accumulation and pruning production, based on systematic sampling campaigns, have identified significant correlations with many aspects mentioned above. Velazquez-Martí and co-workers [
27,
28,
29] verified in different parcels along the east coast of Spain statistical significances for vineyards, olive trees and almonds, identifying regression models that correlated the amount of pruning, per plant or per hectare, with the irrigation regime, age, plant height, diameter of the crown, diameter of the stem, growing space per tree, fruit production, etc.
The scope of the work done under the EuroPruning Project is at a much higher hierarchical level with a top-down approach by using biomass production ratios observed by third parties in several countries of Europe, aiming at obtaining relevant correlations and confidence regression models. In particular, the present work analyses the subset of data obtained for the Italian territory. The approach is similar to some other studies that tried regression models for herbaceous crops, such as the ones performed by Scarlat et al. in 2010 and 2011 [
30,
31], which carried out correlations and regression analysis to determine the total straw from cereal and sunflowers accordingly to the yield of the main product (grain and seeds, respectively), based on literature publications of third authors.
Crop yield depends upon specific local agro-ecological conditions (climate, precipitation pattern, soil properties, etc.), plant varieties, farming techniques, and more [
32]. Its correlation with residual biomass allows in a way to account for reality, but not enough for a downscaling analysis, being only one of several crops and site specific aspects that can influence the pruning production.
In Italy, the methodology developed in 1994 by AIGR (today known as the AIIA—Italian Agricultural Engineering Association) and ENEA (the Italian National Agency for New Technologies, Energy and Sustainable Economic Development) is widely utilized to assess agricultural residues, both at NUTS-2 (Nomenclature of territorial units for statistics) [
9,
33] and NUTS-3 level [
34,
35]. It is based on crop-specific residue to product ratio. Although RPR is a better approach than RSR in regard to lower variability [
11], depending on the scale of the study the utilization of the same mean value per species can gives an unreliable estimation, particularly in a country such as Italy with extremely variable conditions from north to south.
The present study has the ambitious purpose to improve the estimations through the use of site specific RSR values. Namely, two regression models, respectively for vineyards and olive trees, have been built, allowing the calculation of a specific residue to surface ratio for each Italian province.
3. Results and Discussion
3.1. Direct Survey and Literature Analysis
A total of 14 surveys were filled by farmers (10) and by experts (4). The survey included: olive groves (3), vineyards (3), hazelnuts plantations (1), peach (2), citrus (2), plum (1), and apple orchards (1).
The overall analysis of the surveys pointed out a great variability among crops and within the same crop, for the amount of pruning due to differing crop management (training system and planting pattern) and climate conditions (from North to South) (
Table 1). Regarding the destination of the prunings, in most cases they were shredded and left on the soil or piled and burnt in the field. Occasionally they were used as local firewood.
Concerning the literature review, a total of 14 works, 13 scientific articles and 1 technical report not yet published, have been analyzed. The review showed that information gaps are quite usual. In most of cases, authors did not report sufficient data to carry out the statistical analysis. For instance, some authors did not publish site of collection, variety of crop, or crop layout. In those cases, the new information gathered through direct contact with authors have integrated the literature analysis in order to fill these gaps.
In seven articles the data referred to commercial harvesters (balers or chippers) tested in different orchards and places [
39,
40,
41,
42,
43,
44,
45]; in one case it was used a prototype [
46]. The amount of pruning was calculated taking into account the performance of the machines (harvesting efficiency) reported in the articles or by asking the authors. In the last six works, data was directly collected in the field on sampling plots [
47,
48,
49,
50,
51].
The crops analyzed were: vineyards (7), olive trees (6), apple (3) and pear orchards (1). The data was collected in the North of Italy from five works, from seven documents in Central Italy and from three documents in the South.
The outcome suggests a great variability of the residue to surface ratio (RSR). Regarding the vineyard, it ranged from 0.11 t ha
−1 [
45] to 7.11 t ha
−1 [
49]. Olive tree values went from 0.6 t ha
−1 [
40] to 7 t ha
−1 [
47], whereas the apple ranged from 1 [
51] to 9.8 t ha
−1 [
42].
Moreover, the analysis shows a wide range of varieties, training systems and densities for each species. The studies account for more than 10 different varieties of vineyard. The training system is in most cases the “espalier”, while the density ranges from 2600 to 6200 plants per hectare. Six different varieties of olive have been analyzed, in all cases with the traditional training system of the “vase”, but with density ranging from 100 to 550 plants per hectare.
Seven different varieties of apple have been studied, in part cultivated with the traditional “espalier” system, and in other cases with intensive systems such as the “slender spindle”, with density ranging from 700 to 3500 plants per hectare. Two varieties of pear tree have been analyzed, with the traditional espalier plantation and density ranging from about 1200 to 1400 plants per hectare.
3.2. Database Implementation
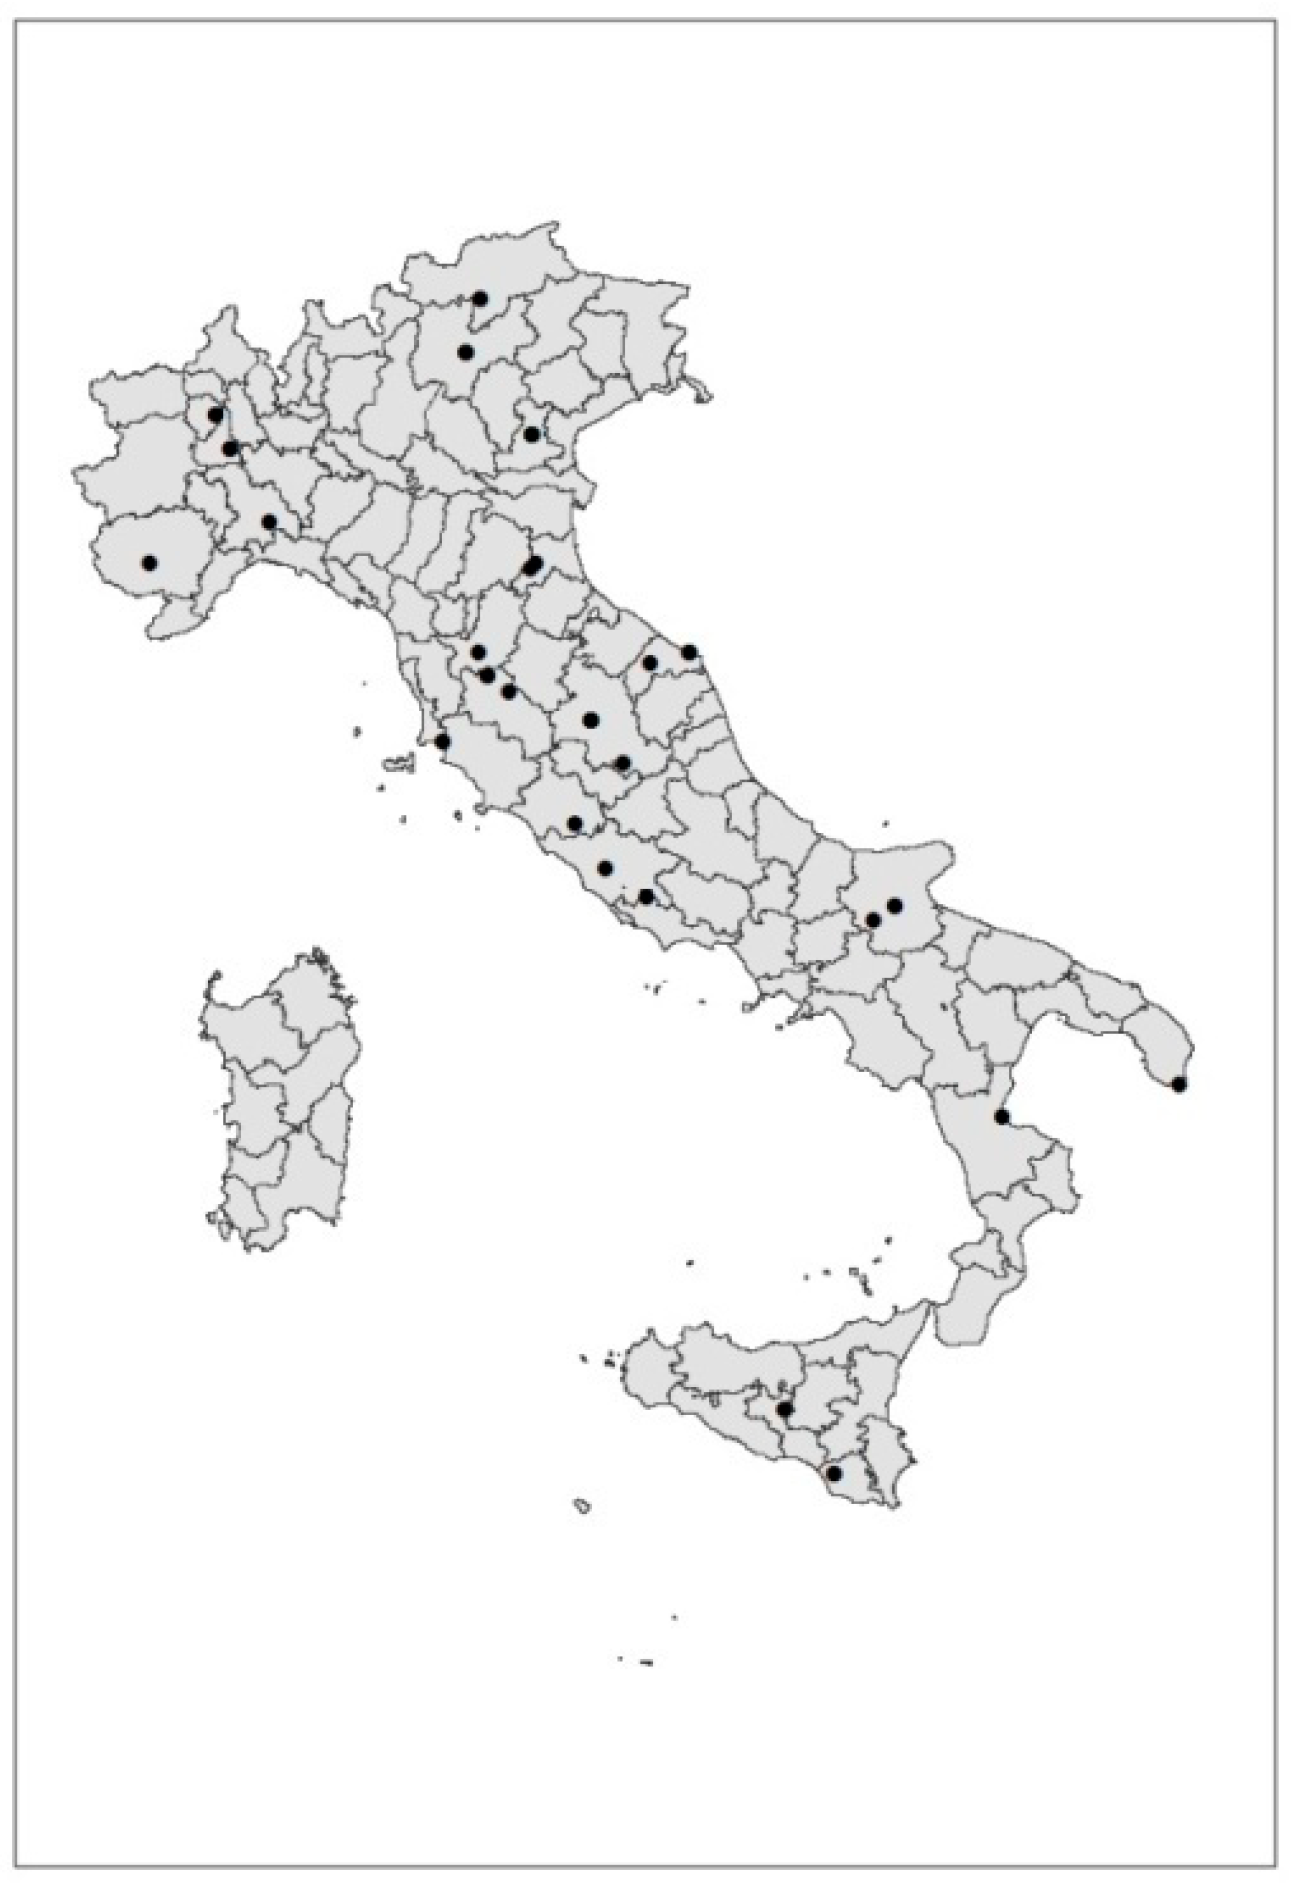
A database with 65 valid records was built, 8 obtained from work surveying and 57 from literature research (
Table 2). Incomplete or unreliable records were discarded. Moreover, the crops with too few records to be used in any model (namely 2 records for stone fruit, 2 for citrus and 1 for hazelnuts), were excluded by further analysis. The records ready for statistical analysis refer to 23 geographic positions (
Figure 2).
Each record includes the pruning yield and 8 agronomic variables obtained from survey and literature reviews, and 28 agro-climatic variables selected from open data sources as explained in
Section 2.1.3 (
Table 3). Uncertain variables like cultivar, though relevant in determining the pruning yield, were not included. The uncertainty was due to the goal of the reviewed articles, which focused on the harvesting mechanization rather than specific agronomic aspects.
3.3. Correlation and Regression Analysis
A correlation analysis has been produced only for vineyard, olive and pome fruit crops, since the data recorded for the other crops were not sufficient (see
Table 2).
In general, according to the Spearman correlation, the level of association has shown only weak to moderate correlations between pruning potential (the dependent variable) and some proposed explanatory variables.
According to the limits of the Spearman’s coefficient reported in
Section 2.2, the correlations found for vineyards were weak to moderate, ranging from 0.355 to 0.481. Only the intensification factor corresponds to data obtained from the fields. The rest is related to agro-climatic variables.
Beyond the intensification, the analysis did not show any correlation in olives. No statistically significant correlation between variables has been found. However, some results are presented in
Table 4, since their correlation coefficient was weak to moderate.
In fact, in this study correlations were not expected to be strong or very strong, but the main aim was to find some degree of correlation, suggesting that the pruning production can be partially explained by one or several of the proposed explanatory variables. Moreover, the strength of the correlation coefficients depends on the scope of the analysis and type of field of science. In dendrometric studies, for example, a correlation factor ρ > 0.9 could be expected. In social sciences however, correlations of ρ > 0.5 can be considered already relevant [
54].
In our case, acknowledging that intensification was affected by factors with a social profile, such as local preferred training system and management methods (irrigation regime, pruning methods and degree of cutting), the results are remarkable.
Intensification in olives shows a negative correlation, meaning that the more the plantation is intensified, the lower the biomass production. It’s possible that olive varieties selected for intensified plantations in higher density have less vigor and dedication to wood production than traditional varieties.
Also in the case of pome fruit trees, no statistically significant correlation was present. Only two climatic variables showed some acceptable correlation with the biomass production ratio; the agro-climatic potential and the Ecocrop suitability index.
The values obtained for the Spearman correlation factors are weak to moderate, ranging 0.3 to 0.48. The corresponding R2 values range from 0.09 to 0.23. This means that regression analysis will probably lead to poorly fitted regression curves. In actuality, Spearman’s rank correlation test is a nonparametric method which does not carry any assumptions about the distribution of the data. It is useful when data are not distributed according to a normal distribution and/or in the presence of very small samples (7 to 30 pairs of data). However, it is known that small samples can increase the imprecision of the estimate. This may increase the likelihood of obtaining false negatives, i.e., the absence of an effect that could really be present. In the case of olive and pome fruits the sample size could have generated such an effect.
The regression models were tested, and they were not reliable for the intensification factor. For the agro-climatic variables ACP_ab and Ecocrop_wclim the models demonstrated independence, linearity and heteroscedasticity. However, they failed to show a normal distribution of residues.
Since the field parameters vary from record to record, while the agro-climatic ones vary according to the resolution of the data sources (5 arc-minute grid-cell resolution, that is cells of about 50 km2 size), the database has been restructured, in order to improve the correlation with the climatic factors.
The biomass production ratios of the records falling into the same grid-cell have been combined in a single record with an average value.
The size of the aggregated database is shown in
Table 5. The sample size has been quite reduced in the case of vineyards, in which records are distributed in 10 different cells, and pome fruit, which were sited into only two grid-cells.
As a result of the sample size, bivariate correlation analysis has been done only for vineyard and olive crops, to find relations between biomass yield and climatic variables. The results of the correlation are summarized in
Table 6 for vineyards and olives. There is an observed improvement in the agro-climatic parameters provided by the ECO-CROP database, achieving a good correlation level for vineyards. In the case of olives, the improvement was only quite marginal, and the correlation analysis failed the confidence test.
According to the results of the correlation analysis, a regression analysis has been carried out for vineyards and olives. The biomass yield is the dependent variable, whereas the Ecocrop suitability index is the independent. The results of the model are shown in
Table 7 and
Table 8.
For vineyards, the regression model provides a good fitting, with R2 = 0.662, meaning that the linear model explains 66% of the variability in the quantity of biomass produced. This is a good value, considered the high variability and scale of the work done. It is also a limited result, since the sample size is only 10 points. The absolute standard errors are 0.323 t d.m. ha−1, which represent the error for the prediction obtained by using the linear model. The model confidence is not fully accomplished (sig = 0.04), even though this is quite within the limit to be accepted as statistically of confident. Independence is accomplished according to the Durbin-Watson statistical analysis. Heteroscedasticity was also accomplished (scatter plot of standard residues and the forecasted values did not show any tendency). The standard residues do not follow a normal distribution. Consequently, the regression model obtained fulfils only partly the hypothesis for being consistent. Hence, the regression analysis results should be taken with caution.
Another regression model has been built for olives in relation to Ecocrop variable. Following the discussion for the previous regression model, the results should be taken with caution for the regression model obtained.
Both regression models improve the results that were obtained by the implementation of regressions to the complete database without averaging by climatic grid-cell. Therefore, it has been considered that for implementing correlations with agro-climatic data, the use of the equations presented in
Table 7 and
Table 8 are very relevant.
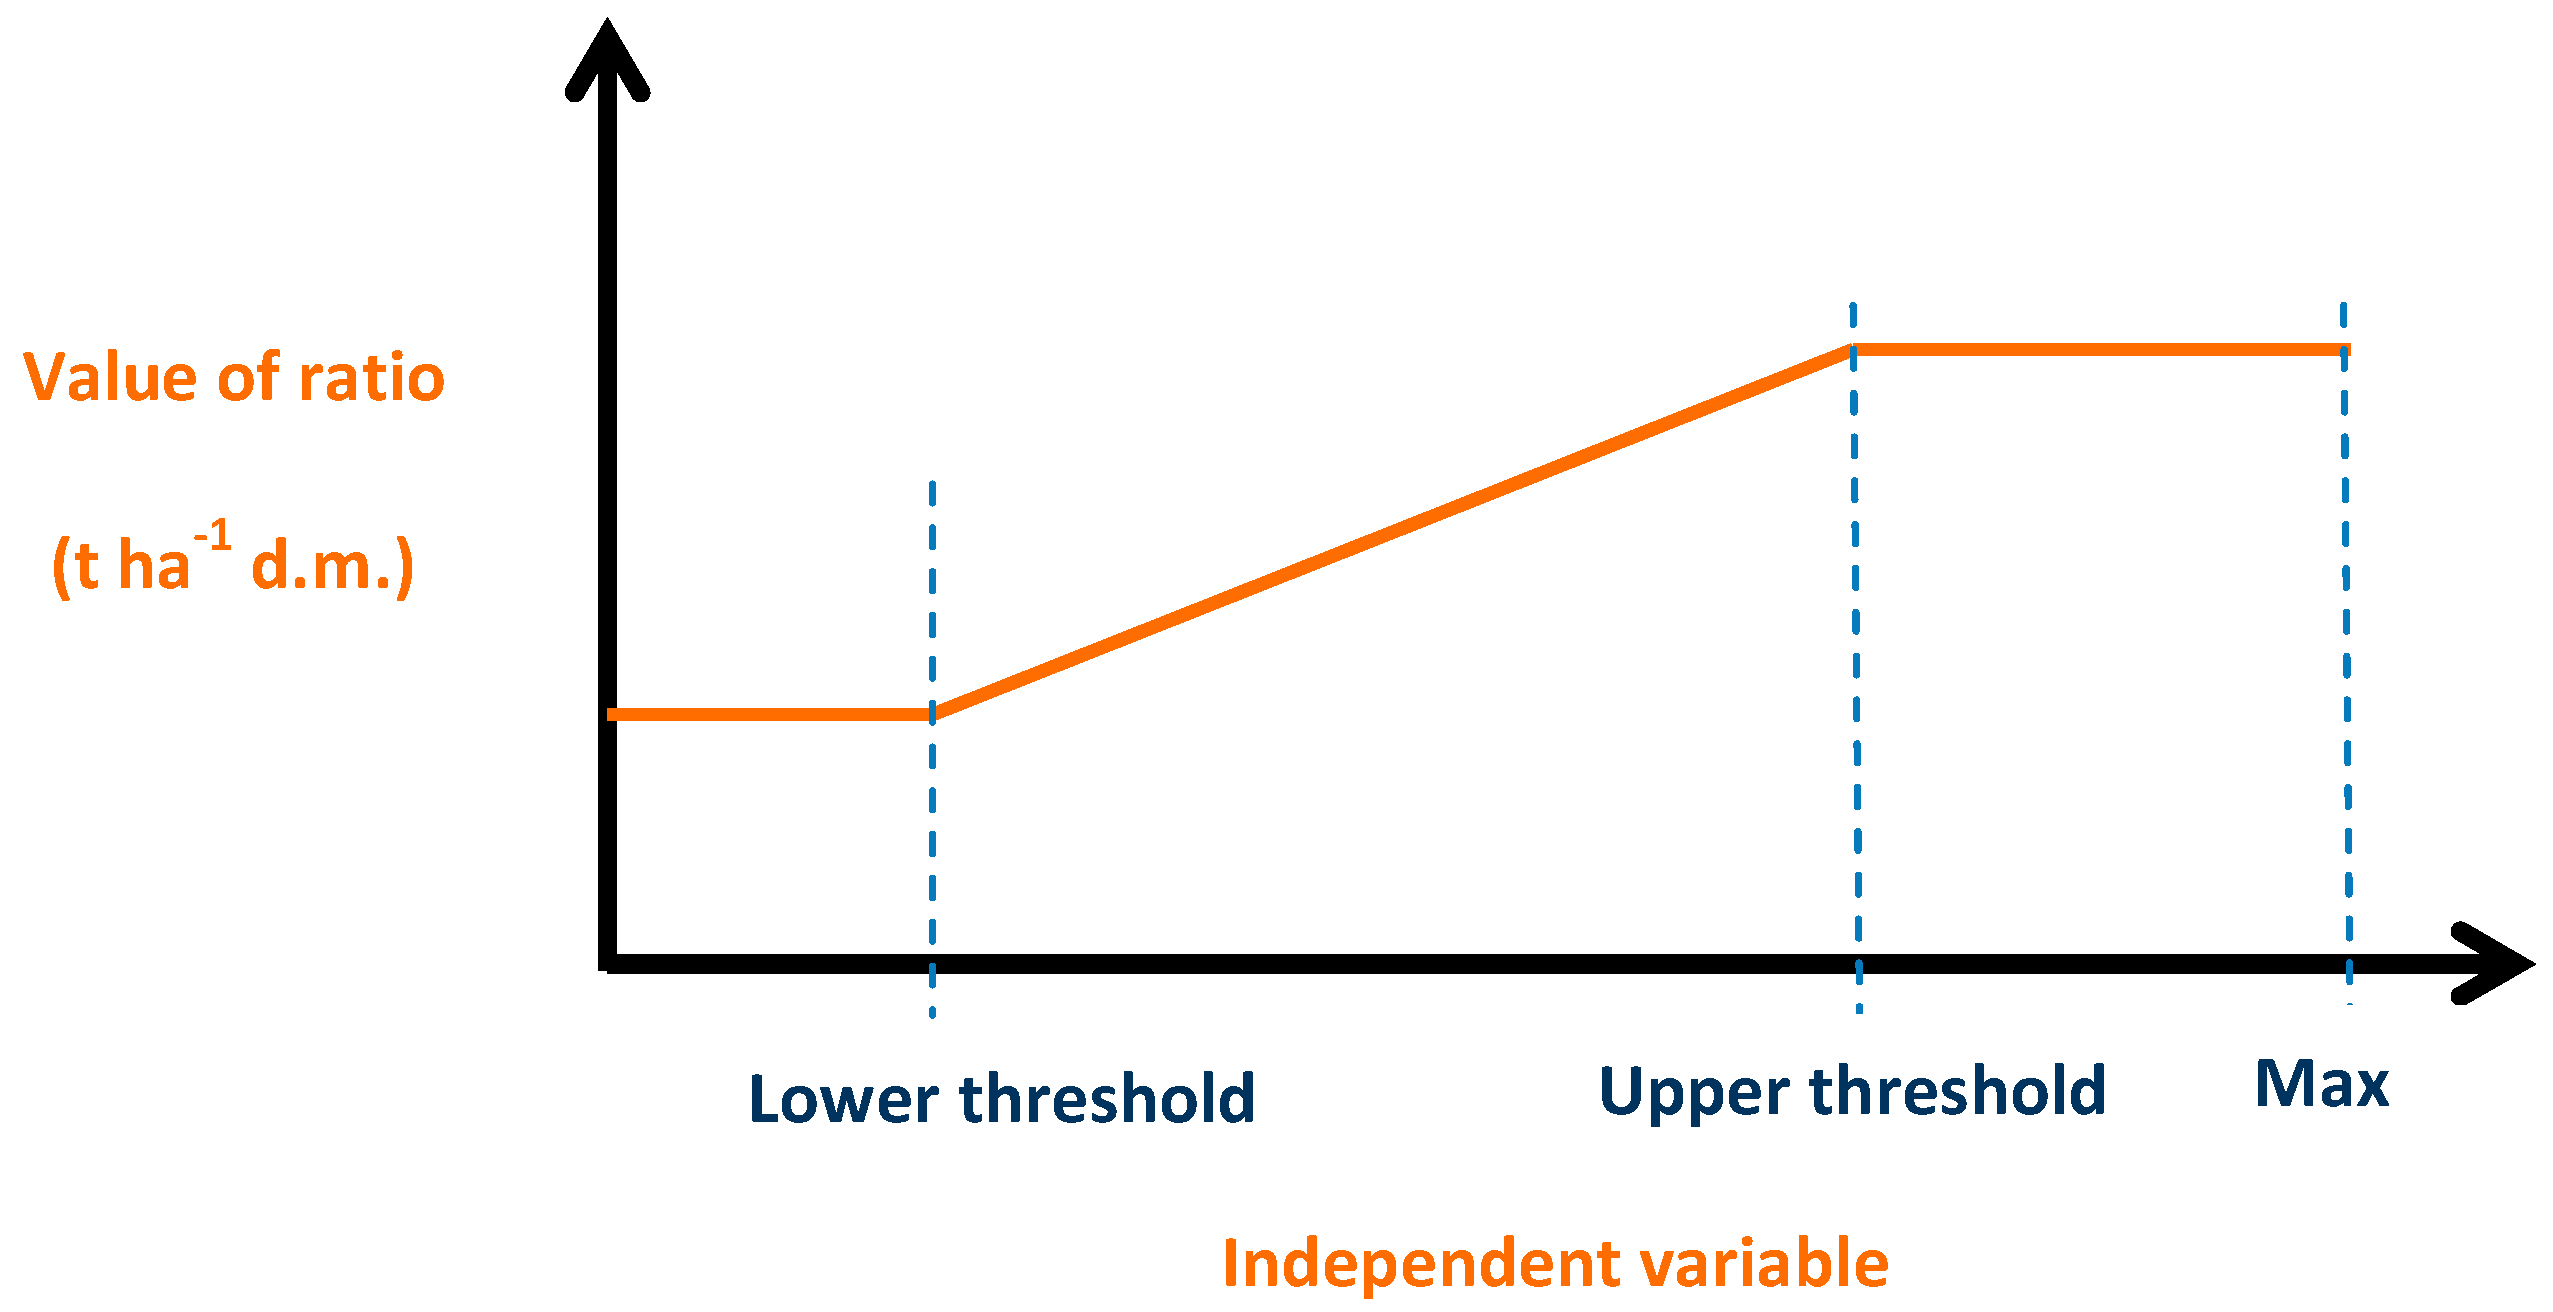
In order to calculate the average ratios for pruning residues, the previous linear regression equations have been utilized to create ramp functions. The aim is to avoid extrapolation and projections out of the values predicted by the sample. Ramp function has been defined on the base of the lower and upper thresholds, defined by the values of the regression equation for low and upper values of the Ecocrop value for the sample (
Table 9).
3.4. Pruning Biomass Potential for Vineyard and Olive
The average ratios have been applied in order to assess the pruning biomass potential in Italy for vineyards and olive trees. According to 2011 agricultural area, as provided at NUTS-3 level by ISTAT (The National Institute for Statistics (ISTAT) is the main supplier of official statistical information in Italy), it was assessed that there is a biomass potential of about 845 kt d.m. y−1 from vineyard pruning and about 2600 kt d.m. y−1 from olive tree pruning.
These results are not consistent with the most recent evaluations performed in Italy (
Table 10). In fact, EuroPruning assessment underestimates by 41% the vineyard pruning potential in comparison to the result found by Colonna et al. in 2013 [
9], and by 25% the findings of the ENAMA (Italian National Agency for Agricultural Mechanization) study [
55]. However, concerning olive tree pruning, the EuroPruning potential is higher than the results of the mentioned studies (respectively by 29% and 68%).
On the other hand, the same Italian studies differ with each other in the results, that are on average 30% higher in the Colonna study for both crops in comparison to the ENAMA results. In this case, beyond the different reference years, they differ mainly in methodology. The Colonna study is based on residue to product ratios (RPR), adopting the methodology developed in 1994 by AIGR and ENEA [
56], while the ENAMA study is based on RSR, according to values proposed by Di Blasi et al. in 1997 [
57].
Therefore, the EuroPruning results, not in line with the mentioned studies, should not be considered as a failure of the approach, but rather as the result of a different methodology.
In fact, as highlighted by the EU projects BEE and CEUBIOM, biomass assessment is a task performed with a wide range of approaches, methodologies, assumptions and datasets that lead to different estimates.
Nonetheless, a bigger number of direct observations on the field could improve the strength of correlation and the accuracy of the estimation in order to have stronger results.

 ,
, 

