Abstract
This paper proposes a mesh network-based communication architecture that can be used to monitor and control different elements in a microgrid. A solar Photovoltaic (PV) and storage-based, off-grid, microgrid model is designed using MATLAB Simulink. The communication mechanism between every element of the microgrid is also represented and simulated in the model developed. Basic features of monitoring and regulating the generation, and demand-side of the grid are discussed along with feedback-based measures for effective performance monitoring in the microgrid. Finally, the paper also points out a unique cloud infrastructure that can be used to store data, perform data analysis and assist in decision making in case of extreme situations. Overall, this paper proposes a simple feedback based mechanism for proactive monitoring of PV generation in a microgrid using a communication architecture powered by mesh networks.
1. Introduction
The twenty-first century is experiencing rapid technological development in numerous areas to facilitate sustainable living. Renewable energy proliferation and Internet of Things are the two of many such areas, where significant progress is being achieved. With the increase in the intensity of renewable proliferation and its injection into utility grid, monitoring the assets that produce the energy and continuously evaluating the parameters (climatic) that dictate the performance is becoming increasingly important [1]. Researchers predict the transformation of normal electric grids into smart, next generation electric grid with renewable generation sources that will inevitably have the intersection of electrical as well as communication systems [2].
The combination of electrical and communication systems, will enable functions based on the motivation of grid, like online monitoring, demand-side management, control along with critical functions like troubleshooting an event and its immediate reporting [3]. Sood et al. [4] developed a WiMax (worldwide interoperability for microwave access)-based smart grid communication network for monitoring distributed energy generation sources. In a similar work [5], a grid-connected AC microgrid is simulated using the Simulink tool with basic communication infrastructure and a control strategy to optimize the performance in the grid is discussed. Masud and Li [6] developed and analyzed Internet of Things (IoT) based communication network for monitoring multiple distributed energy sources using Kalman filter based state estimation of the microgrid. In [7,8], an IoT-based energy management system in microgrids for improving efficiency is proposed and studied in the context of PV generation systems, while a similar energy management system in a PV/wind hybrid microgrid is simulated in [9,10] using Simulink. A self-sustaining wireless neighborhood area network is designed in [11] for transmitting power grid sensing and measuring status as well as the control messages. While Spano et al. [12] included individual energy meters into the communication network to design a holistic model for smart grid monitoring. Kristensen et al. [13] developed information access schemes between remote assets and controller, which are activated only when certain voltage thresholds are at any measurement point in the grid.
Apart from monitoring, control is one of the important features that can be made possible through smart grid when the right infrastructure is in place. Several models based on mathematical constraints of a practical grid in operation have been developed to control and optimize the performance of a microgrid. Anderson et al. [14] demonstrated the concept of “gridcloud” comprising of a wide area architecture to monitor and control a microgrid. A robust optimal control strategy for an energy storage system of a grid-connected microgrid is elaborated in [15]. For a PV-wind–diesel–battery hybrid system, Ai-barazanchi and Vural [16] developed a control mechanism by controlling the pulse width modulation (PWM) of voltage source converter (VSC). Phung et al. [17] presented a dependable control using IoT backbone for administration of the microgrid. Along similar lines, a holonic architecture is proposed in [18] and a Fuzzy-based frequency control is discussed in [19] to address the challenges of operating grid comprising of wide variety of heterogeneous producers and consumers that are unpredictable. Design, control and performance evaluation of a hybrid microgrid comprising of solar and wind is proposed in [20] using principles of power electronic operations.
Since demand-side management forms a crucial part of any grid, Yang Mi et al. [21] studied a droop control-based power sharing mechanism in a microgrid and supported it through Simulink simulations. A voltage sensor combined with current estimation algorithms were proposed and discussed for load management in [22]. A game-theory-based, flexible control of demand using proportional allocation was proposed in [23] for an autonomous grid operation. Emphasizing on the stability of microgrids, Krisminato et al. [24] developed a comprehensive small-signal model of hybrid renewable-energy-based microgrid to observe its performance. Since the inculcation of communication makes the smart grid vulnerable to cyberattacks, it is equally important to consider the privacy and security aspects of the grid. There are established standards [25] along with case specific attack solving tools [26] to effectively address this aspect.
In this paper, simple microgrid architecture is discussed for application in rural areas without electricity access. A mesh network-based microgrid communication is developed and simulated to facilitate the data transfer from both generation and consumption nodes. A local database is designed for integrating the information from all the elements in a single platform. The data from PV performance and battery status is used to create a rule base for effective operation, where the operator of microgrid is notified whenever there is a discrepancy or deviation from established rules like minimum battery level and ideal PV performance. Finally, the microgrid and feedback mechanism are simulated in Simulink and the results are presented. The novelty of this research work is a simple yet effective proactive monitoring system that is aided by state-of-the-art communication infrastructure of mesh networks. The existing state-of-the-art systems only define communication architecture and its principles for effective data flow. However, this research work uses the defined communication architecture not only for mere data transfer but also provides proactive monitoring alerts to the operator. The performance computation, comparison to the ideal scenario and feedback-oriented monitoring application are unique contributions of this research work. This work can be expanded to applications like intelligent control, demand-side management or integration into utility grid.
With the advent of fourth industrial revolution it is apparent for the grid administration to turn digital. Research is ongoing on inculcating state-of-the-art software driven hardware devices to operate, organize, and monitor the performance of the grid. The model proposed in this research work which is a combination of network characteristics as well as built-in monitoring modules is an application-oriented system whose implementation is a scalable example of digitized electricity grid. This model can be extended to applications including electric vehicle (EV) charging, peer-to-peer energy exchange or blockchain-based energy usage applications.
2. Microgrid Architecture
A basic microgrid, as represented in Figure 1 is used for the current research work.
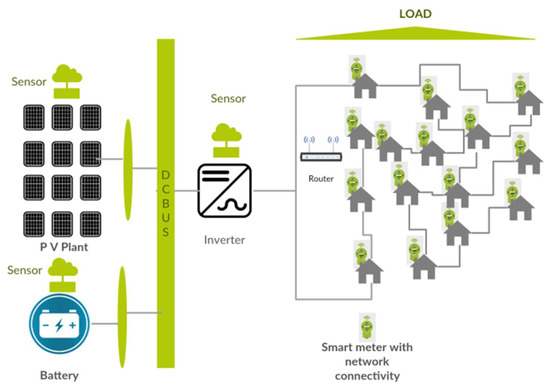
Figure 1.
Microgrid electrical configuration overview.
This microgrid consists of a solar power generation system with battery back-up. An inverter is represented after the DC bus bar, which supplies the AC power to the connected load. In a typical application, microgrids are mainly used to power rural areas without electricity access. Hence, the load characteristics considered here are strictly in lieu with typical residential electricity consumption profiles. The microgrid architecture also illustrates sensors connected to each generation node, inverter and battery. This is to facilitate monitoring and control of generation and transmission. The houses to which the grid is connected are assumed to have interactive smart meters, details about which are discussed in Section 3.
2.1. Photovoltaic System
Photovoltaic generation is connected to the DC bus through a controller powered with maximum power point tracking (MPPT). The power output of a PV generation system can be mathematically expressed as a function of Irradiance (G), Temperature (T) at a time (t) [27] as:
where,
- : Peak power of the PV installation
- : Solar Irradiance at Standard Test Condition (Usually 1000 W/m2)
- : Ambient Temperature at Standard Test Condition (Usually 25 °C)
- : Inverter Efficiency
- : Transmission (Wire) Efficiency
- : Temperature co-efficient of PV module used for the installation.
There are different models to calculate the energy generated from a PV system at a given location. The widely used expression talks about energy as a function of solar radiation data in terms of a time function for the total available day light hours on a given day. This can be mathematically expressed as:
where H is the length of the day and is represented as:
where is the Latitude of the location and,
where N is the number of the day in the year (For example, if it is 21 June, N = 172).
2.2. Battery System
The priority in any battery connected PV system for energy flow is the load. Hence, the effective energy across the battery is always the difference between the consumption at the load and generation. This can be expressed as:
If ELoad > EPV, there is deficit energy and battery is not charging
If EPV > ELoad, there is excess energy and battery is charging
The discharge state on a battery at a given time t + 1 can be expressed as [28]:
where,
- is the power discharged by the battery bank to the load during the time t
- is the time difference
- is the discharge efficiency.
While the charging status at t + 1 can be expressed as:
where,
- is the power charged by the PV system into the battery bank during the time t
- is the time difference
- is the charging efficiency.
Hence, the energy flow in the battery can be represented as:
2.3. Load Profile
A load profile for 75 households is simulated based on the consumption of energy when using equipment like electric bulbs, fans and televisions. Figure 2 represents the daily average consumption of 75 households. This pattern is generated keeping in view the usage of electricity and appliances in rural areas which have no prior electricity access [29]. A rural area in Guinea, Africa is used as an example in this research work. The load profile is created using the consumption metrics defined for any rural area in this country. The yearly average profile is illustrated in Figure 2.
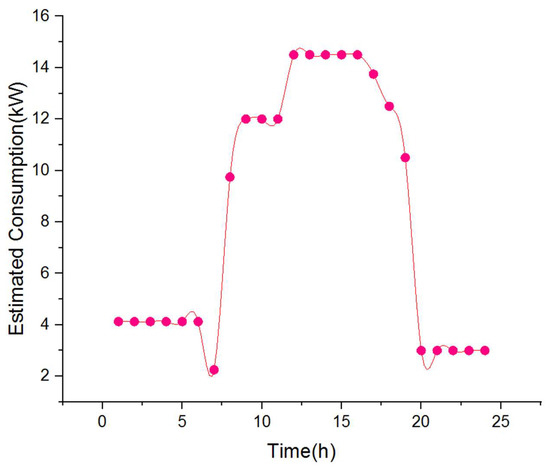
Figure 2.
Simulated load profile for a rural area.
3. Microgrid Communication Architecture
A microgrid communication is increasingly becoming multipurpose due to automation of aspects like demand-side management, generation management, load shedding (whenever necessary), event reporting and trouble shooting of malfunctioning equipment. There is a need for effective and sustainable communication architecture in a microgrid for the following reasons:
- Intermittent nature: Renewable energy sources, with the virtue of being dependent on natural elements, are known for their notorious intermittency. When the proliferation of renewable energy based microgrids is increasing, there is a dire need in continuously monitoring the weather parameters, their influence on power generation and tune the system to adapt for extreme events.
- Bi-directional flow: With the advent of smart grid, electricity consumers are no longer solely consumers but are slowly turning into prosumers (Producer + Consumer). Distributed rooftop installations and smart meters are paving way to this revolution. Hence, an integrated communication architecture that can accommodate the requests from individual installations to grid and facilitate energy transfer in any direction is necessary to have integrated communication architecture.
Hence, in this research work, communication architecture is designed keeping in view the aspects by classifying the elements into clusters. Every cluster contains either of generation or consumption elements intertwined with communication architecture and analytics functionalities. In this research work, there is two such clusters one each for generation and consumption nodes. The functional overview of the communication network developed in this research work is illustrated in Figure 3.
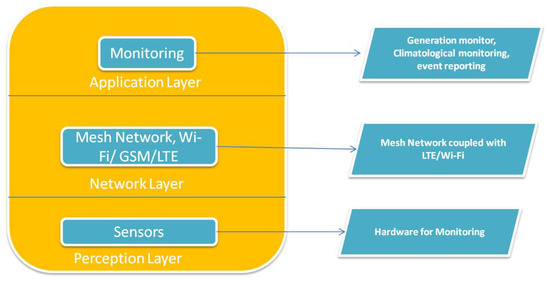
Figure 3.
Structure of the communication network.
This figure states the flow of information and working of communication network in the microgrid. Data is collected from different elements using sensors. This data is relayed through the network to a local/cloud database. Monitoring and analysis is then implemented on this database.
3.1. Sensors
The devices that require integration with sensors are inverter, PV converter, battery, individual meters, and weather station if any installed. With the advent of fourth industrial revolution, these elements are being released with at least one of the following communication interfaces: enabled Bluetooth 4.0 (BLE or Bluetooth Smart), IEEE 802.11 g (Wi-Fi), IEEE 802.3 (ethernet), GPRS (2G telecom), HSPA (3G telecom) or Modbus Remote Terminal Unit communication. Microcontrollers available today come with most of these communications enabled with built-in two-way communication. Sometimes, additional hardware can also be used with a microcontroller to facilitate communication between the elements that need monitoring. Figure 4 illustrates the communication interface capabilities of a widely used microcontroller raspberry pi, which can be used in the applications like this research work.
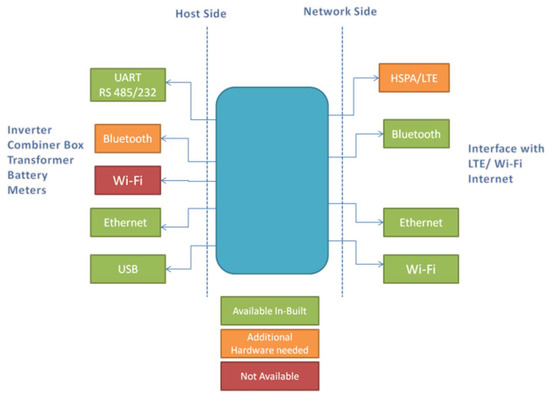
Figure 4.
Communication capabilities of raspberry pi.
3.2. Network
Due to the virtue of being spread over a large area, smart grid communication network is always a combination of different network configurations. In most cases, a home area network (HAN) gets connected to neighborhood area network (NAN) which in turn relays the data through a wide area network (WAN) to internet or desired end user.
In this research work, we consider a network configuration based on mesh network topology. A mesh topology is a topology in which all the network nodes are individually connected to most of the other nodes. There are two configurations of this topology:
- Fully connected, where all the nodes are connected to every other node.
- Partially connected, where it is not necessary for all nodes to be connected to each other.
Generally, mesh networks are preferred in short-range and medium-range communication network arrangements. However, the greatest advantage of mesh topology is that every node, can act as an individual router, hence making it easily scalable and light. By the virtue of its topology, which consists of redundant links of established communication paths between each node, the chances of communication failure are very rare. The data will always have at least one suitable path for the flow of data. The range can also be extended by simply adding a node and the messages can hop through the mesh back to the gateway, making this a robust arrangement. Finally, self-optimization is the greatest asset for mesh networks. If one route happens to be slow, a mesh network can potentially find a better route and optimize itself.
The data flow link function in a mesh network can be expressed as:
where, is the flow in channel i; and N is the number of orthogonal channels. E is the number of data connection links at a particular node. A transmission function that determines the transfer of data from a node i at time t with link l is defined as:
In a mesh network, to facilitate data transfer between different nodes, the communication should follow constraints pertaining to the principles and resources existing at the node, channel and the network. To assess the channel resource present, the link channel constraint is expressed as:
where, is total number of channels available for communication through a link l. Additionally, to use the radio resources of a node at time t, the constraint can be defined as:
where is total number of radio points available for communication through a link l.
In addition, preventing interference is critical to obtain a data that is free from noise and corruption. For example, at node α and its neighborhood C(α), if the link l in S(α) is active on channel i and s is the other node at the endpoint of the link, l is only active when all other channels on the link are idle. This constraint can be expressed as
The flow in a channel i at time t on link l is expressed as:
When we sum (18) over T,
If the mean utilization of channel is defined as which can be expressed as:
Hence, the utilization of the entire network can be defined from (19), (20) as:
The communication network in this research work for the microgrid is divided into two peripherals of individual mesh networks. On the consumption side, a short range, mesh network can be created for facilitating the communication between the household smart meters. This network is intertwined with the sensor at the inverter which is in then terminated at the internet gateway. On the generation side, the PV converter and sensors connected to the battery system are also connected in an internal mesh and through network boost equipment; they are terminated at the local database which is connected to the internet gateway. From the internet gateway, relevant data is sent to the cloud infrastructure developed for carrying out monitoring, control and optimization activities. Figure 5 illustrates the architecture of the network designed in this research work.
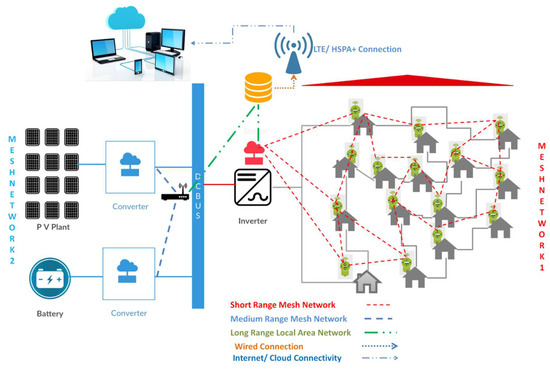
Figure 5.
Communication architecture of the microgrid.
3.3. Data Flow
Each node in the network will periodically (as frequently as once in 5 s) publishes all measurements to the local database. All data would be stored in the local database, accessible to the operator via local monitors and to others via a cloud connection. The cloud server is chosen in such a way to be capable of handling a high velocity of incoming requests from many devices that are concurrently connected—indicating a need for asynchronous, nonblocking operations. Upon login, the server shall send a response to the client (comet or long-poll architecture) to update all data and transfer more frequently.
The data will be represented block wise through an integrated monitoring platform that can be accessed through cloud. The data collected will include but not limited to the following parameters outlined in Table 1.

Table 1.
Monitoring parameters.
4. Monitoring and Performance Feedback
As per the data flow is outlined in the previous section, the data from each individual node in generation and consumption architecture gets tagged with their respective data category in the database. The same database is replicated in the cloud software present in the remote server. Software is deployed on the cloud server to illustrate the data through a user interface and performance analysis on the data received. The functionalities of the software can be broadly classified into three parts:
- Monitoring: The software reads the data with respect to the tag of the device, data category and interprets it on a user interface.
- Feedback: The software verifies the data with respect to established rules and provides feedback about the status, working or problem, if any at a particular element from the data it receives.
- Control: Through the software, functions like shutdown, current flow or switching on/off of devices can be performed.
4.1. Monitoring
The inverter, PV DC output, battery status, energy meter status are the parameters that can be monitored and can be seen in the user interface as shown in Figure 6.
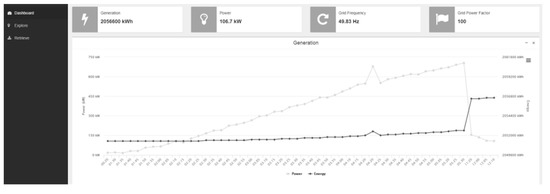
Figure 6.
Screenshot of the User Interface.
Climatological data can also be represented in the interface from the weather station installed in the location or the data can be fetched using open source weather data providing solutions. The user interface can also be customized to better understand behavior of each element by creating profiles based on contextual data from connected devices. This can help in getting a complete picture of what is happening by combining everything already known about the power generation and consumption architecture with incoming data from each of the nodes.
4.2. Feedback
4.2.1. PV Performance
Photovoltaic power generation, battery status and network strength are the three elements for which rules are established for performance monitoring. These parameters are continuously monitored for every 15 min and any related event is immediately reported. The rule base for each of the aforementioned three issues is illustrated in Figure 7.
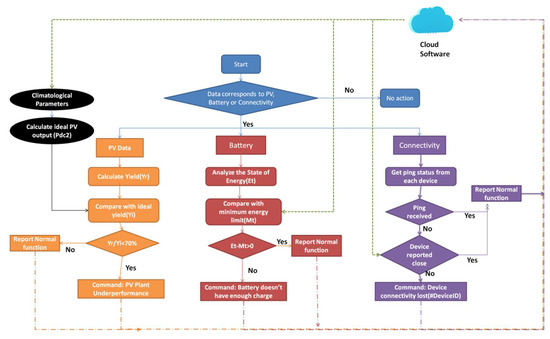
Figure 7.
Decision chart of the proposed feedback mechanism.
For a PV plant, if the climatological parameters are available, a simulation model can be used, where the real time weather parameters can be substituted in the model and estimated power output at that given point of time can be calculated. However there are tools like PVSyst [30] that can be used to obtain the data regarding ideal performance of a plant, at a given location with certain tilt angle and orientation. This can be compared with the real-time performance data to understand whether the plant is performing in an efficient manner.
The ideal performance of a PV system at a given location is the ration of total irradiance and reference irradiance. This can be expressed as:
where H is the total horizontal irradiance with units (Wh/m2) and G is the global radiation at Standard Test Conditions (STC) measured in W/m2.
It is to be noted that this value is highly dependent on the environmental variables like irradiance, temperature along with factors like orientation and location (latitude). The actual yield , is calculated from the data obtained through monitoring the inverter and is expressed as:
where, , is the energy output of the PV system in the interval considered and is the peak power of the system at STC. Performance ratio can be expressed as:
This ratio can be defined as comparison of plant output to the ideal output of the plant at irradiation, panel temperature, availability of grid, size of the aperture area, nominal power output, temperature subjected at the location of plant in the interval of measurement.
Here, a threshold of 70–75% on the P.R can be installed to check for the performance and report for under performance in a given time interval.
4.2.2. Battery Status
Checking the battery status, to monitor the state of charge and energy present is important in this case, as the system is completely off-grid. Continuously monitoring the connectivity of the nodes is also important. If any connectivity issue is reported, immediate action can be taken to prevent further damage to the network. The following expressions elaborate on the battery threshold checking mechanism included in the feedback process.
where,
- is the energy of battery at time t + 1
- is the energy of battery at time t
- is the power charged by the PV system into the battery bank during the time t
- is the power discharged by the battery bank to the load during the time t
- is the time difference
- is the charging efficiency
- is the discharge efficiency
- and are the minimum and maximum power that can be charged into the battery respectively.
- and are the minimum and maximum power discharge that can occur in the battery respectively.
- : Self-discharge energy loss of battery
- : Charge status of battery at time t + 1
- : Discharge status of battery at time t + 1.
4.2.3. Mesh Network
The evaluation system is configured to alert the operator when there is no response to the ping between the devices and the database after three consecutive pings each at an interval of 5 s. Time delay is a phenomenon that can be studied in two perspectives. One in the context of delay in data transfer and other in the context of delay in connection to a device due to network limitations. Delay in data transfer can be accommodated with a buffer time of 45–90 s for the acknowledgement. For conditions of no network connectivity, the feedback mechanism for network in Figure 7 alerts pertaining to the lost connectivity will be immediately notified to the operator.
5. Results and Discussion
To validate the proposed electrical and communication models, the electrical system was simulated with MATLAB Simulink (8.9, R2017b, Mathworks, Natick, MA, USA) in near-real-time. The Simulink design of the microgrid is illustrated in Figure 3. In Guinea, the temperature and irradiance profile are derived and illustrated in Figure 8 and Figure 9. The parameters of microgrid-like PV capacity and battery are calculated using the model described in [28] and the calculated values are expressed in Table 2. This table also consists of simulation parameters detailing peak power output and maximum battery status.
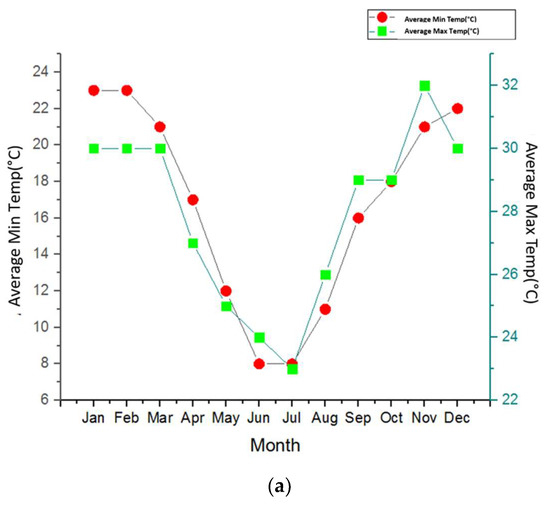
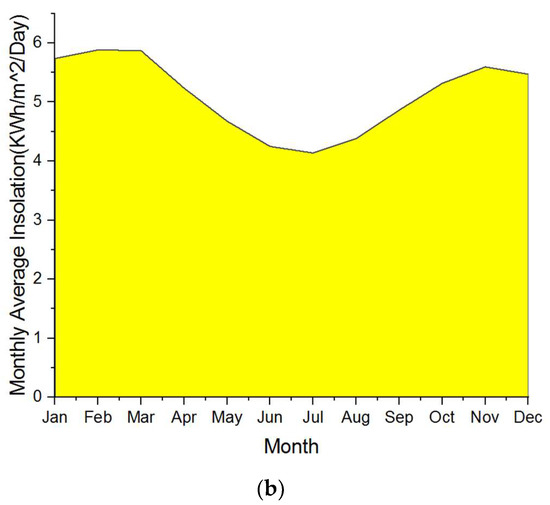
Figure 8.
(a) Temperature profile of the location; (b) Irradiance profile of the location.
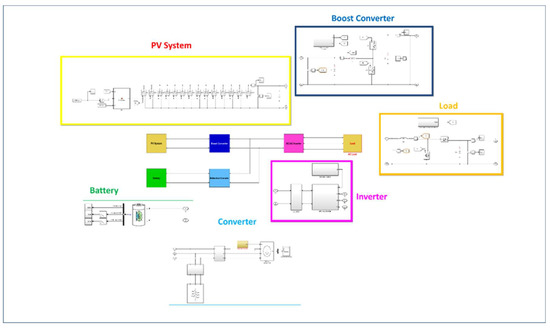
Figure 9.
Simulink model of microgrid.
Table 2.
Parameters for microgrid simulation.
Figure 9 illustrates the microgrid Simulink model of the system. The illustrated architecture contains mathematical models of a PV system, battery, PV converter, inverter and a bidirectional converter. The simulation runs for 3.04 s. For the PV system, a mathematical model that uses the irradiance, temperature inputs from the data of Figure 8a,b is developed. For the load, the hourly load values as calculated in [29] and expressed in Figure 2 are used for the simulation.
Simulation results of the Simulink model for AC power, voltage and battery status is illustrated in Figure 10a,b. Maximum power of 47.25 kW is obtained at an irradiance of 950 W/m2 and 32 °C.
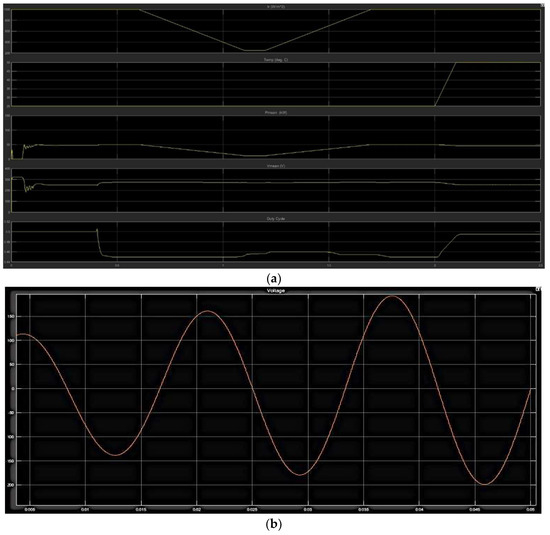
Figure 10.
(a) AC power and voltage output of microgrid; (b) battery cycle of the storage in microgrid.
This simulation was carried out with irradiance and temperature parameters for every month and the Yield values are recorded in a database. These yield values represent the reference or ideal yield values described in Equation (11).
NSG2 (3.27, DARPA, Arlington, VA, USA) software is used to build the architecture of the mesh network described in this research work. Figure 11 illustrates the simulation of a wireless mesh network for the microgrid. Node N0 to N8 represent the consumption side while N12, N15 represent the PV converter and battery side of the network connection. N9 is the inverter node and N17 is the node of router that is used for boosting network availability. N9 is connected to N17 via wire where the data is cumulated in the local database.
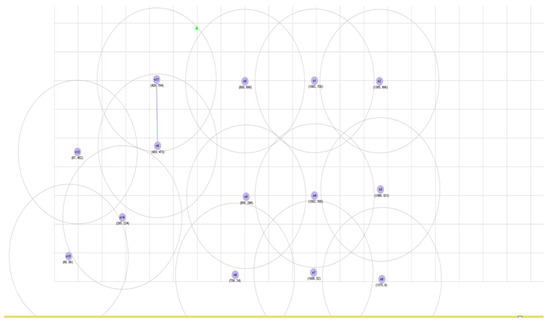
Figure 11.
Microgrid communication wireless model.
The Simulink microgrid model also consists of a feedback module interfaced with the output of PV generation and battery status as shown in Figure 12. This feedback module is programmed with the proposed mechanism illustrated in Figure 7.
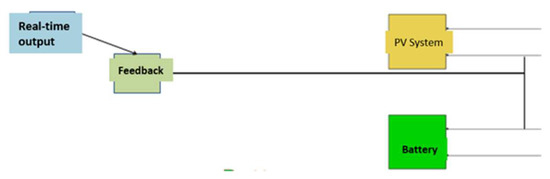
Figure 12.
Simulink model of microgrid.
This feedback module consists of an input data module for real-time data. This model can be used to feed the real-time performance data of a system and compare with the ideal performance as per (13) and the state of operation (underperformance or normal performance) can be communicated to the operator of the microgrid. To validate the working of the simulation with real-time data, performance of a rooftop 50-kW system for a single day is collected along with the irradiance and temperature data from the sensors. These irradiance and temperature values are given as input to the system and the system is simulated without changing any of the other parameters. Figure 13 illustrates the comparison between the real-time value and ideal value.
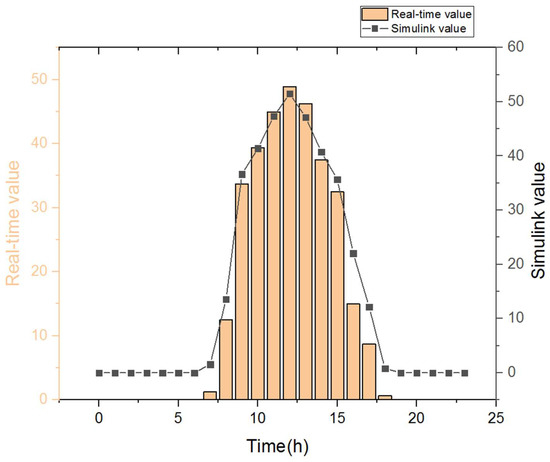
Figure 13.
Comparison of Yi and Yr.
There are only two reported instances where the ratio of actual and ideal value is below 70% with an average ratio of 85.2%. The evaluation system is configured to alert the operator when there is no response to the ping between the devices and the database after three consecutive pings each at an interval of 5 s.
6. Conclusions
This paper presented a comprehensive model of electrical as well as communication aspects of a microgrid. A mesh network with two internal partially connected nodes is proposed to fetch data. The main objective of this work is to propose a simple feedback oriented intelligent monitoring that can help operators understand the quality or efficiency of performance of the PV system in the microgrid. From this feedback, operators can take decision or plan maintenance activities that can enhance the yield. Since the electricity grid is at a pivot of huge transformation, it is necessary for such research mechanisms to be implemented in practical conditions and simplify the administration of the future grid and utilities. This research work can be extended to applications of peer-to-peer energy exchange, blockchain-based energy transfer applications, as well as the charging, monitoring, and optimization of EVs.
Conflicts of Interest
The author declares no conflict of interest.
References
- Eltawil, M.A.; Zhao, Z. Grid-connected photovoltaic power systems: Technical and potential problems-A review. Renew. Sustain. Energy Rev. 2010, 14, 112–129. [Google Scholar] [CrossRef]
- Farhangi, H. The path of the smart grid. IEEE Power Energy Mag. 2010, 8, 18–28. [Google Scholar] [CrossRef]
- Yan, Y.; Qian, Y.; Sharif, H.; Tipper, D. A Survey on Smart Grid Communication Infrastructures: Motivations, Requirements and Challenges. IEEE Commun. Surv. Tutor. 2013, 15, 1–16. [Google Scholar] [CrossRef]
- Sood, V.K.; Fischer, D.; Eklund, J.M.; Brown, T. Developing a communication infrastructure for the smart grid. IEEE Electr. Power Energy Conf. 2009, 4, 1–7. [Google Scholar]
- Chang, G.W.; Zeng, G.F.; Su, H.J.; Hsu, L.Y.; Chang, Y.R.; Lee, Y.D.; Lin, C.H. Modelling and simulation for INER AC microgrid control. In Proceedings of the PES General Meeting | Conference & Exposition, National Harbor, MD, USA, 27–31 July 2014. [Google Scholar]
- Rana, M.M.; Li, L. Kalman Filter Based Microgrid State Estimation Using the Internet of Things Communication Network. In Proceedings of the 12th International Conference on Information Technology—New Generations, Las Vegas, NV, USA, 13–15 April 2015; pp. 501–505. [Google Scholar]
- Ku, T.; Park, W. IoT Energy Management Platform for MicroGrid. In Proceedings of the 7th International Conference on Power and Energy Systems, Toronto, ON, Canada, 1–3 November 2017; pp. 106–110. [Google Scholar]
- Khalil, A.; Ateea, K. Modelling and Control of Photovoltaic-Based Microgrid. Int. J. Renew. Energy Res. 2015, 5, 826–835. [Google Scholar]
- Bhavsar, Y.S.; Joshi, P.V.; Akolkar, S.M. Simulation of Microgrid with energy management system. In Proceedings of the International Conference on Energy Systems and Applications, Pune, India, 30 October–1 November 2016; pp. 592–596. [Google Scholar]
- Ali, Q.I.; Abdulmaowjod, A.; Mohammed, H.M. Simulation & performance study of wireless sensor network (WSN) using MATLAB. In Proceedings of the 1st International Conference on Energy, Power and Control, Basrah, Iraq, 30 November–2 December 2010; pp. 307–314. [Google Scholar]
- Ye, F.; Member, S.; Qian, Y.; Member, S.; Hu, R.Q.; Member, S. Energy Efficient Self-Sustaining Wireless Neighborhood Area Network Design for Smart Grid. IEEE Trans. Smart Grid 2015, 6, 220–229. [Google Scholar] [CrossRef]
- Spanò, E.; Niccolini, L.; di Pascoli, S.; Iannaccone, G. Last-meter smart grid embedded in an internet-of-things platform. IEEE Trans. Smart Grid 2015, 6, 468–476. [Google Scholar] [CrossRef]
- Kristensen, T.l.F.; Olsen, R.L.; Rasmussen, J.G.; Schwefel, H.-P. Information access for event-driven smart grid controllers. Sustain. Energy Grids Netw. 2018, 13, 78–92. [Google Scholar] [CrossRef]
- Anderson, D.; Gkountouvas, T.; Meng, M.; Birman, K.; Bose, A.; Hauser, C.; Litvinov, E.; Luo, X.; Zhang, F. GridCloud: Infrastructure for Cloud-based Wide Area Monitoring of Bulk Electric Power Grids. IEEE Trans. Smart Grid 2018. [Google Scholar] [CrossRef]
- Choi, J.; Shin, Y.; Choi, M.; Park, W.-K.; Lee, I.-W. Robust Control of a Microgrid Energy Storage System using Various Approaches. IEEE Trans. Smart Grid 2018, 7, 1. [Google Scholar] [CrossRef]
- Al-Barazanchi, S.A.M.; Vural, A.M. Modeling and intelligent control of a stand-alone PV-Wind-Diesel-Battery hybrid system. In Proceedings of the International Conference on Control, Instrumentation, Communication and Computational Technologies, Kumaracoil, India, 18–19 December 2015; pp. 423–430. [Google Scholar]
- Phung, M.D.; De La Villefromoy, M.; Ha, Q. Management of solar energy in microgrids using IoT-based dependable control. In Proceedings of the International Conference on Electrical Machines and Systems (ICEMS), Sydney, NSW, Australia, 11–14 August 2017. [Google Scholar]
- Frey, S.; Diaconescu, A.; Menga, D.; Demeure, I. A holonic control architecture for a heterogeneous multi-objective Smart Micro-Grid. In Proceedings of the 7th International Conference on Self-Adaptive and Self-Organizing Systems, Philadelphia, PA, USA, 9–13 September 2013; pp. 21–30. [Google Scholar]
- Bisht, M.S.; Sathans. Fuzzy based intelligent frequency control strategy in standalone hybrid AC microgrid. In Proceedings of the IEEE Conference on Control Applications, Juan Les Antibes, France, 8–10 October 2014; pp. 873–878. [Google Scholar]
- Tiwari, S.K.; Singh, B.; Goel, P.K. Design and Control of Micro-Grid fed by Renewable Energy Generating Sources. IEEE Trans. Ind. Appl. 2018, 9994, 1–9. [Google Scholar]
- Mi, Y.; Zhang, H.; Member, S.; Fu, Y.; Wang, C. Intelligent Power Sharing of DC Isolated Microgrid Based on Fuzzy Sliding Mode Droop Control. IEEE Trans. Smart Grid 2017. [Google Scholar] [CrossRef]
- Grilo, A.P.; Gao, P.; Xu, W.; De Almeida, M.C. Load monitoring using distributed voltage sensors and current estimation algorithms. IEEE Trans. Smart Grid 2014, 5, 1920–1928. [Google Scholar] [CrossRef]
- Chakraborty, P.; Baeyens, E.; Khargonekar, P.P. Distributed control of flexible demand using proportional allocation mechanism in a smart grid: Game theoretic interaction and price of anarchy. Sustain. Energy Grids Netw. 2017, 12, 30–39. [Google Scholar] [CrossRef]
- Krismanto, A.U.; Mithulananthan, N.; Krause, O. Sustainable Energy, Grids and Networks Stability of Renewable Energy based Microgrid in Autonomous Operation. Sustain. Energy Grids Netw. 2018, 13, 134–147. [Google Scholar] [CrossRef]
- McMillin, B.; Roth, T. Cyber-Physical Security and Privacy in the Electric Smart Grid. Synth. Lect. Inf. Secur. Priv. Trust 2017, 9, 1–64. [Google Scholar] [CrossRef]
- He, Y.; Mendis, G.J.; Wei, J. Real-Time Detection of False Data Injection Attacks in Smart Grid: A Deep Learning-Based Intelligent Mechanism. IEEE Trans. Smart Grid 2017, 8, 2505–2516. [Google Scholar] [CrossRef]
- Khatib, T.; Elmenreich, W. Novel simplified hourly energy flow models for photovoltaic power systems. Energy Convers. Manag. 2017, 79, 441–448. [Google Scholar] [CrossRef]
- Chen, S.X.; Gooi, H.B.; Wang, M.Q. Sizing of energy storage for microgrids. IEEE Trans. Smart Grid 2012, 3, 142–151. [Google Scholar] [CrossRef]
- Hubble, A.H.; Ustun, T.S. Composition, placement, and economics of rural microgrids for ensuring sustainable development. Sustain. Energy Grids Netw. 2018, 13, 1–18. [Google Scholar] [CrossRef]
- PHOTOVOLTAIC SOTWARE. Available online: Pvsyst.com (accessed on 23 January 2018).


© 2018 by the author. Licensee MDPI, Basel, Switzerland. This article is an open access article distributed under the terms and conditions of the Creative Commons Attribution (CC BY) license (http://creativecommons.org/licenses/by/4.0/).