Article

Surface Properties and Pore Structure of Anthracite, Bituminous Coal and Lignite

1
State Key Laboratory of Coal Mine Disaster Dynamics and Control, Chongqing University, Chongqing 400044, China
2
Australian Commonwealth Scientific and Research Organization (CSIRO), Locked Bag 10, Clayton South VIC 3169, Australia
*
Author to whom correspondence should be addressed.
Energies 2018, 11(6), 1502; https://doi.org/10.3390/en11061502
Submission received: 22 May 2018 / Revised: 7 June 2018 / Accepted: 8 June 2018 / Published: 12 June 2018
(This article belongs to the Section L: Energy Sources)

Abstract

:
Properties of coal surface and pore structure are important aspects to be investigated in coal preparation and utilization. In order to investigate the limits of different probe methods, a comprehensive approach was comparatively used to probe surface properties and pore structure of anthracite, bituminous coal and lignite. Surface morphology of the three coal samples was analyzed by scanning electron microscopy (SEM). Combining mercury intrusion porosimetry (MIP), physisorption method with carbon dioxide (CO2) at 273 K and nitrogen (N2) at 77 K was used to quantify a broad pore size distribution of coals, while FT-IR and water vapor sorption methods were used to study the coal surface properties. The results show that wedge-shaped pores develop with the increase of coal rank due to compression effect. The determined specific surface area (SSA) and pore volume of N2 decrease with the increase of coal rank, while CO2 SSA and pore volume are of a kind of U-shaped function of coal rank. MIP results indicate that that the pore size of 10–100 nm accounted for 70.7–97.5% of the total volume in the macropore range. Comparison of different methods indicates that micropores cannot be fully covered by the standard probes. CO2 adsorption technique can only probe micropores in the range of 0.5 nm to 0.9 nm. Water vapor is not an effective probe to detect the micropores in coals, due to that the water clusters is mainly filled in mesopores and macropores. The results also show that both water vapor adsorption and FT-IR analysis can provide qualitative information of coal surface, rather than qualification of functional groups.

1. Introduction

Coal is an extremely heterogeneous porous material containing both organic macerals and inorganic mineral matter [1]. The macromolecule structure of coal macerals offers plenty of adsorption sites for gaseous and liquid adsorbates [2,3,4]. In addition, the amorphous surface of coal enriches functional groups, possessing strong adsorption capacity for polar molecule adsorbates [5,6,7], such as water vapor. In coal preparation and utilization processes, including coalbed methane (CBM) recovery and CO2 geosequestration, both surface properties and pore structure are important aspects to be investigated [8,9].
The pores in coal and other porous materials are commonly divided into three categories based on the pore diameter, following the International Union of Pure and Applied Chemistry (IUPAC) classification, as micropores (≤2 nm in diameter), mesopores (2–50 nm idiameter) and macropores (≥50 nm in diameter) [10]. For coal, the macromolecular structure of organic macerals forms an interconnected pore network, resulting in a broad distribution of pore size [11,12]. Coal structure varies with the degree of maturity of coal as measured by reflectance or volatile matter. Accompanying the coalification, micropores increase significantly at the expense of macropores and mesopores, leading to an increase in specific surface area (SSA) and pore volume [13]. However, Gürdal and Yalçın [14], Laxminarayana and Crosdale [15], Perera et al. [16] and Zhao et al. [17] argued that SSA and pore volume tend to be an U-shaped function of coal rank. Therefore, the variation mechanism of the SSA and pore volume with coalification process is not simple. Furthermore, Bustin and Clarkson [18] and Jian et al. [19] showed that maceral composition affects SSA more significantly than coal rank.
Previous studies have confirmed that the probed pore structure of coal was impacted by the specific measurement technique. To date, no standard method has been established to probe such a broad pore size distribution for such a complex natural porous medium. Physisorption approach is a method widely used to derive pore structure in coal, such as porosity and SSA [20,21,22,23,24,25], and CO2 and nitrogen (N2) are the most commonly used adsorbates. Conventionally, the adsorption-desorption isotherm of N2 on coal is conducted at 77 K. However, N2 molecules at 77 K cannot penetrate the fine micropores due to the activated diffusion effect and pore shrinkage of coal [26], but these micropores provide a dominant amount of adsorption sites. In order to eliminate activated diffusion effect and pore shrinkage during isotherm measurement, CO2 at higher temperatures (195 K, 273 K, 298 K) has been used in isotherm measurement [16,27,28,29]. As a consequence, the determined porosity and SSA with CO2 adsorbate are usually larger than that with N2 at 77 K [8,13,30]. Gan et al. [30] found that, with N2 adsorbate at 77 K, the SSA of coal with carbon content of 75.5–81.5% is greater than 10 m2/g, while the SSA of coal with carbon content beyond this range is less than 1 m2/g. Comparatively, with CO2 at 298 K, the measured SSA of coal is higher than 100 m2/g, irrespective of the carbon content. With N2 (77 K) and CO2 (273 K) adsorbates, Okolo et al. [13] confirmed this measurement trend using four coal samples from different deposits.
Mercury intrusion porosimetry (MIP) is also a technique of determining the porosity of coal [31,32,33], where liquid mercury is gradually injected into pores of coal with the increase of pressure by overcoming the surface tension. The higher injection pressure, the smaller pores can be penetrated by mercury. However, at the high pressures employed, the sample can be deformed elastically or even damaged irreversibly. Moreover, mercury is not able to be completely extruded from the pore system [34]. Therefore, such a technique is more competent to probe mesopores and macropores.
More recently, water vapor has been tentatively used to characterize the pore structure of porous material due to its lower kinetic diameter (0.28 nm) when compared to N2 (0.38 nm) and CO2 (0.33 nm). However, the application of water vapor to physically investigate the pore structure of the natural organic material is not as simple as N2 and CO2, as the surface functional groups may provide extra sorption sites for water molecules [35]. Previous studies showed that water molecules first interact with functional groups by electrostatic forces at a low relative pressure; then the adsorbed water acts as secondary sites for further adsorption, forming clusters; the clusters merge further to fill the pore space at a high relative pressure [36,37,38,39,40,41]. Therefore, the water uptake capacity can reflect both the overall density of surface functional groups and the porosity of coal. However, further study is needed to reveal the detailed mechanisms of water vapor adsorption in such a pore medium of a broad pore size distribution, including the role of different-size pores in vapor adsorption and their modeling equations.
The objective of this study is to explore the characteristics of surface properties and pore structure of different coal rank and address the limits of different methods for coal characterization. To attain this goal, a comprehensive approach was comparatively used to investigate the pore structure and surface properties of anthracite, bituminous coal and lignite. Scanning electron microscopy (SEM) was performed for pore morphology characterization. Combining MIP, physisorption method with carbon dioxide (CO2) at 273 K and nitrogen (N2) at 77 K were used to quantify a broad pore size distribution of coals. Fourier Transform infrared spectroscopy (FT-IR) and water vapor adsorption methods were used to study the coal surface properties. Finally, the measurable ranges and the limits of each method applied in this study are analyzed.

2. Materials and Methods

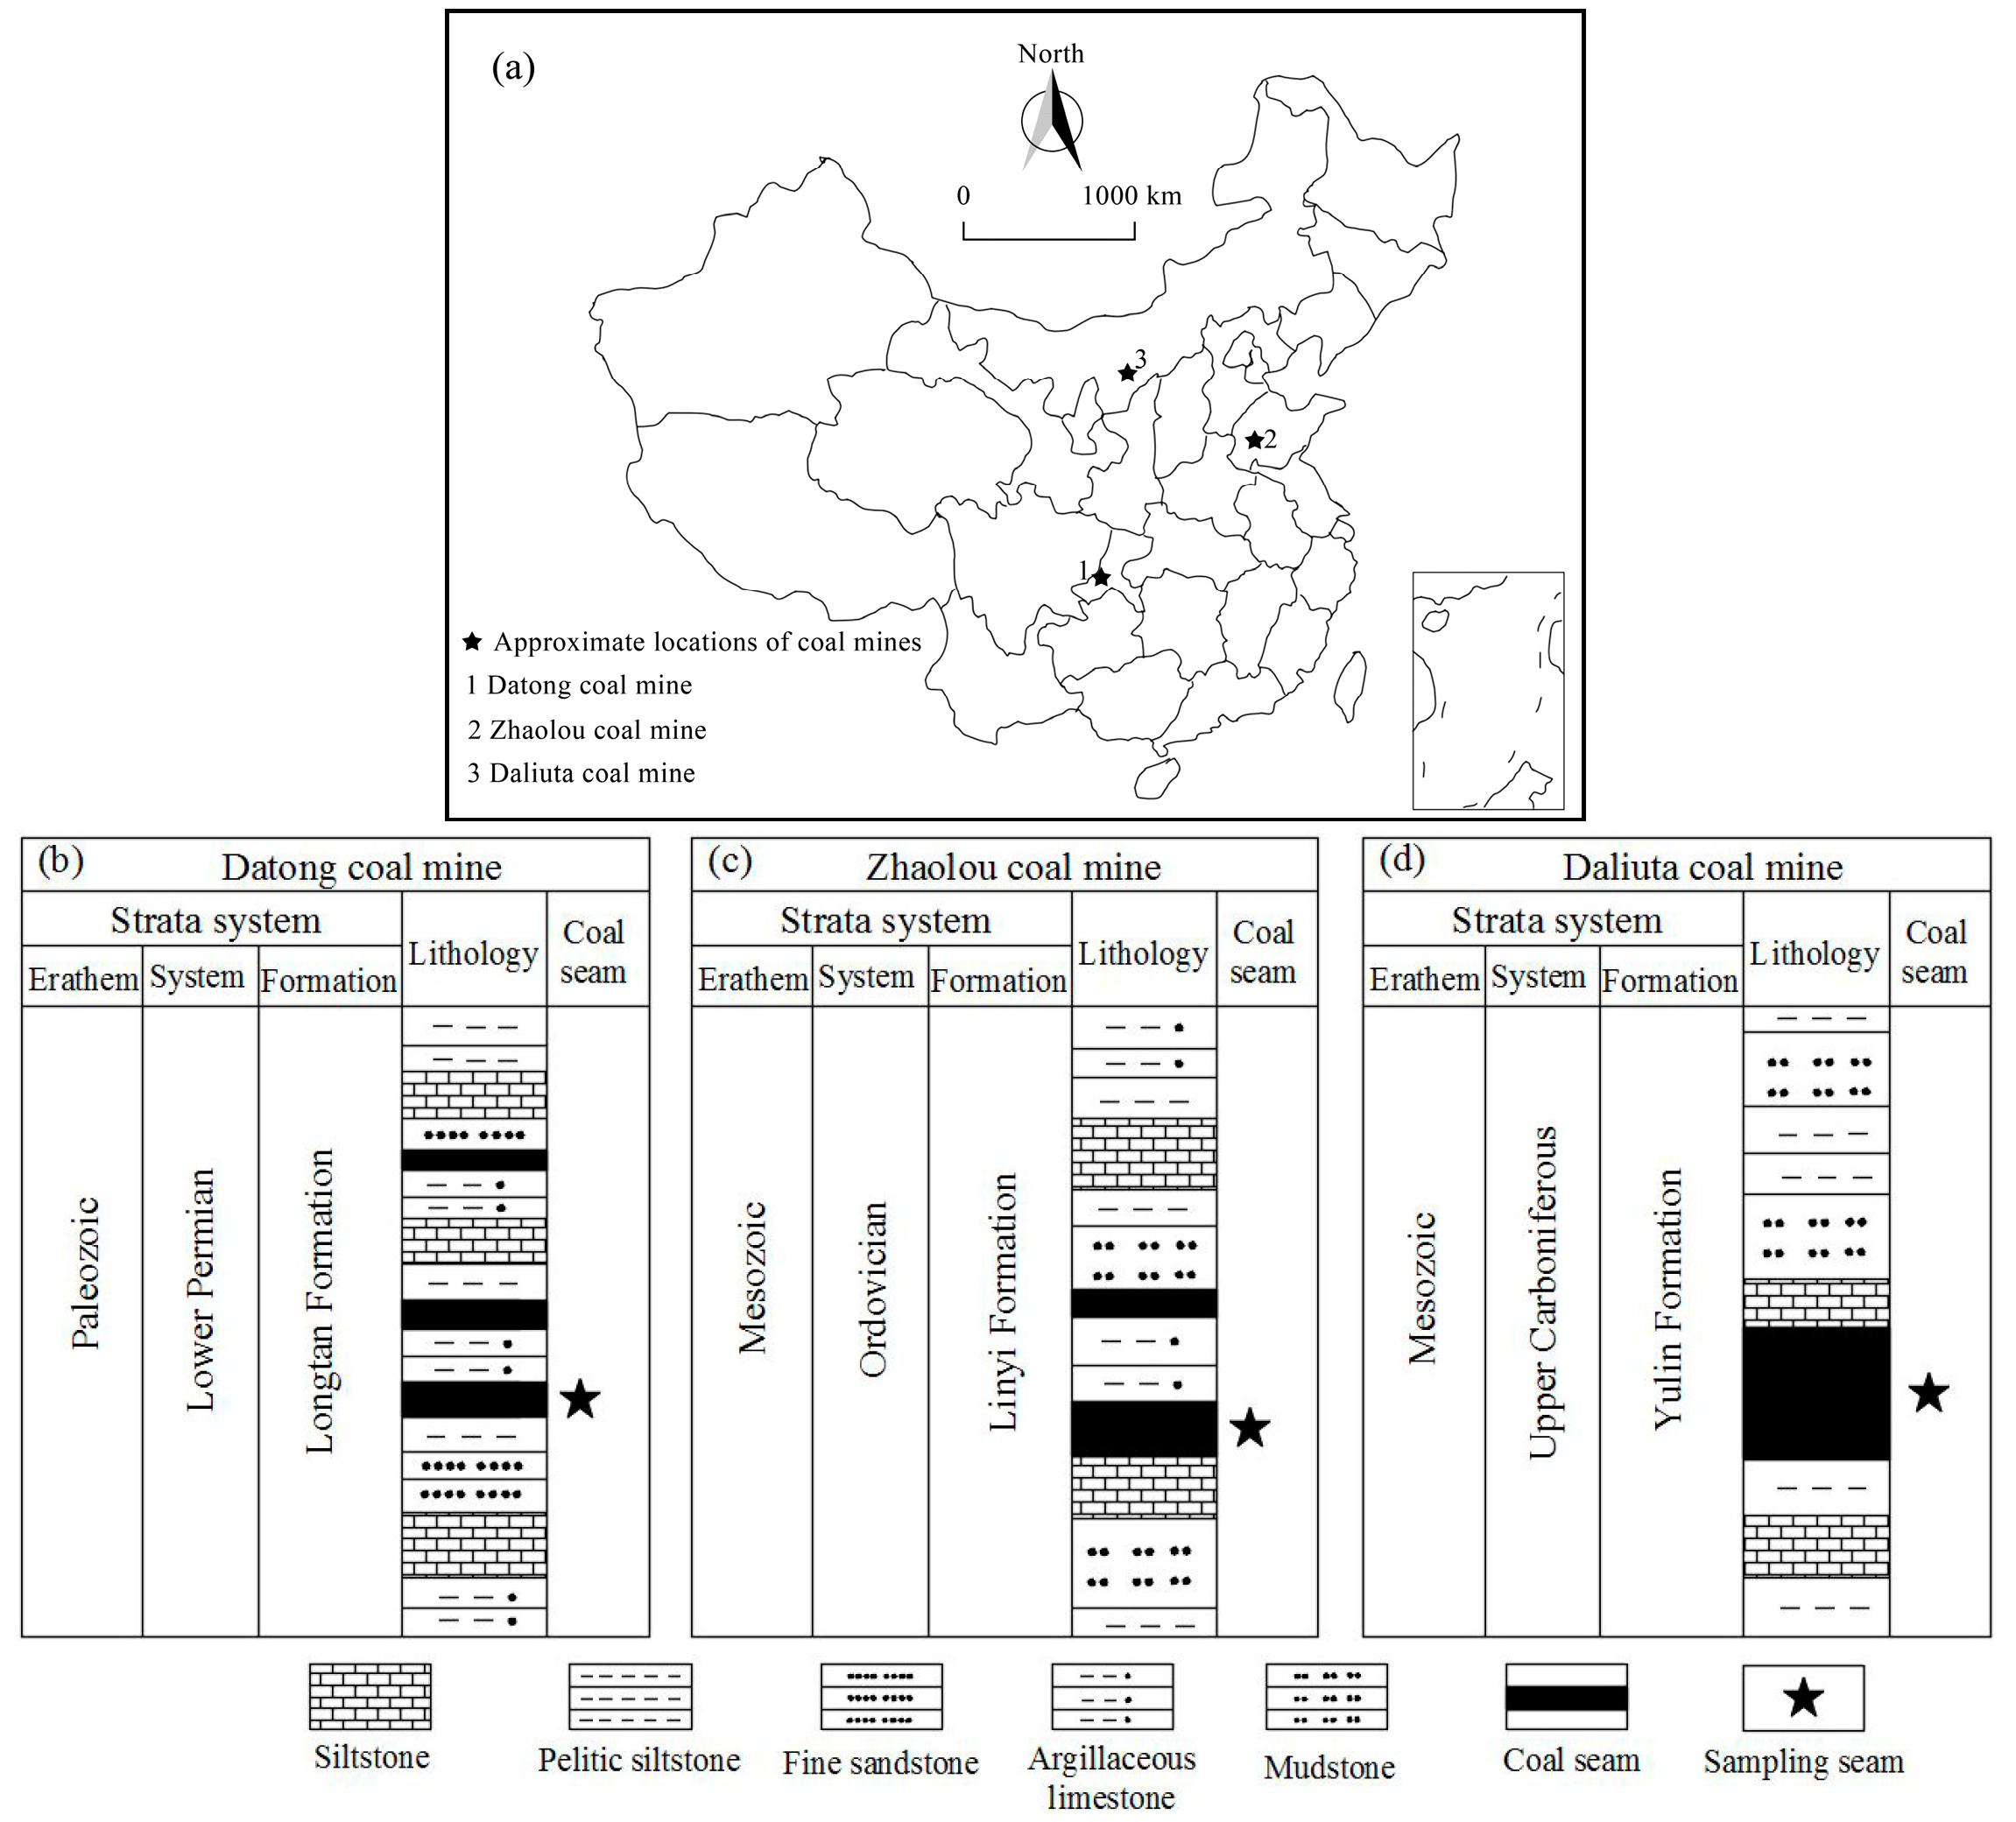
2.1. Sample Preparation

Coal blocks were collected from three mineable coalbeds in China. Since coal rank is a key factor determining the pore structure and surface properties, different coal rank collected from three deposits were used in this study. Anthracite from No. 6 coal seam in Datong coal mine, Sichuan coalfield, medium-volatile bituminous coal from No. 2 coal seam in Zhaolou coal mine, Heze coalfield and lignite from No. 1–2 coal seam in Daliuta coal mine, Shendong coal field. The locations and stratigraphic columns of the three coal mines are shown in Figure 1. Coal blocks were firstly obtained from freshly-exposed mining faces, then sealed immediately and transported to the laboratory. In laboratory, coal lumps were ground and sieved to particles of 18–20 mesh (0.83–0.88 mm) in size for further analysis and measurement.

2.2. Ultimate and Proximate Analyzes

Prior to surface properties and pore structure investigation, ultimate and proximate analyzes were carried out to characterize the coal samples. Flash EA2000 elemental analyzer (Thermo Fisher Scientific, Waltham, MA, USA) was used for ultimate analysis. The proximate analysis on coal samples includes fixed carbon (Cfix), volatile matters (Vdaf), ash (Aad) and moisture (M). The ultimate analysis aims for the element analysis of carbon (C), hydrogen (H), nitrogen (N) and oxygen (O).

2.3. Scanning Electron Microscopy

SEM JSM-7800F, JEOL USA, Inc. (Peabody, MA, USA) was used to visually investigate the pore morphology of the three coal samples. The coal samples prepared for SEM analysis were 1 × 1 × 1 cm in size and the magnification time was set as 10,000. After surface cleaning, the coal samples were vacuum dried at 373 K for 12 h. Before SEM scanning, the coal samples were coated with a layer of gold.

2.4. FT-IR Analysis

FT-IR is one of the most useful methods used in instrumental analysis for research on coals and carbon materials. It allows non-destructive testing of the chemical structure of the objects being characterized [41]. In this study, surface functional groups of anthracite, bituminous coal and lignite were determined using a FT-IR Nicelet 6700 (Thermo Fisher Scientific, Waltham, MA, USA). Using He/Ne laser source, it can provide a spectral scan from 400 to 4000 cm−1. The coal sample for FT-IR analysis (0.5–1 mg in weight) was prepared with the potassium bromide (KBr) pellet method. The coal powders and the dried KBr were ground at a mass ratio of 1:160. The obtained infrared interference spectral was transformed through Fourier calculation to identify hydroxyl, aliphatic hydrogen and carbonyl functional groups.

2.5. Low-Pressure N2 and CO2 Isotherm Measurements

The low-pressure isotherms of N2 and CO2 were measured using Accelerated Surface Area and Porosimetry System ASAP 2020M, Micrometrics Instruments Corporation USA, Inc (Norcross, GA, USA). Before each test, the coal sample (1–2 g in weight) was degassed for 12 h at 383 K to remove air, water and other volatile matters. At each pressure set-point, the sorption equilibrium was established automatically when the pressure stabilized for 30 s. The absolute pressure tolerance was set as 5 mmHg (6.66 mbar). The warm free space and cold free space were determined by helium expansion after isotherm measurement. The SSA, pore volume and pore size distribution (PSD) of the coal samples were calculated based on multiple theories [42].
The CO2 adsorption isotherms were measured in an ice bath (273 K) under the relative pressure ranging from 0.005 to 0.032. Lower limit of the relative pressure is used for the evaluation of CO2 adsorption as micropores are filled at lower relative pressure than mesopores [13]. The SSA and micropore volume determined by CO2 adsorption were evaluated by Dubinin-Radushkevich (D-R) and Dubinin-Astakhov (D-A) methods. The PSD were calculated by Density Functional Theory (DFT). The N2 adsorption-desorption isotherms were measured at 77 K under the relative pressure from 0.01 to 0.99. The SSA of the coal samples with N2 adsorbate were evaluated by Langmuir, Barrett-Joyner-Halenda (BET) and Barrett-Joyner-Halenda (BJH) methods for comparison purpose. The pore volume and average pore diameter from N2 isotherm were determined using BET and BJH models. The mesopore size distribution of the samples determined from N2 adsorption were based on BJH method. In comparison, the calculation models for different adsorbates are summarized in Table 1.

2.6. Mercury Porosimetry Measurement

A Mercury Porosimetry Analyzer from Quantachrome Instruments was used to comparatively show its probe difference to different coal rank, using anthracite, bituminous coal and lignite. At the start of the measurement, the coal sample was firstly immersed in mercury container and then degassed to achieve the vacuum state. Subsequently, the pressure was gradually applied to drive the mercury into the pores. The applied mercury pressure and the intruded volume were recorded to derive the pore structure of coal.
The applied mercury intrusion pressure was started from 21 psi (0.15 MPa) to a maximum pressure of about 15000 psi (100 MPa). The contact angle and surface tension for injection were assumed to be 130° and 0.485 N/m to determine pore size distribution [13,18].

2.7. Water Vapor Isotherm Measurements

The gravimetric method was used to measure water vapor adsorption-desorption isotherms using the IGA gravimetric analyzer, Hiden Isochema Limited UK, Inc. (Warrington, UK), as schematically shown in Figure 2. The IGA system is an intelligent gravimetric analyzer by integrating computer-controlled precise measurement units for weight change, pressure and temperature. The pressure supply system can regulate the gas pressure from 0 to 2.0 MPa, and the weighing resolution of the microbalance is 0.2 μg ± 0.1 μg. In the isotherm measurement process, the microbalance and the pressure control units are under the thermostat control with an accuracy of ± 0.1 K.
Water vapor isotherms on the coal samples were measured at 298 K. Prior to isotherm measurement, the coal sample was degassed at 383 K for 12 h under vacuum (10−6 Pa) in order to remove the water content. In isotherm measurement, the adsorption/desorption equilibrium was established at a pressure point once the change in sample weight was less than 1% of equilibrium or a time-limit was reached. Then, the water vapor pressure was regulated to the next test. In preliminary tests, it was found that the weight of the coal sample was stable after 120 min adsorption and did not change further even for experiments lasting up to 20 h. Thus, the sorption equilibration time is set as 120 min, which is sufficient for gas sorption equilibrium at each pressure point. Buoyancy effect was corrected automatically in the measurement.

3. Results and Discussion

3.1. Ultimate and Proximate Results

The results of ultimate and proximate analyzes are presented in Table 2. In comparison, anthracite contains the highest carbon content, but the lowest volatile matters and ash content, corresponding to 73.85%, 12.81% and 13.34%, respectively, while lignite contains the lowest carbon content, but the highest volatile matters and ash content. However, the moisture content does not show such a monotonic trend. In the ultimate analysis, carbon element shows the same trend as that of carbon content in the proximate analysis. Regarding the hydrogen, nitrogen and oxygen elements, lignite is the highest, followed by bituminous coal and anthracite in sequence. Therefore, the carbon content increased with coal rank, while the volatile, ash and moisture decreased with coal rank. This is consistent with the previous studies [16,43]. The content of hydrogen, nitrogen and oxygen elements monotonically decreased with the coal rank. This is due to the polycondensation effect and the elimination of –OH bounds during coalification process.

3.2. SEM Results

Figure 3 shows SEM images of the coal samples at the magnification time of 10,000. It can be seen that the pore distribution of the coal samples is inhomogeneous. Furthermore, either pore size or pore shape is different among the three coal samples. The anthracite has a major distribution of wedge-shaped pores, which is probably due to the compaction effect during coalification process. The bituminous coal is highly porous with cylindrical pores, wedge-shaped pores and bottle-shaped pores. Pores in lignite can hardly be observed at the magnification time of 10,000, which is possibly due to the less maturity of the lignite compared to anthracite and bituminous coal.

3.3. FT-IR Results

The FT-IR spectra of the three coal samples are shown in Figure 4, where the difference in FT-IR spectra represents different functional group characteristics on coal surfaces. The first band at a wave number of around 3500 cm−1 is attributed to –OH groups caused by surface hydroxyl of water molecules on coal surface. The second band at the wave number of around 1622 cm−1 indicate amide carbonyl (–C=O) of the coal surface. The spectral bands from 900–700 cm−1 are attributed to the aromatic structure. The sharp absorption peak of bituminous coal at around 1434 cm−1 is attributed to C–H bond, while the peaks of anthracite and lignite at 1032 cm−1 are caused by the C–O bond of the carboxylic acid, phenol and alcohols structure. Figure 4 shows, compared to the bituminous coal and the lignite, the anthracite exhibited relatively weak FT-IR absorption peaks. This indicates that anthracite has a low concentration of functional groups on its surface.

3.4. Pore Structure for the Coal Samples

The N2 adsorption-desorption isotherms of the coal samples are shown in Figure 5a. The isotherms of the three coal samples uniformly show Type Ⅳ, indicating a wide distribution of pore size [10]. In the isotherms, adsorption-desorption hysteresis appeared at the high relative pressure, suggesting capillary condensation occurred within the mesopores [44]. The shape of the hysteresis loop of lignite corresponds to type C, while bituminous coal and anthracite show Type B according to de Boer classification [45]. Type C hysteresis loop illustrates slit-shaped pores in lignite, and Type B hysteresis loop reflects that a significant amount of wedge-shaped pores exist in anthracite and bituminous coal. This characteristic can be visually confirmed by SEM images as shown in Figure 3. It is noted that the hysteresis loop of lignite show a lack of closure at the low relative pressure, which is attributed to the swelling effect of coal matrix in adsorption process [46].
Figure 5b shows CO2 adsorption isotherms of the coal samples at 273 K under a low relative pressure range (≤0.032). The adsorption capacity of CO2 on the coal samples are larger than that of N2 at a similar relative pressure range. As mentioned previously, this is because CO2 molecules can enter narrow micropores when compared to N2 adsorbate [47]. From Figure 5, it can be observed that anthracite has the lowest N2 adsorption capacity, but the highest CO2 adsorption capacity, indicating a major distribution of micropore. The N2 adsorption capacity decreases with the increase of coal rank, while CO2 adsorption capacity shows an U-shaped function in terms of coal rank.
The estimated pore properties from N2 and CO2 isotherms are summarized in Table 1. The Langmuir SSA, BET SSA and BJH SSA determined by N2 are around as low as 1 m2/g. Regarding the coal rank, the SSA and pore volumes determined by N2 adsorption show a tendency to decrease with the increase of coal rank. The determined average pore diameter with BET and BJH methods shows that the pores probed by N2 adsorbate fell in the mesopore range. Table 1 also shows that the CO2 SSA, based on either D-R or D-A models, of the coal samples are larger than N2 SSA. With CO2 adsorbate, the determined SSA for anthracite is the largest, followed by lignite and bituminous coal. However, with N2 adsorbate, the determined SSA decreases with the increase of coal rank. Mahajan et al. [8] argued that CO2 is capable of measuring the total surface area of coal. Bituminous coal is found to exhibit the lowest SSA and pore volume of micropores among the three samples. This is consistent with the published results [13].
The PSD for the coal samples determined by N2 and CO2 adsorption are shown in Figure 6. The results indicate that the coals contain a broad PSD in the micro- and mesopore range. The calculated pore volume distribution of lignite is higher than anthracite and bituminous coal in mesopore range, with major peaks at around 9 nm and 25 nm. The bituminous coal has a major peak at around 45 nm, while anthracite has minor volume distribution in mesopore range (Figure 6a). In micropore range, anthracite has major peaks at around 0.56 nm, 0.77 nm and 0.9 nm, while bituminous coal and lignite have major peak at around 0.84 nm (Figure 6b).
The PSD and SSA of the coals determined by MIP method are given in Table 1 and Figure 7. It can be observed that pores in the range from 10–100 nm accounted for 70.7–97.5% of the total volume for all the coal samples. The volume of large macropore (100–1000 nm) decreases with the increase of coal rank. The SSA and total pore volume of bituminous coal are the largest, followed by lignite and anthracite in sequence. This order is different from the results of N2 and CO2, demonstrating a major distribution of macropores in bituminous coal.

3.5. Properties Determined by Water Adsorption

3.5.1. Water Vapor Adsorption-Desorption Isotherms

Water vapor adsorption-desorption isotherms for the coal samples were measured at the relative pressure up to 0.9 as shown in Figure 8. The isotherms are type Ⅲ corresponding to IUPAC classification [10]. This implies that the coal samples are of weak adsorption affinity with water. The isotherms can be divided into several sections. At low relative pressures, the amount of adsorbed water tends to be a linear increase trend with pressure, which is due to the interaction between water molecules and functional groups on coal surface. With the increase of relative pressure, the water molecules adsorb on top of the pre-adsorbed water molecules and clusters are formed. As the relative pressure increase further, the clusters merge to fill the pore space in the coals. This is shown as an rapid increase in water adsorption.
Regarding the coal rank, lignite has the largest water adsorption capacity at the whole pressure range, followed by bituminous coal, while anthracite has the smallest adsorption capacity. Combining this result with the FT-IR spectra, such adsorption capacity variation at the low pressure range is ascribed to surface properties difference. With coalification, functional group elimination and hetero-aromatic bond breaking result in a substantial change of coal surface properties, leading to density decrease of the surface functional groups, especially the oxygen-containing groups [41]. At high relative pressures, the increase rate of water adsorption on lignite and bituminous coal is larger than on anthracite. From this perspective, despite the lower kinetic diameter of water molecules, it is mainly filled in mesopores and macropores of coals.
For the water isotherms of the three coal ranks, the adsorption-desorption hysteresis can be observed, stating the adsorption of water vapor on the coals is incompletely reversible. The hysteresis is probably due to the cohesiveness characteristic of water clusters by the strong hydrogen bonding between water molecules and this interaction maintains the clusters in a relatively stable state with the progress of desorption [48,49,50].

3.5.2. Modeling of Water Vapor Adsorption

In order to better describe water vapor adsorption on the coal samples, the description capability of D'Arcy and Watt (D-W) equation and Dent equation are checked here. The two models distinguish the contribution of primary and secondary sites to adsorption. The primary sites, represented by oxygen-containing groups, have high binding energies. Secondary sites can occur either between the first water-occupied primary sites or on previously-formed secondary sites [51,52,53]. The D-W equation was given as:
a = s 0 K 1 h 1 + K 1 h + s K 2 h 1 K 2 h
where h is the relative pressure, a represents the amount of adsorbed water for a specific h, s0 and s are the density of the primary and secondary adsorption sites, K1 and K2 are the attraction between adsorbate and the primary and secondary sorption site, respectively.
The Dent model has a similar form with the BET theory [53], and was given as:
a = m 0 K 1 h ( 1 K 2 h ) ( 1 K 2 h + K 1 h )
where K1 and K2 are the constants related to the adsorption energies of the primary and secondary sites, respectively, m0 represents the monolayer adsorption capacity.
Equations (1) and (2) were applied to best-fit the water vapor isotherm and the results are shown in Figure 9. The fitting parameters are calculated and summarize in Table 3. Obviously, the adsorption isotherms are well fitted by D-W and Dent plots with R-square greater than 0.98 for all cases. The s0 and m0 of water adsorption varied with regards to different coal samples, indicating different density of the primary sites on coal surface. Table 3 shows that the density of both primary site and secondary site of lignite is the largest, followed by bituminous coal and anthracite in sequence. Also, the parameter s of water adsorption also decreased with the coal rank, indicating loss of surface functional groups during coalification process.

3.6. Comparison of Different Methods in Coal Pore Characterization

According to the analysis mentioned above, the comparison of the measurable ranges of different methods to characterizing the coal pore structure is shown in Figure 10. SEM can cover almost the whole range of pore diameter using different magnification times. However, the main problem of this technique is that it can only provide the qualitative information of the pores. Meanwhile, it is difficult to position the same adsorption sites for comparison analysis, even for advanced operators. Standard CO2 adsorption technique can obtain a certain quantitative information of micropore in coals, as it can only probe pores in the range of 0.5 nm to 0.9 nm. For micropores falling in the range of 0.9 nm and 2 nm and smaller than 0.5 nm, CO2 adsorption technique is unfavorable. Physisorption method with N2 adsorbate can probe mesopores in coal, while MIP can penetrate both the mesopores and macropores. The mesopore volume determined by N2 adsorption and MIP have similar values in this study. Regarding physisorption with water vapor, it is not an effective method to probe micropores in coals as the water clusters mainly fill mesopores and macropores, instead of micropores, even though water vapor has a lower kinetic diameter. However, in CBM exploitation and CO2 geosequestration, proper characterization of micropore in coal is important. Therefore, development of new methods is essential to explore and characterize a wider range of micropores in coals.
This study also show that both water vapor adsorption and FT-IR analysis can provide qualitative information of coal surface properties, but ineffective in quantification of functional groups on coal surface.

4. Conclusions

In order to explore the surface properties and pore structure of different coal rank, and hence comparatively address the limits of different probe methods, a comprehensive approach was used to probe the surface properties and pore structure of anthracite, bituminous coal and lignite, including SEM, N2, CO2 and water vapor adsorption, MIP and FT-IR.
The results show that wedge-shaped pores develop with the increase of coal rank due to compression effect. The determined SSA and pore volume of N2 adsorbate decrease with the increase of coal rank, while CO2 SSA and pore volume show an U-shaped function of coal rank. This is corresponding to the different measurable ranges of the two probes. MIP results indicate that the pore size of 10–100 nm accounted for 70.7–97.5% of the total volume in the macropore range. The water vapor adsorption and FT-IR results show that the density of surface functional groups decreased with the coal rank, resulting in a smaller water uptake capacity of the higher rank coal. The water vapor adsorption isotherms in coals can generally be described by both D-W and Dent equations.
By comparing different methods in probing pore structure and surface properties of coal, it is found that physisorption method with CO2 adsorbate is incompetent to probe the micropores in the range of 0.9 nm and 2 nm or smaller than 0.5 nm. N2 adsorbate can probe mesopores in coal, while MIP can penetrate both the mesopores and macropores. Also, the mesopore volume determined with two methods above is similar. Even though water vapor has a lower kinetic diameter, it is unfavorable in probing micropores in coals, as the water clusters mainly fill mesopores and macropores, instead of micropores. For the surface properties of coal, either water vapor adsorption technique or FT-IR analysis can provide qualitative information of coal surface, but incompetent to provide quantitative information for functional groups.

Author Contributions

Z.Z. and S.K.C. conceived and designed the experiments; Z.L. performed the experiments; Z.L. and Z.Z. analyzed the data; Y.L. contributed materials and analysis tools; Z.L. wrote the paper.

Funding

This study is supported by the National Natural Science Foundation of China (Grant No. 51674047 and 51611140122) and National Science Fund for Distinguished Young Scholars (Grant No. 51625401).

Conflicts of Interest

The authors declare no conflict of interest.

References

  1. Gosiewaka, A.; Dralich, J.; Laskowski, J.S.; Pawlik, M. Mineral matter distribution on coal surface and its effect on coal wettability. J. Colloid Interface Sci. 2002, 247, 107–116. [Google Scholar] [CrossRef] [PubMed]
  2. Crosdale, P.J.; Beamish, B.B.; Valix, M. Coal bed methane sorption related to coal composition. Int. J. Coal Geol. 1998, 35, 147–158. [Google Scholar] [CrossRef]
  3. White, C.M.; Smith, D.H.; Jones, K.L.; Goodman, A.L.; Jikich, S.A.; LaCount, R.B.; DuBose, S.B.; Ozdemir, E.; Morsi, B.I.; Schroeder, K.T. Sequestration of carbon dioxide in coal with enhanced coalbed methane recovery—A review. Energy Fuel 2005, 19, 659–724. [Google Scholar] [CrossRef]
  4. Dudzińska, A.; Howaniec, N.; Smoliński, A. Effect of coal grain size on sorption capacity with respect to propylene and acetylene. Energies 2017, 10, 1919–1929. [Google Scholar] [CrossRef]
  5. Levine, U.G.; Schlosberg, R.H.; Silbernagel, B.G. Understanding the chemistry and physics of coal structure (A Review). Proc. Natl. Acad. Sci. USA 1982, 79, 3365–3370. [Google Scholar] [CrossRef] [Green Version]
  6. Busch, A.; Gensterblum, Y. CBM and CO2-ECBM related sorption processes in coal: A review. Int. J. Coal Geol. 2011, 87, 49–71. [Google Scholar] [CrossRef]
  7. Li, Q.; Lin, B.; Wang, K.; Zhao, M.; Ruan, M. Surface properties of pulverized coal and its effects on coal mine methane adsorption behaviors under ambient conditions. Powder Technol. 2015, 270, 278–286. [Google Scholar] [CrossRef]
  8. Vedyagin, A.A.; Mishakov, I.V. Effect of the thermal treatment of anthracite from the Gorlovo Basin on its adsorption characteristics. Solid Fuel Chem. 2016, 50, 34–38. [Google Scholar] [CrossRef]
  9. Ji, X.; Song, D.; Ni, X.; Li, Y.; Zhao, H. Coal matrix deformation and pore structure change in high-pressure nitrogen replacement of methane. Energies 2018, 11, 175–193. [Google Scholar] [CrossRef]
  10. Sing, K.S.W.; Everett, D.H.; Haul, R.A.W.; Mouscou, L.; Pierotti, R.A.; Rouquerol, J.; Siemieniewska, T. Reporting physisorption data for gas/solid systems with special reference to the determination of surface area and porosity. Pure Appl. Chem. 1985, 57, 603–619. [Google Scholar] [CrossRef]
  11. Wang, F.; Cheng, Y.; Lu, S.; Jin, K.; Zhao, W. Influence of coalification on the pore characteristics of middle-high rank coal. Energy Fuel 2014, 28, 5729–5736. [Google Scholar] [CrossRef]
  12. Nie, B.; Liu, X.; Yuan, S.; Ge, B.; Jia, W.; Wang, C.; Chen, X. Sorption characteristics of methane among various rank coals: Impact of moisture. Adsorption 2016, 22, 315–325. [Google Scholar] [CrossRef]
  13. Okolo, G.N.; Everson, R.C.; Neomagus, H.W.J.P.; Roberts, M.J.; Sakurovs, R. Comparing the porosity and surface areas of coal as measured by gas adsorption, mercury intrusion and SAXS techniques. Fuel 2015, 141, 293–304. [Google Scholar] [CrossRef]
  14. Gürdal, G.; Yalçın, M.N. Pore volume and surface area of the carboniferous coals from the Zonguldak Basin (NW Turkey) and their variations with rank and maceral composition. Int. J. Coal Geol. 2001, 48, 133–144. [Google Scholar] [CrossRef]
  15. Laxminarayana, C.; Crosdale, P. Role of coal type and rank on methane sorption characteristics of Bowen Basin, Australia coals. Int. J. Coal Geol. 1999, 40, 309–325. [Google Scholar] [CrossRef]
  16. Perera, M.S.A.; Ranjith, P.G.; Choi, S.K.; Bouazza, A.; Kodikara, J.; Airey, D. A review of coal properties pertinent to carbon dioxide sequestration in coal seams: With special reference to Victorian Brown coals. Environ. Earth Sci. 2011, 64, 223–235. [Google Scholar] [CrossRef]
  17. Zhao, J.; Xu, H.; Tang, D.; Mathews, J.; Li, S.; Tao, S. A comparative evaluation of coal specific surface area by CO2 and N2 adsorption and its influence on CH4 adsorption capacity at different pore sizes. Fuel 2016, 183, 420–431. [Google Scholar] [CrossRef]
  18. Clarksona, C.R.; Bustin, R.M. The Effect of pore structure and gas pressure upon the transport properties of coal: A laboratory and modeling study.1: Isotherms and pore volume distributions. Fuel 1999, 78, 1333–1344. [Google Scholar] [CrossRef]
  19. Jian, K.; Fu, X.; Ding, Y.; Wang, H.; Li, T. Characteristics of pores and methane adsorption of low-rank coal in China. J. Nat. Gas Sci. Eng. 2015, 27, 207–218. [Google Scholar] [CrossRef]
  20. Gao, D.; Li, M.; Wang, B.; Hu, B.; Liu, J. Characteristics of pore structure and fractal dimension of isometamorphic anthracite. Energies 2017, 10, 1881–1892. [Google Scholar] [CrossRef]
  21. Hou, S.; Wang, X.; Wang, X.; Yuan, Y.; Pan, S.; Wang, X. Pore structure characterization of low volatile bituminous coals with different particle size and tectonic deformation using low pressure gas adsorption. Int. J. Coal Geol. 2017, 183, 1–13. [Google Scholar] [CrossRef]
  22. Amarasekera, G.; Scarlett, M.J.; Mainwaring, D.E. Micropore size distributions and specific interactions in coals. Fuel 1995, 74, 115–118. [Google Scholar] [CrossRef]
  23. Liu, Z.; Zhang, Z.; Lu, Y.; Choi, S.K.; Liu, X. Sorption hysteresis characterization of CH4 and CO2 on anthracite, bituminous coal, and lignite at low pressure. ASME J. Energy Resour. Technol. 2018, 140, 012203. [Google Scholar] [CrossRef]
  24. Mastalerz, M.; He, L.; Melnichenko, Y.B.; Rupp, J.A. Porosity of coal and shale: Insights from gas adsorption and SANS/USANS techniques. Energy Fuel 2012, 26, 5109–5120. [Google Scholar] [CrossRef]
  25. Cai, Y.; Liu, D.; Pan, Z.; Yao, Y.; Li, J.; Qiu, Y. Pore structure and its impact on ch4 adsorption capacity and flow capability of bituminous and sub-bituminous coals from Northeast China. Fuel 2013, 103, 258–268. [Google Scholar] [CrossRef]
  26. Marsh, H. Adsorption methods to study microporosity in coals and carbons—A critique. Carbon 1987, 25, 49–58. [Google Scholar] [CrossRef]
  27. Velasco, L.F.; Guillet–Nicolas, R.; Dobos, G.; Thommes, M.; Lodewyckx, P. Towards a better understanding of water adsorption hysteresis in activated carbons by scanning isotherm. Carbon 2015, 96, 753–758. [Google Scholar] [CrossRef]
  28. Clarkson, C.R.; Bustin, R.M. Variation in Micropore Capacity and size distribution with composition in bituminous coal of the Western Canadian Sedimentary Basin. Fuel 1996, 75, 1483–1498. [Google Scholar] [CrossRef]
  29. Emmett, P.H.; Dewitt, T.W. The low temperature adsorption of Nitrogen, Oxygen, Argon, Hydrogen, N–Butane and carbon dioxide on porous glass and on Partially Dehydrated Chabazite. J. Am. Chem. Soc. 1943, 65, 617–621. [Google Scholar] [CrossRef]
  30. Gan, H.; Nandi, S.P.; Jr, P.L.W. Nature of the porosity in American coals. Fuel 1972, 51, 272–277. [Google Scholar] [CrossRef]
  31. Liu, G.; Bai, Y.; Fan, Z.; Gu, D. Determination of Klinkenberg permeability conditioned to pore-throat structures in tight formations. Energies 2017, 10, 1575–1592. [Google Scholar] [CrossRef]
  32. Yao, Y.; Liu, D. Comparison of low-field NMR and mercury intrusion porosimetry in characterizing pore size distributions of coals. Fuel 2012, 95, 152–158. [Google Scholar] [CrossRef]
  33. Lai, J.; Wang, G. Fractal Analysis of Tight gas sandstones using high–pressure mercury intrusion techniques. J. Nat. Gas Sci. Eng. 2015, 24, 185–196. [Google Scholar] [CrossRef]
  34. Guo, X.; Yao, Y.; Liu, D. Characteristics of coal matrix compressibility: An investigation by mercury intrusion porosimetry. Energy Fuel 2014, 28, 3673–3678. [Google Scholar] [CrossRef]
  35. Nishino, J. Adsorption of water vapor and carbon dioxide at carboxylic functional groups on the surface of coal. Fuel 2001, 80, 757–764. [Google Scholar] [CrossRef]
  36. La’szlo’, K.; Czakkel, O.; Dobos, G.; Lodewyckx, P.; Rochas, C.; Geissler, E. Water vapour adsorption in highly porous carbons as seen by small and wide angle X-Ray scattering. Carbon 2010, 48, 1038–1048. [Google Scholar] [CrossRef]
  37. Charrière, D.; Behra, P. Water sorption on coals. J. Colloid Interf. Sci. 2010, 344, 460–467. [Google Scholar] [CrossRef] [PubMed]
  38. Zeng, Y.; Prasetyo, L.; Nguyen, V.T.; Horikawa, T.; Do, D.D.; Nicholson, D. Characterization of oxygen functional groups on carbon surfaces with water and methanol adsorption. Carbon 2014, 81, 447–457. [Google Scholar] [CrossRef]
  39. Furmaniak, S.; Gauden, P.A.; Terzyk, A.P.; Rychlicki, G. Water Adsorption on carbons–critical review of the most popular analytical approaches. Adv. Colloid Interface 2008, 137, 82–143. [Google Scholar] [CrossRef] [PubMed]
  40. Shigehisa, T.; Inoue, T.; Kumagai, H. Water adsorption and desorption of upgraded Brown coal. Part 1: Isotherms of adsorption and desorption. Energy Fuel 2014, 28, 4986–4992. [Google Scholar] [CrossRef]
  41. Chen, Y.; Mastalerz, M.; Schimmelmann, A. Characterization of chemical functional groups in macerals across different coal ranks via micro-FTIR spectroscopy. Int. J. Coal Geol. 2012, 104, 22–33. [Google Scholar] [CrossRef]
  42. Mel’Gunov, M.S.; Ayupov, A.B. Direct method for evaluation of BET adsorbed monolayer capacity. Micropor. Mesopor. Mater. 2017, 243, 147–153. [Google Scholar] [CrossRef]
  43. Ozdemir, E.; Schroeder, K. Effect of moisture on adsorption isotherms and adsorption capacities of CO2 on coals. Energy Fuel 2009, 23, 2821–2831. [Google Scholar] [CrossRef]
  44. Monson, P.A. Understanding adsorption/desorption hysteresis for fluids in mesoporous materials using simple molecular models and classical density functional theory. Micropor. Mesopor. Mater. 2012, 160, 47–66. [Google Scholar] [CrossRef]
  45. Boer, J.H.D.; Lippens, B.C. Studies on pore systems in catalysts II. The shapes of pores in aluminum oxide systems. J. Catal. 1964, 3, 38–43. [Google Scholar]
  46. Ozdemir, E.; Morsi, B.I.; Schroeder, K. Importance of volume effects to adsorption isotherms of carbon dioxide on coals. Langmuir 2003, 19, 9764–9773. [Google Scholar] [CrossRef]
  47. Melnichenko, Y.B.; He, L.; Sakurovs, R.; Kholodenko, A.L.; Blach, T.; Mastalerz, M.; Radlin’ski, A.P.; Cheng, G.; Mildner, D.F.R. Accessibility of pores in coal to methane and carbon dioxide. Fuel 2012, 91, 200–208. [Google Scholar] [CrossRef] [Green Version]
  48. Naono, H.; Hakuman, M. Analysis of porous texture by means of water vapor adsorption isotherm with particular attention to lower limit of hysteresis loop. J. Colloid Interface Sci. 1993, 158, 19–26. [Google Scholar] [CrossRef]
  49. Horikawa, T.; Muguruma, T.; Do, D.D.; Sotowa, K.I.; Alcántara-Avila, J.R. Scanning curves of water adsorption on graphitized thermal carbon black and ordered mesoporous carbon. Carbon 2015, 95, 137–143. [Google Scholar] [CrossRef] [Green Version]
  50. Saliba, S.; Ruch, P.; Volksen, W.; Magbitang, T.P.; Dubois, G.; Michel, B. Combined influence of pore size distribution and surface hydrophilicity on the water adsorption characteristics of micro- and mesoporous silica. Micropor. Mesopor. Mat. 2016, 226, 221–228. [Google Scholar] [CrossRef]
  51. Rutherford, S.W. Modeling water adsorption in carbon micropores: Study of water in carbon molecular sieves. Langmuir 2006, 22, 702–728. [Google Scholar] [CrossRef] [PubMed]
  52. Švábová, M.; Weishauptová, Z.; Přibyl, O. Water vapour adsorption on coal. Fuel 2011, 90, 1892–1899. [Google Scholar] [CrossRef]
  53. McCutcheon, A.L.; Barton, W.A.; Wilson, M.A. Characterization of water adsorbed on bituminous coals. Energy Fuel 2003, 17, 107–112. [Google Scholar] [CrossRef]
Figure 1. The information of coal specimens: (a) The locations, and (bd) stratigraphic columns.
Energies 11 01502 g001
Figure 2. Schematic diagram of IGA. (1, admit valve; 2, exhaust valve; 3, vacuum pump; 4, micro-balance; 5, sample basket; 6, pressure transducer; 7, temperature transducer; 8, thermostat; 9, data system).
Energies 11 01502 g002
Figure 3. SEM images of the coal samples.
Energies 11 01502 g003
Figure 4. FT-IR spectra of the coal samples.
Energies 11 01502 g004
Figure 5. N2 and CO2 isotherms for the coal samples: (a) N2 adsorption/desorption isotherms at 77 K; (b) CO2 adsorption isotherms at 273 K.
Energies 11 01502 g005
Figure 6. PSD of the coal samples: (a) PSD determined by N2 adsorption; (b) PSD determined by CO2 adsorption.
Energies 11 01502 g006
Figure 7. PSD and SSA of the coal samples for MIP method: (a) PSD of the coal samples; (b) SSA of the samples.
Energies 11 01502 g007
Figure 8. Water adsorption-desorption isotherms for the samples at 298 K.
Energies 11 01502 g008
Figure 9. Fitting models to the experimental data.
Energies 11 01502 g009
Figure 10. Comparison of the measurable ranges of the methods for coal pore sizes.
Energies 11 01502 g010
Table 1. Structural properties of the coal samples.
PropertiesAnthraciteBituminous CoalLignite
BET N2-SSA (m2/g)0.1870.7441.498
BJH N2-SSA (m2/g)0.1781.0651.985
D-R CO2-SSA (m2/g)120.3854.5498.71
D-A CO2-SSA (m2/g)74.3445.7761.05
MIP SSA7.42216.8210.69
BJH N2-pore volume (×10–3 cm3/g)0.5431.2754.021
MIP-pore volume (×10–3 cm3/g)5.520.38.2
D-A CO2-micropore volume (×10–3 cm3/g)26.3511.9421.61
BET N2-average pore width (Å)122.7151.778.03
BJH N2-adsorption pore width (Å)132.447.8945.92
Table 2. Proximate and ultimate analyzes of the coal samples.
Proximate Analysis (wt %)Ultimate Analysis (wt % daf)
Coal MineCoal RankCfixVdafAadMCHNO
DatongAnthracite73.8512.8113.341.9690.113.790.962.05
ZhaolouBituminous coal65.128.7116.241.5082.544.571.0811.03
DaliutaLignite53.5536.9619.422.4672.714.951.1920.50
Notes: Cfix, fixed carbon; Vdaf, volatile matters; Aad, ash; M, moisture.
Table 3. Fitting parameters by the models.
SampleDent ModelD-W Model
m0K1K2R-Squares0sR-Square
Anthracite0.122.320.850.99910.850.0230.9812
Bituminous coal0.424.780.700.98253.350.0260.9935
Lignite0.902.110.630.99625.300.0430.9989

