Article

Experimental and Numerical Studies on Flow and Turbulence Characteristics of Impinging Stream Reactors with Dynamic Inlet Velocity Variation

1
School of Energy and Power Engineering, Huazhong University of Science and Technology, 1037 Luoyu Road, Wuhan 430074, China
2
Power Generation Branch, Powerchina Hubei Electric Engineering Corporation Limited, No.1 Xinqiaosi Road, Jinyinhu Street, Dongxihu District, Wuhan 430040, China
*
Author to whom correspondence should be addressed.
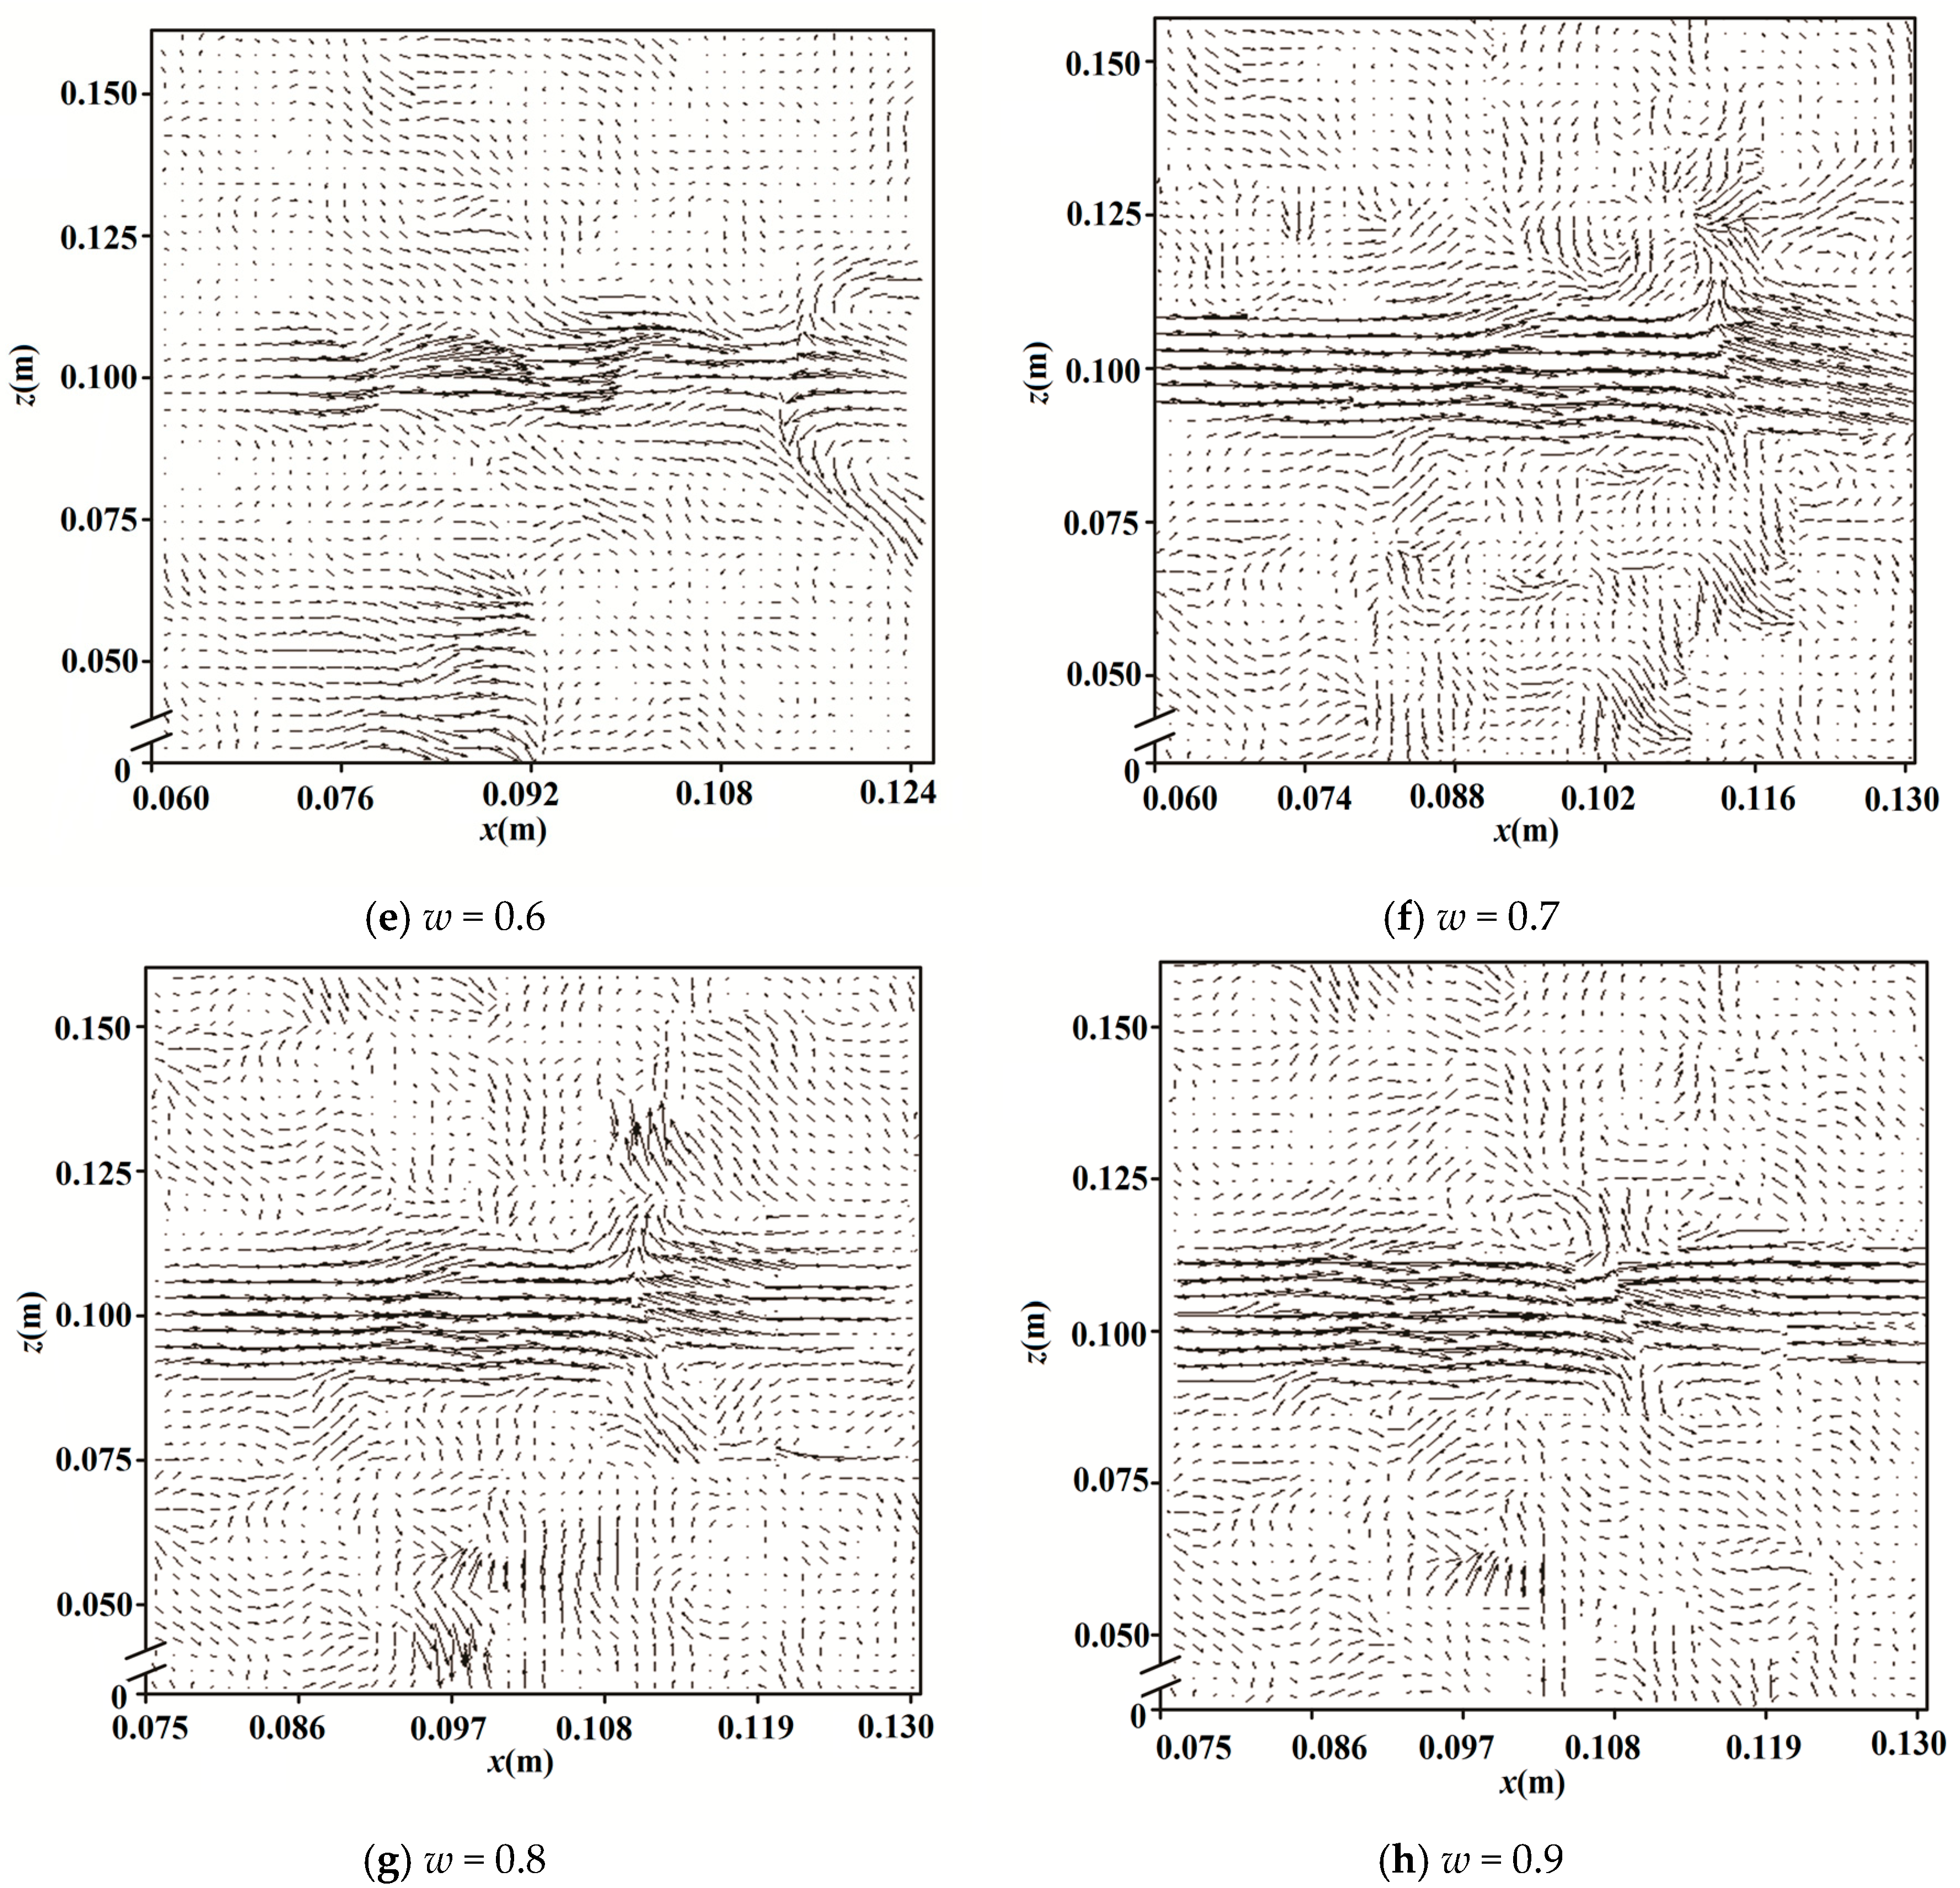
Energies 2018, 11(7), 1717; https://doi.org/10.3390/en11071717
Submission received: 7 May 2018 / Revised: 27 June 2018 / Accepted: 28 June 2018 / Published: 1 July 2018

Abstract

:
Impinging stream technique has been widely used in engineering industries. Insufficient data are available on the effects of dynamic inflow conditions on the flow and turbulence characteristics of an impinging stream reactor. In this study, we investigate and discuss the flow and turbulence characteristics of an impinging stream reactor with dynamic inlet velocity variation, e.g., sinusoidal, parabolic, step or triangular variation. The effects of period, amplitude, phase difference, mean inlet velocity and type of dynamic inlet velocity variation on the motional behaviors of the impinging surface and the mean turbulence kinetic energy (k) of the impingement region are investigated and discussed using particle image velocimetry (PIV) and computational fluid dynamics (CFD) at various values of L/D (the ratio of impinging spacing to nozzle diameter). The results show that the impinging surface makes back-and-forth motions in impinging stream reactors with dynamic inlet velocity variation. The mean k of the impingement region during one period is dominated by both the inlet velocity conditions and the geometric configuration. Dynamic inflow conditions bring more turbulence energy and pulsating characteristics to impinging zones over constant inlet velocity for an instantaneously moving impinging surface. Impinging stream reactors with dynamic inlet velocity variation provides more intense turbulence properties over conventional impinging stream reactors at the same mean inlet velocity. This work shows that the impinging streams with dynamic inlet velocity variation has strong potential for future relevant reactors and processes for engineering applications.

1. Introduction

The concept of impinging streams was first proposed by Soviet scientist Elperin [1]. Subsequently, Tamir carried out extensive fundamental and applied research on impinging streams [2]. Impinging stream reactors have been widely applied and investigated in numerous industrial applications, including the drying of high-moisture particles [3,4,5], fast preparation of nanoparticles [6,7], fluid micromixing [8,9], absorption [10,11] and liquid-liquid extraction [12]. Compared to common methods, impinging stream methods can enhance the momentum, heat, and mass transfer of the relevant reaction process because there is a larger relative velocity and pressure gradient in the impingement region formed by the collision of two opposite jets [1].
A number of investigations have been conducted on impinging streams using experiments or computational tools. A continuously increasing number of studies use both numerical simulations and experimental verification to report required information about impinging streams. Rajaie et al. examined the residence time distribution of the aqueous phase and the droplet velocity of the flow field via a direct simulation Monte Carlo method [13]. Wu et al. numerically studied particle motion behavior in axisymmetric impinging streams and found that the simulation results were basically consistent with experiment data [14]. Liu performed numerous experimental and simulation studies on the intensified micromixing performance of microimpinging stream reactors [10]. Du and Zhao proposed a modified direct simulation Monte Carlo method to investigate the particle motion behavior by considering interparticle collision [15], and their results agree well with the realistic multiphase transport phenomena of the flow field. Ghasemi and Sohrabi performed numerous numerical simulations to assess the particle holdup and residence time under different gas and liquid flow rates using a CFD tool [16]. They reported that, in simulations of particle and fluid behavior, CFD modeling produced results in good agreement with experiments. Choicharoen and Devahastin conducted many simulations on multiphase transport in an impinging stream dryer using a CFD model [17]. They discussed the influence of the impinging distance, inlet air velocity, and wet material flow rate on the drying performance of an impinging stream reactor, which they found to agree with experimental results. Metzger and Kind conducted many numerical studies on the fast precipitation crystallization processes using CFD-PBE (population balance equation) [18]. Metzger et al. used spatially and temporally averaged reduced numeric measurement and CFD methods to investigate the precipitation crystallization in a confined impinging jet mixer [19]. Therefore, the CFD tool has become a very popular and credible computational tool for investigating and measuring needed information about the flow field in an impinging stream reactor.
Much work has been done on the flow and turbulence characteristics of the flow field in coaxial impinging stream reactors [20,21,22,23,24]. Huai et al. have studied drying and flow characteristics in a semicircular impinging stream reactor. They observed that reasonably designing the geometrical structure and inlet condition parameters (inlet air velocity, granular material flux, initial moisture content, etc.) could increase the drying efficiency with low energy consumption and operating costs [25]. Zhang et al. investigated the flow and mixing characteristics of two-dimensional confined impinging streams with uniform and nonuniform inlet jets by means of the lattice Boltzmann method. He found that inlet velocity profiles and different configuration parameters strongly influenced the flow and mixing characteristics and temperature field distributions [26]. Metzger et al. investigated the transient flow characteristics in T-shaped impinging jet mixers. In their work, effects of inlet conditions and geometric factors of the reactor were investigated and discussed [27]. Kleingeld et al. examined mass transfer in heterogeneous systems in an impinging stream reactor. They found that a high fluid flow rate in impinging streams techniques can provide improvements in the interfacial phase area and mass transfer coefficients over traditional chemical processes [28]. Ahmed and Al-Abdeli carried out extensive simulation studies on the influence of inflow conditions on the flow characteristics of the swirling and nonswirling impinging turbulent jets using six different turbulence models. The results showed that the six different turbulence models successfully reproduced the main features of the flow characteristics of impinging streams in same cases [29]. Li and Sun performed numerous experimental and numerical studies on the flow characteristics and stagnation point offset of a turbulent impinging stream reactor with different inlet velocity ratios. They found that the length of the impingement region is the same when 4 ≤ L/D ≤ 8, where L/D is the ratio between the nozzle diameter and the jet spacing [30]. The aforementioned findings indicate that the inlet conditions and geometric parameters of impinging stream reactors strongly affect the flow and turbulence characteristics of the flow field.
Although an increasing number of articles focusing on impinging streams are being reported, most studies remain limited to the conventional impinging streams where both inlet velocity are the same and not varied with time. A few articles on impinging streams with dynamic inlet velocity variation address flow and turbulence characteristics. Wang numerically studied the motion behavior of gas and particles in impinging stream reactors with oscillatory gas-particle jets [31]. The effects of the oscillation frequency of the opposed jets on the solid volume fraction, stagnation point, motion characteristics of vortices and turbulence kinetic energy of the gas phase have been widely discussed. Simulations show that impinging surfaces undergo horizontal reciprocating movements in the flow field and that the solid volume fraction and turbulence kinetic energy of the gas phase are highest in the impinging zone. Ghadi and Esmailpour experimentally investigated characteristics of the vortex structures in the pulsed turbulent impinging jet using a smoke-wire technique and high-speed photography [32]. They found that, compared with steady impinging jets, impinging jets with inflow pulsation can enhance convective transport phenomena in the flow field. However, up to now, little detailed information is available on the effects of dynamic inlet velocity variation on the flow and turbulence characteristics of the flow field. Given that inlet velocity conditions are closely related to the velocity distribution of the flow field, investigations of the fluid flow behavior of impinging stream reactors with dynamic inlet velocity variation are of theoretical and practical importance.
In view of the aforementioned considerations, the purpose of the present work is to study the flow and turbulence characteristics of a coaxial impinging stream reactor in which both inlet velocities exhibit dynamic variation, e.g., sinusoidal, parabolic, step or triangular variation in one period with a phase shift. The organization of the rest of the paper is as follows. Section 2 gives a brief introduction of the background and theoretical foundation of fluid motions in the flow field via CFD tools. Section 3 presents the experimental system of impinging stream reactor and fluid motion behavior are measured and investigated by Particle image velocimetry (PIV). Section 4 gives a detailed description on the flow and turbulence characteristics of fluid, analyzes and discusses the effects of period, amplitude, and different inlet velocity flow patterns on the motion characteristics of the impinging surface and the axial turbulence characteristics of the impinging stream reactor with dynamic inlet velocity variation. Section 5 summarizes research work and research conclusions of this paper and next specific topics in future.

2. Model Description

2.1. Fluid Dynamics Modeling Framework

The continuity balance of the fluid phase, without chemical reactions, is
ρ t + x i ( ρ u i ) = 0
where ρ denotes the density of the liquid phase and u is the velocity of the liquid phase.
The momentum balance of the liquid phase without chemical reactions and source terms, is
t ( ρ u i ) + x j ( ρ u i u j ) = p x i + τ x j + ρ g i
where g i is the gravitational acceleration component and τ is the stress tensor of the liquid phase. The stress tensor of the liquid phase is calculated by a Newtonian-type approximation with an effective viscosity that sums the laminar viscosity and the turbulence viscosity of the liquid.
The realizable k-ε model is adopted for the fluid turbulence model in the simulation conditions of this work. The governing equations for the turbulence kinetic energy, k, and the dissipation rate, ε, are [33]
( ρ k ) t + ( ρ k u i ) x i = x j [ ( μ + μ t σ k ) k x j ] + G k
and
( ρ ε ) t + ( ρ ε u i ) x i = x j [ ( μ + μ t σ ε ) ε x j ] ρ ( C 1 S ε C 2 ε 2 k + υ ε )
In Equations (3) and (4), G k = μ t S 2 , C 1 = max [ 0.43 η / ( η + 5 ) ] , η = S k / ε , μ t = ρ C μ k 2 / ε , C 2 = 1.9 , σ ε = 1.2 , and σ k = 1.0 , S = ( 2 S i j S i j ) 1 / 2 .

2.2. Inlet Velocity Variation

The left inlet velocity, uL, and the right inlet velocity, uR, are defined as follows with respect to the sinusoidal inlet velocity flow pattern:
u L = u m + A sin ( 2 π / T · t + φ L )
u R = u m + A sin ( 2 π / T · t + φ R )
Δ φ = φ L φ L
Δ u = u L u R = A sin ( 2 π / T · t + φ L ) A sin ( 2 π / T · t + φ R )
u = u L + u R 2 = u m + A sin ( 2 π / T · t + φ L ) + A sin ( 2 π / T · t + φ R ) 2
where u* is the instantaneous mean velocity of both inlet fluids, ∆u is the inlet velocity difference between both opposed jets, T is the period of inlet velocity variation, and A is the amplitude of the inlet velocity variation. The fact that um ± A ≥ 0 ensures a net positive flow into the impinging stream reactor. Terms φL and φR are the initial phases of the left and right inlet velocity, respectively, and ∆φ represents the initial phase difference between φL and φR. Parameters uL and uR have the same mean inlet velocity (u0aver, L, u0aver, R) in one period, as shown in Equations (10) and (11), in accordance with the definition of impinging streams [2]. In this study, the variable-controlling approach is used to investigate and discuss the effects of dynamic inlet velocity conditions (e.g., ∆u, u*, T, ∆φ, A, um, and L/D) on the flow and turbulence characteristics of the impinging streams.
u 0 a v e r , L = 1 T 0 T u L d t = 1 T 0 T [ u m + A sin ( 2 π / T · t + φ L ) ] d t = u m
u 0 a v e r , R = 1 T 0 T u R d t = 1 T 0 T [ u m + A sin ( 2 π / T · t + φ R ) ] d t = u m
Similarly, both uL and uR under other inlet velocity flow patterns (Table 1 and Figure 1) where ∆φ = T/2 are studied generally in this paper.

2.3. Boundary Conditions

The boundary conditions for the impinging stream reactor are shown in Figure 2. The aforementioned curves of inlet velocity variation at um = 1.25 m/s, T = 0.4 s, and A = 0.25 m/s are shown in Figure 1. The uL and uR are symmetric about um = 1.25 m/s, with ∆φ = 2/T. Except that the effect of ∆φ on the flow characteristic of impinging streams is independently studied in the sinusoidal inlet velocity flow pattern by means of CFD, the effect of other variables (T, A) are investigated in different inlet velocity flow patterns via simulations and experiments in this study.

2.4. Simulation Conditions and Grid Test

The geometrical model for impinging stream reactors consists of two coaxial nozzles and one collision chamber, shown in Figure 2. Water is chosen as the working fluid. The gravity of water is neglected because the reactor is submerged in the water tank. For simulation conditions, the SIMPLE algorithm is used to solve the coupling of the velocity and pressure equations in this work. While the power-law scheme is adopted in the spatial discretization for the conservation equations. The time step is 10−4 s, and the convergence criterion is set to 10−3 for all equations.
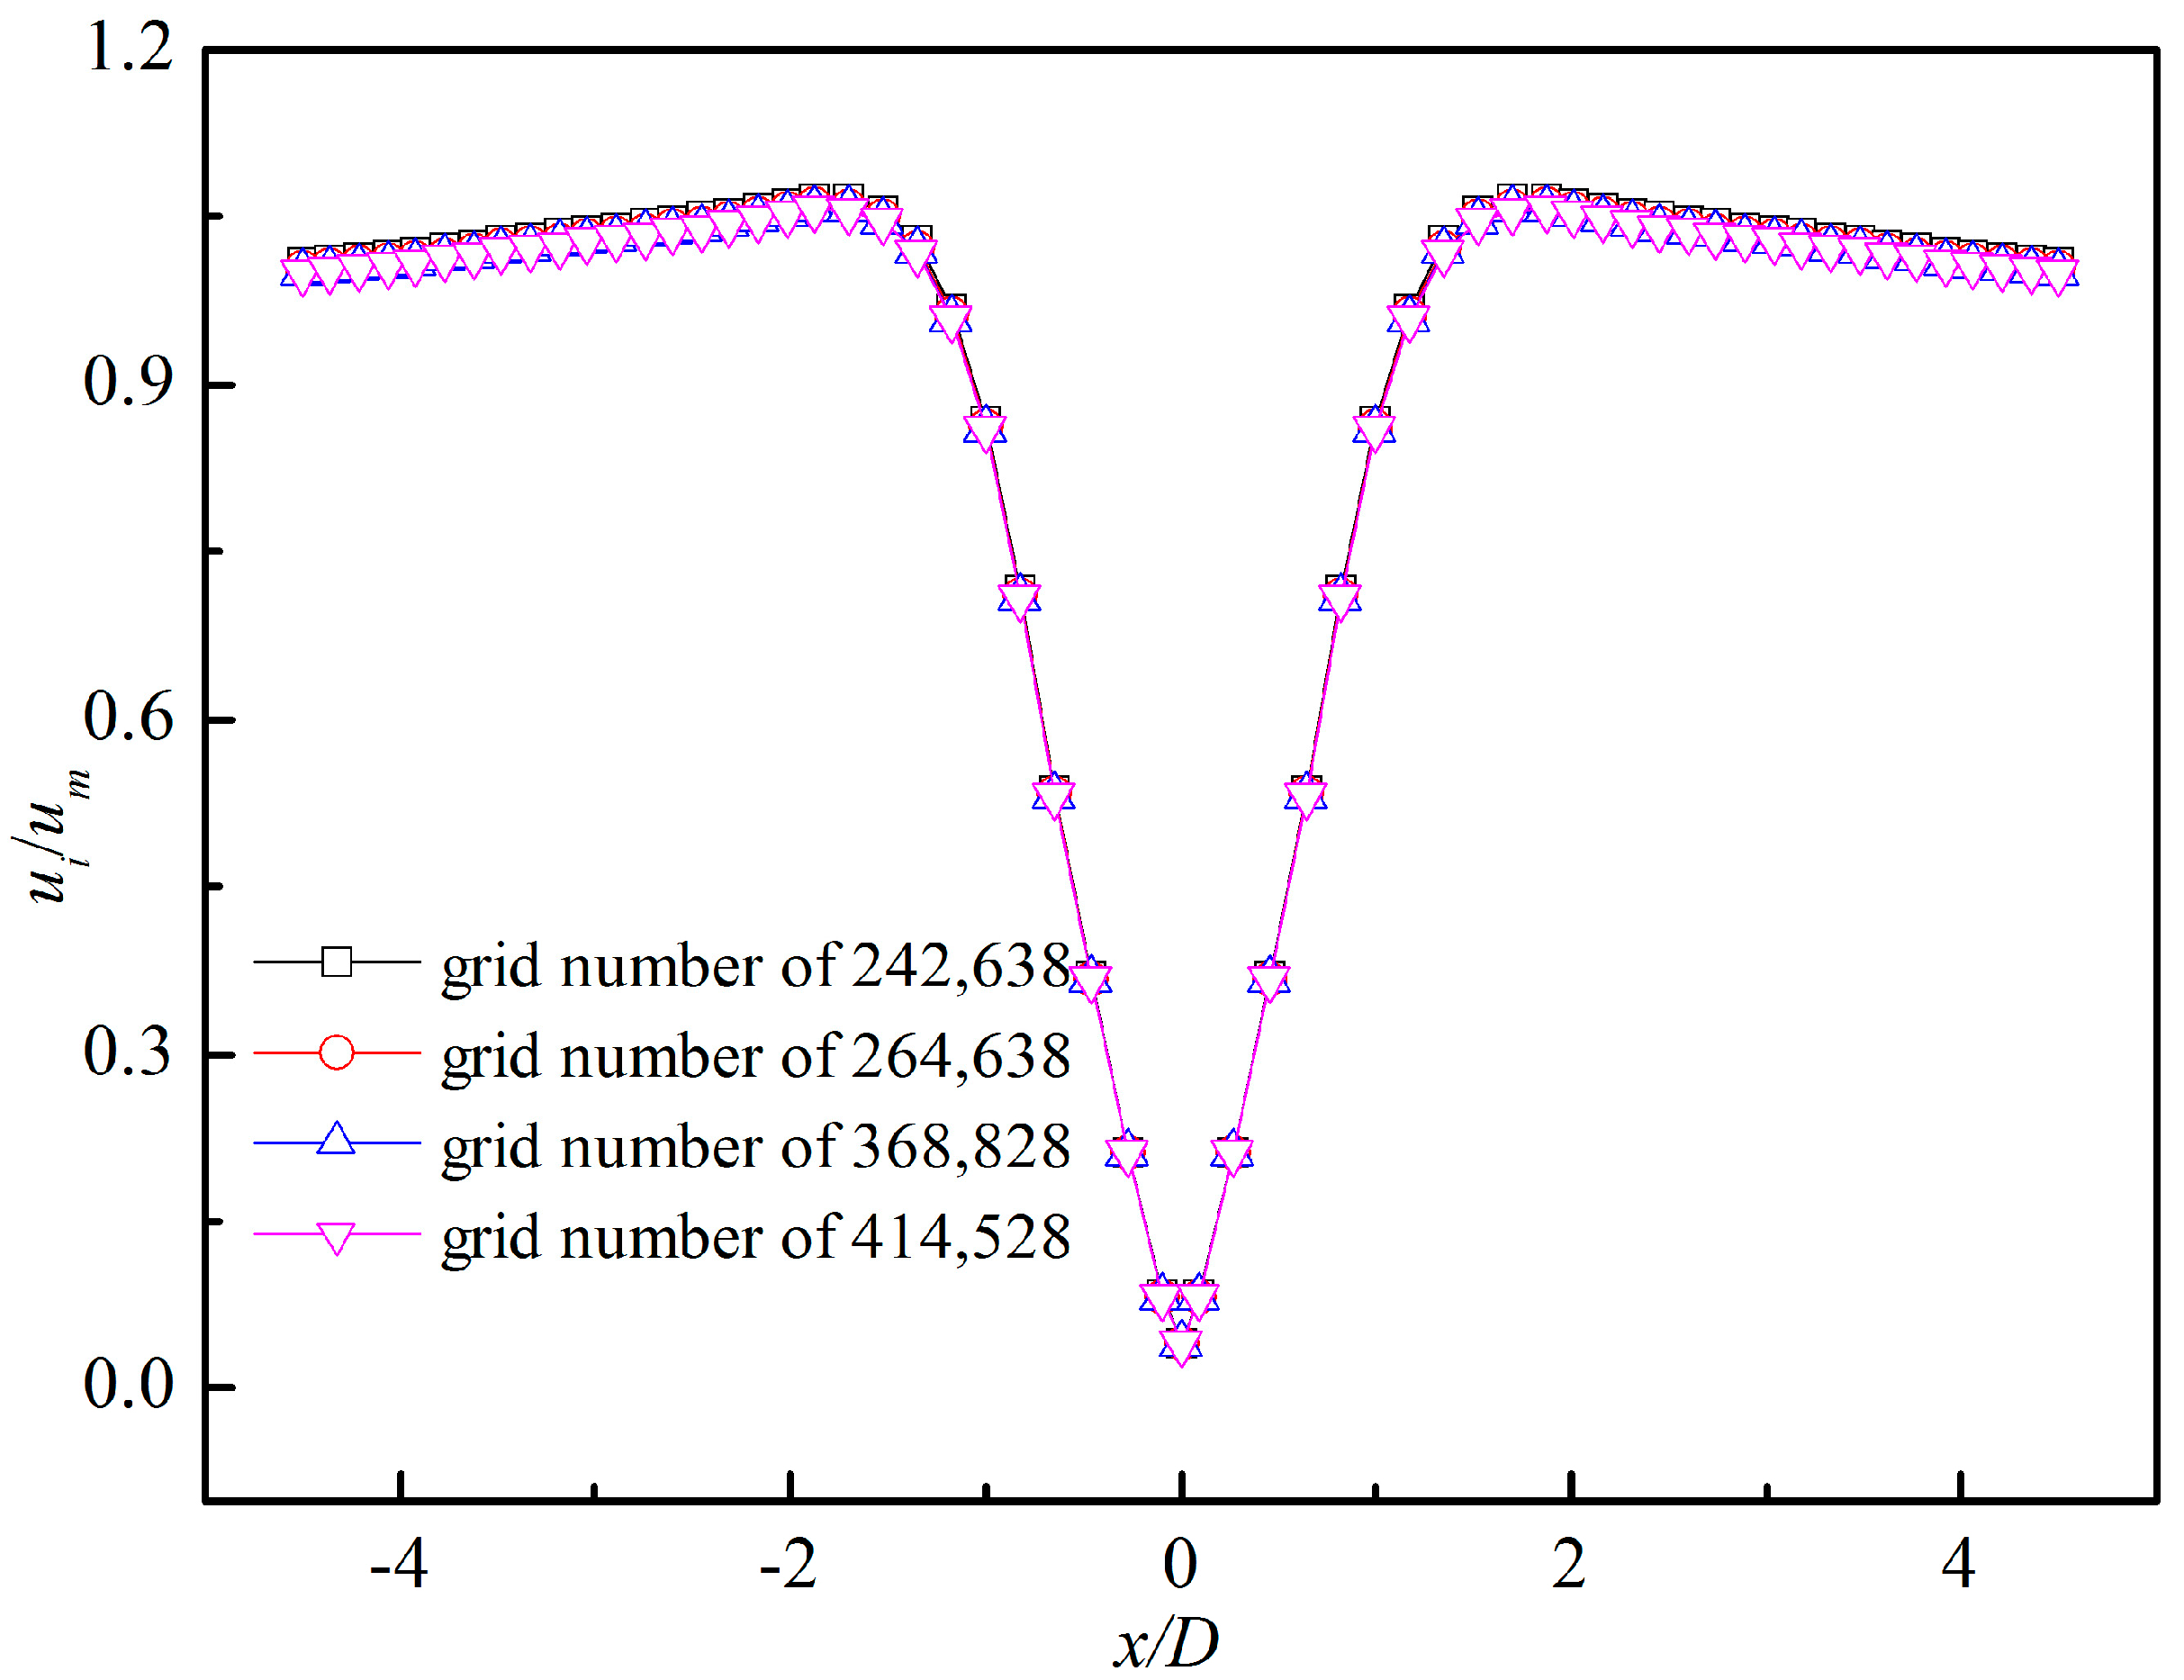
To verify that the results are independent of the grid size, 242,638, 264,638, 368,828 and 414,528 mesh elements are used to simulate the flow field. The results in Figure 3 show that the maximum differences in terms of axial velocity distribution of the fluid on the nozzle axis are less than 2% under simulation conditions using 242,638, 264,638, 368,828 and 414,528 mesh elements. Therefore, 242,638 grid model is chosen in the simulations to reduce the simulation time.

3. Experimental Setup

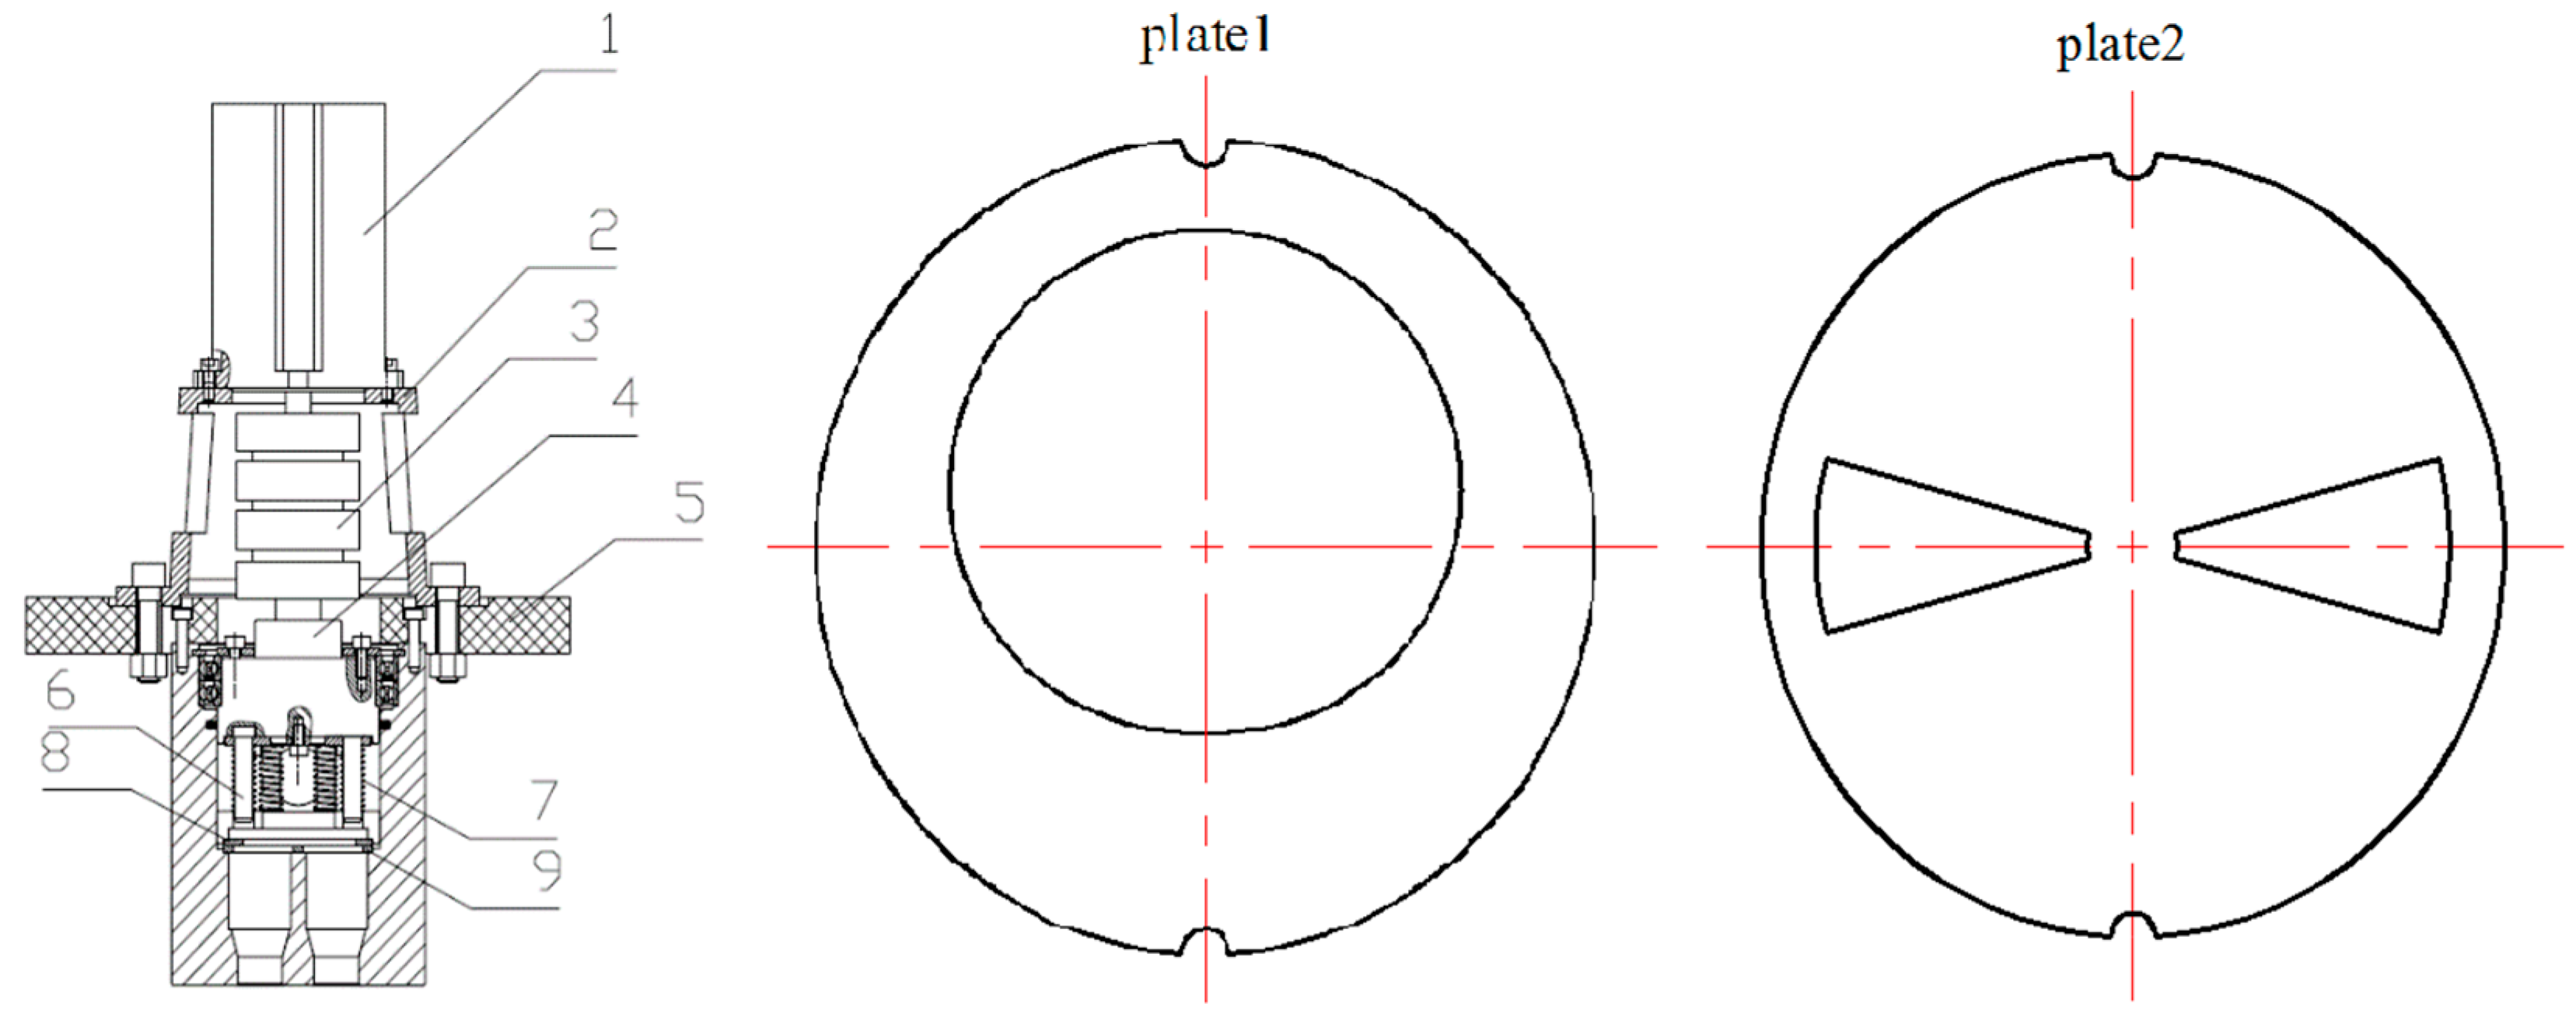
The experimental system consisted of a PIV measurement system and a closed water circulation circuit system. The closed water circulation circuit system includes the shunting device, buffer tank, conical tank, cylindrical collision chamber, pump and different kinds of connecting pipes, valves and flow-meters, as shown in Figure 4. A physical drawing of part of the experimental system is shown in Figure 5. Water is pumped from the buffer tank to a shunting device and is then turned into two streams that can be working fluid in the cylindrical collision chamber. After completion of the impinging experiments, the fluid returns to the water tank through the pipelines, thus forming a closed water circulation circuit. The shunting device includes one static plate (plate 2) and one dynamic rotating plate (plate 1) driven by the motor built into the shunting device, as shown in Figure 6. Properly designing the hole shape on plate 1 can make the two shunting flow rates vary in a sinusoidal, step, parabolic or triangular pattern with time, which is consistent with simulation conditions using CFD.
The xz plane of the flow field of an impinging stream reactor is measured using a PIV system made by LaVision, Germany. A camera, the PIVCAM13-8, in the ImagePro Plus/ProX4M series is chosen as the high-speed camera for the experiments. The laser used in these experiments is a YAG double-pulse laser with a wavelength of 532 nm. The CCD chips of the cameras scanned, frame-by-frame, the xz plane irradiated by the laser in the collision chamber. The frame rate is varied from 15 to 40 frames per second to trace the instantaneous vector maps on the xz plane. The consecutive frames were divided into 32 × 16 pixel2 interrogation windows with a 50% overlap. The time interval between the two frames, Δt, is set to 15 μs. Hollow glass spheres with good solubility in water and a density identical to that of water are used as tracer particles in the experiments. The number of samples is greater 1000 frames for every kind of inlet flow pattern shown in Table 2. Properties of water and geometric parameters of the impinging stream reactor are shown in Table 3. These frames are subsequently used for the quantitative analysis of the influence of the dynamic inlet velocity variation on the fluid velocity distribution of flow field.

4. Results and Discussion

4.1. Experimental Verification

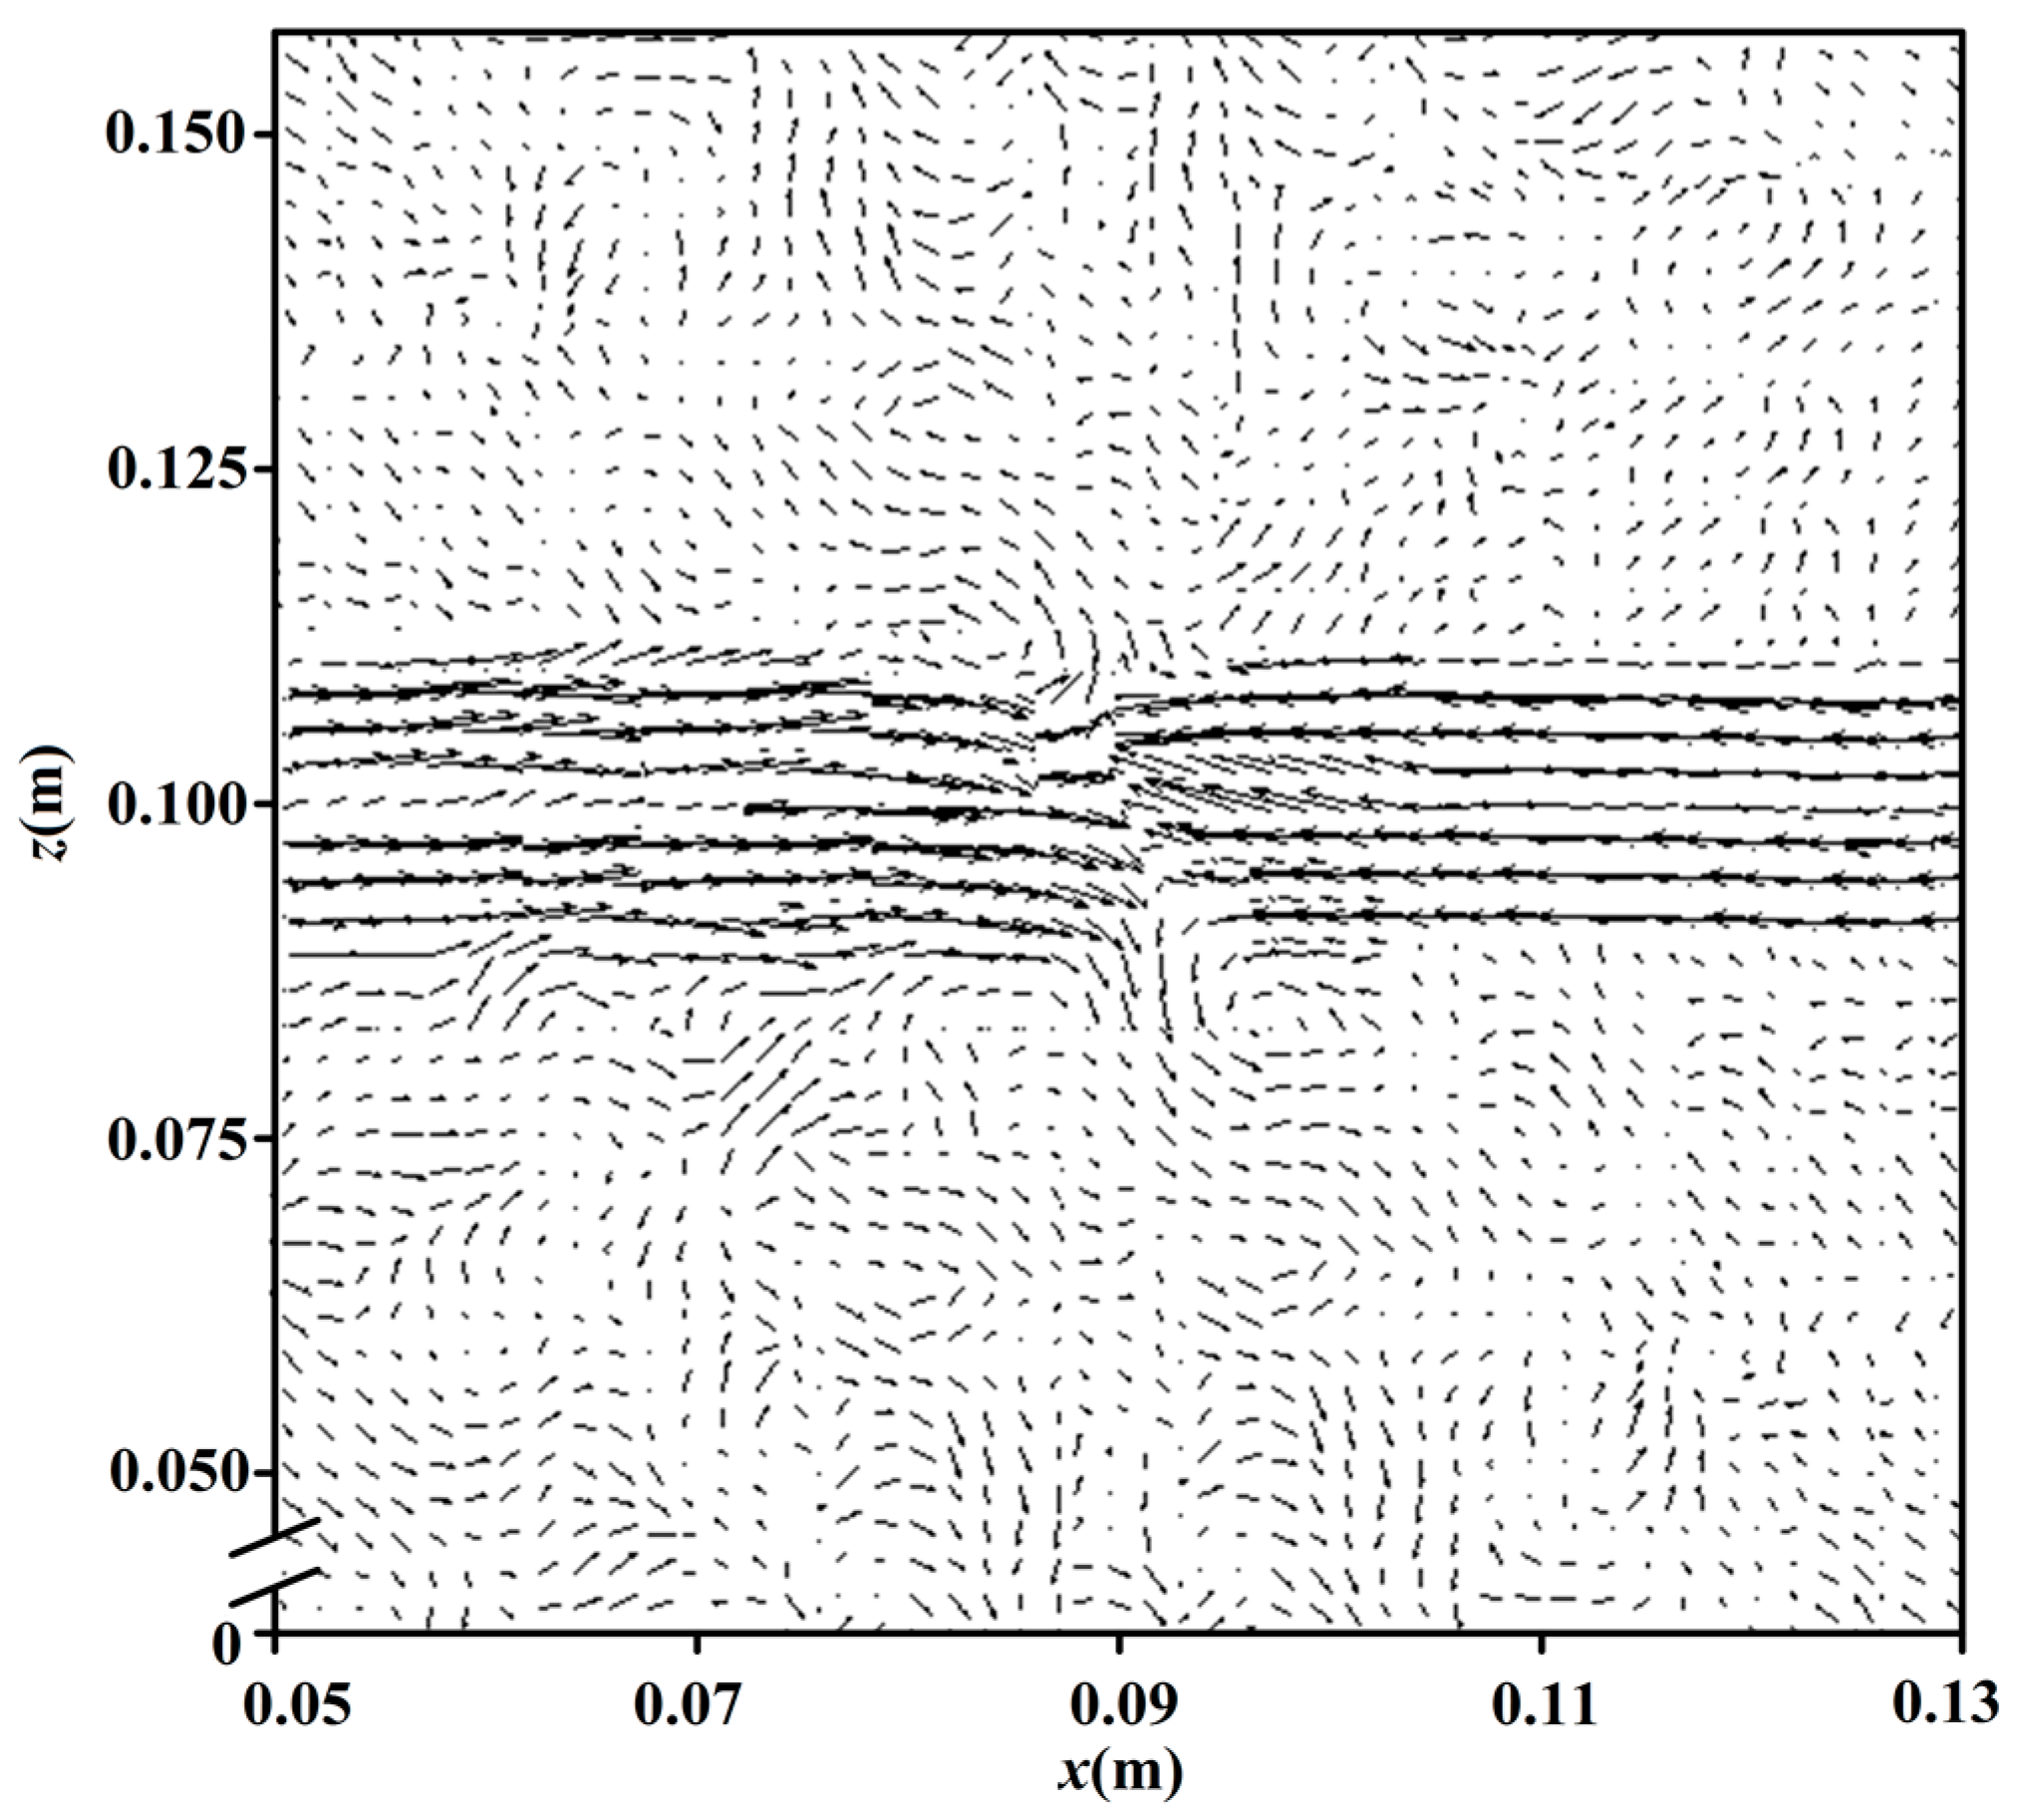
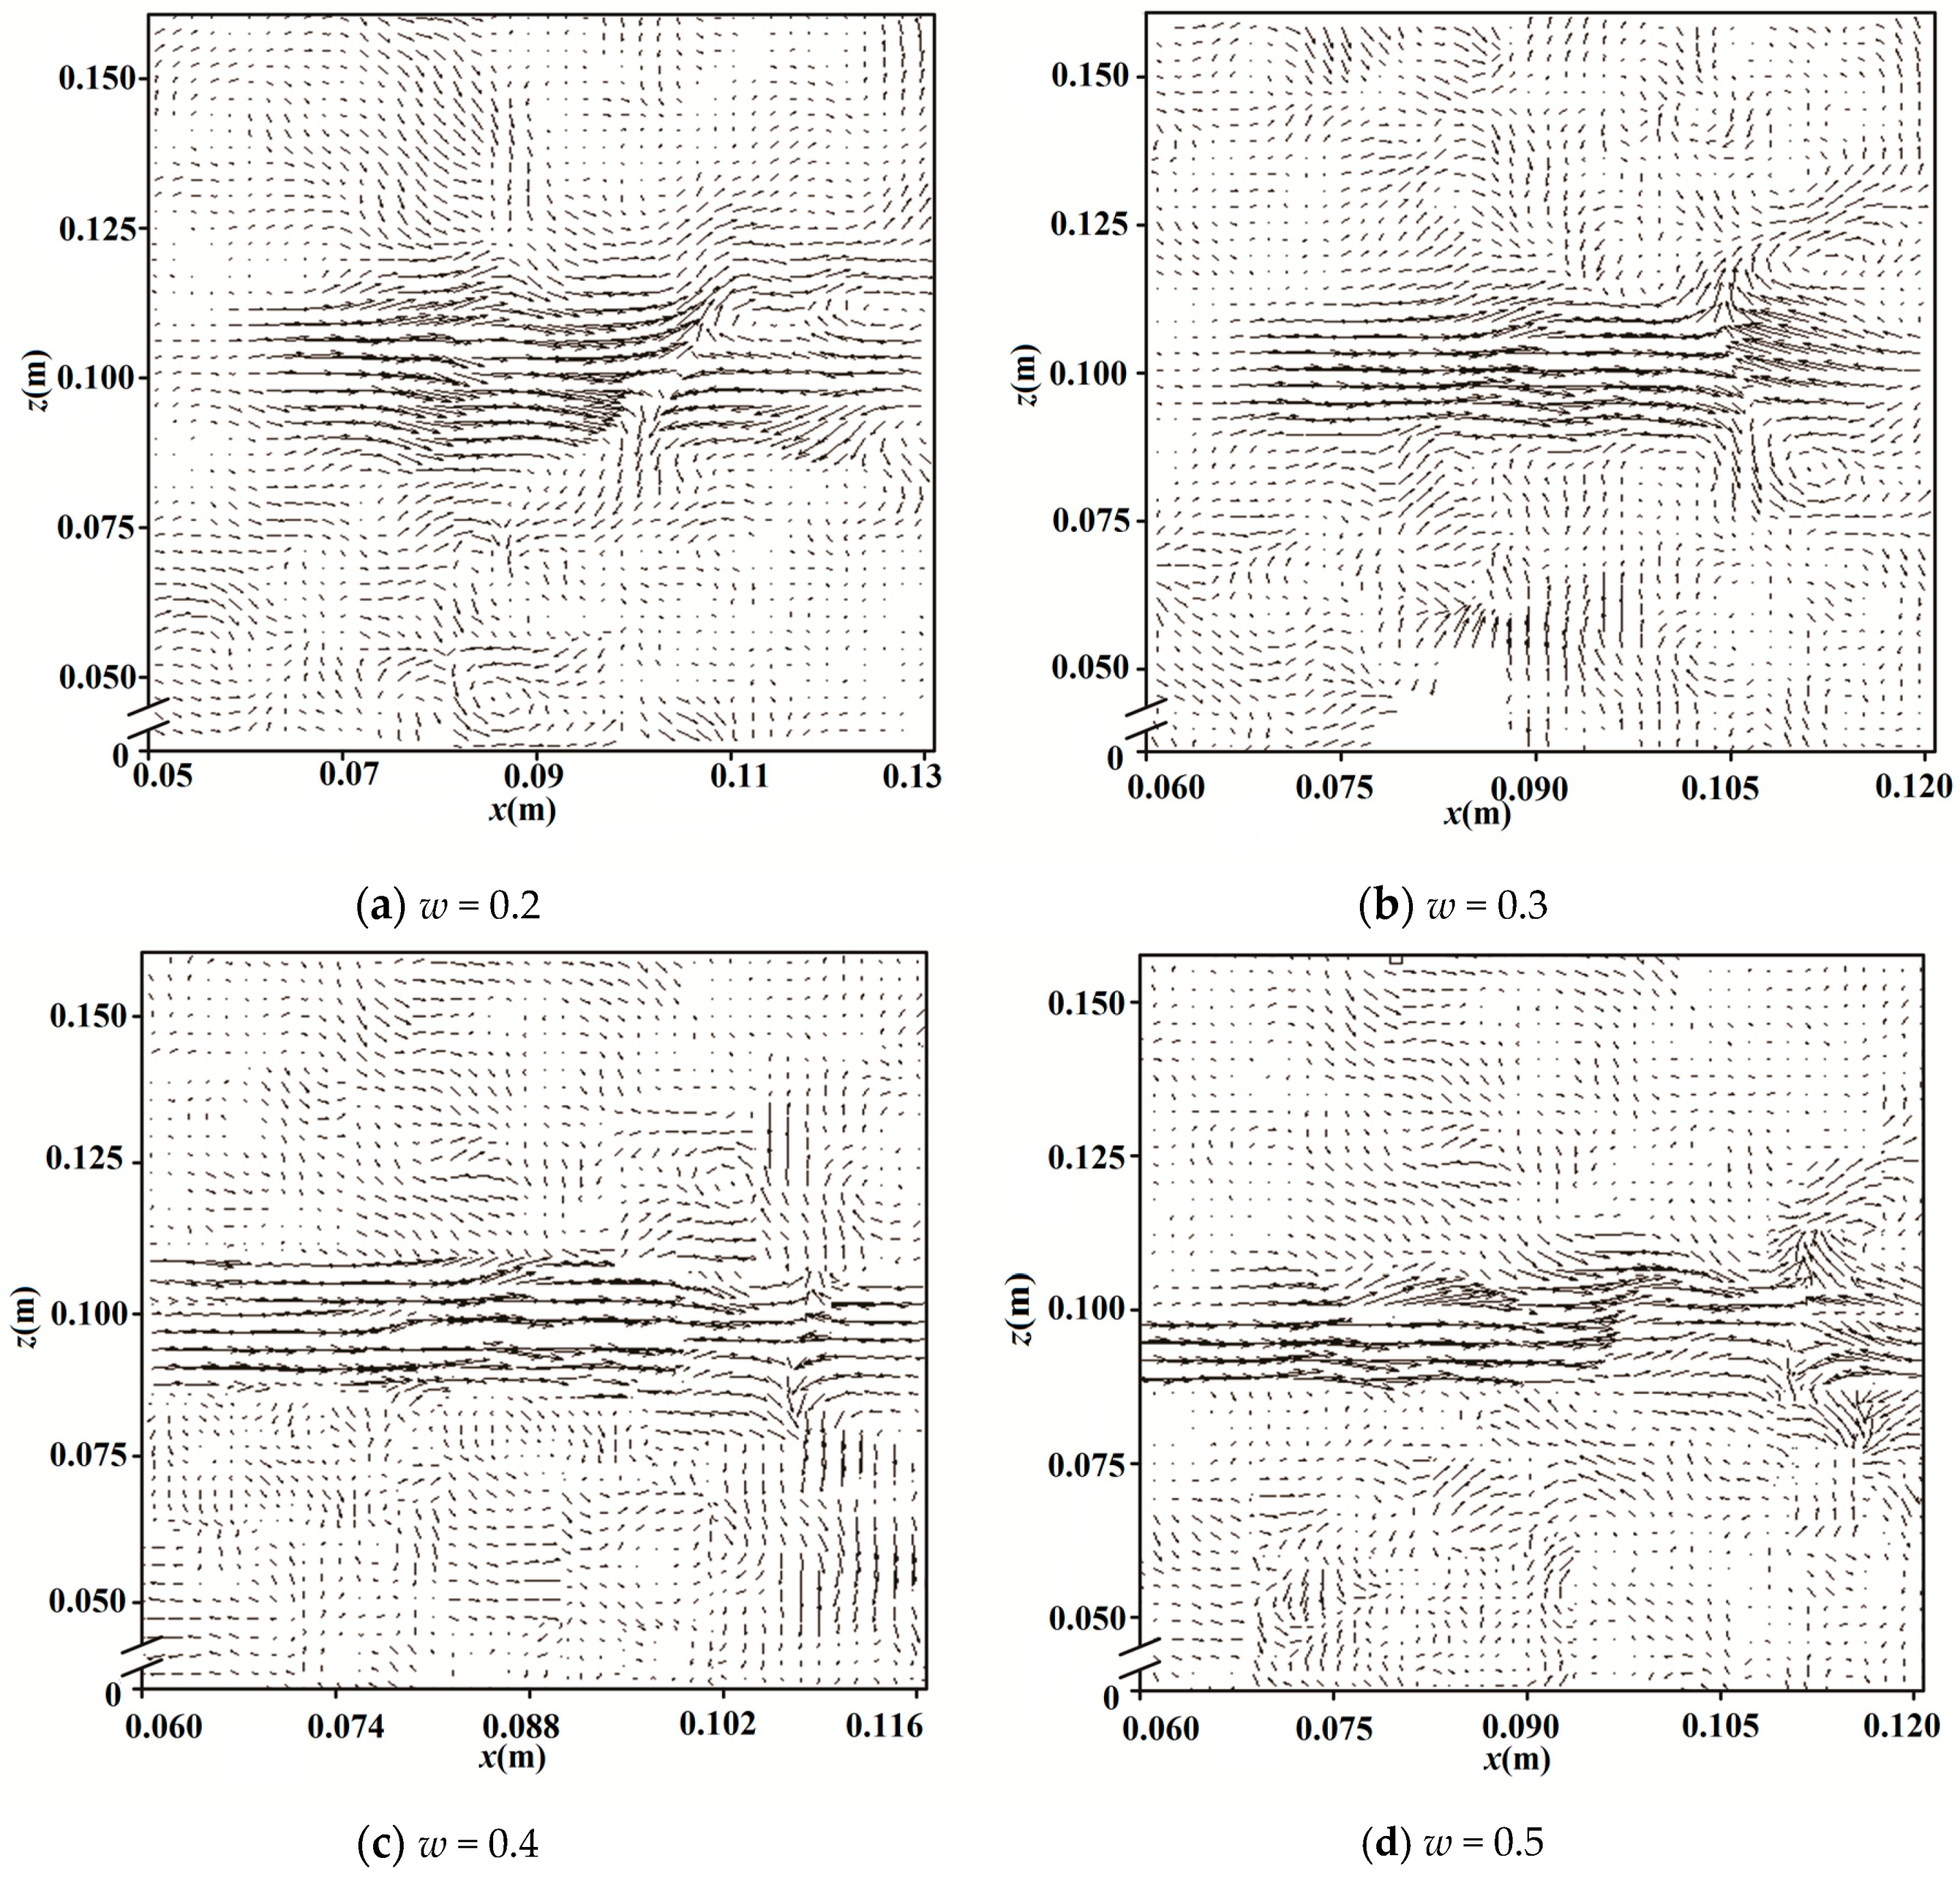
Figure 7 shows instantaneous vector maps of the xz plane, as recorded by PIV at a constant inlet velocity of um = 1.25 m/s. Figure 8 shows instantaneous vector maps of the xz plane, as recorded by PIV at different moments for sinusoidal inlet velocity during one period. It can be known from Figure 7 that the impinging surface is located at the center of the xz plane of the collision chamber because of the equal and constant inlet velocities. It can be known from Figure 8 that the two opposing liquid jets impinge at different positions in one period. Thus, the impinging surface in the xz plane of the collision chamber is instantaneously moving because of the different dynamic inlet velocities. The impinging surface makes back-and-forth motions in the collision chamber during one period. Similar transport phenomena are observed in the different operating conditions shown in Table 1 as well as for different L/D ratios. This fluid transport phenomenon implies that the inlet velocity flow pattern in one period is very sensitive to the motion of the impinging surface, which is consistent with previously reported results [31].
The impinging surface is located in the position where the liquid velocity magnitude reaches a minimum value in the present work. Figure 9 shows the position variation of the impinging surface during many periods, as determined using PIV and the CFD model. The position of the impinging surface is periodically varying with time and is approximately linearly varying with time on the axis in every half-period. The CFD model yielded predictions in good agreement with the PIV results. However, the position of the impinging surface could be predicted only within ±5% because of the volatility and disorder of the flow field. These findings imply that the inlet velocity conditions are correlated with the motion characteristic of the impinging surface and the flow regime of the xz plane. Therefore, dynamic transport performance with an instantaneously moving impinging surface is an outstanding feature of liquid impinging stream reactors with dynamic inlet flows.

4.2. Flow Characteristics of the Flow Field

On the basis of the aforementioned investigation, fluid transport phenomena of the impinging streams with dynamic inlet velocity variation is studied and discussed using PIV and a CFD model, in comparison with conventional impinging streams where both inlet velocities are the same and not varied with time. Investigating detailed information about the velocity distribution in the active area [2] is important for enabling the design of an optimal impinging stream reactor under dynamic inlet velocity operating conditions.

4.2.1. Velocity Distribution on the Axis

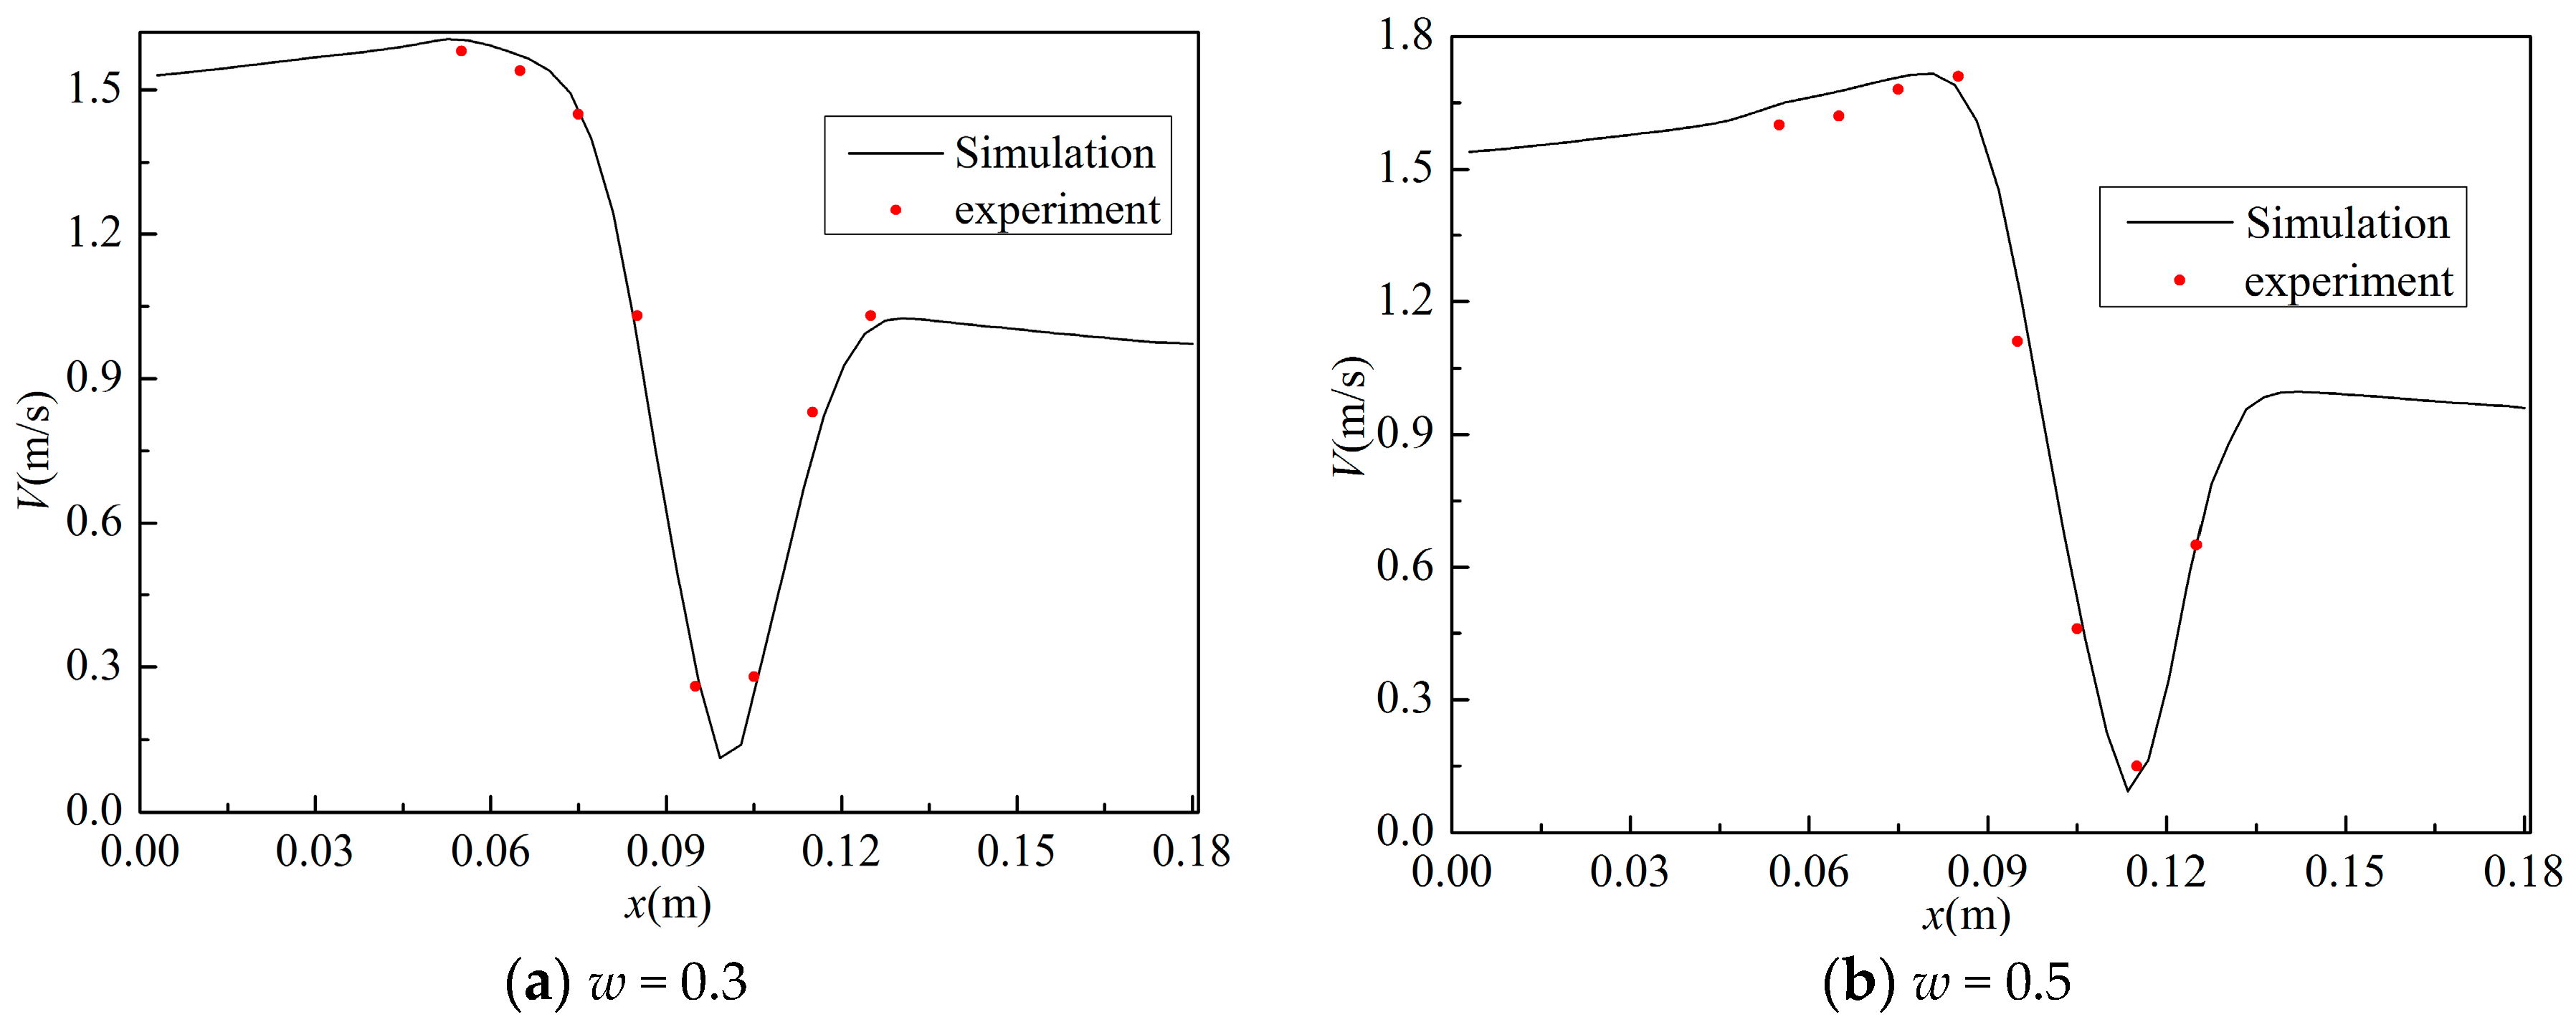
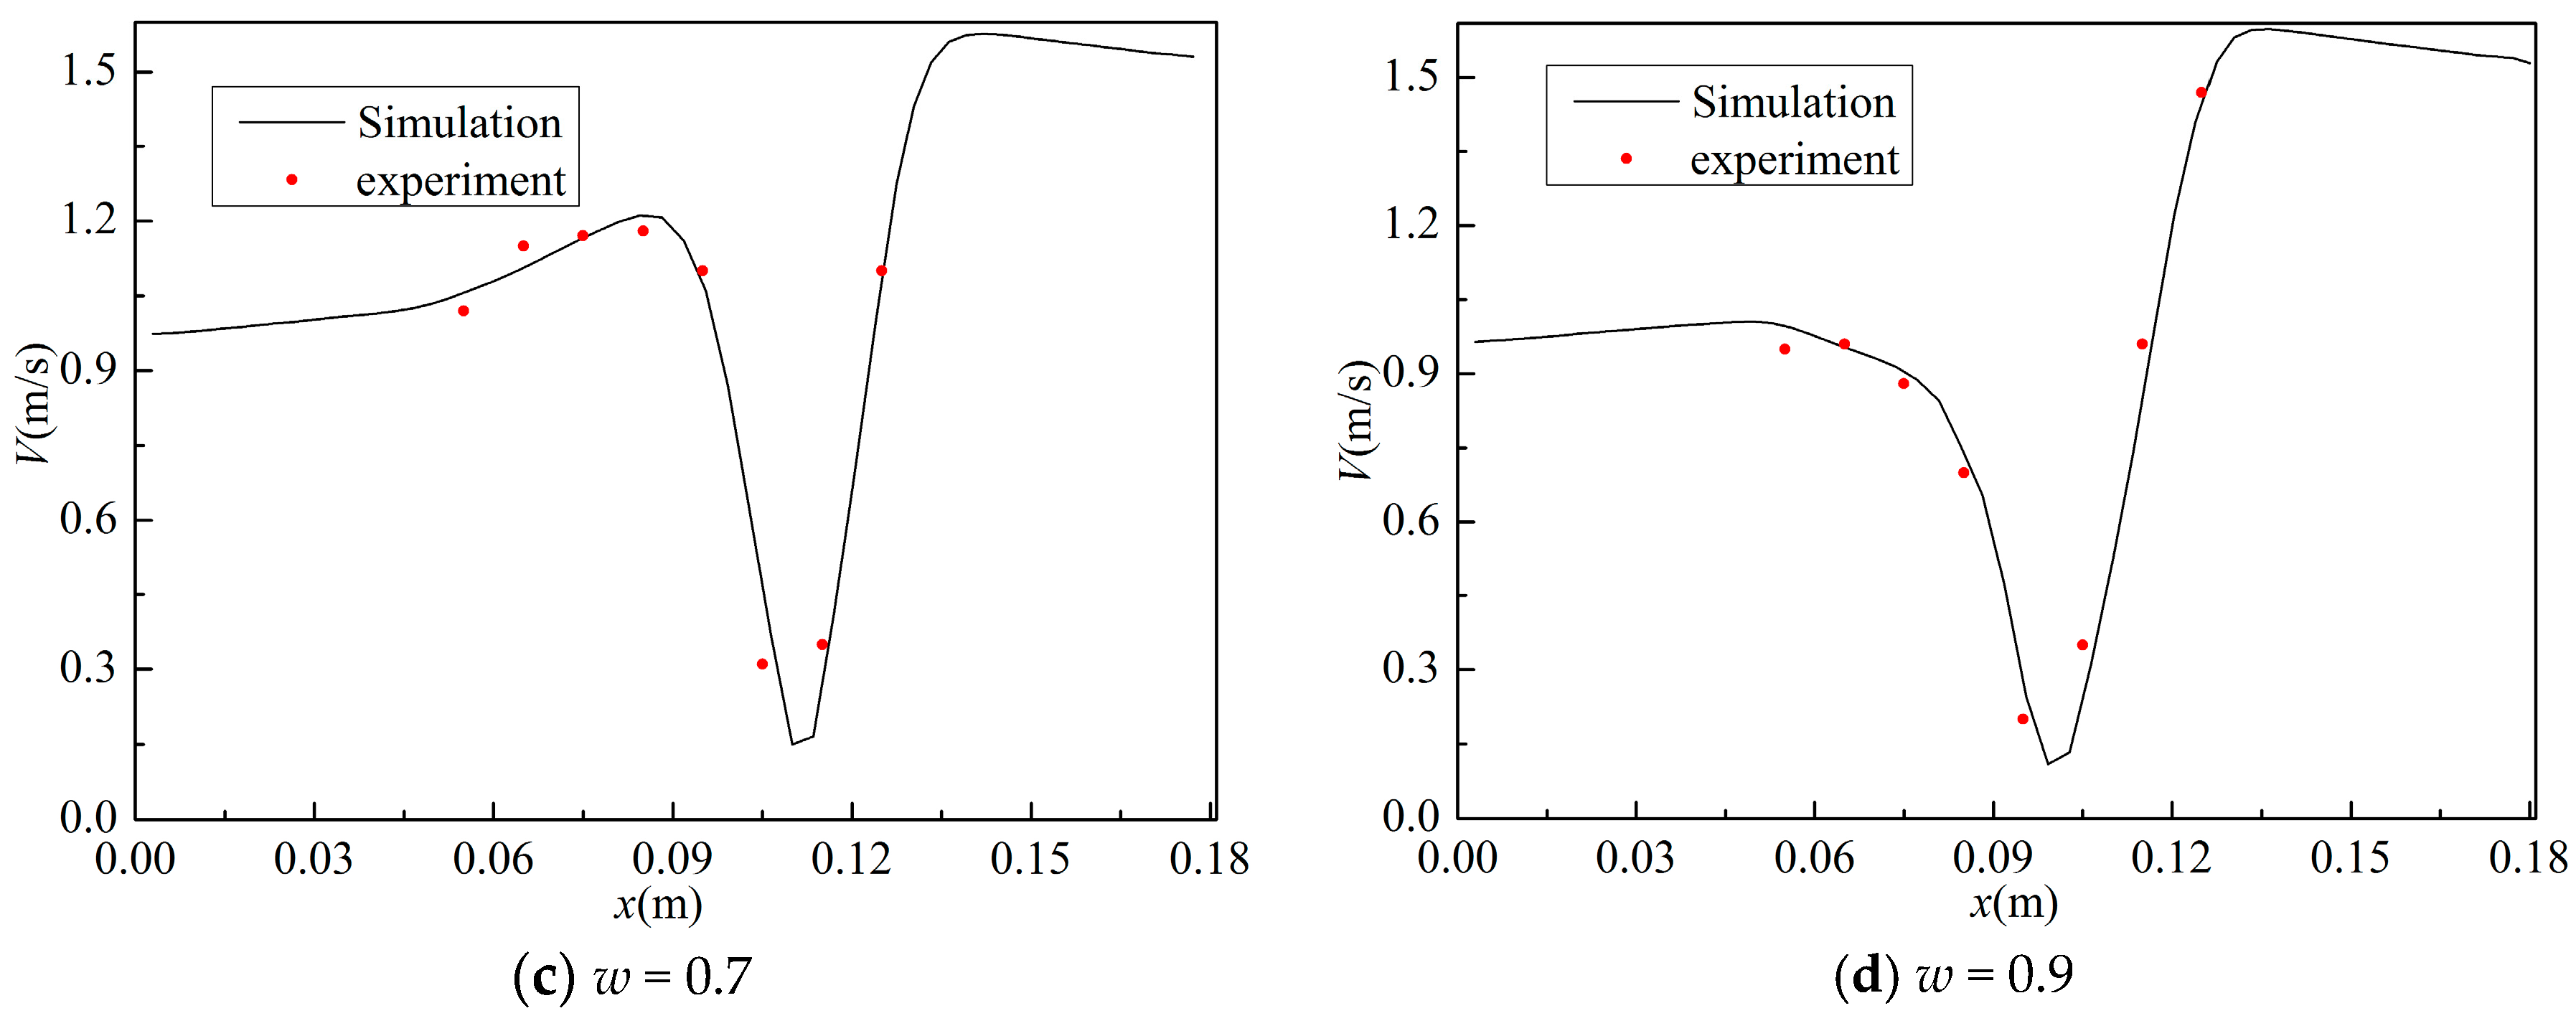
Figure 10 shows the instantaneous velocity magnitude on the axis of the nozzle in the xz plane by PIV and CFD for sinusoidal inlet velocity. The predicted results in Figure 10 satisfactorily coincide with the experimental data. It can be known from Figure 10 that the minimum velocity magnitude on the axis lies in the impinging center. Furthermore, a large velocity gradient is located near the impinging center at every time point, which is in accordance with the fluid velocity distribution described by Li et al. [30]. Moreover, the impinging surface is no longer located in the geometric center of the collision chamber but makes back-and-forth motions within one period in the axial range of the nozzle.
Figure 11 shows the instantaneous axial velocity distribution on the axis of the nozzle in the xz plane, as determined by PIV and CFD for a sinusoidal inlet velocity. The results predicted by the CFD model are basically consistent with the experimental data. The instantaneous axial velocity appears to linearly vary with the axial position in the impinging zone at every time point. In addition, the position of the impinging surface varies during one period and the range of motion of the impingement region is wider than the conventional impinging streams operating under the same conditions. This behavior is attributed to both inlet instantaneous velocities dynamically varying with time and a phase shift. These results, shown in Figure 9, Figure 10 and Figure 11, indicate not only that the impinging region is instantaneously moving but that the dynamic inlet velocity conditions are also closely related to the velocity distribution of the flow field.

4.2.2. Motion Characteristics of the Impinging Surface

Most previous studies have focused on the engineering application of the two opposed jets but lack detailed information on the influence of the dynamic inflow conditions on the motion characteristics of the impinging surface. Numerous simulations and experiments are performed in the present work to investigate and measure the effects of different types, periods and amplitudes of dynamic inflow conditions on the motion characteristics of the impinging surface using PIV and CFD. It can be observed from Figure 9 that the position variation of the impinging surface, as assessed by PIV and CFD, linearly varies with time in every half-period. Therefore, it is necessary to study the motion characteristic of impinging surface in the impinging streams reactor with dynamic inflow.
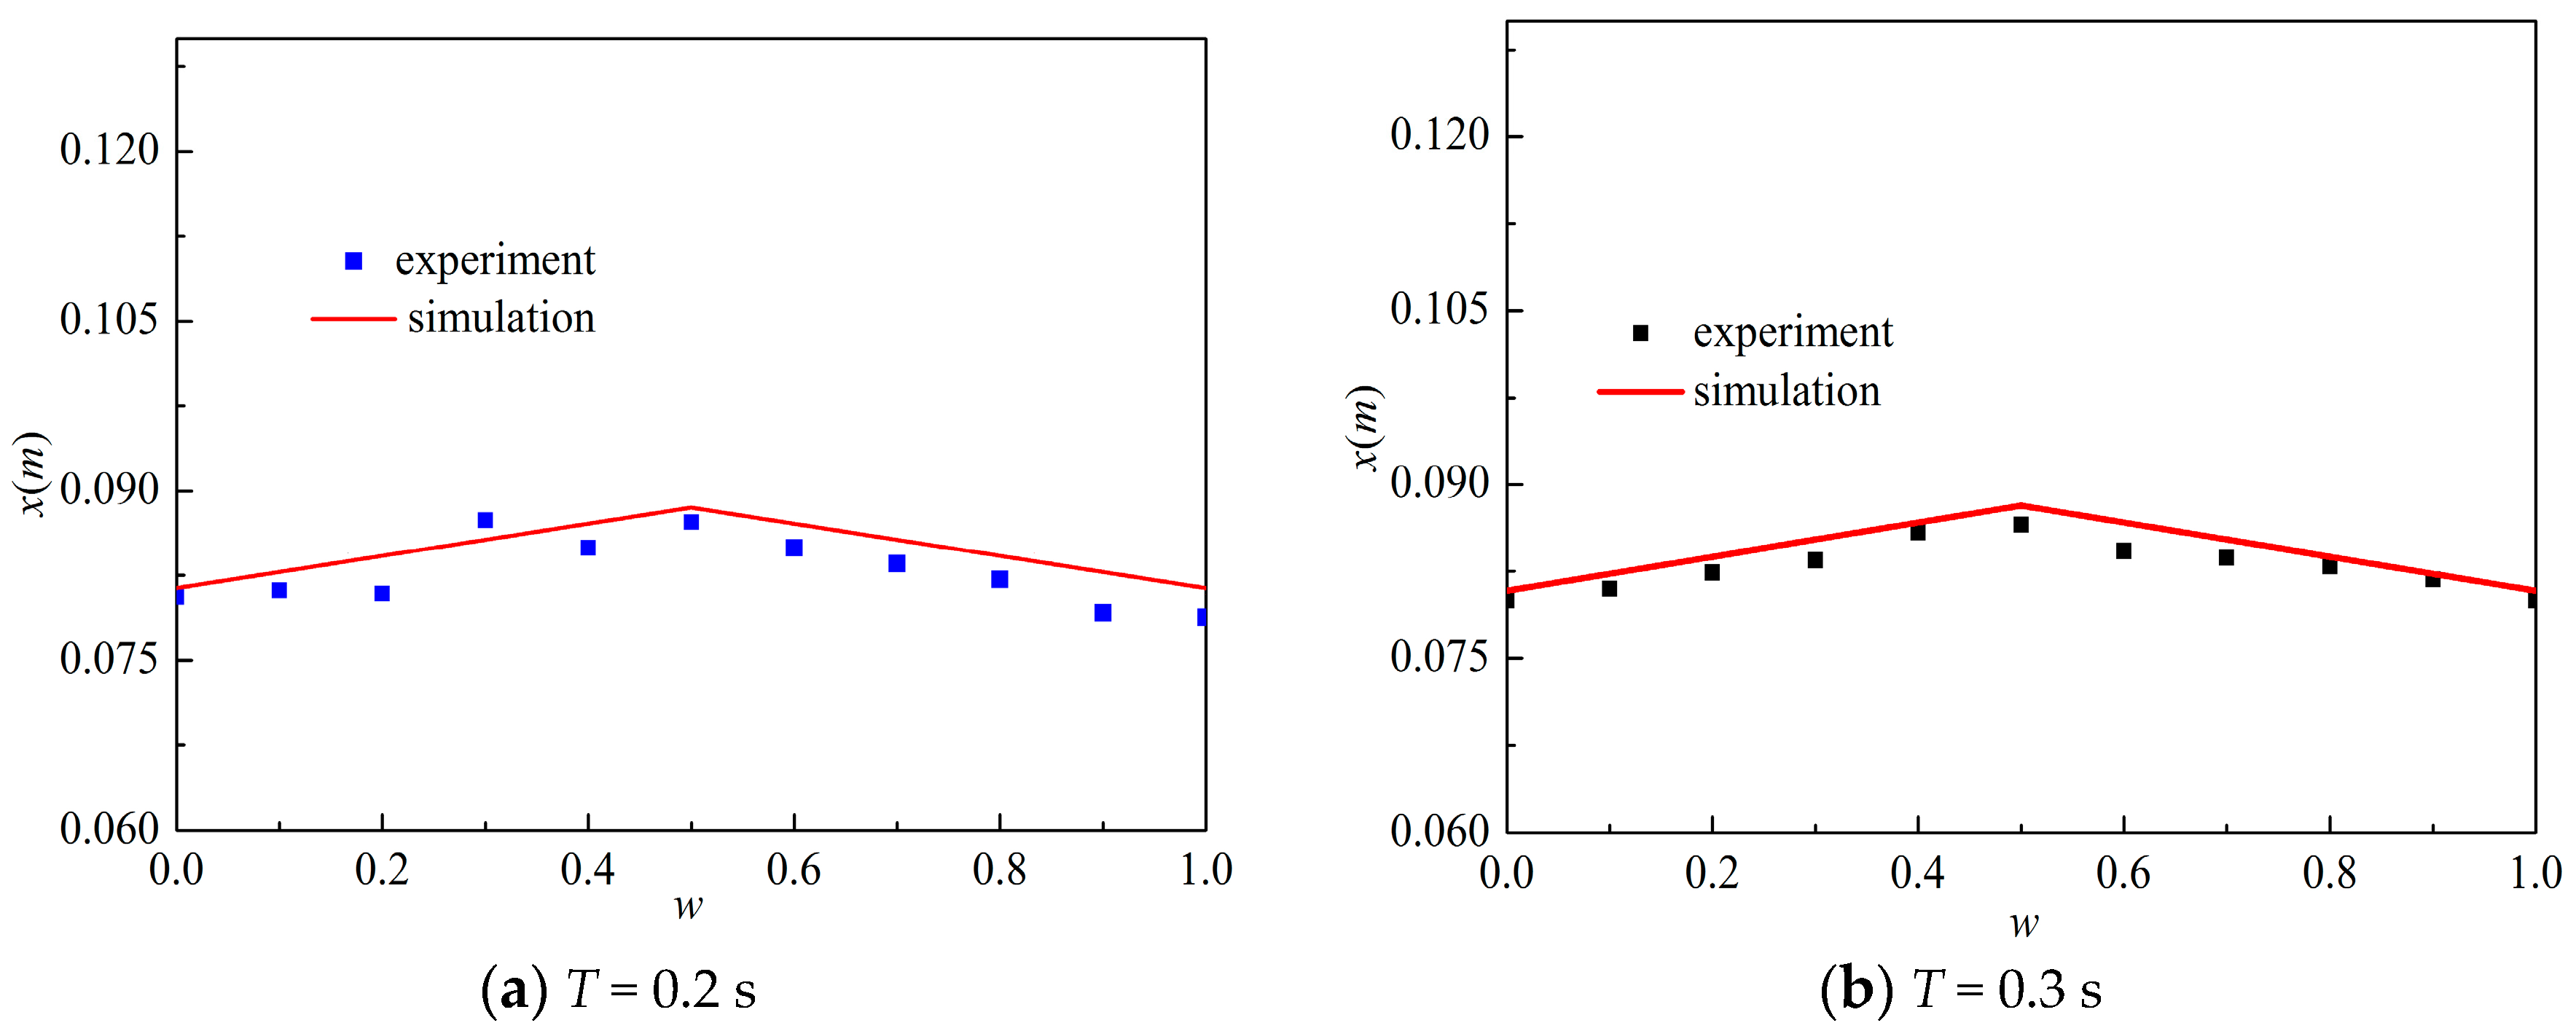
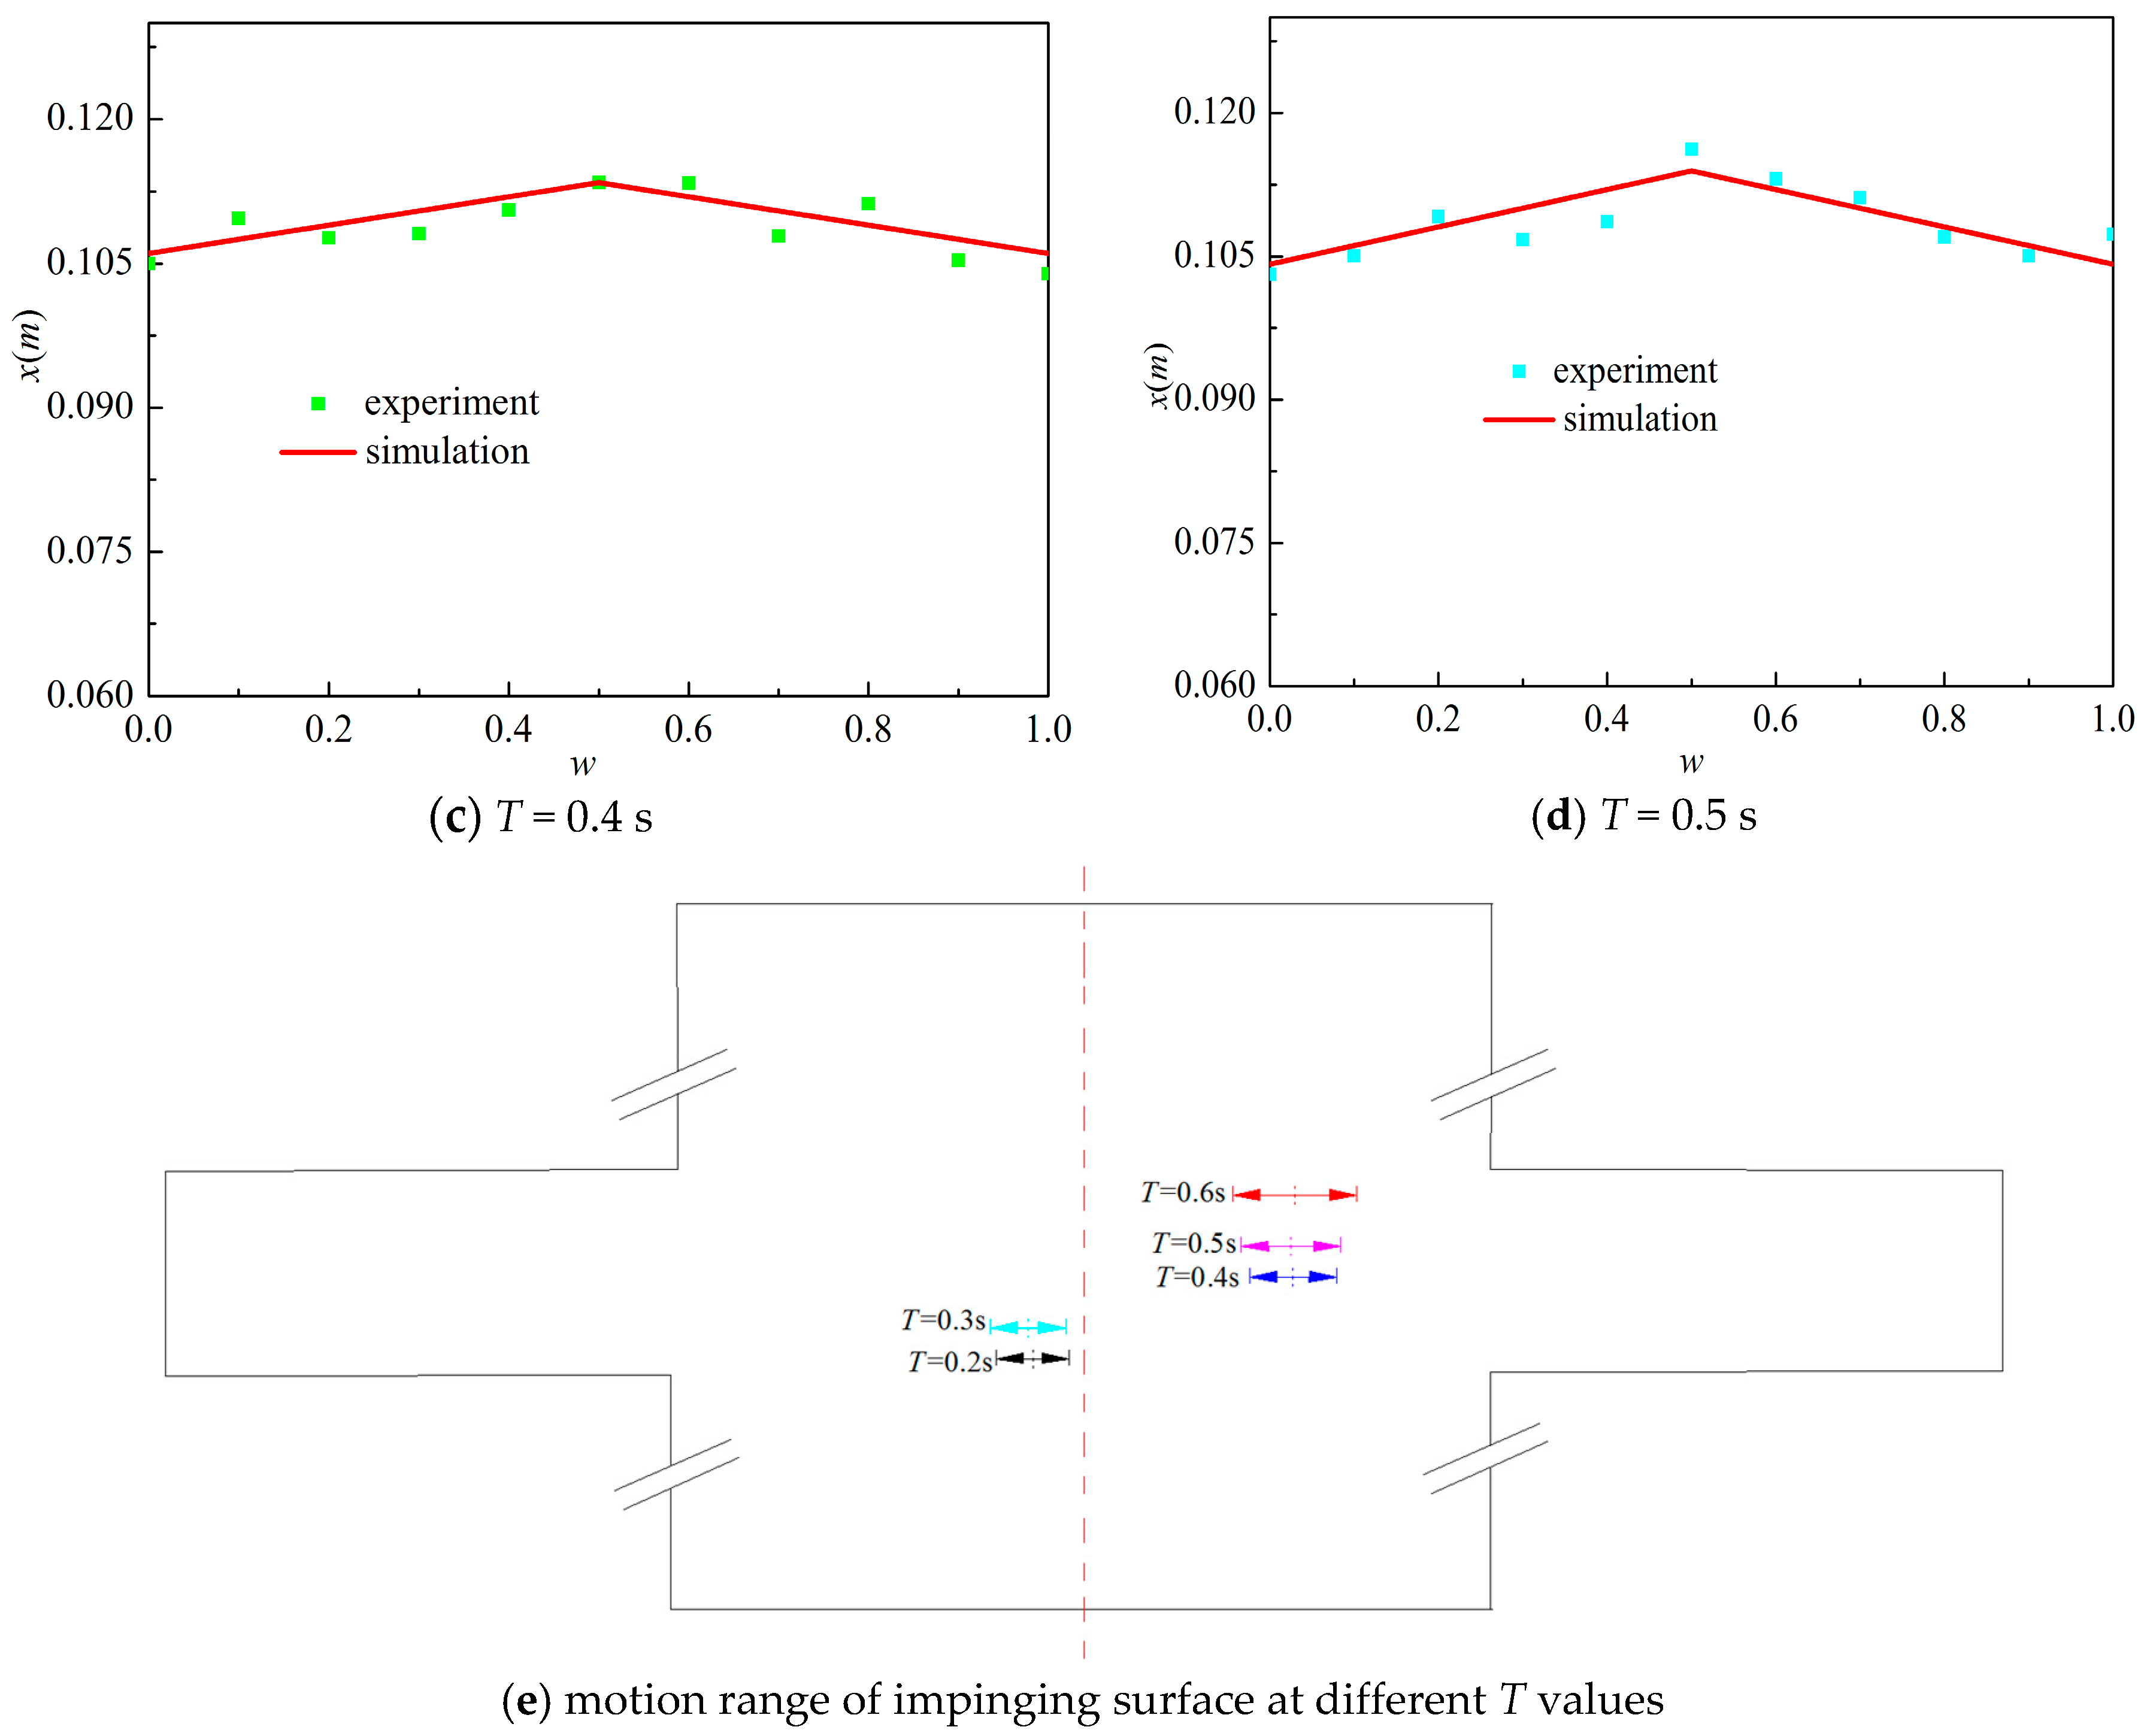
Figure 12 shows the effect of period on the position of the impinging surface in one period for sinusoidal inlet velocity. The simulation data obtained using a CFD indicate that the impinging surface position varies linearly with w in every half-period and that the position variation curve of the impinging surface as a function of w is asymmetric about w = 0.5, where w represents the degree of completing inflow conditions with dynamic inlet velocity variation during one period. In addition, these results, obtained using a CFD model, are in good agreement with experimental data obtained by PIV. The inlet velocity difference magnitude (∆u) first increases and then decreases with increasing w in every half-period; ∆u reaches its maximum value at w = 0.25 and w = 0.75. The left inlet velocity magnitude is larger than the right one in the first half-period. The right inlet velocity magnitude is larger than the left one in the latter half-period; thus, the position of the impinging surface reaches a maximum value at w = 0.5. Moreover, it can be observed from Figure 12e that the impinging surface at different periods makes back-and-forth motions in one period in different parts of the collision chamber. The impinging surface’s range of motion is located at the left part of the collision chamber at T = 0.2 s and 0.3 s and is located at the right part of the collision chamber at T = 0.4 s, 0.5 s and 0.6 s. Some studies have shown that the impinging surface is deviated toward the weaker inlet velocity for two steady opposed jets with unequal inlet velocities [30]. With respect to dynamic inlet sinusoidal velocities with T = 0.2 s and 0.3 s, the opposed jets initially did not meet during the first half-period. Then, both jets impinged at some position on the left side of the collision chamber, because the inlet velocity of both jets varied during the latter half-period. Thus, the impinging surface repeatedly made back-and-forth motions in the left part of the collision chamber at T = 0.2 s and 0.3 s. By contrast, two opposed jets can initially impinge in the first half-period at T = 0.4 s, 0.5 s, and 0.6 s. The oscillatory motions of the impinging surface in the right part of the collision chamber in the presence of inlet sinusoidal velocity variation with T = 0.4 s, 0.5 s, and 0.6 s are reasonable. The motion range of the impinging surface increases with increasing T, as shown in Figure 12e, because increasing T can make the impinging surface move farther along the axis.
Figure 13 shows the effect of amplitude on the position of the impinging surface during one period for sinusoidal inlet velocities. The results predicted by the CFD show that the position variation of the impinging surface varies linearly with w in every half-period at different amplitudes. The simulated results are consistent with the experimental data. As shown in Figure 13, the impinging surface at different amplitudes makes back-and-forth motions in one period. Moreover, the peak position value of the impinging surface increases with increasing amplitude of the sinusoidal inlet velocity. In sinusoidal flow pattern of inlet velocity variation, amplitude increases with increasing maximum inlet velocity difference (∆u), which enhances the impinging force and increase the momentum transfer in the impingement region. As a result, the impinging surface moving farther in one period with increasing amplitude. In addition, amplitude increases with an increase of ∆u magnitude at the same w during one period. Thus, the motion range of impinging surface increases with increasing amplitude in one period, shown in Figure 13e. Therefore, we inferred from Figure 13 that the flow regime of the two opposing jets varies with time in the dynamic inflow conditions and that the range of motion of the impinging surface can be extended to the whole axial zone through reasonable design of both inlet velocity variations.
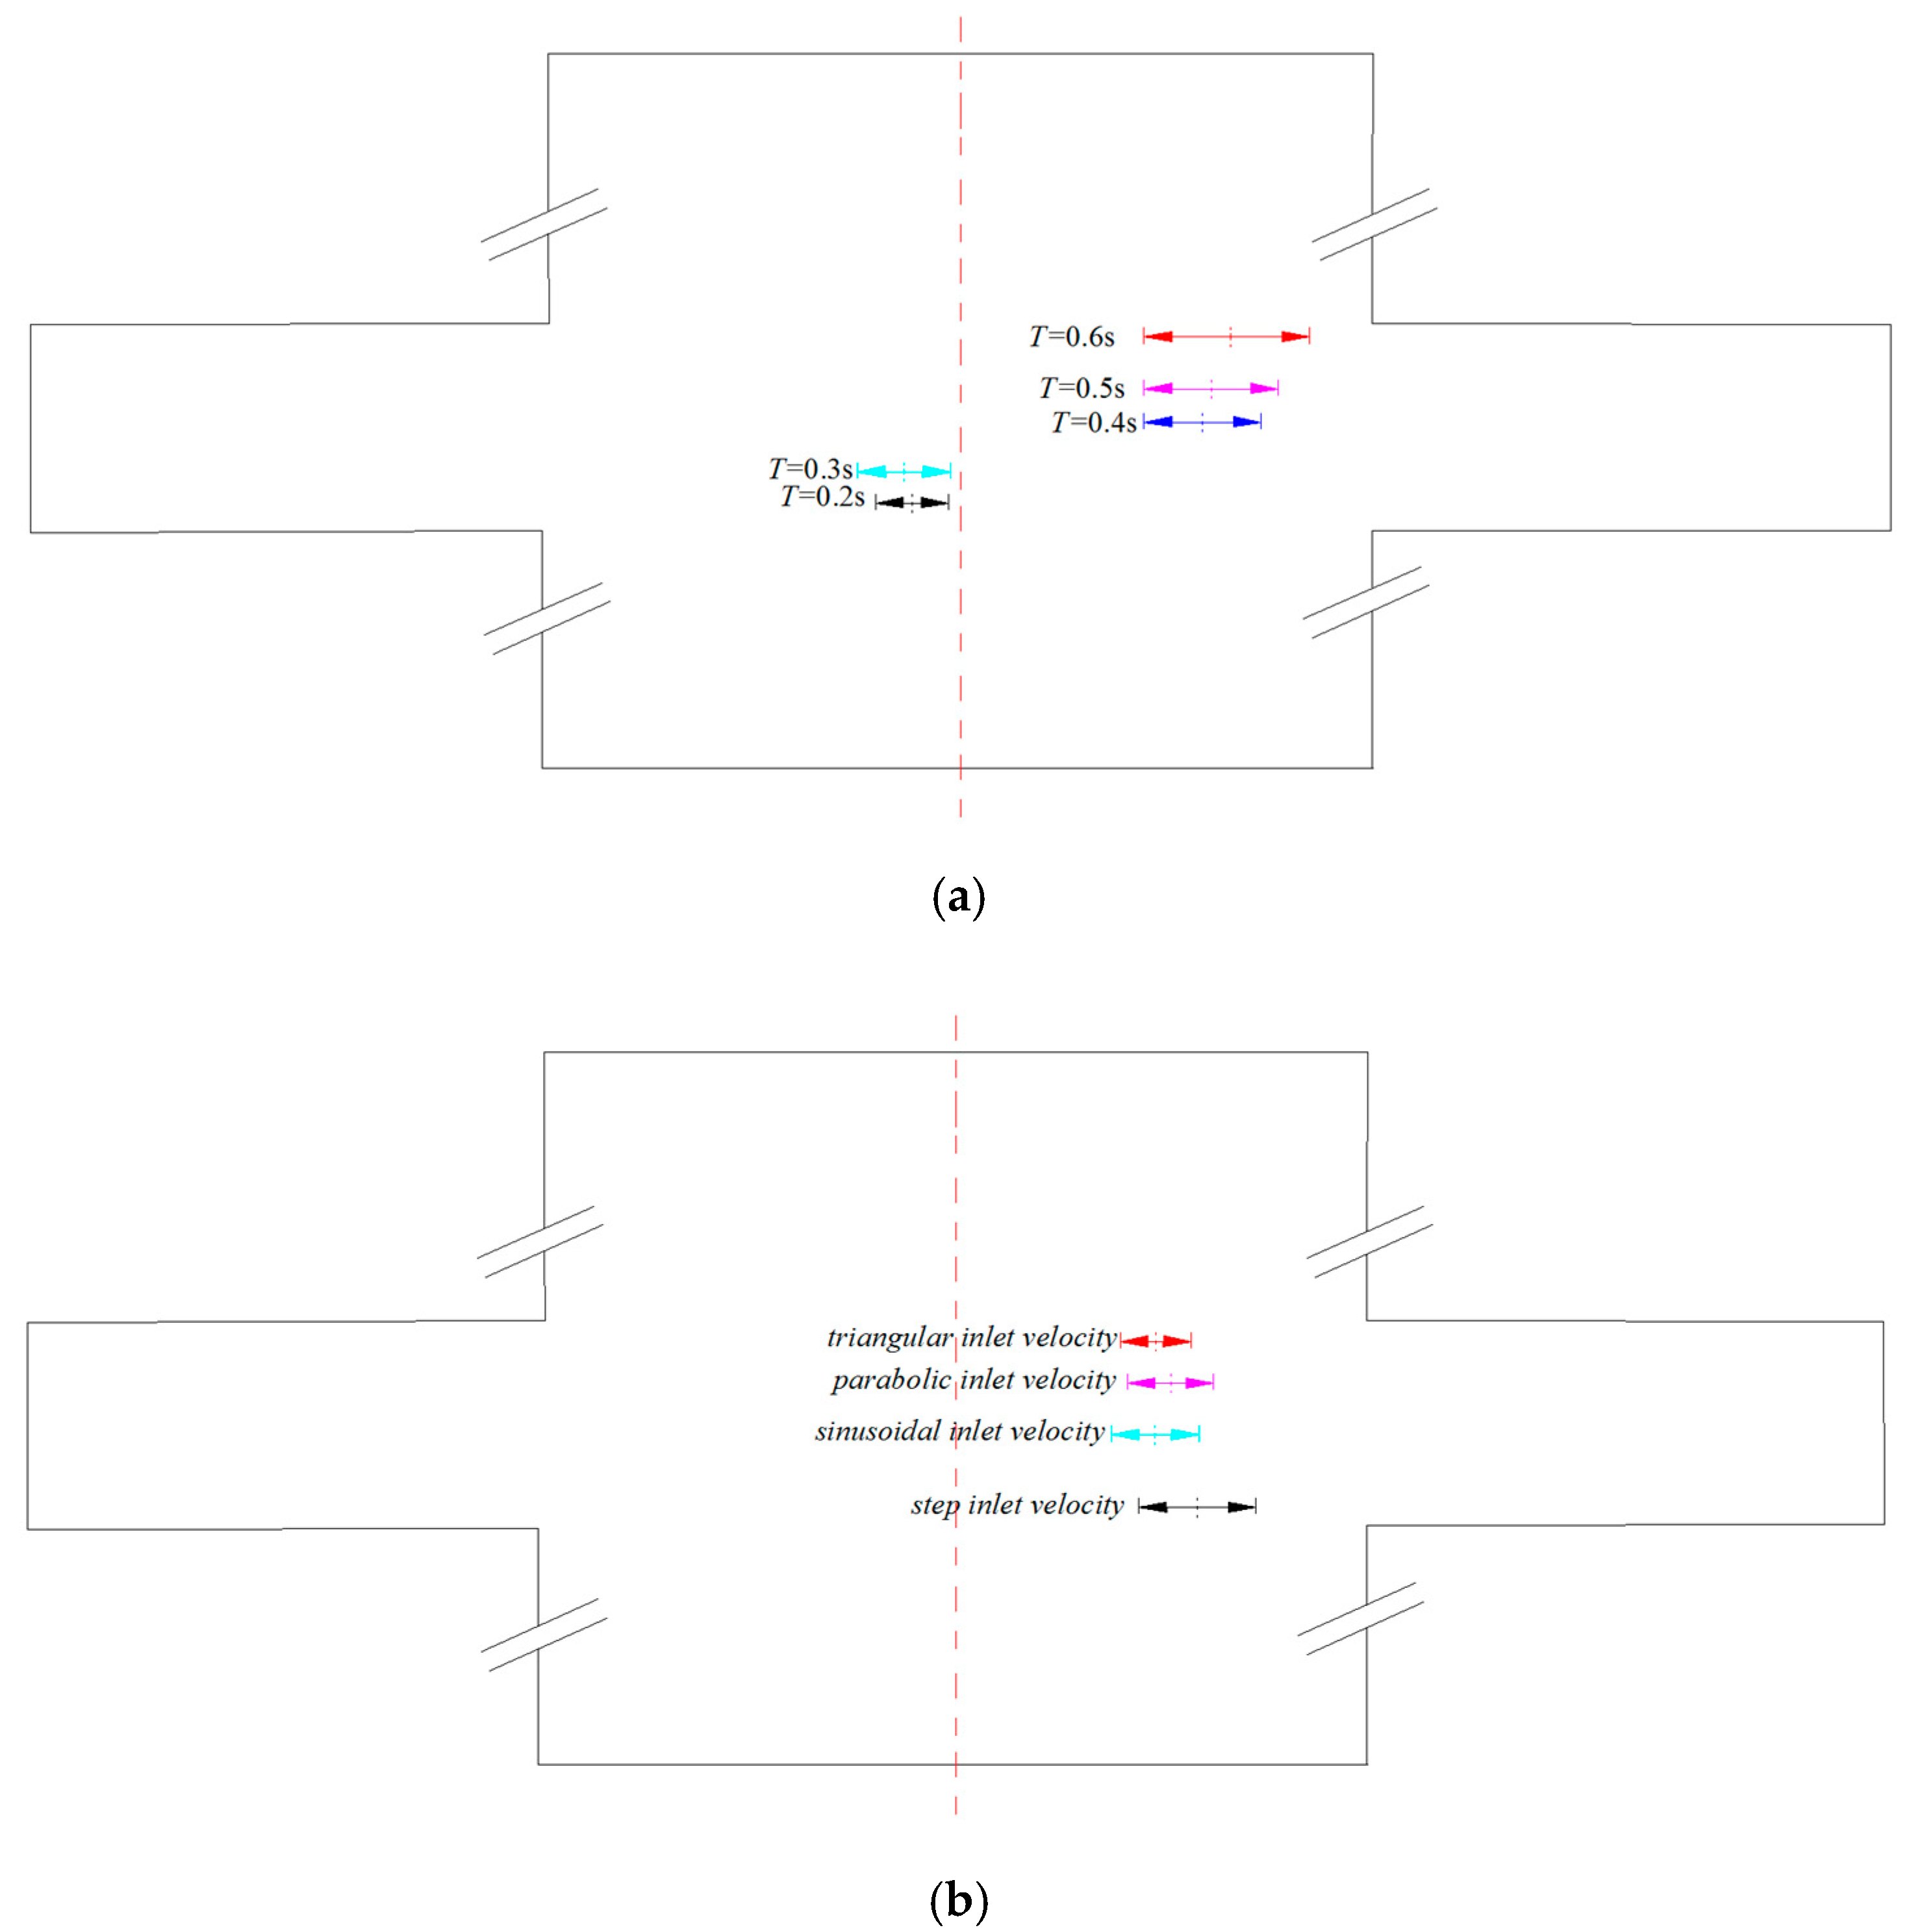
Figure 14 shows the impinging surface motion range at different periods and flow patterns of inlet velocity variation, as demonstrated using CFD. From the aforementioned results, the effect of period on the position variation of the impinging surface is shown in Figure 12. It can be observed from Figure 14a that the motion characteristics of the impinging surface for step inlet velocity conditions is similar to those with sinusoidal inlet velocity conditions. The impinging surface for step inlet velocity conditions makes back-and-forth motions in the left part of the xz plane in dynamic inflow with T = 0.2 s, and 0.3 s. Similarly, the impinging surface moves in the same manner in the right part of the xz plane in dynamic inflow with T = 0.4 s, 0.5 s, and 0.6 s. The range of motion of the impinging surface for step inlet velocity conditions increases with increasing T, which is consistent with the results for sinusoidal inlet velocity conditions. Similar flow characteristics of the flow field are also observed in the parabolic and triangular inflow conditions. It can be observed from Figure 14b that the range of motion of the impinging surface for step inlet velocity is larger than that of the impinging surface for sinusoidal, parabolic and triangular inlet velocity under the same operating conditions. This difference in range of motion is attributed to the ∆u magnitude of the step inlet velocity being constant, but larger than that of the sinusoidal inlet velocity at equal w, which can increase the range of motion of the impingement region. Impinging surface with different inflow types has similar motion characteristics in one period. The ∆u magnitude of the sinusoidal inlet velocity is approximately the same as parabolic inlet velocity at the same w, and is larger than that of the triangular inlet velocity at the same w. On the basis of the aforementioned analysis, the range of motion of the impinging surface reaches a maximum value for impinging stream reactors with step inflow during one period, which is in accordance with the results shown in Figure 14b. In summary, the variation in inlet velocity plays an important role in determining the flow characteristics of the impinging surface. In addition, the position of the impinging surface varies linearly with w in every half-period under different inflow types. Furthermore, given the aforementioned different inflow patterns, the period and amplitude are sensitive to the motion behavior of the impinging surface and to the flow characteristics of the flow field.

4.3. Turbulence Characteristic Analysis

The turbulence kinetic energy (k) of the impinging zone is research hotspots for engineering applications. The high turbulence characteristics of the impingement region can accelerate the rate of mixing and the momentum and heat and mass transfer. The impinging surface makes back-and-forth movements in the collision chamber under different dynamic inflow conditions. Thus, measurement and discussion of the turbulence characteristics of the flow field are important in this work. Parameters k is used to characterize the turbulence properties of the two opposing jets with dynamic inflow conditions in this work. Parameter k represents the energy value of the velocity fluctuation of the fluid. On the basis of the definition of impinging streams, and in many studies, the maximum of k is located in the impingement region where large velocity and pressure gradients exist and can greatly improve the heat and mass transfer coefficients [2]. Therefore, improving the k of the impinging zone can induce large enhancements in thoroughness, efficiency and adequacy of the relevant reactions achievable by the impinging streams technique.
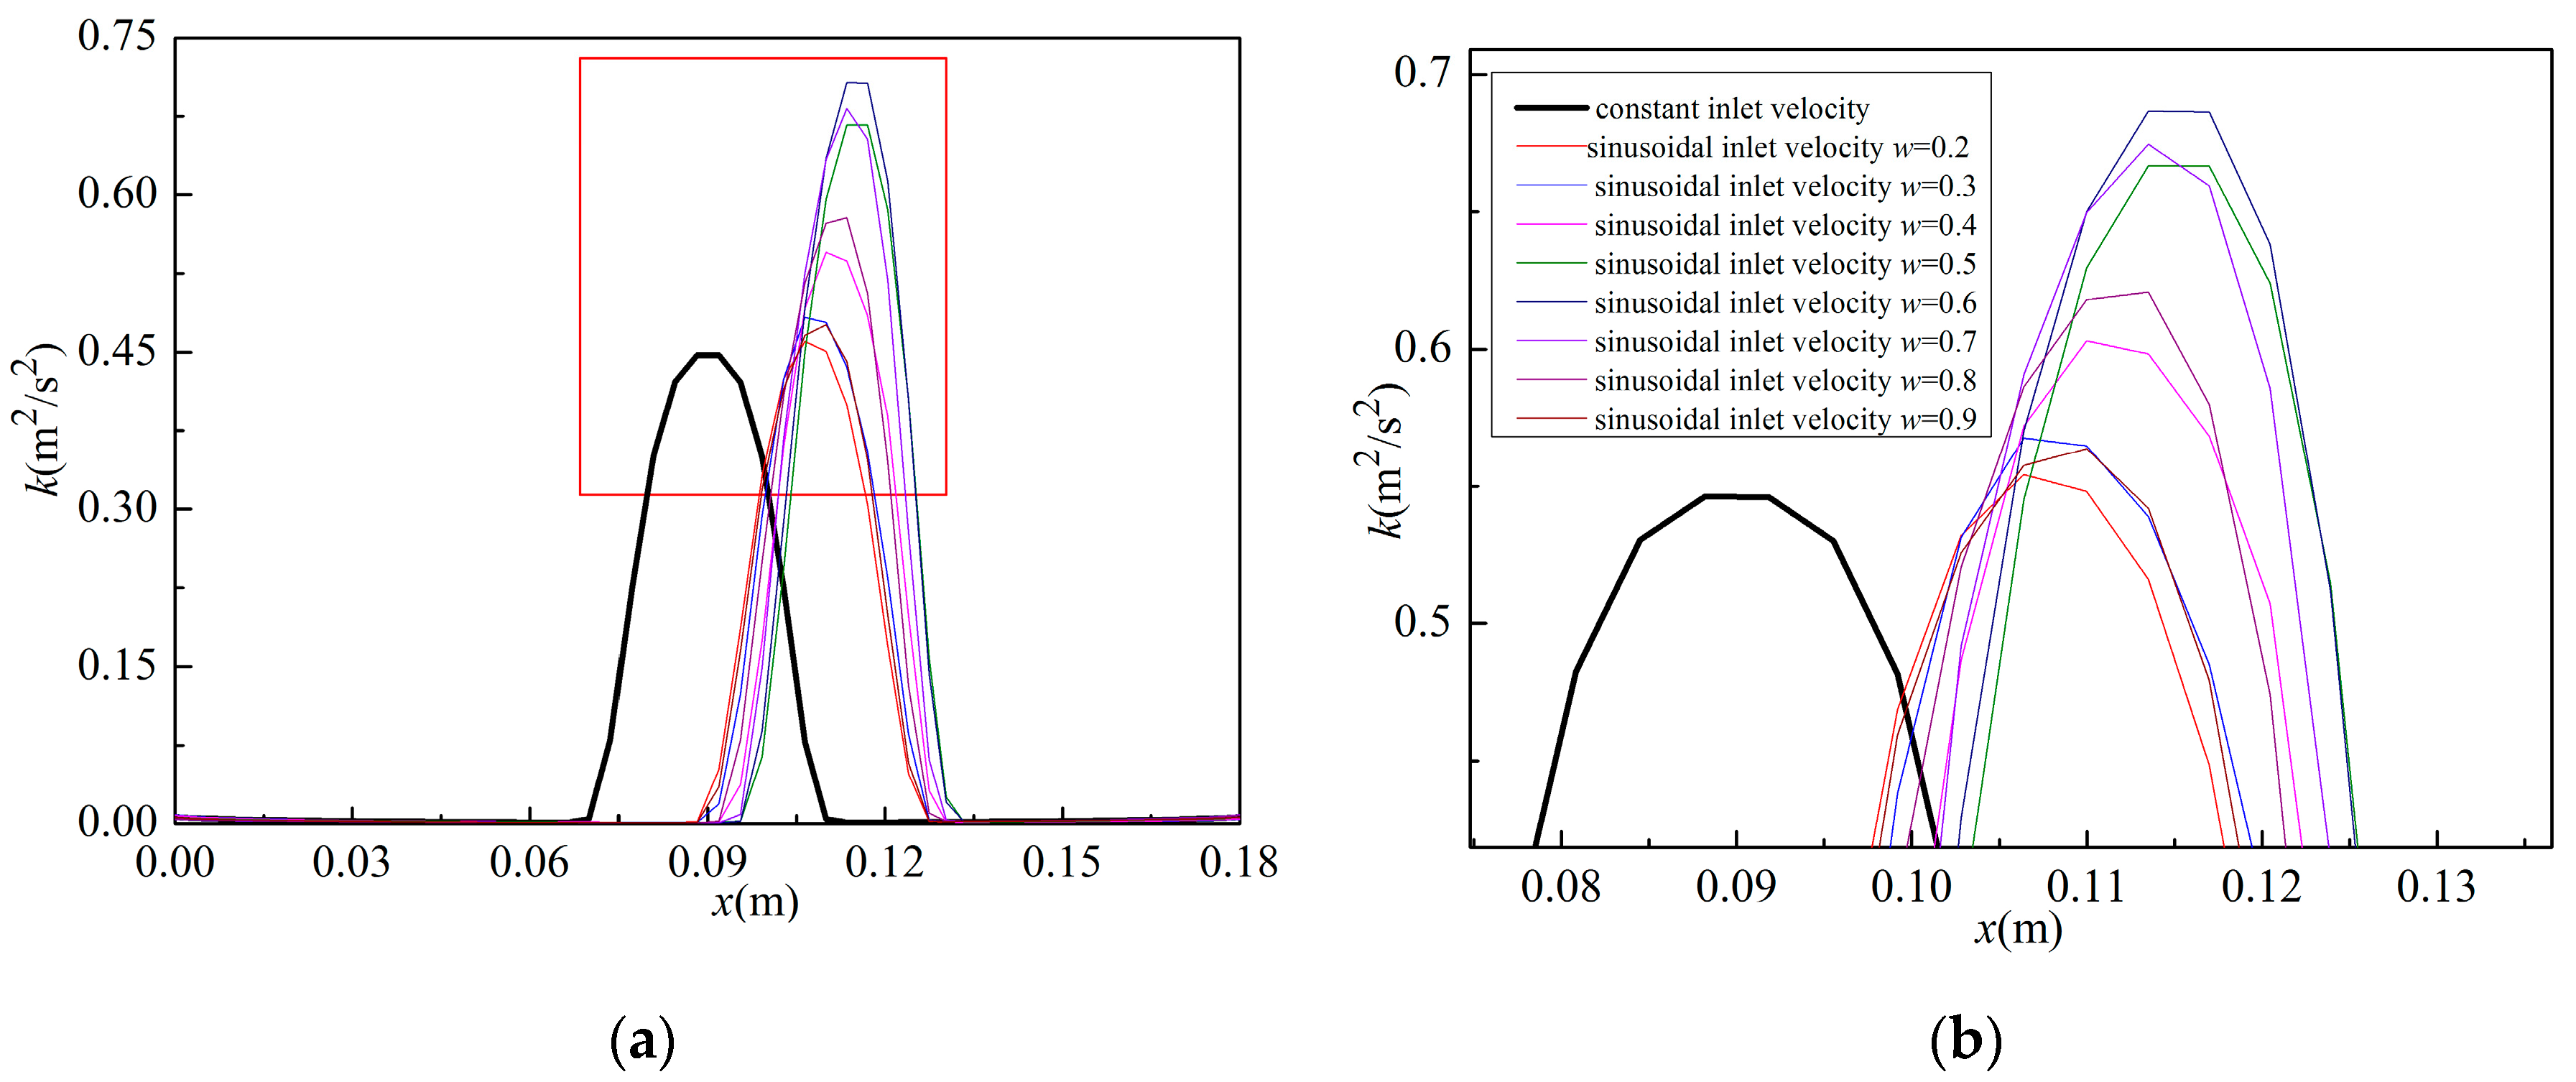
Figure 15 shows the instantaneous turbulence kinetic energy distribution on the axis of the nozzle in the xz plane, as determined using a CFD with sinusoidal and constant inlet velocities. It can be observed from Figure 15 that the k axial distribution is symmetric about the impinging surface, that the maximum k lies in the impinging center, and that the shapes of the k axial distributions at different moments do not vary under the constant inlet velocity conditions. By contrast, the curves of the k axial distribution vary at different moments under the sinusoidal inlet velocity conditions because the two inlet velocity magnitudes differ in a single period. Although the u* of the sinusoidal inlet velocity condition is equal to the constant inlet velocity magnitude, the maximum k for sinusoidal inlet velocity conditions is larger than that for constant inlet velocity conditions at every moment. That is most likely attributable to a dynamic inlet velocity causing greater flow fluctuation and a higher fluid fluctuation velocity in the impingement region over constant inlet velocity conditions, which leads to a large increase in the maximum k value. Thus, the impinging streams with dynamic inflow conditions have higher maximum k under same operation conditions compared with conventional impinging streams.
It can be known from Figure 15 that impinging streams with dynamic inflow conditions exhibit more intense turbulence characteristics than conventional impinging streams operating under the same conditions. The impingement region is an indispensable and important part of the active area. The aforementioned analysis and results indicate that the turbulence characteristics of the impinging zone are correlated with the inlet velocity conditions. To attain more detailed information about the flow field, the effect of variables T, A, ∆φ, L/D, and different inflow types on the turbulence characteristics of the collision chamber are investigated and discussed. From previously reported analyses, the length of the impinging region is the same at 4 ≤ L/D ≤ 8. The impingement region is considered to be a circle whose radius is approximately the nozzle diameter in the present work [30].
Figure 16 shows the effects of period on the mean k of the impingement region during one period, as determined by CFD. The results in Figure 16 show that the mean k of the impingement region, as a function of T, is basically similar between the sinusoidal and step inlet velocities. In addition, the mean k of the impingement region correspondingly gets maximum value at approximately T = 0.4 s in the flow dynamics of the flow field. For the range of motion of the impinging zone (Figure 12e), the impinging zone undergoes back-and-forth movements in a small axial zone in the left part of the collision chamber when T = 0.2 s or 0.3 s. By contrast, increasing T (T = 0.4 s, 0.5 s or 0.6 s) make the range of motion of the impinging zone longer but decrease the number of oscillatory motions in the right part of the collision chamber during the same time period. Furthermore, from the point of view of the period, increasing T in one period can make the two opposing jets impinge more fully and fiercely. However, decreasing T at the same amplitude produces more velocity fluctuation in the impinging zone for the same long time. Therefore, the mean k of the impinging zone in the inlet pulsations reaches a maximum value at approximately T = 0.4 s for both sinusoidal and step inlet velocity conditions. Increasing ∆u of dynamic inlet conditions brings more velocity fluctuation in the impingement region. Because ∆u of the step inlet velocity at the same w is larger than that of the sinusoidal inlet velocity, the mean k of the impingement region for the step inlet flow dynamic is larger than those of the sinusoidal inlet velocity at the same T. Thus, the mean k of the impingement region is correlated with the period of the dynamic inflow conditions.
Figure 17a shows the effect of amplitude on the mean k of the impingement region during one period, as determined using CFD. It can be observed from Figure 17a that the mean k of the impingement region during one period increases as A increases. Numerous results in the literature have shown that increasing inlet velocity can improve the mean k of the impingement region [5,28]. Compared with the turbulence characteristics of conventional impinging streams at equal mean velocity, the sinusoidal inlet velocity gives more intense momentum transfer and produces higher instantaneous k of the impinging zone at different moments, as shown in Figure 15. In addition, increasing A causes a more violent impinging force as well as enhancement of the velocity fluctuation. The turbulence characteristics of the dynamic inflow conditions are more intense with an increase in A, because increasing velocity fluctuations and new continuous kinetic energy are added into the impinging zone at every time point. Thus, turbulence characteristics can be enhanced when the amplitude of the dynamic inflow rises.
Figure 17b shows the effect of phase difference on the mean k of the impingement region, as determined using CFD. It can be observed from Figure 17b that the mean k of the impingement region reaches their maximum values with the variation of ∆φ. The value of ∆φ increases when the maximum ∆u of the sinusoidal inlet velocity rises at constant w, which causes an enhancement of the velocity fluctuation in the impinging zone. By contrast, u* increases when ∆φ decreases, resulting in a more violent impinging force of the dynamic flow field. Therefore, the mean k of the impingement region reaches their maximum values at ∆φT/6. On the basis of these analyses and results, ∆u and u* of the dynamic inflow conditions are closely related to the turbulence characteristics of the impingement region.
Many studies have indicated that the critical parameter (L/D) of the geometric configuration has a large impact on the turbulence and flow characteristics of impinging streams. Figure 18 shows the effect of L/D on the mean k of the impingement region during one period, as determined using CFD. When the nozzle spacing is increasing, the impact velocity is decreasing, the impinging force is weakened and the momentum transfer in the impinging zone is less severe. Thus, it can be seen from Figure 18 that the mean k of the impingement region decreases with increasing L/D because the increase in nozzle spacing causes the velocity fluctuation to be weakened.
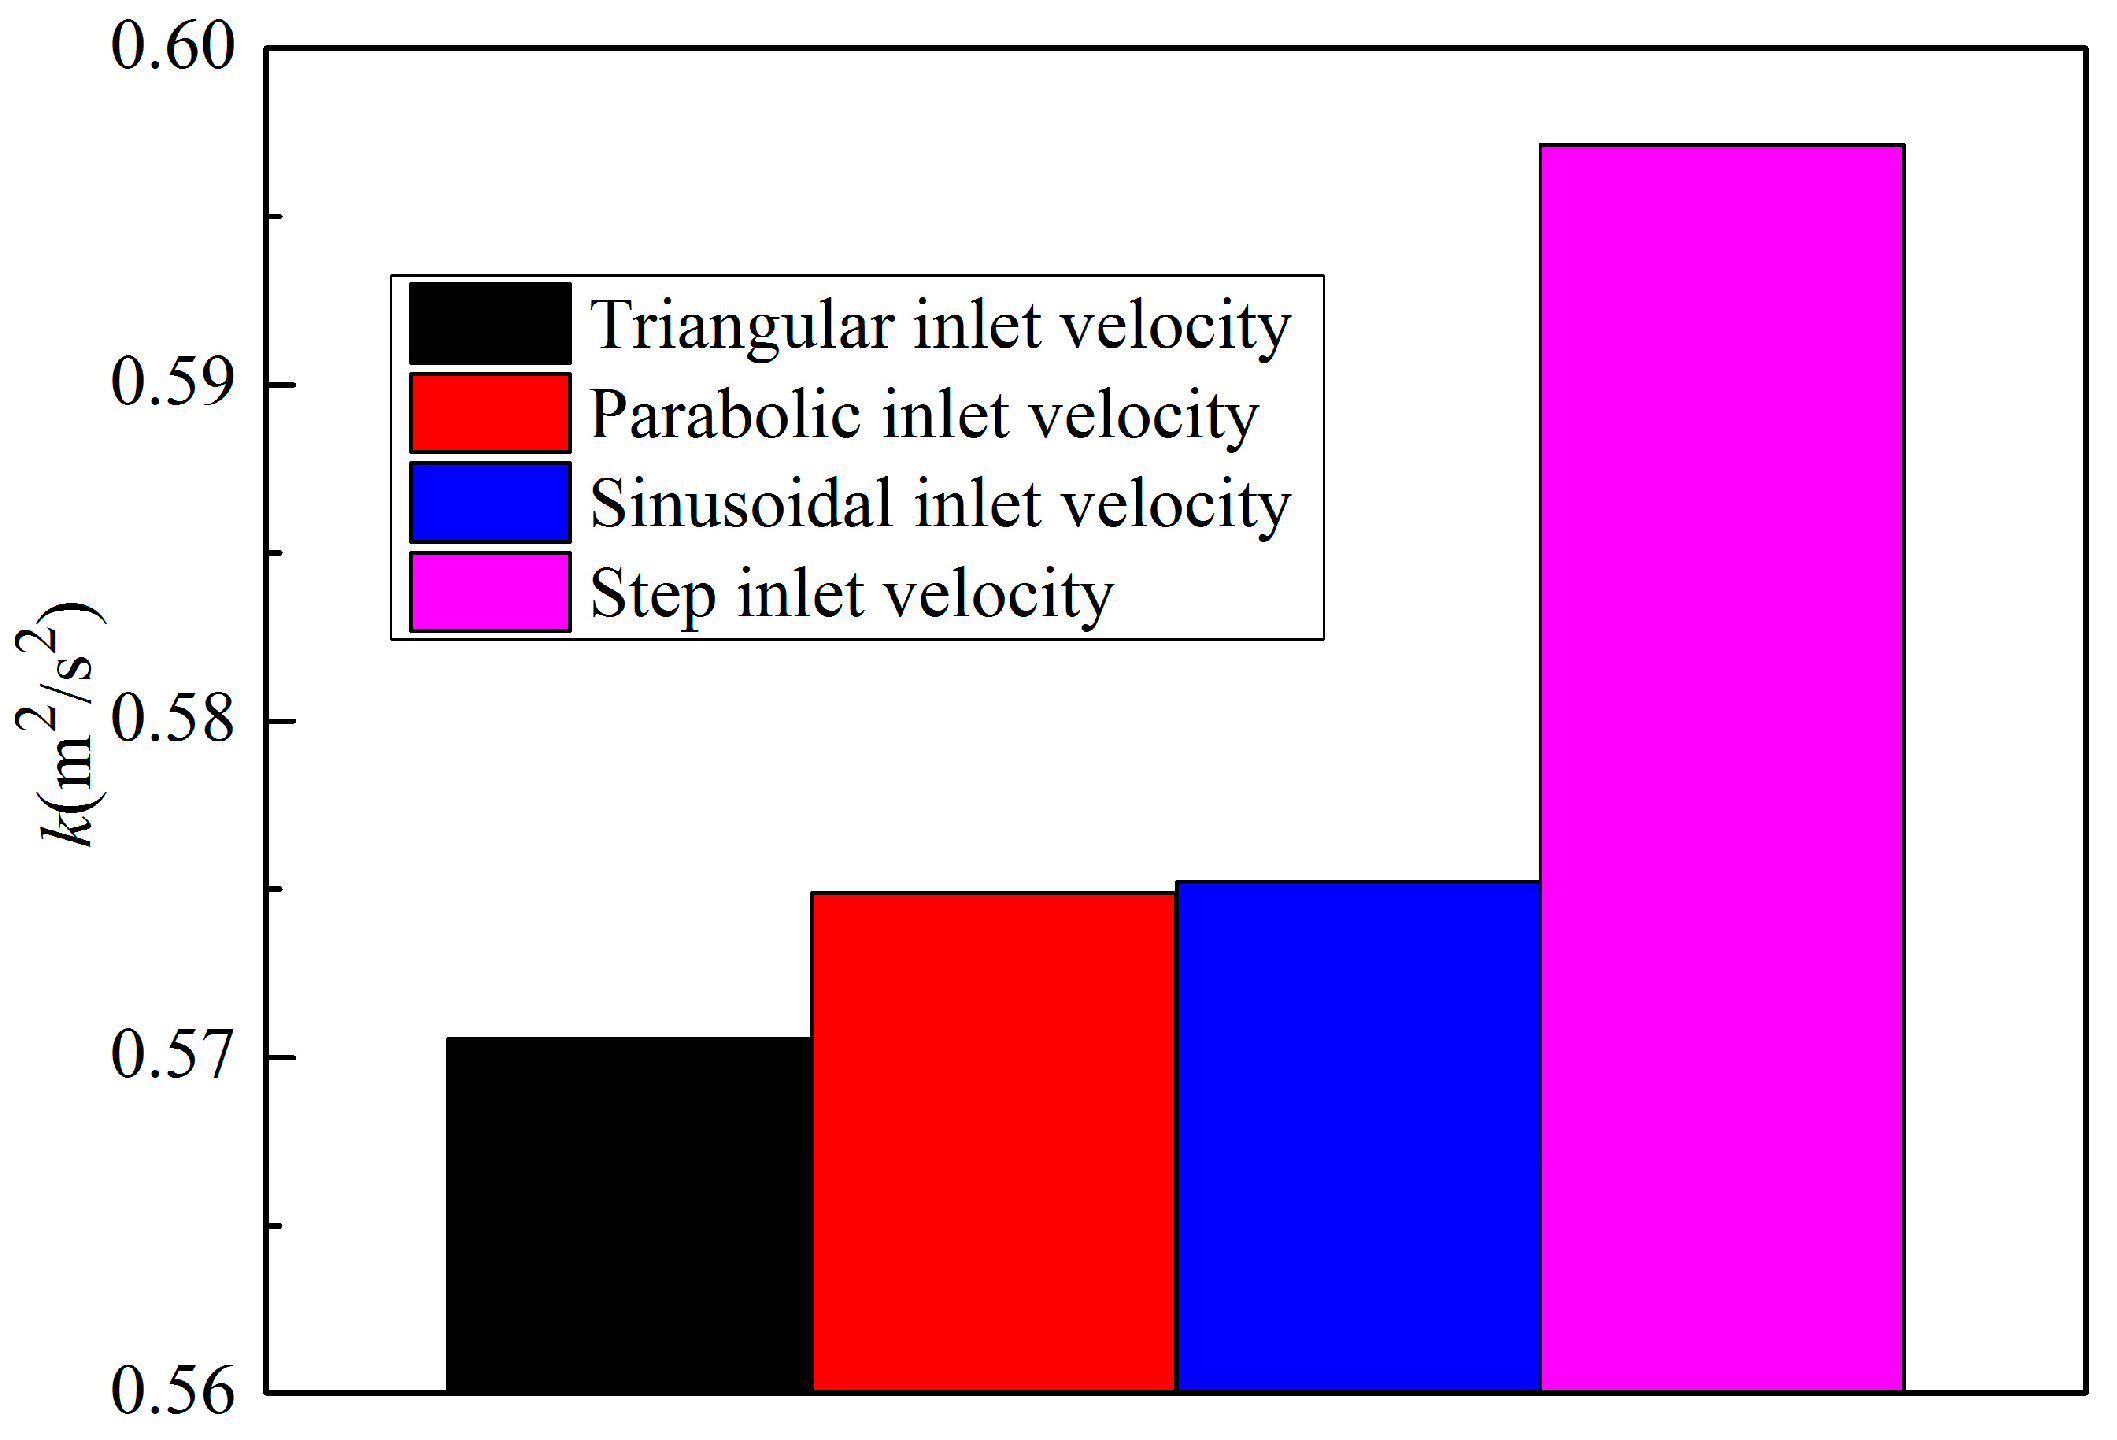
Figure 19 shows the effect of dynamic inflow type on the mean k of the impingement region in one period, as determined using a CFD model. It can be observed from Figure 19 that the mean k of the impingement region for different inflow types differs. This difference most likely arises from the different inflow types having different ∆u at constant w values, as previously explained. The ∆u value in one period is constant for the step inlet velocity and larger than that of other inlet velocities at the same w. This result demonstrates that the range of motion of the impinging surface (Figure 12e) is longest for the step inlet velocity flow pattern. Since parabolic inlet velocity variation during one period is very similar to the sinusoidal flow, the mean k of the impingement region between the parabolic and sinusoidal inlet velocity conditions is basically equal. Furthermore, the mean k of the impingement region for both parabolic and sinusoidal inlet velocity conditions is larger than that for triangular flow. Given the same mean inlet velocity and maximum ∆u in one period, increasing ∆u causes greater velocity fluctuations and more intense momentum transfer in the impingement region, which results in the enhancement of mean k in the impingement region. Therefore, the mean k of the impingement region is correlated with dynamic inflow types.
Measuring and discussing the turbulence characteristics in the impinging stream reactor with dynamic inflow conditions in comparison with conventional impinging stream reactors where both inlet velocities are constant and equal are both necessary and meaningful. Figure 20 shows the effects of the mean inlet velocity and the maximum ∆u on the mean k of the impingement region in one period under sinusoidal, step and constant inlet velocity conditions. It can be observed from Figure 20a that the mean k of the impingement region increases with increasing u0 or u0aver, because mean inlet velocity increases with increasing velocity fluctuation of fluid and increasing fluctuation energy in the impinging zone. Furthermore, the mean k of the impingement region under sinusoidal inlet velocity conditions is larger than those of the constant inlet velocity at u0 = 1.25 m/s and u0 = 1.4 m/s but are correspondingly smaller than that of the constant inlet velocity at u0 = 1.5 m/s. Either the left or right inlet velocity, at any time, under a sinusoidal inlet flow pattern is larger than that of the constant one under equal mean inlet velocity. This observation is attributed to an increase in the inlet velocity indicating an increase in velocity fluctuation size in the impinging zone, which results in the great increase in the mean k of the impingement region. Thus, these findings confirm that the turbulence characteristics of the impinging stream reactor with sinusoidal inlet velocity are more intense than those of the conventional reactor one under the same operating conditions.
Figure 20b shows that the mean k of the impingement region increases when the maximum ∆u rises at constant T and u0aver. They increase with increasing u0aver at constant T and maximum ∆u under the step inlet flow pattern and are larger than those in the constant flow with u0 = 1.25 m/s and u0 = 1.4 m/s. These results are consistent with the previous analysis. Moreover, the turbulence characteristics of the flow field under a step inlet flow pattern are more intense than that of a sinusoidal one. Our data provide evidence that the mean k of the impingement region and flow characteristics of the flow field are determined by key parameters of the dynamic inlet velocity variation and the geometry configuration. These key parameters include u0aver, ∆u, T, A, ∆φ, u* and the L/D ratio. In addition, the flow field of the impinging stream reactor with dynamic inlet flow pattern exhibits more intense turbulence characteristics than the conventional one with equal, or even a slightly larger, constant inlet velocity. These more intense turbulence characters are likely because dynamic inflow conditions bring more turbulence energy and pulsating characteristics to the impinging zone with an instantaneously moving impinging surface. Thus, the optimal turbulence characteristics of impinging streams can be obtained via dynamic inflow conditions in comparison with conventional impinging streams with constant inlet velocity.

5. Conclusions

In this work, the flow and turbulence characteristics of a submerged impinging stream reactor with dynamic inlet flow patterns are numerally and experimentally investigated and measured using a PIV technique and a CFD model. Relevant key parameters (e.g., u0aver, T, A, and ∆φ), types of dynamic inflow conditions and geometric configurations are tested. The experimental and simulated results indicate that different dynamic inlet velocity variations and nozzle separations strongly affect both the flow and the turbulence characteristics of the flow field. The following conclusions are drawn:
  • The outstanding features of the flow field in the impinging stream reactor with dynamic inlet flow patterns are that the impinging surface is instantaneously moving and that the position variation of the impinging surface varies linearly with w every half-period and makes a back-and-forth motion in one period under dynamic inlet velocity conditions.
  • Dynamic inflow conditions play an important role in motion characteristic of the impinging surface. The range of motion of the impinging surface increases with an increase in T, A or ∆u. Increasing inlet velocity from either of the two inlets provides continuous and additional energy into the flow field, leading to a more severe impinging force and improving momentum transfer in the impinging zone.
  • The turbulence characteristic of the impinging surface is closely related to inlet parameters and L/D. The maximum k(turbulence kinetic energy) of the flow field is still located at the impinging center in impinging stream reactors with dynamic inflow conditions. The mean k of the impingement region increases as A, u0aver, or ∆u increase and decreases with an increase of L/D. Besides, the mean k of the impingement region reaches a maximum value at some T or ∆φ (initial phase difference between two inlet velocities).
  • Dynamic inflow conditions brings more intense turbulence into impinging zone with weak mean inlet velocities. Compared with conventional impinging stream reactors with equal mean inlet velocities, impinging stream reactors with dynamic inflow conditions under the same operating conditions can cause more intensely turbulent flows in the impinging zone with an instantaneously moving impinging surface.
  • The results presented in this paper should be useful for designing future, optimized impinging stream reactors with more intense turbulence characteristics. Future research should focus on the development of impinging stream reactors with dynamic inflow conditions in practical applications, such as mixing, drying, combustion, etc.

Author Contributions

X.L. and S.Y. make numerical calculations and analyze data. X.L. and L.L. design and perform the experiments and validate the numerical results. X.L. writes the original draft. L.L., W.G. and J.L. write review and edit the original draft.

Funding

This work is supported by the National Natural Science Foundation of China (Grant No. 51506072 and 51375183) and the National Basic Research Program of China (Project No. 2015CB251504).

Conflicts of Interest

The authors declare no conflict of interest.

Nomenclature

SymbolCommentUnit
kTurbulence kinetic energym2/s2
SModulus of mean rate of strain tensor-
εEnergy dissipation ratem2/s3
xi, xjCoordinatesm
tTime steps
TPeriods
AAmplitudem/s
ρDensity kg/m3
ui, ujVelocity componentm/s
gGravitational accelerationm2/s
τStress tensors of liquid phasePa
tTimes
μDynamic viscositykg/(m∙s)
μtTurbulent viscositykg/(m∙s)
σkTurbulent Prandtl number for k-
σεTurbulent Prandtl number for ε-
υKinematic viscositym2/s
u0Constant inlet velocitym/s
u0averAverage inlet velocity in one periodm/s
NNumber of periods, N ≥ 15-
uL, uRLeft inlet velocity, right inlet velocitym/s
φL, φRInitial phase of left and right inlet°
φPhase difference°
uInlet velocity difference between both opposed jetsm/s
u*Instantaneous mean velocity of both inlet fluidsm/s
u0aver, LLeft mean inlet velocity during one periodm/s
u0aver, RRight mean inlet velocity during one periodmm
DNozzle diametermm
LImpinging spacingmm
wDegree of completed inflow conditions with dynamic inlet velocity variation in one period, w∈[0,1]-
xCoordinate of the nozzle axism
VLiquid instantaneous velocity magnitudem/s

References

  1. Elperin, I.T. Heat and mass transfer in opposing currents. J. Eng. Phys. 1961, 6, 62–68. [Google Scholar]
  2. Tamir, A. Impinging-Streams Reactors: Fundamentals and Applications; Elsevier: Amsterdam, The Netherlands, 1994. [Google Scholar]
  3. Kudra, T.; Mujumdar, A.S. Impingement streams dryers for particles and pastes. Dry. Technol. 1989, 7, 219–266. [Google Scholar] [CrossRef]
  4. Du, M.; Gong, J.; Chen, W.; Wang, Q. Mathematical Model Based on DSMC Method for Particulate Drying in a Coaxial Impinging Streams Dryer. Dry. Technol. 2015, 33, 646–658. [Google Scholar] [CrossRef]
  5. Khomwachirakul, P.; Devahastin, S.; Swasdisevi, T.; Soponronnarit, S. Simulation of flow and drying characteristics of high-moisture particles in an impinging streams dryer via CFD-DEM. Dry. Technol. 2016, 34, 403–419. [Google Scholar] [CrossRef]
  6. Fan, H.L.; Zhou, S.F.; Qi, G.S.; Liu, Y.Z. Continuous preparation of Fe3O4 nanoparticles using impinging streams-rotating packed bed reactor and magnetic property thereof. J. Alloys Compd. 2016, 662, 497–504. [Google Scholar] [CrossRef]
  7. Fan, H.L.; Zhou, S.F.; Gao, J.; Liu, Y.Z. Continuous preparation of Fe3O4 nanoparticles through Impinging Streams-Rotating Packed Bed reactor and their electrochemistry detection toward heavy metal ions. J. Alloys Compd. 2016, 671, 354–359. [Google Scholar] [CrossRef]
  8. Berman, Y.; Tanklevsky, A.; Oren, Y.; Tamir, A. Modeling and experimental studies of SO2 absorption in coaxial cylinders with impinging streams: Part I. Chem. Eng. Sci. 2000, 55, 1009–1021. [Google Scholar] [CrossRef]
  9. Berman, Y.; Tanklevsky, A.; Oren, Y.; Tamir, A. Modeling and Experimental studies of SO2 absorption in coaxial cylinders with impinging streams: Part II. Chem. Eng. Sci. 2000, 55, 1023–1028. [Google Scholar] [CrossRef]
  10. Liu, Z.; Guo, L.; Huang, T.; Wen, L.; Chen, J. Experimental and CFD studies on the intensified micromixing performance of micro-impinging streams reactors built from commercial T-junctions. Chem. Eng. Sci. 2014, 119, 124–133. [Google Scholar] [CrossRef]
  11. Krupa, K.; Nunes, M.I.; Santos, R.J.; Bourne, J.R. Characterization of micromixing in T-jet mixers. Chem. Eng. Sci. 2014, 111, 48–55. [Google Scholar] [CrossRef]
  12. Saien, J.; Moradi, V. Low interfacial tension liquid-liquid extraction with impinging-jets contacting method: Influencing parameters and relationship. J. Ind. Eng. Chem. 2012, 18, 1293–1300. [Google Scholar] [CrossRef]
  13. Rajaie, E.; Sohrabi, M. Application of the Monte Carlo technique in simulation of flow and modeling the residence time distribution in a continuous two impinging liquid-liquid streams contactor. Chem. Eng. J. 2008, 143, 249–256. [Google Scholar] [CrossRef]
  14. Wu, D.; Li, J.; Liu, Z.; Zheng, C. Numerical study of particle behavior in laminar axisymmetric opposed-jet flows. Powder Technol. 2015, 270, 176–184. [Google Scholar] [CrossRef]
  15. Du, M.; Zhao, C.; Zhou, B.; Guo, H.; Hao, Y. A modified DSMC method for simulating gas–particle two-phase impinging streams. Chem. Eng. Sci. 2011, 66, 4922–4931. [Google Scholar] [CrossRef]
  16. Ghasemi, N.; Sohrabi, M.; Khosravi, M.; Mujumdar, A.S.; Goodarzi, M. CFD simulation of solid–liquid flow in a two impinging streams cyclone reactor:Prediction of mean residence time and holdup of solid particles. Chem. Eng. Process. 2010, 49, 1277–1283. [Google Scholar] [CrossRef]
  17. Choicharoen, K.; Devahastin, S.; Soponronnarit, S. Numerical Simulation of Multiphase Transport Phenomena during Impinging Streams Drying of a Particulate Material. Dry. Technol. 2012, 30, 1227–1237. [Google Scholar] [CrossRef]
  18. Metzger, L.; Kind, M. The influence of mixing on fast precipitation processes—A coupled 3D CFD-PBE approach using the direct quadrature method of moments (DQMOM). Chem. Eng. Sci. 2017, 169, 284–298. [Google Scholar] [CrossRef]
  19. Metzger, L.; Kind, M. On the mixing in confined impinging jet mixers-Time scale analysis and scale-up using CFD coarse-graining methods. Chem. Eng. Res. Des. 2016, 109, 464–476. [Google Scholar] [CrossRef]
  20. Erkoç, E.; Fonte, C.P.; Dias, M.M.; Lopes, J.C.; Santos, R.J. Numerical study of active mixing over a dynamic flow field in a T-jets mixer—Induction of resonance. Chem. Eng. Res. Des. 2016, 106, 74–91. [Google Scholar] [CrossRef] [Green Version]
  21. Li, W.F.; Yao, T.L.; Liu, H.F.; Wang, F.C. Experimental Investigation of Flow Regimes of Axisymmetric and Planar Opposed Jets. AIChE J. 2011, 57, 1434–1446. [Google Scholar] [CrossRef]
  22. Li, J.; Wang, H.; Xiong, Y.; Jiang, G.; Liu, Z.; Zheng, C. Experimental investigation on turbulence modification in a dilute gas-particle axisymmetric opposed jets flow. Chem. Eng. J. 2016, 286, 76–90. [Google Scholar] [CrossRef]
  23. Wang, S.J.; Mujumdar, A.S. Flow and mixing characteristics of multiple and multi-set opposing jets. Chem. Eng. Process. 2007, 46, 703–712. [Google Scholar] [CrossRef]
  24. Sun, W.; Zhong, W.; Zhang, Y. LES-DPM simulation of turbulent gas-particle flow on opposed round jets. Powder Technol. 2015, 270, 302–311. [Google Scholar] [CrossRef]
  25. Huai, X.L.; Peng, X.F.; Wang, G.X.; Liu, D.Y. Multi-phase flow and drying characteristics in a semi-circular impinging streams dryer. Int. J. Heat Mass Transf. 2003, 46, 3061–3067. [Google Scholar] [CrossRef]
  26. Zhang, W.; Chai, Z.; Shi, B.; Guo, Z. Lattice Boltzmann study of flow and mixing characteristics of two-dimensional confined impinging streams with uniform and non-uniform inlet jets. Comput. Math. Appl. 2013, 65, 638–647. [Google Scholar] [CrossRef]
  27. Metzger, L.; Kind, M. On the transient flow characteristics in Confined Impinging Jet Mixers-CFD simulation and experimental validation. Chem. Eng. Sci. 2015, 133, 91–105. [Google Scholar] [CrossRef]
  28. Kleingeld, A.W.; Lorenzen, L.; Botes, F.G. The development and modelling of high-intensity impinging streams jet reactors for effective mass transfer in heterogeneous systems. Chem. Eng. Sci. 1999, 54, 4991–4995. [Google Scholar] [CrossRef]
  29. Ahmed, Z.U.; Al-Abdeli, Y.M.; Matthews, M.T. The effect of inflow conditions on the development of non-swirling versus swirling impinging turbulent jets. Comput. Fluids 2015, 118, 255–273. [Google Scholar] [CrossRef]
  30. Li, W.; Sun, Z.; Liu, H.; Wang, F.; Yu, Z. Experimental and numerical study on stagnation point offset of turbulent opposed jets. Chem. Eng. J. 2008, 138, 283–294. [Google Scholar] [CrossRef]
  31. Wang, S.; Li, X.; Fang, J.; Zhao, J.; Liu, L.; Liu, Y.; Liu, Y. Simulations of flow behavior of oscillatory opposed dilute gas–solid jets. Powder Technol. 2015, 284, 595–603. [Google Scholar] [CrossRef]
  32. Ghadi, S.; Esmailpour, K.; Hosseinalipour, S.M.; Mujumdar, A. Experimental study of formation and development of coherent vertical structures in pulsed turbulent impinging jet. Exp. Therm. Fluid Sci. 2016, 74, 382–389. [Google Scholar] [CrossRef]
  33. Wu, C.; Cheng, Y.; Ding, Y.; Jin, Y. CFD-DEM simulation of gas-solid reacting flows in fluid catalytic cracking (FCC) process. Chem. Eng. Sci. 2010, 65, 542–549. [Google Scholar] [CrossRef]
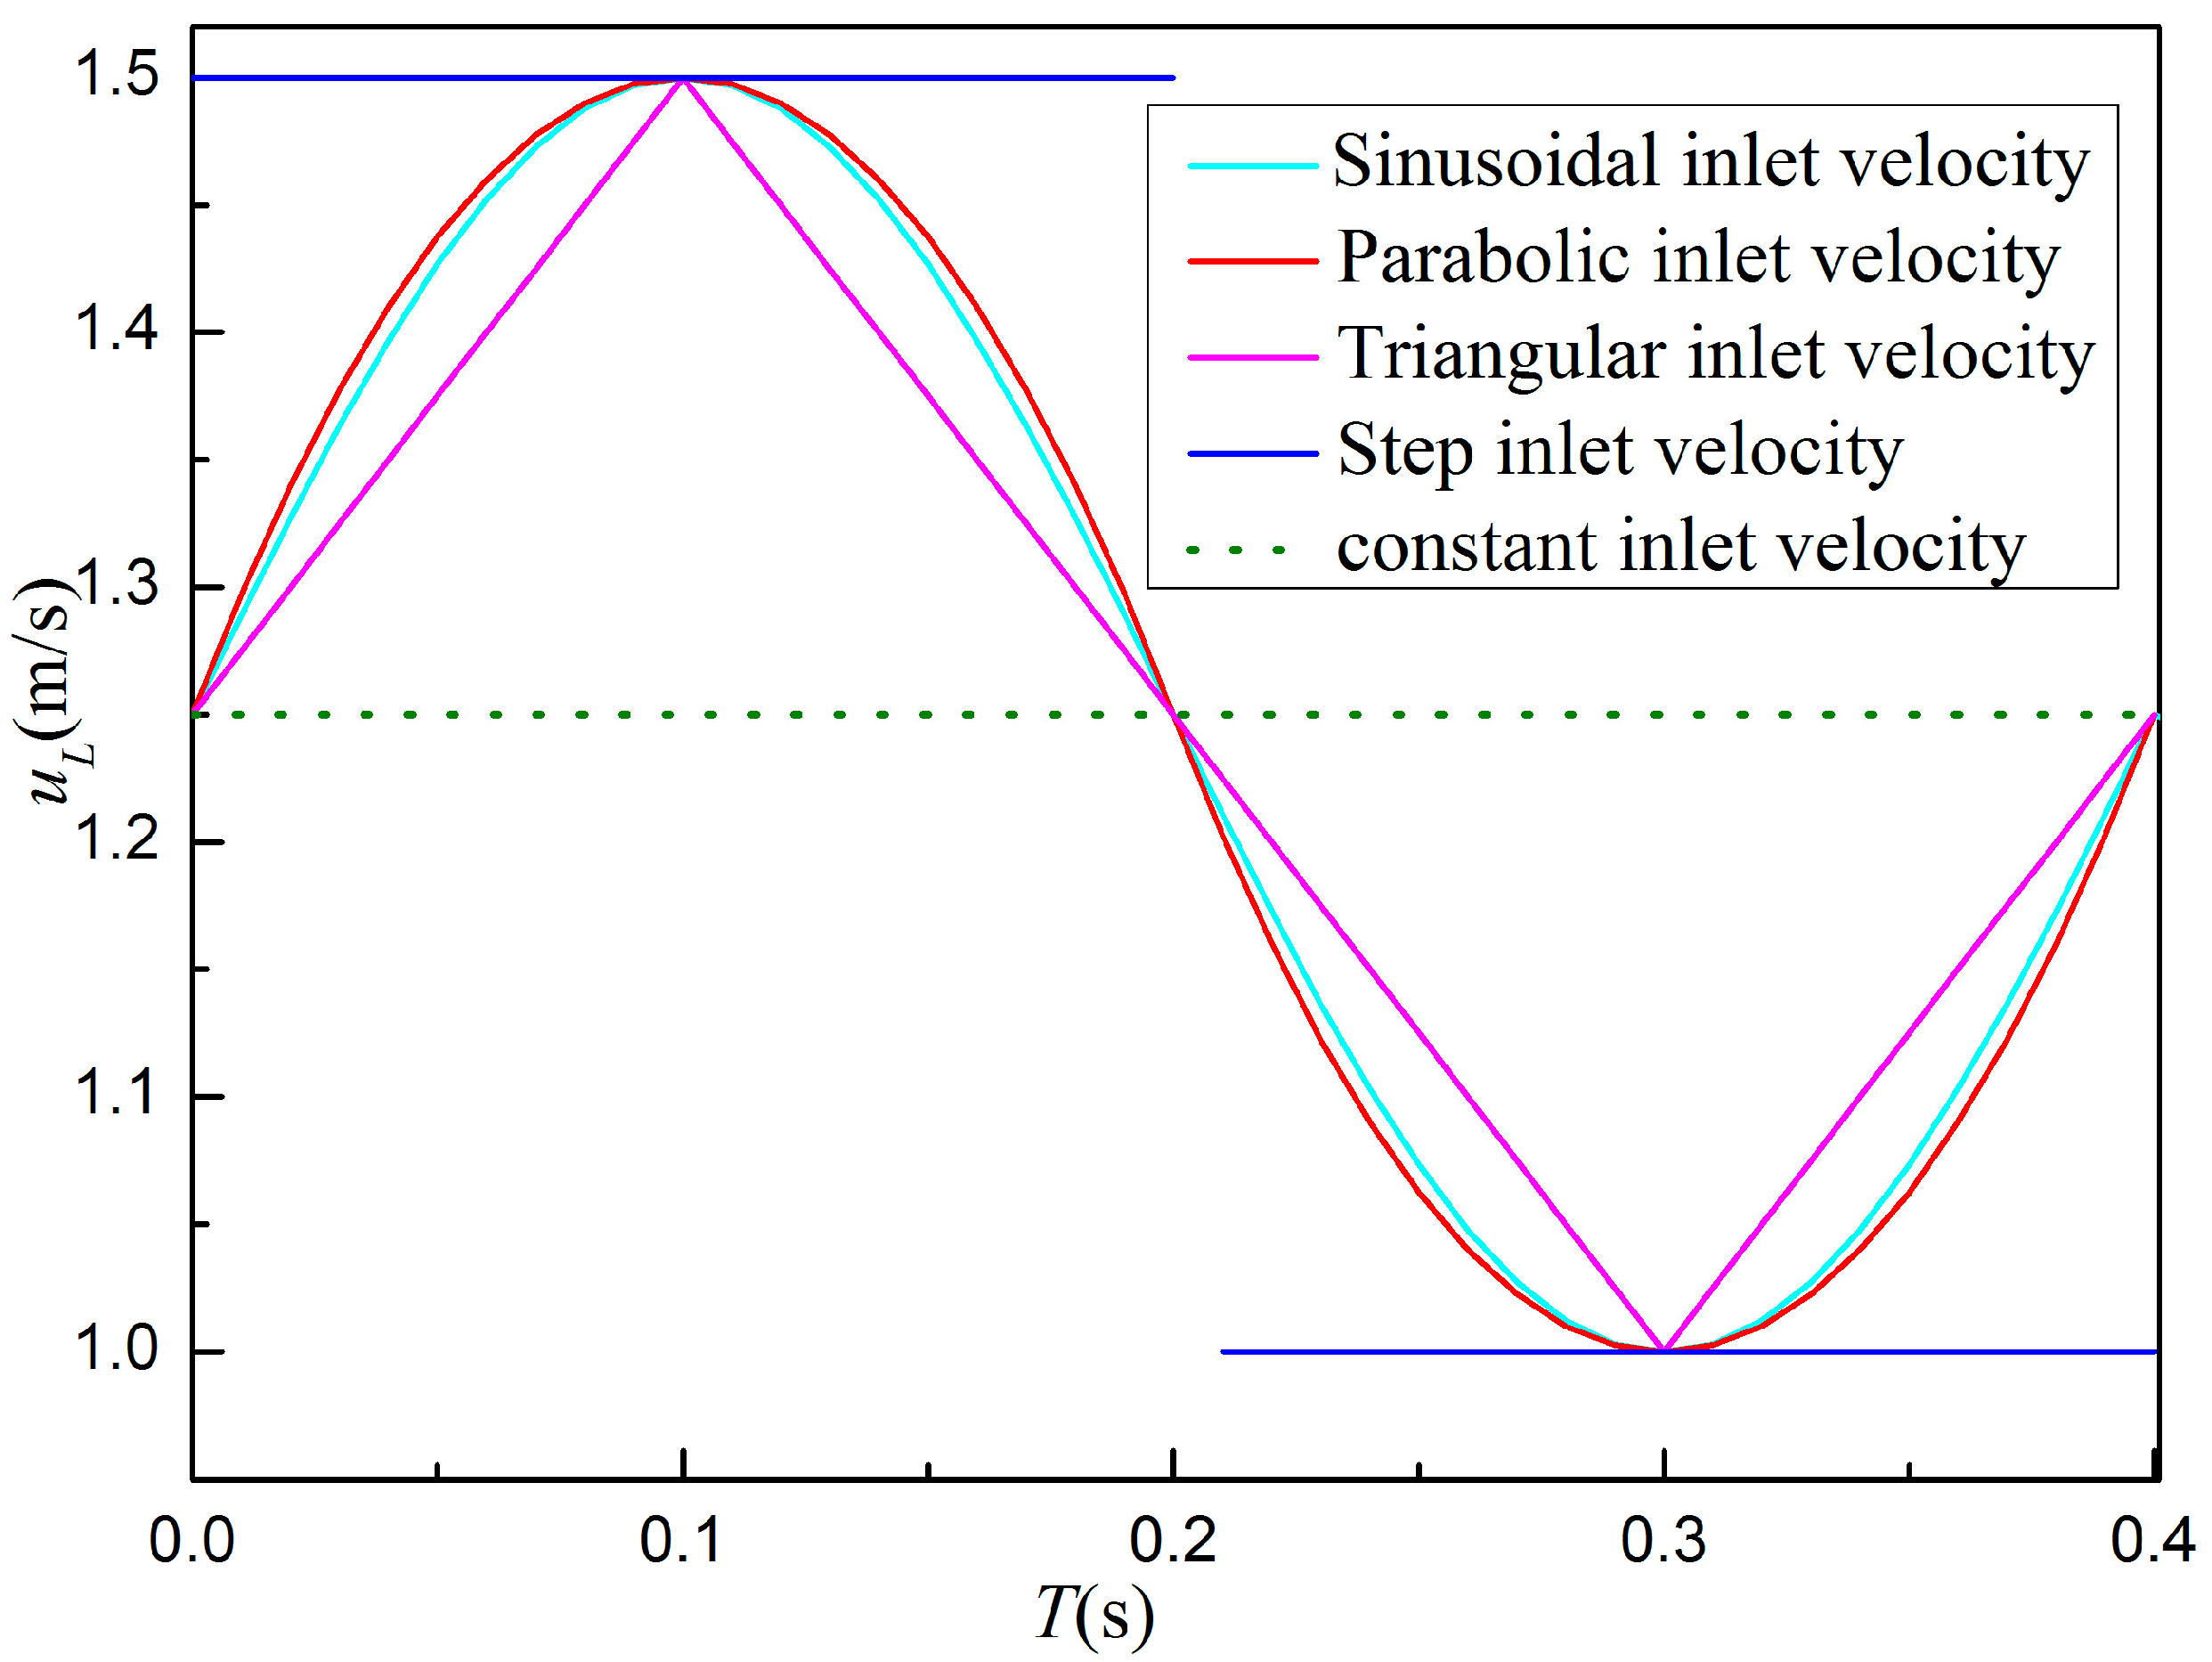
Figure 1. Different left inlet flow patterns with ∆φ = T/2 used in this work.
Energies 11 01717 g001
Figure 2. Geometric model of an impinging stream reactor. (a) xz plane; (b) physical map; (c) xz plane mesh model.
Energies 11 01717 g002
Figure 3. Fluid velocity distribution on the axis of the xz plane, as determined using computational fluid dynamics (CFD), with a constant inlet velocity of um = 1.25 m/s.
Energies 11 01717 g003
Figure 4. Schematic of the experimental system. 1—pump; 2,4,5,6,9—valve; 3—buffer tank; 7—flow meter; 8—shunting device; 10—cylindrical collision chamber; 11—conical tank; 12—CCD camera; 13—synchronous controller; 14—image acquisition workstation; 15—monitor and software interface; 16—laser controller; 17—pulse laser; 18—light arm; 19—optical parts.
Energies 11 01717 g004
Figure 5. Part of the experimental system physical drawing.
Energies 11 01717 g005
Figure 6. Cross-section of the shunting device. 1—86-step motor; 2—bell jar; 3—three-diaphragm coupling; 4—rotor; 5—fixed plate; 6—drive column; 7—spring; 8—plate 1; 9—plate 2.
Energies 11 01717 g006
Figure 7. Instantaneous vector maps of the xz plane by PIV with a constant inlet velocity of um = 1.25 m/s and L/D = 4.
Energies 11 01717 g007
Figure 8. Instantaneous velocity vector maps of the xz plane, as determined using particle image velocimetry (PIV) for the sinusoidal inlet velocity at um = 1.25 m/s, T = 0.4, A = 0.25 m/s, L/D = 4 and ∆φ = T/2 in one period.
Energies 11 01717 g008aEnergies 11 01717 g008b
Figure 9. Position variation of the impinging surface during many periods, as determined by PIV and a CFD model, at um = 1.25 m/s, T = 0.4, A = 0.25 m/s, L/D = 4 and ∆φ = T/2; N is the number of periods; the area formed by the red line is the allowable error range between simulation and experiment data.
Energies 11 01717 g009
Figure 10. Instantaneous velocity magnitude on the axis of the nozzle in the xz plane, as determined by PIV and CFD for a sinusoidal inlet velocity at um = 1.25 m/s, T = 0.4, A = 0.25 m/s, L/D = 4 and ∆φ = T/2 in one period.
Energies 11 01717 g010aEnergies 11 01717 g010b
Figure 11. Instantaneous axial velocity distribution on the axis of the nozzle in the xz plane, as determined by PIV and CFD for a sinusoidal inlet velocity at um = 1.25 m/s, T = 0.4, A = 0.25 m/s, L/D = 4 and ∆φ = T/2 in one period.
Energies 11 01717 g011
Figure 12. Effect of period on the position of the impinging surface, as determined by PIV and CFD for a sinusoidal inlet velocity at um = 1.25 m/s, A = 0.25 m/s, L/D = 4 and ∆φ = T/2 in one period.
Energies 11 01717 g012aEnergies 11 01717 g012b
Figure 13. Effect of amplitude on the position of the impinging surface, as determined by PIV and CFD for sinusoidal inlet velocities at um = 1.25 m/s, T = 0.4 s, L/D = 4 and ∆φ = T/2 during one period.
Energies 11 01717 g013
Figure 14. Impinging surface motion range by CFD model at different periods and flow patterns of inlet velocity variation, um = 1.25 m/s, A = 0.25 m/s, L/D = 4 and ∆φ = T/2 in one period. (a) effect of T on impinging surface motion range at step inlet velocity conditions; (b) effect of inlet types on impinging surface motion range at T = 0.4 s.
Energies 11 01717 g014
Figure 15. Instantaneous turbulence kinetic energy distribution on the axis of the nozzle in the x-plane by CFD for sinusoidal and constant inlet velocities at um = 1.25 m/s, T = 0.4, A = 0.25 m/s, L/D = 4 and ∆φ = T/2 during one period. (a) entire instantaneous k axial distribution; (b) local enlarged detail of Figure 15a.
Energies 11 01717 g015
Figure 16. Effects of period on the mean k of the impingement region during one period by CFD at um = 1.25 m/s, A = 0.25 m/s, L/D = 4 and ∆φ = T/2.
Energies 11 01717 g016
Figure 17. (a) Effect of amplitude on the mean k of the impingement region during one period, as determined by CFD for sinusoidal step inlet velocity, um = 1.25 m/s, T = 0.4 s, L/D = 4 and ∆φ = T/2. (b) Effect of phase difference, as determined by CFD, on the mean k of the impingement region in one period for sinusoidal step inlet velocity, um = 1.25 m/s, T = 0.4 s, L/D = 4 and A = 0.25 m/s.
Energies 11 01717 g017
Figure 18. Effect of L/D on the mean k of the impingement region in one period by CFD at um = 1.25 m/s, A = 0.25 m/s, T = 0.4 s and ∆φ = T/2 for sinusoidal inlet velocity.
Energies 11 01717 g018
Figure 19. Effect of dynamic inflow type on the mean k of the impingement region during one period, as determined by CFD at um = 1.25 m/s, A = 0.25 m/s, T = 0.4 s, L/D = 4 and ∆φ = T/2.
Energies 11 01717 g019
Figure 20. Effects of mean inlet velocity and the maximum ∆u on the mean k of the impingement region during one period at T = 0.4 s, L/D = 4 and ∆φ = T/2. (a) sinusoidal and constant inlet velocities; (b) step and constant inlet velocities.
Energies 11 01717 g020
Table 1. Different inlet velocity flow patterns.
Flow PatternuLNotes
Sinusoidal inlet velocity u L = u m + A sin ( 2 π / T · t ) uR = 2umuL ≥ 0, where a1, a2, b1, b2, c1, c2, c3, d1 and d2 are constant; uL reaches a maximum value at t = T/4 and a minimum value at t = 3T/4 for all inlet velocity flow patterns. The maximum and minimum value and T are equal for different inlet velocity flow patterns.
Parabolic inlet velocity u L = { a 1 ( t T / 4 ) 2 + b 1 0 < t 2 / T a 2 ( t 3 T / 4 ) 2 + b 2 2 / T < t T
Step inlet velocity u L = { u 1 = u m + A 0 < t 2 / T u 2 = u m A 2 / T < t T
Triangular inlet velocity u L = { c 1 t 0 < t T / 4 c 2 t + d 1 T / 4 < t 3 T / 4 c 3 t + d 2 3 T / 4 < t T
Constant inlet velocity (conventional impinging streams) u L = u R = u m = c o n s tan t
Table 2. Conditions of simulations/experiments.
ParameterCFD ModelExperimentInlet Velocity Flow Pattern
um (m/s)1.25, 1.4, 1.51.25, 1.4, 1.5Constant
T (s)0.2, 0.3, 0.4, 0.5, 0.60.2, 0.3, 0.4, 0.5, 0.6Sinusoidal, Step
A (m/s)0.15,0.2, 0.25, 0.35, 0.40.15,0.2, 0.25, 0.35, 0.4Sinusoidal, Step
φT/12, T/6, T/4, T/3, 5T/12, T/2-Sinusoidal
Table 3. Properties of water and geometric parameters of the impinging stream reactor.
Property/SymbolUnitValue
Water density/ρkg/m3998.2
Water viscosity/μkg/m∙s0.001003
Nozzle diameter/Dmm20
Impinging distance/Lmm80, 100, 120, 140, 160