Article

Mathematical Thermal Modelling of a Direct-Expansion Solar-Assisted Heat Pump Using Multi-Objective Optimization Based on the Energy Demand

by
Jorge E. De León-Ruiz
* and
Ignacio Carvajal-Mariscal
Instituto Politécnico Nacional, ESIME, UPALM, Av. IPN s/n, CDMX 07738, Mexico
*
Author to whom correspondence should be addressed.
Energies 2018, 11(7), 1773; https://doi.org/10.3390/en11071773
Submission received: 1 June 2018 / Revised: 28 June 2018 / Accepted: 2 July 2018 / Published: 6 July 2018

Abstract

:
An analytical model is proposed to evaluate the performance of a Direct Expansion Solar-Assisted Heat Pump under a given environmental condition. These thermal machines commonly employ uncovered flat plate solar collectors, and given this, the convection phenomenon is taken into account as well as the effect of the diffuse and reflected solar radiation in addition to the normal beam radiation absorbed by the tilted surface of the collectors. The heat pump cycle is modelled through a first law of thermodynamics approach in order to compute the heat yielded through condensation and the minimum heat required by the volume of water in the thermal storage unit. Consequently, the thermal capacity of the heat pump, the ratio at which the system yields heat to a given load of water, is calculated and discussed. The results of the model proposed are compared with the experimental data provided by three research papers with experiments conducted in different geographic coordinates and test rigs operating during diverse atmospheric conditions. A maximum relative error of 20% was obtained and furthermore, a statistical analysis of the data was conducted having found that there is no significant statistical difference between the analytical and experimental data samples within the 95% confidence interval. Finally, based on the thermal capacity, the performance of the heat pump is evaluated and a multi-objective optimization technique is implemented to obtain the best possible combination of factors to further enhance the performance of the heat pump.

1. Introduction

In the last few decades, issues regarding efficient energy consumption have become relevant and consequently efforts towards the research and development of new technologies or alternatives to harness renewable energies, as well as new energy saving polices have increased. To address this matter, solar collection systems for domestic applications have been proposed as an alternative to reduce the dependence on conventional fuels and decrease greenhouse gas emissions.
As a result, the concept of Solar-Assisted Heat Pump, is introduced. These are thermal machines that operate under a vapor compression cycle and employ solar collection devices, are considered a sustainable alternative to the already existing conventional gas burner appliances used to provide a comfort through a final product, mainly hot water or air, for water heating systems (WHS), or climate control, heating, ventilating, and air-conditioning (HVAC), respectively [1].
In order to harness the additional energy provided by the sun, a particular configuration of heat pumps known as Direct Expansion Solar-Assisted Heat Pump (DXSAHP), was developed which combines solar collectors and outdoor heat exchangers into a single bare flat plate.
This thermal machine is then able to perform more efficiently than other heating systems by harnessing an additional energy input through total solar radiation and, unlike the conventional solar water heating systems, it does not depend entirely on the normal beam radiation. Additionally, the use of a refrigerant as a working fluid further improves the performance, given that the refrigerant changes from liquid to vapor at temperatures close to the ones present in the environment, triggering a heat transfer mechanism between the collector and its surroundings, due to convective phenomena. This occurrence provide these thermal machines, given a proper design and dimensioning, with the capability to deliver an acceptable coefficient of performance (COP), even when working under disadvantageous atmospheric conditions.
The earliest work describing these devices was presented by Sporn and Ambrose [2] were they modeled the heat pump in terms of refrigeration using mechanical compression and solar collection.
Since then, many innovative configurations have been introduced, such as the DXSAHP, and several authors have followed their work, conducting different analysis, tests and reviews [1,2,3,4,5,6,7,8,9,10,11,12,13,14,15,16,17,18,19,20,21,22,23,24,25,26,27]. These papers cover the research and development of different DXSAHP designs, the performance in terms of thermal outputs, COP and efficiency levels and the potential applications and as a consensus, the authors agree that this solar thermal technology presents many attractive features for a wide range of applications and industrialization opportunities for large-scale water heating systems.

1.1. Analysis of the Solar Collectors

When summarizing the published works it can be seen that Chaturvedi is one of the most prolific authors in this area, having written a series of experimental and numerical studies to determine the effects the devices that comprise the heat pump cycle have on the performance of the system, particularly the collectors. Based on our review, in 1980, Chaturvedi et al. [3] were possibly the first ones to set out a comprehensive model describing a two-phase flow solar collector with application to heat pumps; they found that a large pressure drop might occur if the refrigerant is passed through a small number of parallel serpentine tube panels. The results suggested that a high COP and collector efficiency are feasible with bare collectors and that a higher collector area improves COP and additionally reduces the electrical energy input, however, reducing the efficiency of said collector due to a higher energy availability, hence, a higher collector temperature that results in higher back losses. Few years later, Chaturvedi along with Shen [4] carried out an experiment comparing between a DXSAHP and a conventional fan-coil exchanger Solar-Assisted Heat Pump (SAHP), proving that the former presents COP levels 1.5 to 2 times higher than the conventional SAHP and concluded that the DXSAHP could perform with a 40% to 70% collector efficiency levels even during winter weather. Later on, Chaturvedi and Abazeri [5] simulated the performance of said DXSAHP during a period; they arrived to the conclusion that the most important parameters related to the design were the solar collector area, evaporation temperature, rotational speed of the compressor and the thermo-physical properties of the working fluid. At a later time, Aziz and Chaturvedi [6] experimented with the same DXSAHP design and concluded that a variation in the mass flow of the refrigerant affects significantly its heat transfer coefficient, and that the change in piping diameter and collector pressure are irrelevant, being the collector size the most critical dimension that affects the performance of the working fluid. Other authors such as Ito et al. [7] also experimented with the collector dimensions and construction, concluding that they do not have a significant effect on the DXSAHP’s performance, as long as it is not working under extreme conditions and the solar radiation index is at its maximum. On the other hand, to comprehend the heat transfer capabilities of the DXSAHP during non-radiation conditions Tabatabaei et al. [8] developed an analytical model to analyze an air-to-water heat pump for space heating, considering only convection phenomena and the temperature difference between the heat source and sink. The results indicate that at night, there is an advantage of 7.2% in energy usage if the difference between indoor and outdoor temperatures is left free to increase. Finally, regarding the modelling of the heat pump, they suggested that a smaller time step in the simulation should be used given that considerably decreases the difference between the experimental and the analytical datasets. In relation to the effect of heat convection on the surface of the collectors, Zhu et al. [9] conducted an experiment where they evaluated the seasonal performance of a Heat Pump (HP) using three different types of collectors. They concluded that under the similar external conditions, in comparison with the glass-plate collector, the bare-plate collector system COP is higher with better irradiation and higher environment temperature; increasing collector area is conducive to improving the system COP, but will reduce the collector efficiency and increase the workload of the compressor. Moreover, suggest adopting bare-plate collectors at summer with better irradiation and higher environment temperature, in winter, at the opposite case, using the glass-plate collector.

1.2. Design of the Thermal Storage Unit

In a different approach, several authors chose instead to focus their research on the application of the HP, namely the analysis and improvement of the heat pump system through the design and configuration and capacity of the thermal storage unit. A particularly relevant paper was published by Kuang et al. [10] who based on an experiment and through COP and collector efficiency determine the storage volume and recommended an optimum ratio of product storage and collector area equivalent to 75 to 125 L/m2. Additionally, an experiment conducted by Anderson et al. [11] changed the configuration of the thermal storage unit, integrating a coil on its walls. They obtained that the water load in the tank affects the coefficient of performance, since COP decreases by almost 40% when the water load inside the thermal storage unit is reduced to a half, compared to a full tank. Despite this, the system had a better performance when the condenser coil was located at the bottom part of the tank. Furthermore, Hawlader et al. [12] through an experiment found that if storage size increases, condensing temperature decreases, leading to a slight decrease in evaporating temperature, causing an increased energy gained by the collector and a reduction in compression work. Also, found that for that particular configuration a storage volume of 100 L/m2, gives the optimum performance. Mei et al. [13] developed and subjected to experimental evaluations two low cost heat pumps that incorporated an immersed direct heat exchanger to eliminate the need of a water pump and associated loop to circulate the water from the condenser to the thermal storage unit and consequently increase the overall performance of the HP. The first configuration required a modification of the standard water tank design to enable insertion of the u type condenser into the tank, and a second design concept pursued that used a helical coil condenser and required no modification. The initial concept achieved a laboratory measured energy factor (EF) of 1.79 and an average COP of 1.75. A laboratory proof-of-concept prototype based on the second design achieved an EF of 2.02, 2.24 times higher than typical values for current electric water heaters.

1.3. Experimental Validations and Reviews

Based on the aforementioned information, several experimental researches have been conducted in order to validate the use of this technology and present it as a suitable water heating alternative. Moreno-Rodriguez et al. [14] built an experimental setup of a DXSAHP for both water and space heating; they obtained COP levels of 2.1 for water heating and a range of 1.7 to 3.3, depending on atmospheric conditions, for space heating. Additionally found that the solar radiation absorbed through the flat plate collectors increases the condenser’s heat transfer capacity and the power input of the compressor. Other experimental setup was proposed by Soldo et al. [15] where they analyzed a DXSAHP using the refrigerant R134a, where experimental results showed the significant influence of the compressor speed and the solar irradiation on the system performance. The collector efficiency was in the range of 0.6 to 0.85, which is a significant improvement, compared to the conventional solar hot water systems (conventional collectors ranging from 0.4 to 0.6). Also, authors found that the heat pump can be optimized by changing the speed of the compressor, with a lower speed, the refrigerant mass flow through the collector is also lowered, leading to a higher refrigerant temperature in the collector and therefore a higher COP. The COP levels of the heat pump they analyzed are in the range of 4 to 9, depending on the system parameters settings. They concluded that, increasing the solar irradiation to the collector, the ambient temperature, or decreasing the compressor speed, the COP presents higher levels.
It is then, that the reported results confirm that the DXSAHP is a very capable technology due to its ability to control the panel surface temperature, thus significantly increasing its efficiency, especially during intermediate weather conditions. The DXSAHP also provides a significant amount of heat even in disadvantageous environmental conditions, compared to both a traditional gas-burner integrated solar heater and a gas-burner alone, which concludes that satisfactory energy savings can be achieved, as stated by Tagliafico et al. [16]. To corroborate this, Omojaro and Breitkopf [17] conducted a review on direct expansion solar-assisted heat pumps systems, concluding that the DXSAHP heating application commercial viability was shown to be high and accounts for 75% of the research papers reviewed in their study. The work they evaluated showed that the influence of the additional solar heat rate on the performance of both the collector-evaporator and the compressor to be highly significant. Furthermore, the advance configuration models group of a DXSAHP system, i.e., two-stage, perform better than the basic models in terms of the reported COP which makes them recommendable as having high potential for further investigation.

1.4. Alternative DXSAHP Designs

To further improve the performance of the DXSAHP, a number of research papers have been published regarding the design of different configurations of solar-assisted heat pumps. Once more, Chaturvedi et al. [18] contributed with the publication of a new research were they developed a two stage DXSAHP test rig. They found that this configuration required a customized flat plate collector that matched the compressor capacity, and also that the thermal efficiency of this design was better than its single stage counterpart, reaching condensation temperatures between 70 °C and 90 °C. Alternatively, suggesting a compact HP setup, Cutic et al. [19] developed a mobile DXSAHP unit and after conducting the trial testing, obtained COP levels ranging between 5.1 and 5.9 heating 300 liters of water up to 48 °C in a little over 4 h. Authors concluded that solar radiation has the most significant impact on the COP levels and the fact that the evaporation temperature is lower than the ambient temperature enables the heat absorption from the ambient air via convection mechanism.

1.5. DXSAHP Modelling and Simulations

Given all this information presented, researchers have shown a special interest in modelling and simulating the performance of the HP. One of the most relevant works in this matter is the paper published by Morrison [20] where he evaluated the feasibility to install and operate this machine under different working conditions using TRNSYS software (13.1, Thermal Energy System Specialists, LLC, Madison, WI, USA). Following his work, several studies have been conducted, such as the ones by Mehdaoui [21], Bridgeman [22], DeGrove [23], Khalaf [24], Fu [25], Kamel [26] and Youssef [27]. Alternatively, several authors developed and proposed mathematical models of the system employing a more robust approach where every process of the heat pump cycle was modelled separately and then connected to simulate and quantify the performance of the HP in terms of COP and collector efficiency such as Sterling et al. [28], Li et al. [29], Ҫağlar et al. [30], Kokila et al. [31] and Gorozabel-Chata et al. [32], in terms of exergy destruction and second law of thermodynamics, by Atmaca et al. [33] and Torres-Reyes et al. [34] respectively, and based on worktime and flow resistance in the collectors such as the one proposed by Chyng et al. [35]. One particular study is the one published by Chow et al. [36] where they set out a comprehensive model centered on the effect the atmospheric conditions have on the yearly performance of the heat pump, employing a 25 years period database of the typical meteorological months.
From this modelling approach it was seen that a mathematical optimization was possible and several authors published works implementing different techniques, such as Sánta et al. [37] who employed maximization of parameters, Guo et al. [38], through rough optimization and Khorasaninejad et al. [39] with particle swarm optimization.
Having reviewed all the information mentioned above, the authors of this paper agree that it is important to evaluate and optimize the performance of this thermal machine under different atmospheric and geographic conditions, for it to be introduced as a suitable and affordable alternative for water heating.

1.6. Scope

In this study, the proposed model is based on calculating the effect the atmospheric conditions exert on the heat pump, the limitations imposed by the desired outlet parameters and the operation and design specifications, as well as analyzing the outcome of this dependence. The model accounts for the total solar radiation and for convection heat transfer on both surfaces of the collectors, which are modelled as film of working fluid between two flat plates, as well as the convection on the thermal storage unit (TSU). The thermodynamic cycle model is built around the temperature gradients between the heat exchangers and their surroundings and the thermodynamic properties are computed accordingly.
The assessment of the performance of the DXSAHP is centered primarily on the relation between the energy required by the final product to reach and maintain a desired outlet condition and the capacity the DXSAHP has to meet this demand in terms of the energy availability in the region where the HP is being installed and operated.
Finally, a multi-objective optimization technique, specifically, a genetic algorithm, based on the thermal capacity of the heat pump is implemented to evaluate the efficiency of the design and obtain the most optimal configuration possible.

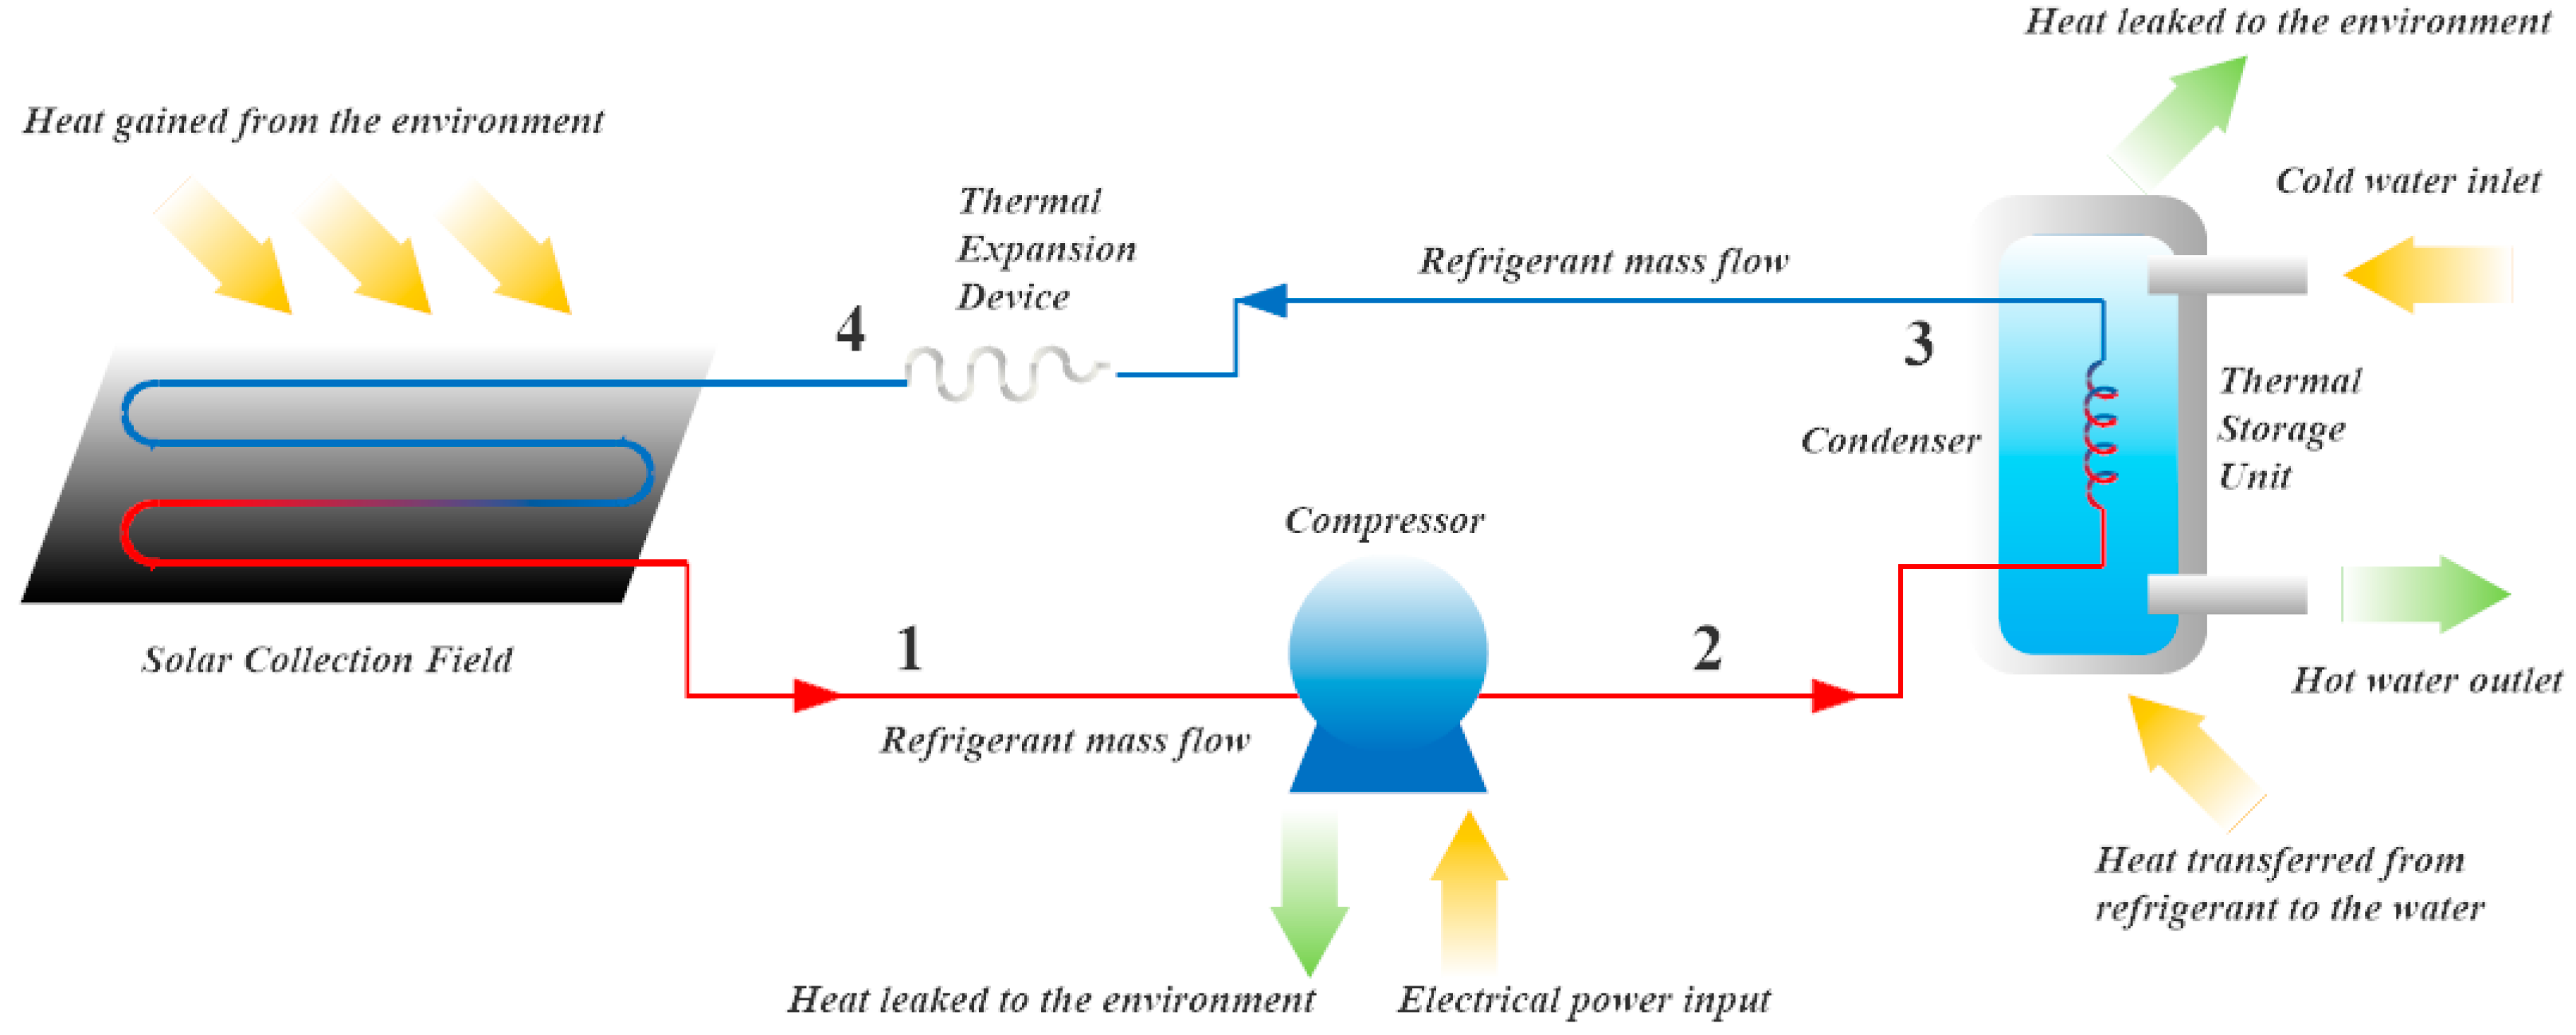
2. Model Development and Structure

As well known, a heat pump cycle is based on a vapor compression cycle and consists primarily of the following equipment: compressor, condenser, expansion valve, and evaporator.
Figure 1, shows the proposed configuration of the DXSAHP and given the assumption that the storage tank and the solar collectors are subjected to atmospheric conditions, it is particularly necessary to calculate the effect of the convection phenomena exerted upon both devices.
Presented in the form of a general schematic, the primary devices that comprise the DXSAHP specifically are:
  • A reciprocating hermetic compressor.
  • A flat-plate bare solar collector, which also acts as an evaporator absorbing heat from the environment, with a capillary tube as an expansion device.
  • An immersed helical coil heat exchanger, which condenses the working fluid as it transfers the heat gained from the collectors to the final product.
As a result of the previous analysis and the breaking apart of the DXSAHP into modules or blocks, Figure 2 is obtained, in which the variables that affect every component are shown and the performance of the heat pump is divided into three main sections which are the base of the analytical model proposed.

2.1. Modelling and Methodology

The main objective of this paper is to propose an analytical model to compute the performance of the DXSAHP under a given geographic and atmospheric condition. Through the application of a model that quantifies the total heat gained by the solar collectors and a first law analysis of the heat pump cycle, the condensation heat is calculated. Subsequently an analysis of the TSU is done to determine the minimal heat transfer rate necessary for the water to reach and maintain the designated outlet temperature.
The aforementioned design methodology is explained thoroughly in this section. It shows the modules that constitute the model presented in this paper and the sequence of computations to obtain the information needed.

2.1.1. Total Heat Collection Model

In order to calculate the heat gained through solar radiation the collectors were modelled as two flat plates with a film of working fluid between them as shown in Figure 3.
Additionally, it is crucial to understand that all of the processes that comprise the heat pump cycle occur simultaneously, hence, it is of particular importance to calculate the total heat gained by said film of refrigerant, since, both heat transfer mechanisms are exerted upon the surface of the flat plate collectors.
Having determined whether convection heat transfer presents itself as free or forced mechanisms upon both surfaces of the solar collector, from the ratio between the Grashof and Reynolds numbers, the heat transfer coefficient can be then determined using the corresponding Nusselt correlation, given a geometry, a flow regime and a Prandtl number range.
Rattner and Bohren [40] mention the following correlation for the superior surface, Equation (1) which is the Nusselt correlation for an inclined flat plate exposed to natural convection. In addition, to determine the heat transfer coefficient on the inferior surface Equation (2) is proposed by Hollands et al. [41], for free convection on a cavity, represented by the area or gap between the inferior surface of the flat plate collector and the top side of the surface said equipment is mounted on. Both which are extensively used in the calculation of convection effects upon solar collection devices [42].
N u ¯ n , i n f = 0.56 [ G r × P r × cos ( β ) ] 1 4
N u ¯ n , s u p = 1 + 1.44 × A × B × C
A = 1 1708 R a   [ cos ( β ) ]
B = 1 × 1708 ( s e n 1.6 ( β ) R a [ cos ( β ) ] )
C = [ R a   [ cos ( β ) ] 5830 ] 1 3 1
Convection heat transfer coefficient is determined for each surface through Equation (3) based on the Nusselt number obtained, the thermal conductivity of the air surrounding the collector and its characteristic length. Subsequently, by means of Newton’s cooling law, Equation (4) the magnitude of the convection on each surface can be obtained where the sum of both, Equation (5) is equal to the total heat transfer due to convection phenomena.
h ¯ c o l l = N u ¯ k L c
Q ˙ h = h ¯ c o l l A c o l l χ F ( T T s )
Q ˙ h , t = Q ˙ h , s u p + Q ˙ h , i n f
To find the magnitude of the total thermal radiation absorbed by the flat plate solar collectors, it is necessary to determine the sky emissivity, in order to compute the hemispherical or diffuse radiation that reaches the surface of the earth. Both can be calculated through Equations (6) and (7). The former is an empirical correlation proposed by Berdahl and Fromberg [43], where sky emissivity is presented as a function of the dew point temperature and the latter, reported by Chen et al. [44] quantifies the magnitude of the diffuse radiation.
ε s k y = 0.711 + 0.0056 T d p
G D = ε s k y σ R ( T + 273 ) 4
Since heat exchange occurs in a tilted surface and the magnitude of the heat per se, are both a function of the position the sun has in the sky, solar angles need to be determined; a comprehensive methodology to do so is presented by Kalogirou [45]. Regarding the total heat irradiation on a tilted surface, Reindl et al. [46,47] propose Equation (8), which is a variation of the isotropic model that quantifies the fraction of the beam radiation the hits the surface of the collectors, as a function of both the tilt factor, Equation (8a) and the anisotropic index, Equation (8b), where the former is the relation between the position of the sun and the collector inclination, and the latter quantifies the atmospheric attenuation. Moreover, in addition to diffuse and circumsolar radiation, the Reindl model also accounts for reflected radiation and the horizon brightening. Subsequently, total heat gained by thermal radiation is obtained through Equation (9) the total radiation heat flux is multiplied by the collector area and the shape factor of said collectors.
G T = [ G B + ( G D A S ) ] R B + [ G D ( 1 A S ) ( 1 c o s ( β ) 2 ) ] [ 1 + ( G B ( G B + G D ) ) s e n 3 ( β 2 ) ] + ( G B + G D ) ρ S ( 1 c o s ( β ) 2 )
R B = cos ( θ ) cos ( ϕ )
A S = G B G o s
Q ˙ σ , t = ( G T A c o l l ) χ F
Since it is assumed that, the evaporation temperature is lower than the air temperature the collector gains heat through convection mechanism, therefore the balance of energy exchange exerted upon the solar collection field presented through Equation (10) results as follows:
Q ˙ S C F = Q ˙ σ , t + Q ˙ h , t

2.1.2. Thermodynamic Cycle Model

To establish the conditions under which the DXSAHP will work, evaporation and condensation temperatures have to be assigned, to achieve that, certain ranges are suggested given the type of heat exchanger and the fluid that is in contact with. For the flat plate solar collectors Franco-Lijó [48] proposes a difference between the working fluid and ambient temperature ranging from 8 °C to 12 °C. For the condenser, Danfoss Manufacturing [49] states that for a heat exchanger being cooled with water, the temperature difference between the former and the refrigerant should range around 10 and 20 °C preferably near the latter. A note is worth, remarking that these are just ranges proposed by researchers and manufacturers and that they are taken as a first approximation by this model, given the fact that are based on standards and evaluations done specifically for refrigeration applications.
Furthermore, it is considered of crucial importance by the authors of this study, to explain that even though the heat pump cycle is similar to a refrigeration cycle, the application is not the same, so a difference between the magnitudes of certain parameters is sure to arise, so the previous references are suggested as a starting point.
Δ T E = T T E
Δ T C = T C + T O
Knowing that all the properties can be determined through a variety of methods, i.e., steam tables; pressure, enthalpy and diverse data regarding the processes involved in the heat pump cycle (1 through 4 as presented in Figure 1), were obtained and are stated as a function of the operation temperatures of the DXSAHP previously determined through Equations (11) and (12).
For the purpose of this paper, the properties of the refrigerant, air and water such as enthalpy, entropy, pressures, densities, viscosities, thermal conductivities, Prandtl numbers and temperatures were calculated using Engineering Equation Solver, EES, [50]. Said properties are given in the form of in-built functions and are called by the program for computation procedures, namely, heat rate coefficient calculations, heat rate on both heat exchangers, work input in the compressor, among others.
Having determined the properties of the working fluid on every process involved and considering a steady-state cyclic and normal operation, without solar assistance, of the DXSAHP, the energy input of the cycle can be expressed in terms of the enthalpy change as following
m ˙ r e f = V D ( N 60 ) ρ r e f
h ,   s ,   P f ( T 1 4 )
Q ˙ C = m ˙ r e f ( h 3 h 2 )
Q ˙ E = m ˙ r e f ( h 1 h 4 )
W ˙ C o m p = η C o m p m ˙ r e f ( h 2 h 1 )
The relation between the heat transferred to the water and the work input necessary to perform said task, is known as coefficient of performance, COP, shown in Equation (18)
COP = Q ˙ C W ˙ C o m p
Accounting for the solar assistance, a new value for the evaporation heat can be obtained through the addition of the total heat gained by the solar collection field ( Q ˙ S C F ), as shown in Equation (19), and through an assessment based on the first law of thermodynamics a new value for condensation heat is also found.
Q ˙ E S A = Q ˙ E + Q ˙ S C F
Q ˙ C S A = Q ˙ E S A + W ˙ C o m p
Given the change in the magnitude of the condensation heat due to solar assistance a new COP is available, which allows to quantify the improvement in the performance of the heat pump between each condition of operation.
COP = Q ˙ c S A W ˙ C o m p

2.1.3. Thermal Storage Capacity Model

Since the purpose of the DXSAHP is water heating, it is necessary to determine the total energy demand which is the sum of two thermal loads; the heat required to rise the temperature of a certain volume of water to a desired outlet condition and the heat leaked from inside the TSU to the surroundings. The former is quantified using Equation (23) based on the designated worktime, the temperature difference between the environment and the desired output and the quantity of water that is to be heated, while the latter is determined through Equations (24)–(29), which in terms of Fourier’s law, determine the magnitude of each thermal resistance present in every layer that covers the TSU as a function of the thickness of said layer, the thermal conductivity of the material the layer is made of and the characteristic length of the TSU.
As shown in Figure 4, in this analysis, a standard cylindrical three-layered TSU configuration was proposed, comprised by an internal AISI 304 food-grade stainless steel sheet in direct contact with the water, Equation (24), a layer of polyurethane, as insulation, Equation (25), and an external AISI 304 stainless steel sheet that covers the outside of the tank, Equation (26). Particularly, Equation (27) models the thermal resistance due to the air surrounding the TSU, where the heat transfer coefficient, h ¯ T S U , is determined following the same procedure as the collectors, where instead of a flat plate a vertical cylinder geometry is employed to determine the Nusselt number by means of the proper correlation.
m w = V w ρ w , T i
q ˙ V = m w C p w ( T o T i ) Δ t
R i n t = ln ( r 2 r 1 ) 2 π · L c · k s t e e l
R i n s = ln ( r 3 r 2 ) 2 π · L c · k i n s u l a t i o n
R e x t = ln ( r 4 r 3 ) 2 π · L c · k s t e e l
R = 1 2 π · L c · r 4 · h ¯ T S U
R T = i n R = R i n t + R i n s + R e x t + R
q ˙ L = ( T s T ) R T
q ˙ T = q ˙ V + q ˙ L

3. Results

Through experimental data provided by several experiments conducted by different researches as well as the atmospheric and geographic conditions under which their prototypes were working, a comparison was made between the data from said experiments and the results yielded by the model proposed in this paper, and the following results were obtained.

3.1. Performance on Characteristic Days

Figure 5 shows the experiment conducted by Moreno-Rodriguez [51] in Madrid during a year, a DXSAHP that worked 4 h per day. It was comprised by 2 to 8 bare flat-plate solar collectors installed in a parallel arrangement oriented to the south with an inclination of 40.4° with refrigerant R134a circulating through them; a TSU with a capacity of 300 liters and a desired water outlet temperature of 51 °C. From the test, data from 5 characteristic days (maximum air temperature, maximum radiation, maximum wind speed and its combinations) was reported and is used to validate the model proposed in this paper.

3.2. Seasonal Performance

In order to assess the adjustment of the model proposed under different environmental and operation conditions, the output data of the model proposed is also compared to the results published by Li et al. [52]. They tested the seasonal performance of a DXSAHP with a setup consisting of 4 aluminum bare flat-plate solar collectors with a 31.22° angle facing south, with a total area of 4.20 m2, R-22 as a working fluid, a 150 L TSU and a desired outlet water temperature of 50 °C working approximately 2 h a day. The testing of the model is shown in Figure 6.

3.3. Continuous Operation

In addition, the validation of the model proposed is done comparing the results it yielded with the numerical data obtained from Figure 3 of the work presented by Cutic et al. [19], through the employment of a graph digitizer [53], in order to evaluate the adjustment of the results of the model proposed on a continuous operation scheme.
The test was conducted on May 19, 2012, in Zagreb, with a mobile DXSAHP, consisting of 1 solar collector made of copper, with an inclination of 40.5° and R134a as working fluid. The TSU had a capacity of 300 liters and an outlet water temperature of 48 °C. Figure 7 shows the results provided by the model and the comparison regarding the 4 h of continuous operation of the DXSAHP.

3.4. Model Overview

It is noteworthy to state that, for every run of the programmed model, 33 input variables are required and while most of these were provided in the papers discussed previously [9,15,16] the remaining ones need to be proposed. Therefore, information such as relative humidity, R H , wind speed, U and atmospheric pressure, P a t m , as well as the make model and geometry of the compressor and the TSU, among other data, was researched and included, or proposed using recommendations, industry standards and common mean values. The aforementioned data was used to compute relevant parameters such as dew point temperature, T d p , diffuse radiation, G D , the convection heat transfer effects exerted upon the surface of the solar collectors, Q ˙ h , S C F , and the TSU, Q ˙ h , T S U , refrigerant mass flow, m ˙ R e f and consequentially the power input, W ˙ C , as well as the heat flow absorbed, Q ˙ E , and yielded, Q ˙ C , by the heat pump.
The discrepancies concerning the adjustment of the analytical model, are ascribed to several facts, including that, the thermodynamic modelling does not take into consideration the full extent of the irreversibilities presented in the compression process; neglects both the pressure drop through the pipes and due to accessories; does not consider the heat leaked to the surroundings, among others. Regarding specifically the condensation heat rate data output, is it understood that in a thermodynamic cycle every process is taking place simultaneously, therefore, the condensation heat is a result of both: the aforementioned assumptions and the heat gained through the solar collection field, which is modelled under the assumption that the collectors are black bodies.
From the previous assessment, it is seen that the results of the model fit, within an acceptable range, the experimental measurements shown. The testing reveals that the output presents a maximum relative error of 20% for the variables compared, Q ˙ C and W ˙ C , therefore, the adjustment of the model is considered adequate regarding the empirical dataset analyzed.

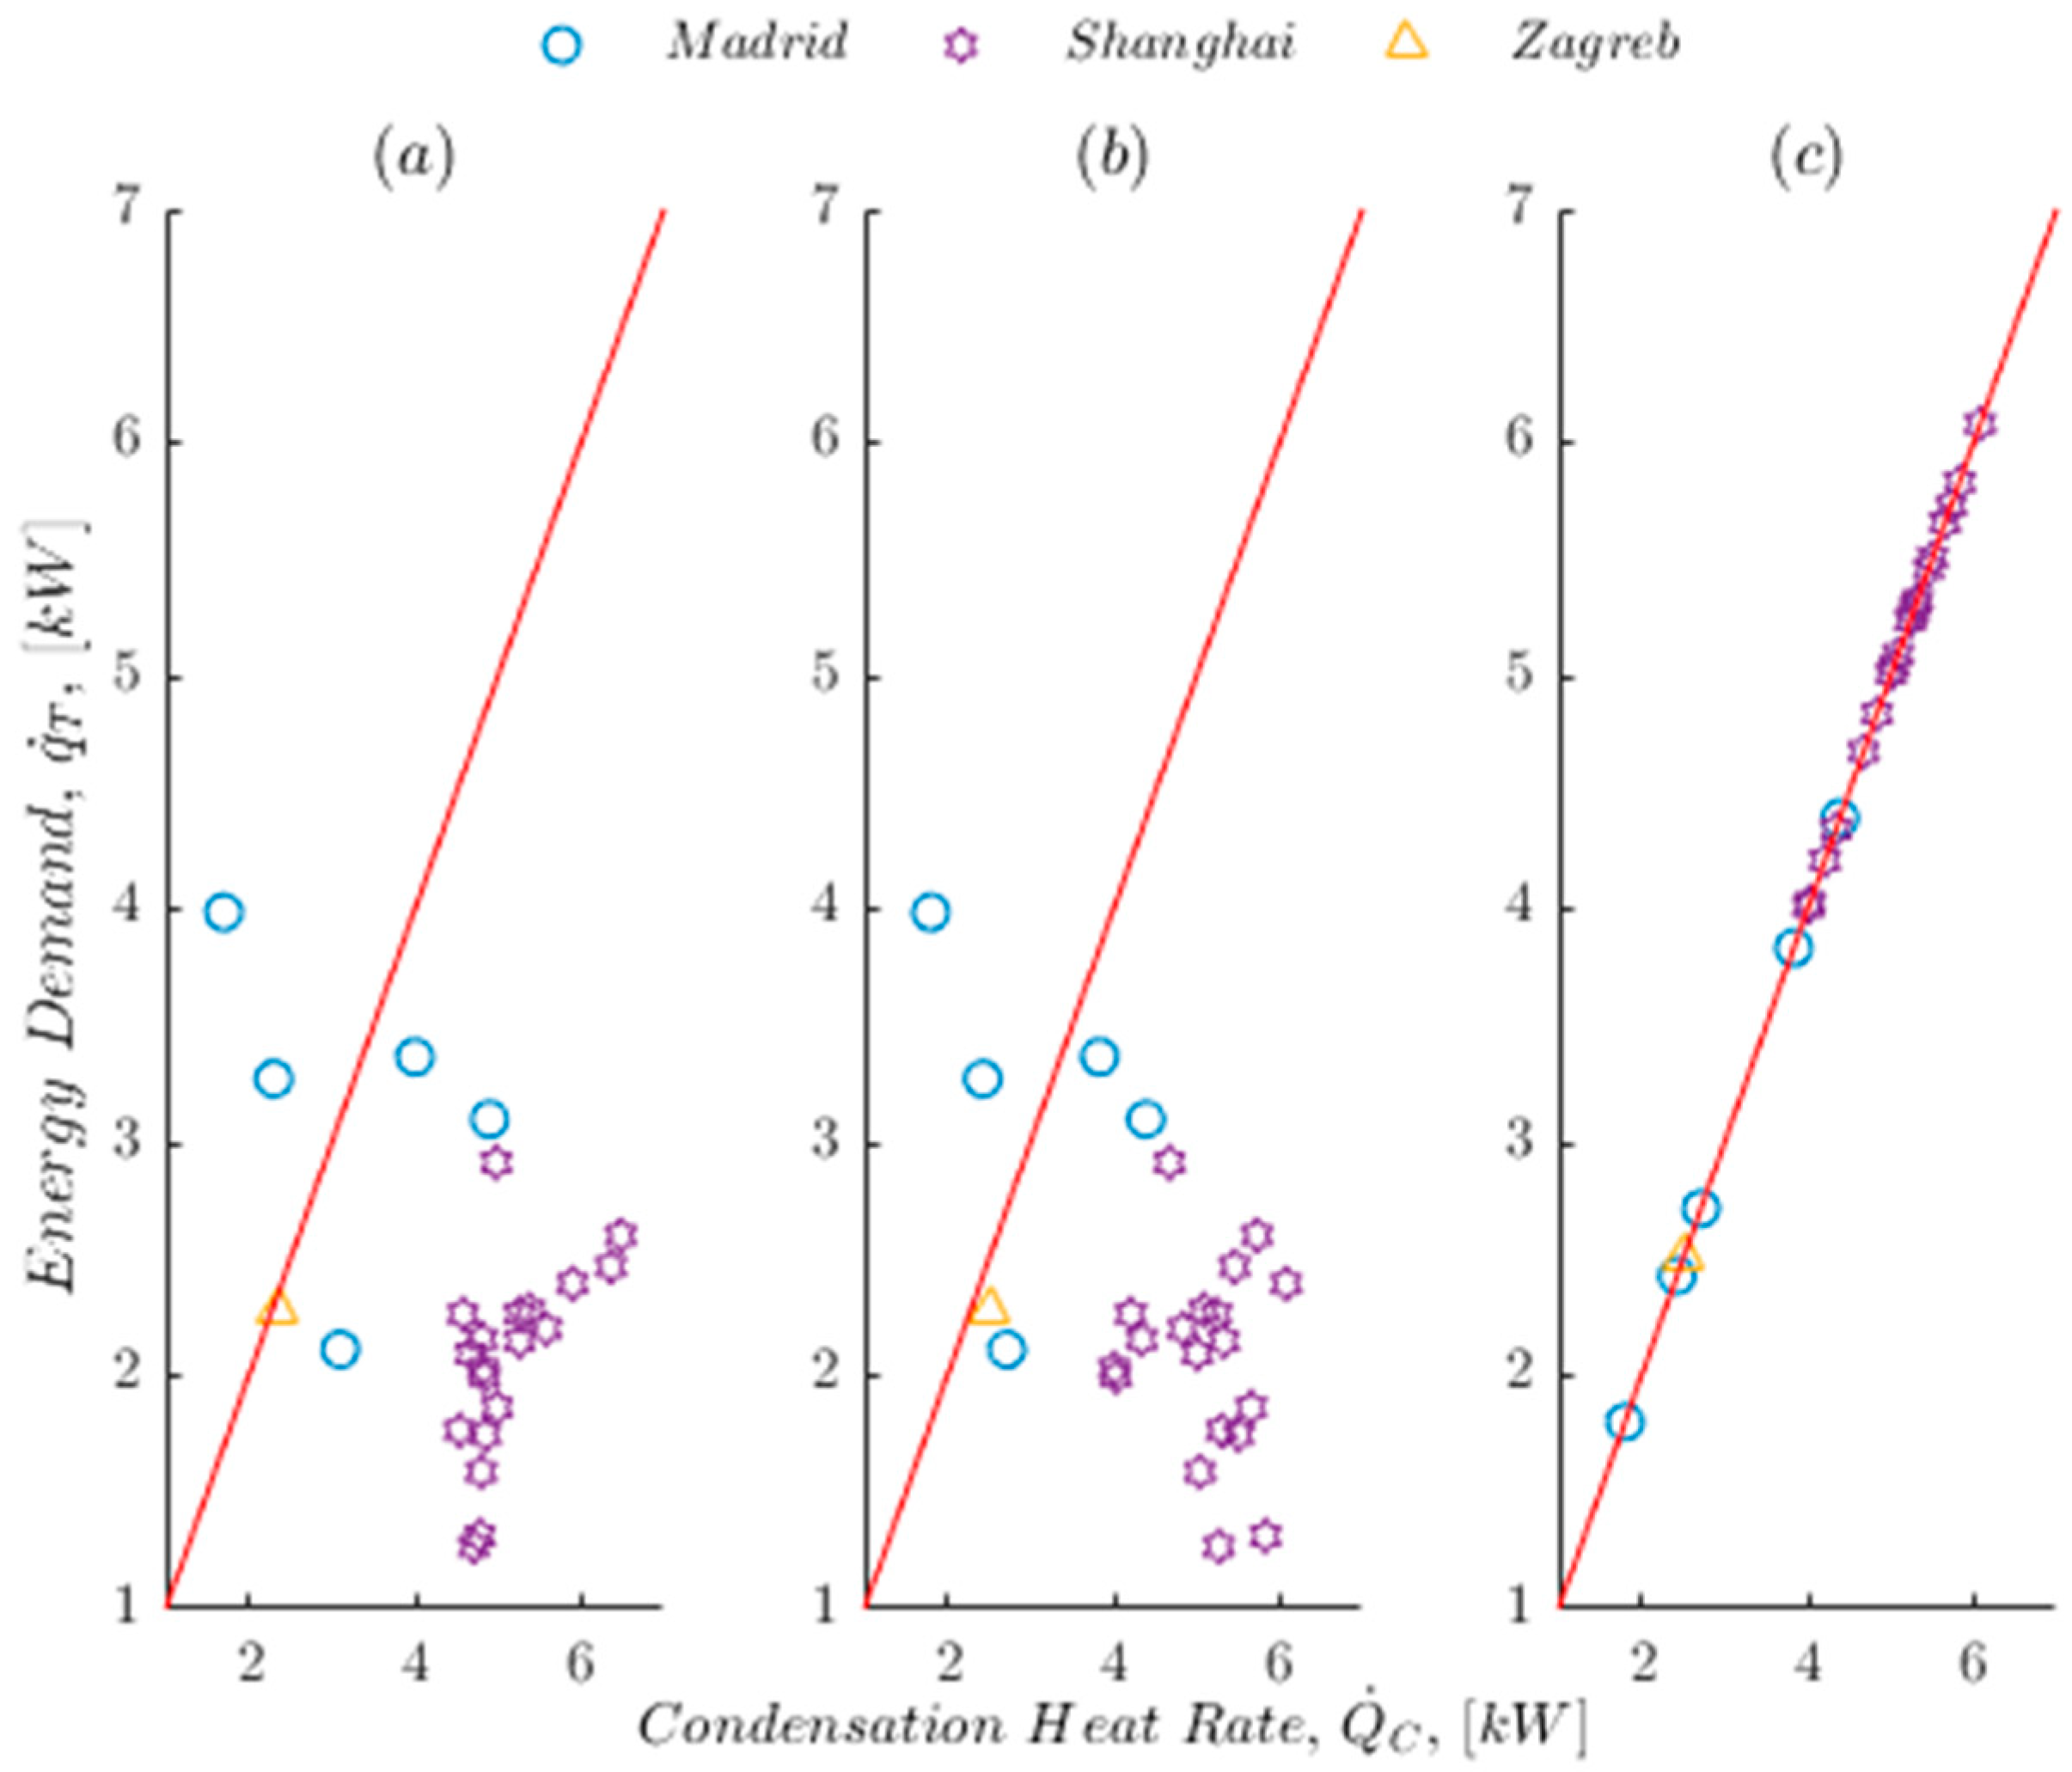
3.5. Statistical Analysis

Given all the collected data, it is considered important to understand the relations between both experimental and analytical samples. To accomplish this, a statistical analysis is employed, which provides a set of parameters that facilitates the data interpretation of the sample in order to assess the results obtained through the proposed analytical model.
In this case, it is known that both samples (experiment and model data sets) presented in previous sections, come from a larger population, so inferential statistics are applied. Through a null hypothesis significance testing (NHST); designation of a confidence interval (CI) through a significance level α and by means of a sample comparison, the statistic relation is quantified, in terms of the difference of means.
In order to understand the level of adjustment between experimental and analytical data, a descriptive statistics analysis and a hypothesis testing are conducted using STATGRAPHICS software (18.1.01, Statpoint Technologies, Inc., Fauquier County, VA, USA) [54].
As seen in Table 1, the ratio of variance σ e 2 / σ m 2 between the samples (experimental and analytical) for each case and variable is different than one, therefore a non-pooled test is conducted, and the following hypothesis is stated to determine whether there are statistically significant differences between the two samples:
H 0 : μ e x μ m = 0
H a : μ e x μ m 0
In this case, the test was constructed to determine whether the difference between the means of the corresponding samples equals 0, Equation (31), versus the alternative hypothesis that the differences does not equal 0, Equation (32), given a significance level of α = 0.05 , which corresponds to a 95% CI.
Given the information on Table 1, it is seen that μ e x μ m is very close to 0 and that the lower and upper bounds of the mean contain the value 0. It is of particular interest and the base of the hypothesis testing that the P-Value for every variable is higher than α , thus the null hypothesis H 0 is accepted, which indicates that there is a strong statistical relation between analytical and experimental data inside the limits defined by the 95% CI.
The results provided by the hypothesis testing are considered an adequate approximation, given the quantity of data the analytical model proposed has to process and the assumptions under which said model is working.

3.6. Considerations Regarding the Thermal Capacity of the Heat Pump

During the development of this model the relationship between two variables was found of particular interest, therefore the concept of thermal capacity, τ C , was developed. The thermal capacity, Equation (33), establishes the ratio between the capability the heat pump has to transfer energy to a given volume of product and the minimal thermal energy said volume requires to reach and maintain the desired outlet temperature. A minimum thermal capacity of 1 is desired under any circumstance throughout the selected time lapse, as it asserts that the heat pump will work with a satisfactory performance, absorbing more heat from the environment than the required by the water, even on days with disadvantageous conditions such as low ambient temperature or low normal radiation.
Being the main purpose of this model to establish a guideline regarding the design of heat pumps, this variable is considered conditional. It allows the decision maker, designer or user to assess the theoretical performance of a heat pump for the specific geographic and atmospheric conditions under which said thermal machine would be working, given a previous record of such.
τ C = Q ˙ c q ˙ T τ C 1
In order to illustrate the potential application of this suggested guideline, the analysis is implemented to the experimental data set, reported by Cutic et al. In this case, COP reports an average of 5 during the experiment. As stated above, this coefficient, only shows that for every kW of work the heat pump delivers 5 kW of heat, this particularly elevated magnitude is attributed to the additional energy provided by the sun through thermal radiation. However, COP does not entirely quantify the effectiveness of the heat pump as a whole, therefore τ C is computed.
Table 2 shows the respective increment of τ C along with a decrease on the difference between the condensation heat rate and thermal load ( Q ˙ C q ˙ T ) as time passes. It is seen that Q ˙ C q ˙ T reaches a positive value after the designated time, this fact is associated to the water outlet temperature chosen, 48 °C, being surpassed, with the sum of the condensation heat, Q ˙ C , corroborating that the demand is met after the designated work time with Q ˙ C = 23.41 > q ˙ T = 22.18 .
It is also presented at the end of the operation that τ C reaches a value of 1.81. This means that, at this point in time, the heat transferred to the water from the condenser is 81% higher than the thermal load required and after 4 h and 5 min, an outlet temperature of 48.29 °C is achieved. Additionally, it is seen that COP remains steady during the operation of the HP, mainly because both the condensation heat rate and the compression power input, do not present extreme variations. On the other hand, τ C increases as time passes, until it reaches a value higher than 1 indicating that the desired conditions have been met.
Alternatively, a mean thermal capacity, τ C ¯ , can be computed when the specific measures in a shorter time step are not available. Table 3 illustrates this concept, with a mean daily condensation heat, Q ˙ C ¯ , obtained through Table 2.
The total thermal load is calculated with different work times (1–5 h) which results in the minimal condensation heat rate needed to reach the desired outlet temperature. It is seen that said energy output is achieved only after the heat pump has worked during 5 h. The discrepancy between both implementations (4.1 h vs. 5 h) is accredited to the fact that this approach does not account for the fluctuations in the magnitude of the heat yielded by the condenser during the operation, with it varying from 1.946 kW to 2.796 kW, and shorter time steps are always suggested to minimize this effect. However, although robust by limiting the adjustment of the calculation of τ C to a full-hour basis due to the use of a mean daily condensation heat rate, Q ˙ C ¯ , this procedure is still representative of the operational conditions the heat pump is working under.
Table 4 compares the heat flow, Q ˙ C , delivered by the condenser, to the energy demanded by the product, q ˙ T , to assess the performance in terms of the thermal capacity of the heat pump. It is shown that the DXSAHP met the energy demand for every test conducted even in a cool night, with an overall seasonal average τ C = 2.57 , which is mainly attributed to the lower capacity of the TSU compared to the other cases studied and the relatively high average normal beam radiation and ambient temperature.
Additionally it is seen that τ C > 1 is achieved for all tests conducted, therefore, it is considered that the aforementioned set of conditions are particularly advantageous for the performance of the heat pump.
Upon further examination of the data obtained in Section 3.1, it is shown that even though the heat pump presents a COP greater than 1 for every test conducted it is considered that the DXSAHP in Madrid is performing lower than average. This is associated to the fact that despite the heat source, heat pumps based on a vapor compression cycle deliver around 3 to 4 kW of thermal energy for every kW of electrical input as stated by Garcia-Gutiérrez et al. [55]. While evaluating vapor compression cycles under this criteria is a common practice (i.e., refrigeration applications), for heat pump cycles, this particular parameter does not quantify completely the overall performance of the heat pump. Said scale setting lacks a point of reference and therefore, considered adequate to evaluate also the capacity the heat pump has, to meet the demand the final product requires in terms of the thermal load needed to reach the desired outlet temperature.
The computation of τ C for this cycle is presented in Table 5. It is seen that for 3 of the 5 tests, the DXSAHP provides more than the minimal energy needed to heat the volume of water contained in the TSU because of the high normal beam radiation present or the elevated ambient temperature. On the other hand, the remaining 2 tests did not achieve the required capacity due to low radiation conditions (night time operation) and low air temperature, denoting that for this specific configuration of heat pump the energy provided by the sun is essential to reach the desired outlet hot water temperature.
As general observation of Table 2, Table 3, Table 4 and Table 5, it is shown that τ C provides better results when analyzing accurate and specific data, and that with a shorter time step the level of accuracy of this parameter increases.
Having stated this, τ C 1 , does not necessarily mean that a DXSAHP cannot be installed and operated in said location (<1) or that its performance is acceptable (>1), but rather that, according to the environmental conditions on the region, one or more design parameters need to be changed in order for the DXSAHP to perform optimally. An example of this is the heat pump installed in Shanghai, that has a mean thermal capacity of 2.57, delivers more than twice the energy required by the volume of product and therefore it can either heat said volume faster, heat an even greater volume of water or employ less collectors to heat 150 liters, in the same 2 h of operation.
Given the aforementioned statement, the analysis of the performance of the DXSAHP tested in Zagreb, shown in Table 2 and Table 3, is of particular interest in this study, due to it reporting specific measures regarding a continuous operation. It is seen that as time passes both the air temperature and the normal solar radiation increase and therefore the thermal load q ˙ T decreases and the condensation heat rate Q ˙ c increases. The increase reported on τ C corroborates the correct decision of imposing a 4–5 h work time (depending on the approach) and is considered the most optimal test conducted and most well dimensioned test rig employed of all the data discussed in this paper.
It is seen that even though the COP is higher than average for most of the tests conducted, the evaluation of τ C complements the information given by COP and both provide a better understanding of the overall performance of the heat pump during different operation schemes.
After analyzing the information given by this heat ratio, is up to the decision maker to accept or not such operation conditions. As stated before, the condensation heat rate is a result of the performance of the thermodynamic cycle. In order to decrease the work time and thus the energy consumption of the compressor, several changes can be made, such as increasing the total heat transfer area, geometry or overall configuration of the evaporator, changing the working fluid, changing the energy source, decreasing the volume of product to be heated, among others.
For energy saving purposes, assessing the performance of the heat pump under various combinations of the previously mentioned changes is suggested and thus, τ C is considered a starting point for the implementation of a multiple-objective optimization technique.

3.7. Optimization Implementation

In order to optimize the performance of the DXSAHP system and given its relatively simple implementation, an stochastic optimization method known as evolutionary computing is employed [56,57]. For this study, a genetic algorithm, GA, is selected and applied [58] in order to find the best possible combination of factors to further enhance the perfomance of the HP based on the information obtained through the thermal capacity. Table 6, shows the main components of the algorithm and their conditions are defined as follows:
This technique employs the optimum operation, O 2 , (Ec. 34), based on the thermal capacity, as a fitness function which is then minimized, to determine how close the design is to the optimal solution. The GA optimization is then implemented to the model proposed in this paper and the following results are obtained.
O 2 = ( τ C 1 ) 2 0 ,    τ C = 1
Based on this approach Figure 8 is presented, where a comparison between the experimental results and the modelling of the DXSAHP based on a genetic algorithm is carried out. It is seen that, when employing the experimental datasets reported, the output of GA-based modelling describes an analogous behavior regarding said datasets, which makes this a particularly adequate and efficient technique when analyzing these systems, given a relatively high adaptability to the fluctuations of the atmospheric and operation conditions. Furthermore, the optimization implementation is shown, 8c, it can be seen that because of the particular fitness function proposed, the results converge and an output with a more than acceptable adjustment is achieved.
The results of the optimization are compared to the ones obtained through thermal capacity and Table 7 is presented. First, it is seen that the adjustment presented in Figure 8c, due to the conditions defined at the beginning of the implementation, is ascribed to the lower magintude of the residuals. Furthermore, the effects of the implementation of the GA are seen by means of the worktime optimization, which leads to three main highlights, beginning with the confirmation that, as stated before, the experimetal setup built in Zagreb is the most well-designed, given that the optimization yields a worktime of 4.5 h, which equals to a 9 and 10% difference with the real and proposed worktime respectively. Additionally, it is corroborated that the test rig built in Shanghai is capable of heating the 150 liters contained in the TSU, at the most, in just over an hour, which amounts to an average worktime decrease of 59%.
Finally, since the implementation conducted returns the configuration with both the minimal quantity of collectors and the minimal work time possible to achieve the outlet conditions, is it shown that the Madrid installation is the one that required several changes to optimize its performance. In this instance, the tests that reached the desired hot water temperature, resulted in a decrease in both the number of collectors and the worktime, however, the second and fifth test did not achieved said condition, therefore a worktime increase is required corresponding to a 35 and 120% respectively, which confirms that the combination of a lower-to-none radiation condition with a lower ambient temperature affects severely the performance of the heat pump. It is important to mention that for these instances the number of collectors can be increased to reduce the worktime, but that involves accounting for implicit design factors such as the increase in the presure drop in the collectors and the quantity of refrigerant, to name a few, as well as external factors such as space availability and installation costs.
In addition to the previous analysis the optimization includes the selection of the refrigerant. Figure 9 and Figure 10 illustrate the effect the change of the working fluid has on both the condensation heat rate, Q ˙ C , and the compression power input, W ˙ C o m p , and from this COP can be computed in order to select the refrigerant the provides a more efficient performance.
Table 8 shows the magnitude of COP for every test conducted where it is seen that for the Madrid setup where they employed R134a as working fluid, the change of refrigerant to R407C increases COP by 27%, while the other 2 does not affect the overall performance of the heat pump, with an average difference of 9% for the R404A and 1.7% for R410A. Regarding the test rig used in Shanghai, it is seen that the R134a refrigerant increases 46% the COP compared to R22, followed by the R407C with a 32% increase and the R404A with 17%, while the R410A, which behaves similarly to R22, yields an overall 3% decrease on performance.
Moreover, for the experimental installation built in Zagreb, the best refrigerant was chosen, corroborating one more time that it was the best design proposed given that the R404A, R407C and R410A decrease the performance of the heat pump by 30, 20 and 34% respectively.
Finally, as an overall observation it is seen that there is not a particular working fluid that provides the best performance for all circumstances, since its effectiveness is subject to both the design of the thermal machine and atmospheric conditions under which it is working, therefore an optimization evaluation is always suggested.

4. Conclusions

An analytical model to evaluate the performance of a DXSAHP under a given environmental condition was developed. The results are compared to the experimental data presented and a maximum relative error of 20% for every output variable is obtained. To corroborate this, an inferential statistical analysis was employed where the null hypothesis was accepted given that for all the conducted tests the P-Value is greater than 0.05 concluding that there exists no significant statistical difference between the analytical and experimental data within the 95% CI designated, based on this, the analytical model proposed yields acceptable results in order to evaluate the potential installation and operation of a DXSAHP under determinate environmental and geographical conditions.
Nonetheless, understanding that the weather conditions vary greatly depending on the region and that the performance of the heat pump is strongly related to said conditions, it was found by the authors that the parameters, which affect the most the adjustment of the model, are the following:
  • The temperature difference in both heat exchangers, Δ T c and Δ T e , which needs to be adjusted depending on the specific regional weather conditions as well as for the time of the day the heat pump is working, lowering said temperature gradients considerably during nighttime operation or non-radiation conditions.
  • The global efficiency of the compressor, η c , which drops almost by half during cold nights given the fact that more collectors are needed to achieve the desired outlet temperature which consequentially increases the power input and the heat leaked during the compression stage.
  • The shape factor, χ F , which compensates the magnitude of the area of the solar collection field given the fact that the collectors are modelled as a thin layer of fluid between two flat plates, instead of a pipe embedded in a flat plate.
Given the information stated above it is concluded that an extensive experimental analysis is needed to reach a better level of adjustment in order to eliminate or at least minimize the previously mentioned limitations. To achieve this, the recording of the performance not only on distinctive days or a season, but also during a longer time lapse with a smaller time step is suggested.
In addition to the model presented in this paper, the thermal capacity of the heat pump, τ C , is introduced, which complements the information provided by COP. Moreover, τ C acts as a starting point for the implementation of a multiple-objective optimization technique in order for the heat pump to perform adequately while satisfying the energy demand of the product. It was also found that this parameter, could be applied to any configuration of heat pump regardless the energy source and for both space and water heating applications.
In order to test the potential application of τ C this parameter was then used as a fitness function on a genetic algorithm optimization and applied to all the experimental data reported, it was seen that the optimization found the optimal configuration of the DXSAHP by decreasing the number of collectors and the worktime as well as selecting the appropriate working fluid. Nonetheless, this approach has to be modified to include as many variables as possible, such as the capacity of the TSU, the pressure drops in the collectors, and the mass of refrigerant, among others. In addition, the authors suggest as a next step, the integration of the GA with a neural network in order to increase the adjustment and to distribute the computational work load.

Author Contributions

J.E.D.L.R. and I.C.M. conceived and designed the mathematical thermal model presented; J.E.D.L.R. performed the runs in the programmed model and analyzed the data; I.C.M. contributed with techniques and analysis tools; J.E.D.L.R. and I.C.M. wrote the paper.

Funding

This research was funded by the Instituto Politécnico Nacional and the Consejo Nacional de Ciencia y Tecnología, México.

Acknowledgments

The authors of this paper are particularly grateful to Moreno-Rodríguez Ph.D. from the Carlos III University of Madrid for the contributions made and the information provided.

Conflicts of Interest

The authors declare no conflict of interest. The founding sponsors had a role in the decision to publish the results, but not in the design of the study; in the collection, analyses, or interpretation of data and in the writing of the manuscript.

Nomenclature

A c o l l collector area, m2
A S anisotropic index
C p specific heat, kJ/kg·°C
G solar radiation heat flux, kW/m2
H hypothesis
h specific enthalpy, kJ/kg
h ¯ convection heat transfer coefficient, kW/m2·°C
L c characteristic length, m
k thermal conductivity, kW/m·°C
m ˙ mass flow, kg/s
m w mass of water, kg
N rotational speed, rpm
P pressure, kPa
Q ˙ heat transfer rate, kW
q ˙ energy demand, kW
R thermal resistance, °C/kW
R B tilt factor
R H relative humidity
r radius, m
s entropy, kJ/kg·°C
T temperature, °C
U speed, m/s
V D volumetric displacement, m3/s
V volume, m3
W ˙ electrical power input to compressor, kW
Greek letters
α significance level
β inclination of the flat plate, °
Δ T temperature gradient, °C
Δ t work time, s
ε s k y emissivity of sky
η efficiency
θ incidence angle, °
μ mean
ρ density, kg/m3
σ standard deviation
σ 2 variance
σ R Stefan-Boltzmann coefficient, kW/m2·K4
τ C thermal capacity of the heat pump
ϕ complementary altitude angle, °
χ F shape factor
Non-dimensional numbers
Gr Grashof number
Nu ¯ average Nusselt number
Pr Prandtl number
Ra Raleigh number
Re L Reynolds number
Subscripts
0null
1,2,3,4process, layer
air/wind
aalternate
atmatmospheric
Bbeam
Ccondensation
C-SAcondensation under solar assistance
CompCompression
dpdew point
Ddiffuse
Eevaporation
E-SAevaporation under solar assistance
exexperiment
extexterior
hconvection
h, infconvection upon the inferior surface
h, supconvection upon the superior surface
h, ttotal convection
iinlet
insinsulation
intinterior
Lleaked
mmodel
n, infnatural on the inferior surface
n, supnatural on the superior surface
ooutlet
optoptimum
osouter space
refrefrigerant
ssurface
SCFsolar collection field
Ttotal
Vvolume of product
wwater
σ, ttotal radiation
Acronyms
CI confidence interval
COP coefficient of performance
DXSAHP direct expansion solar-assisted heat pump
GAgenetic algorithm
HPheat pump
NHST null hypothesis significance test
TSU thermal storage unit

References

  1. Ibrahim, O.; Fardoun, F.; Younes, R.; Louahlia-Gualous, H. Review of Water Heating Systems: General Selection Approach Based on Energy and Environment Aspects. Build. Environ. 2014, 74, 259–286. [Google Scholar] [CrossRef]
  2. Sporn, P.; Ambrose, E.R. The Heat Pump and Solar Energy. In Proceedings of the World Symposium on Applied Solar Energy, Phoenix, AZ, USA, 1–5 November 1955. [Google Scholar]
  3. Chaturvedi, S.K.; Chiang, Y.F.; Roberts, A. Analysis of a Two-Phase Flow Solar Collectors with Application to Heat Pumps. ASME 1980, 104, 358–365. [Google Scholar] [CrossRef]
  4. Chaturvedi, S.K.; Shen, J.Y. Thermal Performance of a Direct Expansion Solar-Assisted Heat Pump. Sol. Energy 1984, 33, 155–162. [Google Scholar] [CrossRef]
  5. Chaturvedi, S.K.; Abazeri, M. Transient Simulation of a Capacity-Modulated Direct Expansion Solar-Assisted Heat Pump. Sol. Energy 1987, 39, 421–428. [Google Scholar] [CrossRef]
  6. Aziz, W.; Chaturvedi, S.K.; Kheireddine, A. Thermodynamic Analysis of Two-Component, Two-Phase Flow in Solar Collectors with Application to a Direct Expansion Solar-Assisted Heat Pump. Energy 1999, 24, 247–259. [Google Scholar] [CrossRef]
  7. Ito, S.; Miura, N.; Wang, K. Performance of a Heat Pump using Direct Expansion Solar Collectors. Sol. Energy 1999, 65, 189–196. [Google Scholar] [CrossRef]
  8. Tabatabaei, S.A.; Thilakarathne, D.J.; Treur, J. An Analytical Model for Mathematical Analysis of Smart Daily Energy Management for Air-to-Water Heat Pumps. Energy Procedia 2014, 50, 589–596. [Google Scholar] [CrossRef]
  9. Zhu, M.; Xie, H.; Zhang, B.; Guan, X. The Characteristics of the Evaporator/Collector for Direct Expansion Solar Assisted Heat Pump System. J. Power Energy Eng. 2013, 1, 73–76. [Google Scholar] [CrossRef]
  10. Kuang, Y.H.; Sumathy, K.; Wang, R.Z. Study on a Direct-Expansion Solar-Assisted Heat Pump. Int. J. Energy Res. 2003, 27, 531–548. [Google Scholar] [CrossRef]
  11. Anderson, T.N.; Morrison, G.L.; Behnia, M. Experimental Analysis of a Solar-Boosted Heat Pump Water Heater with Integral Condenser. In Proceedings of the 40th Annual Conference of the Australian and New Zealand Solar Energy Society, Newcastle, Australia, 27–29 November 2002. [Google Scholar]
  12. Hawlader, M.N.; Chou, S.K.; Ullah, M.Z. The Performance of a Solar Assisted Heat Pump Water Heating System. Appl. Therm. Eng. 2001, 21, 1049–1065. [Google Scholar] [CrossRef]
  13. Mei, V.C.; Baxter, V.D.; Lamb. Low Cost Heat Pump Water Heater (HPWH). In Proceedings of the International Refrigeration and Air Conditioning Conference, West Lafayette, IN, USA, 17–20 July 2006. [Google Scholar]
  14. Moreno-Rodríguez, A. Experimental Validation of a Theoretical Model for a Direct Expansion Solar-Assisted Heat Pump Applied to Heating. Energy 2013, 60, 242–253. [Google Scholar] [CrossRef]
  15. Soldo, V.; Curko, T.; Balen, I. Thermal Performance of a Direct Expansion Solar-Assisted Heat Pump. In Proceedings of the International Refrigeration and Air Conditioning Conference, West Lafayette, IN, USA, 12–15 July 2004. [Google Scholar]
  16. Tagliafico, L.A.; Scarpa, F.; Valsuani, F. Direct Expansion Solar-Assisted Heat Pumps—A Clean Steady State Approach for Overall Performnace Analysis. Appl. Therm. Eng. 2014, 66, 216–226. [Google Scholar] [CrossRef]
  17. Omojaro, P.; Breitkopf, C. Direct Expansion Solar-Assisted Heat Pumps: A Review of Applications and Recent Research. Renew. Sustain. Energy Rev. 2013, 22, 33–45. [Google Scholar] [CrossRef]
  18. Chaturvedi, S.K.; Abdel-Salam, T.M.; Sreedharan, S.S.; Gorozabel, F.B. Two-Stage Direct Expansion Solar-Assisted Heat Pump for High Temperature Applications. Appl. Therm. Eng. 2009, 29, 2093–2099. [Google Scholar] [CrossRef]
  19. Cutic, T.; Pasanec, J.; Baleta, J.; Soldo, V.; Curko, T. Mobile Solar-Assisted Heat Pump with Direct Expansion. In Proceedings of the EuroSun 2012—ISES Europe Solar Conference, Rijeka, Croatia, 18–20 September 2012. [Google Scholar]
  20. Morrison, G.L. Simulation of Packaged Solar Heat Pump Water Heaters. Sol. Energy 1994, 53, 149–257. [Google Scholar] [CrossRef]
  21. Mehdaoui, F.; Hazami, M.; Naili, N.; Farhat, A. Energetic performances of an Optimized Passive Solar Heating Prototype used for Tunisian Buildings Air Heating Applications. Energy Convers. Manag. 2014, 87, 285–296. [Google Scholar] [CrossRef]
  22. Bridgeman, A.G. Experimental Analysis of an Indirect Solar Assisted Heat Pump for Domestic Water Heating. Ph.D. Thesis, Queen’s University, Kinsgton, ON, Canada, 2010. [Google Scholar]
  23. DeGrove, J.M. The Integration of Heat Resources in a Solar Thermal Heat Pump Hydronic System. Ph.D. Thesis, Purdue University, West Lafayette, IN, USA, 2015. [Google Scholar]
  24. Khalaf, K. Experimental Characterization and Modelling of a Heat Pump Water Heater. Ph.D. Thesis, Carleton University, Ottawa, ON, Canada, 2017. [Google Scholar]
  25. Fu, Y. Investigation of Solar Assisted Heat Pump System Integrated with High Rise Residential Building. Ph.D. Thesis, University of Nottingham, Nottingham, UK, 2014. [Google Scholar]
  26. Kamel, R.S. Combined Building Integrated Photovoltaic-Thermal Collector with Air Source Heat Pump for Cold Climate. Ph.D. Thesis, Ryerson University, Toronto, ON, Canada, 2015. [Google Scholar]
  27. Youssef, W.M.K.A. Experimental and Computational Study of Indirect Expansion Solar Assisted Heat Pump System with Latent Heat Storage for Domestic Hot Water Production. Ph.D. Thesis, Brunel University London, London, UK, 2017. [Google Scholar]
  28. Sterling, S.J.; Collins, M.R. Feasibility Analysis of a Heat Pump Assisted Solar Domestic Hot Water System; Department of Mechanical and Mechatronic Engineering of the University of Waterloo: Waterloo, ON, Canada, 2010. [Google Scholar]
  29. Li, H.; Yang, H. Study on Performance of Solar Assisted Air Source Heat Pump Systems for Hot Water Production in Hong Kong. Appl. Energy 2010, 87, 2818–2825. [Google Scholar] [CrossRef]
  30. Ҫağlar, A.; Yamali, C. Performance Analysis of a Solar Assisted Heat Pump with an Evacuated Tubular Collector for Domestic Heating. Energy Build. 2012, 54, 22–28. [Google Scholar]
  31. Kokila, R.N.; Rajakumar, S. Performance Evaluation of Solar Asisted Heat Pump Water Heating System. IOSR J. Eng. 2013, 3, 12–17. [Google Scholar]
  32. Gorozabel-Chata, F.B.; Chaturvedi, S.K.; Almogbel, A. Analysis of a Direct Expansion Solar Asisted Heat Pump using Different Refrigerants. Energy Convers. Manag. 2005, 46, 2614–2624. [Google Scholar] [CrossRef]
  33. Atmaca, I.; Kocak, S. Theoretical Energy and Exergy Analyses of Solar Assisted Heat Pump Sapce Heating System. Therm. Sci. 2014, 18, 417–427. [Google Scholar] [CrossRef]
  34. Torres-Reyes, E.; Cervantes de Gortari, J. Optimal Performance of an Irreversible Solar Assisted Heat Pump. Exergy Int. J. 2001, 1, 107–111. [Google Scholar] [CrossRef]
  35. Chyng, J.P.; Lee, C.P.; Huang, B.J. Performance Analysis of a Solar-Assisted Heat Pump Water Heater. Sol. Energy 2003, 74, 33–44. [Google Scholar] [CrossRef]
  36. Chow, T.T.; Pei, G.; Fong, K.F.; Lin, Z.; Chan, A.S.; He, M. Modeling and Application of Direct-Expansion Solar-Assisted Heat Pump for Water Heating in Subtropical Hong Kong. Appl. Energy 2010, 87, 643–649. [Google Scholar] [CrossRef]
  37. Sánta, R.; Garbai, L.; Fürstner, I. Optimization of a Heat Pump System. Energy 2015, 89, 45–54. [Google Scholar] [CrossRef]
  38. Guo, J.J.; Wu, J.Y.; Wang, R.Z.; Li, S. Experimental Research and Operation Optimization of an Air Source Heat Pump Water Heater. Appl. Energy 2011, 88, 4128–4138. [Google Scholar] [CrossRef]
  39. Khorasaninejad, E.; Hajabdollahi, H. Thermoeconomic and Environmental Optimization of Solar Assisted Heat Pump by Using Multi Objective Particle Swarm Algorithm. Energy 2014, 72, 680–690. [Google Scholar] [CrossRef]
  40. Rattner, A.; Bohren, J. Heat and Mass Correlations; School of Engineering and Applied Science of the University of Pennsylvania: Philadelphia, PA, USA, 2008. [Google Scholar]
  41. Hollands, K.G.T.; Unny, T.E.; Raithby, G.D.; Konicek, L. Free Convective Heat Transfer across Inclined Layers. ASME J. Heat Transf. 1976, 98, 189–193. [Google Scholar] [CrossRef]
  42. Incropera, F.P.; DeWitt, D.P.; Bergman, T.L.; Lavine, A.S. Free Convection. In Fundamentals of Heat and Mass Transfer; John Wiley & Sons: New York, NY, USA, 2011; pp. 593–652. [Google Scholar]
  43. Berdahl, P.; Fromberg, R. The Thermal Radiance of Clear Skies. Sol. Energy 1982, 29, 299–314. [Google Scholar] [CrossRef]
  44. Chen, B.; Kasher, J.; Maloney, J.; Girgis, G.A.; Clark, D. Determination of the Clear Sky Emissivity for Use in Cool Storage and Roof Pond Applications; Passive Solar Research Group of the University of Nebraska at Omaha: Omaha, NE, USA, 1995. [Google Scholar]
  45. Kalogirou, S. Environmental Characteristics. In Solar Energy Engineering: Processes and Systems; Elsevier Academic Press: Cambridge, MA, USA, 2013; pp. 49–119. [Google Scholar]
  46. Reindl, D.T.; Beckman, W.A.; Duffie, J.A. Diffuse Fraction Correlations. Sol. Energy 1990, 45, 1–7. [Google Scholar] [CrossRef]
  47. Reindl, D.T.; Beckman, W.A.; Duffie, J.A. Evaluation of Hourly Tilted Surface Radiation Models. Sol. Energy 1990, 45, 9–17. [Google Scholar] [CrossRef]
  48. Franco-Lijó, J.M. Evaporador. In Manual de Refrigeración; Reverté: Barcelona, Spain, 2006; pp. 103–127. [Google Scholar]
  49. Danfoss Manufacturing. Troubleshooting—Fault Location. In Fitters Notes: Hints and Tips for the Installer; Danfoss: Refrigeration and Air Conditioning Division: Nordberg, Denmark, 2006; pp. 155–203. [Google Scholar]
  50. F-Chart Software. EES: Engineering Equation Solver, version 10.298, F-Chart Software: Madison, WI, USA, 2017.
  51. Moreno-Rodríguez, A.; González-Gil, A.; Izquierdo, M.; García-Hernando, N. Theoretical Model and Experimental Vlidation of a Direct Expansion Solar-Assisted Heat Pump for Domestic Hot Water Applications. Energy 2012, 45, 704–715. [Google Scholar] [CrossRef]
  52. Li, Y.W.; Wang, R.Z.; Wu, J.Y.; Xu, Y.X. Experimental Performance Analysis on a Direct-Expansion Solar-Assisted Heat Pump Water Heater. Appl. Therm. Eng. 2007, 27, 2858–2868. [Google Scholar] [CrossRef]
  53. OriginLab. OriginPro, version 9.3.1.273; OriginLab: Northampton, MA, USA, 2017. [Google Scholar]
  54. Statgraphics Technologies Inc. STATGRAPHICS 18, version 18.1.01; Statgraphics Technologies Inc.: Fauquier County, VA, USA, 2017. [Google Scholar]
  55. García-Gutiérrez, A.; Barragán-Reyes, R.M.; Arellano-Gómez, V.M. Research on Heat Pumps in Mexico Operating on Waste Energy as Heat Source. In Proceedings of the Geothermal Resources Council Annual Meeting, Reno, NV, USA, 30 September–3 October 2007. [Google Scholar]
  56. Eiben, A.E.; Smith, J.E. What is an Evolutionary Algorithm? In Introduction to Evolutionary Computing; Springer: Berlin/Heidelberg, Germany; New York, NY, USA, 2003; pp. 15–36. [Google Scholar]
  57. Sivanandam, S.N.; Deepa, S.N. Evolutionary Computation. In Introduction to Genetic Algorithms; Springer: Berlin/Heidelberg, Germany; New York, NY, USA, 2008; pp. 1–14. [Google Scholar]
  58. Charbonneau, P.; Knapp, B. PIKAIA 1.2; National Center for Atmospheric Research—High Altitude Observatory: Boulder, CO, USA, 2002. [Google Scholar]
Figure 1. Energy flow diagram of the Direct Expansion Solar-Assisted Heat Pump (DXSAHP) system.
Energies 11 01773 g001
Figure 2. Causal diagram of the DXSAHP system.
Energies 11 01773 g002
Figure 3. Cross-section of the solar collector/evaporator.
Energies 11 01773 g003
Figure 4. Radial cross-section of the TSU.
Energies 11 01773 g004
Figure 5. Comparison with experimental data provided by Moreno-Rodriguez [51].
Energies 11 01773 g005
Figure 6. Comparison with experimental data published by Li et al. [52].
Energies 11 01773 g006
Figure 7. Comparison with experimental data published by Cutic et al. [19].
Energies 11 01773 g007
Figure 8. Genetic algorithm overview: (a) Experimental results, (b) GA-based modelling, (c) Optimization implementation.
Energies 11 01773 g008
Figure 9. Condensation heat rate of the system with different refrigerants based on the optimization output (a) Madrid, (b) Shanghai, (c) Zagreb.
Energies 11 01773 g009
Figure 10. Work compression input of the system with different refrigerants based on the optimization output (a) Madrid, (b) Shanghai, (c) Zagreb.
Energies 11 01773 g010
Table 1. Summary of the two independent sample comparison.
VariableMean
μ
Std. Deviation
σ
Variance
σ 2
Ratio of Variance
σ e x 2 / σ m 2
Difference of Means
μ e x μ m
Mean Lower BoundMean Upper Boundp-Value
Characteristic Days
Q ˙ c e x 3.21.281.650.77−0.41−2.421.590.64
Q ˙ c m 3.611.462.14
W ˙ c e x 1.380.280.0823.150.022−0.310.360.88
W ˙ c m 1.350.160.026
Seasonal Performance
Q ˙ c e x 5.130.570.3271.210.17−0.170.530.31
Q ˙ c m 4.950.510.269
W ˙ c e x 0.990.1760.0311.930.062−0.030.160.22
W ˙ c m 0.930.1260.016
Continuous Operation
Q ˙ c e x 2.340.370.1371.47−0.027−0.340.290.86
Q ˙ c m 2.370.300.093
W ˙ c e x 0.410.060.00366-0.030−0.070.010.16
W ˙ c m 0.440.0250.0006
Table 2. Computation of the thermal capacity of the heat pump for the experimental data set of Cutic et al. [19].
Hour T i
(°C)
Q ˙ C
(kW)
q ˙ T
(kW)
Q ˙ C q ˙ T
(kW)
T O
(°C)
Δ t
(s)
τ C C O P
10:0015.81.94622.18−20.2318.618000.085.69
10:3018.61.95520.23−18.2821.40.095.63
11:0021.41.95518.28−16.3224.30.105.49
11:3024.32.02916.32−14.2927.20.125.23
12:0027.22.19614.29−12.1030.40.155.4
12:3030.42.40212.10−9.7033.90.195.5
13:0033.92.5839.70−7.1137.60.265.65
13:3037.62.7767.11−4.3441.70.395.86
14:0041.72.7954.34−1.5445.73000.645.66
14:0545.72.7961.541.2548.291.815.66
Table 3. Computation of the mean thermal capacity.
T i
(°C)
T o
(°C)
Q ˙ C ¯
(kW)
Δ t
(s)
q ˙ T
(kW)
τ C C O P
15.8482.34180022.430.105.69
360011.210.205.63
54007.470.315.49
72005.600.415.23
90004.480.525.4
10,8003.730.625.5
12,6003.200.735.65
14,4002.800.835.86
16,2002.490.935.66
18,0002.241.045.66
Table 4. Comparison with experimental data provided by Li et al. [52].
Date T
(°C)
T o
(°C)
Q ˙ C
(kW)
Δ t
(s)
q ˙ T
(kW)
τ C C O P
04/04/200520.6506.4872002.582.516.61
05/04/200522.16.362.442.596.36
05/04/200522.95.902.372.485.46
15/04/200525.15.582.182.555.26
16/04/200524.25.382.262.375.49
18/04/200528.94.991.842.696.09
20/04/200525.75.262.132.465.26
22/04/200524.45.262.242.345.21
08/05/200532.04.801.573.044.95
10/05/200524.44.582.242.034.37
11/05/200535.14.781.303.665.56
12/05/200535.64.711.253.745.54
14/05/200517.14.982.891.723.11
15/05/200525.64.812.142.244.63
17/05/200527.44.841.982.444.57
19/05/200527.04.822.012.394.34
20/05/200530.24.851.732.795.91
30/05/200526.34.672.072.245.36
31/05/200530.04.541.752.595.75
Table 5. Thermal capacity for the experimental setup by Moreno-Rodriguez [51].
Date T
(°C)
T o
(°C)
Q ˙ C
(kW)
Δ t
(s)
q ˙ T
(kW)
τ C C O P
4/12/200913514.0144003.251.232.5
7/12/2009142.33.160.721.9
6/05/2010164.92.981.642.9
2/09/2010273.12.011.542.2
2/12/201061.73.870.431.7
Table 6. Genetic algorithm evaluation conditions.
No. of individuals128
No. of generations2048
Mutation rate0.35
Table 7. GA-based modelling/optimization results.
Location T i
(°C)
T O
(°C)
Δ t
(s)
Δ t O p t
(s)
V w
(L)
N E v a p τ C Residuals
Madrid135114,40012,618300112.323 × 10−17
1419,52324.146 × 10−20
1610,11723.476 × 10−20
2711,16548.360 × 10−18
632,40245.603 × 10−17
Shanghai20.65072003239150416.658 × 10−11
22.1322448.666 × 10−13
22.9280845.461 × 10−20
25.1324642.030 × 10−12
24.2319644.778 × 10−11
28.9234448.562 × 10−13
25.7287445.239 × 10−11
24.4308142.109 × 10−11
32.0224141.641 × 10−12
24.4384246.370 × 10−11
35.1160046.780 × 10−12
35.6171142.484 × 10−12
17.1445941.320 × 10−10
25.6354645.705 × 10−12
27.4353648.227 × 10−11
27.0361845.154 × 10−09
30.2225943.556 × 10−11
26.3298043.412 × 10−13
30.0236943.655 × 10−11
Zagreb15.84818,00016,360300114.502 × 10−20
Table 8. Refrigerant selection based on the COP output of the optimization.
LocationCOP
R22R134aR404AR407CR410A
Madrid-2.52.823.252.56
-1.912.232.612.09
-2.883.103.542.76
-2.212.202.592.12
-1.71.952.321.87
Shanghai6.6110.337.798.896.14
6.369.417.258.285.79
5.465.164.204.184.13
5.267.586.157.045.08
5.488.236.557.495.34
6.088.336.867.775.61
5.268.376.727.665.47
5.208.476.727.685.46
4.946.775.906.714.99
4.366.525.396.224.55
5.559.437.428.435.94
5.548.286.667.595.43
3.113.693.173.213.27
4.626.575.476.304.62
4.565.874.525.264.00
4.345.754.965.734.29
5.919.987.528.625.96
5.367.676.277.165.17
5.749.617.278.345.78
Zagreb-5.613.924.493.72

