Abstract
Dissolved gas analysis (DGA) is widely used to detect the incipient fault of power transformers. However, the accuracy is greatly limited by selection of DGA features and performance of fault diagnostic model. This paper proposed a fault diagnostic method integrating feature selection and diagnostic model optimization. Firstly, this paper set up three feature sets with eight basic DGA gases, 28 DGA gas ratios and 36 hybrid DGA features, respectively. Then, to eliminate the interference of weak-relevant and irrelevant features, the genetic-algorithm-SVM-feature-screen (GA-SVM-FS) model was built to screen out the optimal hybrid DGA features subset (OHFS) from three feature sets. Next, using the OHFS as the input, the support vector machine (SVM) multi-classifier optimized by ISGOSVM (SVM classifier optimized by improved social group optimization) was built to diagnose fault types of transformers. Finally, the performance of OHFS and ISGOSVM diagnostic model was tested and compared with traditional DGA features and diagnostic models, respectively. The results show that the OHFS screened out is comprised of 14 features, including 12 gas ratios and two gases. The accuracy of OHFS is 3–30% higher than traditional DGA features, and the accuracy of ISGOSVM can increase by 3% to 14% compared with the SGOSVM (SVM classifier optimized by social group optimization), GASVM (SVM classifier optimized by genetic algorithm optimization), PSOSVM (SVM classifier optimized by particle swarm optimization), and SVM diagnostic models. The proposed approach integrating the OHFS with ISGOSVM achieves the highest accuracy of fault diagnose (92.86%).
1. Introduction
The oil-immersed power transformer is one of the core equipment of the power grid which bears the important task of voltage conversion and power transmission. A fault of the transformers may lead to not only a large-scale power supply interruption, but also countless economic, social, and personal losses, which will cause large carbon emissions [1]. Therefore, incipient fault diagnosis is gaining attention [2,3,4], by the utilities to ensure continuous operation and minimizing the operational risks. At present, the “Online diagnosis” and “Offline diagnosis” are the two most popular fault diagnosis methods for power transformers. The “Online diagnosis” consists of dissolved gas analysis (DGA) [5], oil temperature diagnosis [6], acoustic emission method [7] and partial discharge measurements [8], etc. The “offline diagnosis” includes the DGA [9], insulation experiment (IE) [10,11,12,13], pressboard characteristic analysis (PCA) [14], frequency response analysis (FRA) [15,16,17], transfer function technique (TFT) [18,19,20], etc.
DGA is widely used to detect the incipient fault of power transformers. However, the feature selection is still a headache as the input of fault diagnosis of transformers. It is unclear that which gases (or gas ratios) are most effective features and which gases (or gas ratios) are weak-relevant and irrelevant features for fault types of transformers, and there is no unified standard for feature selection. Recently, many DGA features criterions are proposed, such as Doernenberg [21], Rogers [22], Improved Rogers [22], and IEC (International Electrotechnical Commission) 60599 [23]. Some researchers [24,25,26,27,28,29] have pointed out that some feature gases or ratios of feature gases are insensitive to transformer faults. Using these insensitive features will reduce the accuracy of fault diagnosis. Therefore, to investigate whether DGA gases or DGA gas ratios or hybrid DGA features are most relevant to fault types of transformers, we set up three DGA feature sets with dissolved gases, dissolved gas ratios and hybrid DGA features (i.e., dissolved gases and gas ratios), respectively. To eliminate the interference of these weak-relevant and irrelevant DGA features, we screened out the most effective features from these three DGA feature sets with genetic algorithm and support vector machine (SVM), and use these features screened out as the input of fault diagnosis model to improve the fault diagnosis accuracy.
Up to now, most researches on fault diagnosis of transformers rely more on expert individuals’ experience rather than mathematical model, which can reduce maintenance efficiency and increase many uncertainties of diagnosis. Hence, it is necessary to establish complex nonlinear relationships between the dissolved gas concentration and transformer faults with some artificial intelligent technologies. AI (Artificial Intelligence) technologies have been widely applied in recent years due to the advantages of continuous learning and timely updating [30,31,32,33,34,35,36,37,38,39,40]. The AI technologies such as clustering analysis [22], fuzzy logic approach [31], neural network algorithm [32,33,34], and SVM [35,36] have shed lights on transformer fault diagnosis. However, the AI technologies all have their limitations. The clustering analysis can only divide the fault samples into several different subclasses, and it cannot diagnose the type of fault. The reasoning rules and fuzzy membership functions of the fuzzy logic approach overly depend on the experience of the researchers [11]. In addition, the neural network algorithm is easy to trap in “local optimum” and “overfit” [35]. Compared with these methods, the SVM is a popular machine learning approach based on statistic theory and structural risk minimization. It can overcome the problems of “local optimum”, dimensionality, and “overfit”. Besides, SVM has a good performance in dealing with “small samples”. However, the parameters (penalty factor C and kernel parameters g) of SVM need to be optimized by optimization algorithm to obtain better classification performance [36]. The social group optimization (SGO) proposed in 2015 has been tested and compared with other optimization algorithms, the result shows that it performs better in computation costs and obtaining global optimal solutions for many functions [37]. However, there are still exist some drawbacks during the its iterative process. To further improve the performance of global optimization, an improved SGO (ISGO) is proposed in this paper.
The rest of the present paper is organized as follows. In Section 2, we presented three types of feature sets and built the genetic-algorithm-SVM-feature-screen (GA-SVM-FS) model to screen out the optimal feature subset among them. In Section 3, the improved social group optimization was proposed and applied to optimize the parameters of SVM multi-classifier. In Section 4, the performance of OHFS (optimal hybrid DGA features subset) and ISGOSVM (SVM classifier optimized by improved social group optimization) diagnostic model was tested and compared with traditional DGA features and diagnostic models. In Section 5, results and discussion are given.
2. Screen Out the Optimal Feature Subset among Three Types of Feature Set
2.1. Three Types of Feature Sets
The features formed by dissolved gasses were used as the input of diagnosis model. Up to now, the widely used feature sets can be divided into two categories: dissolved gases formed feature set and dissolved gas ratios formed feature set, which are listed in Table 1.

Table 1.
The widely used feature sets.
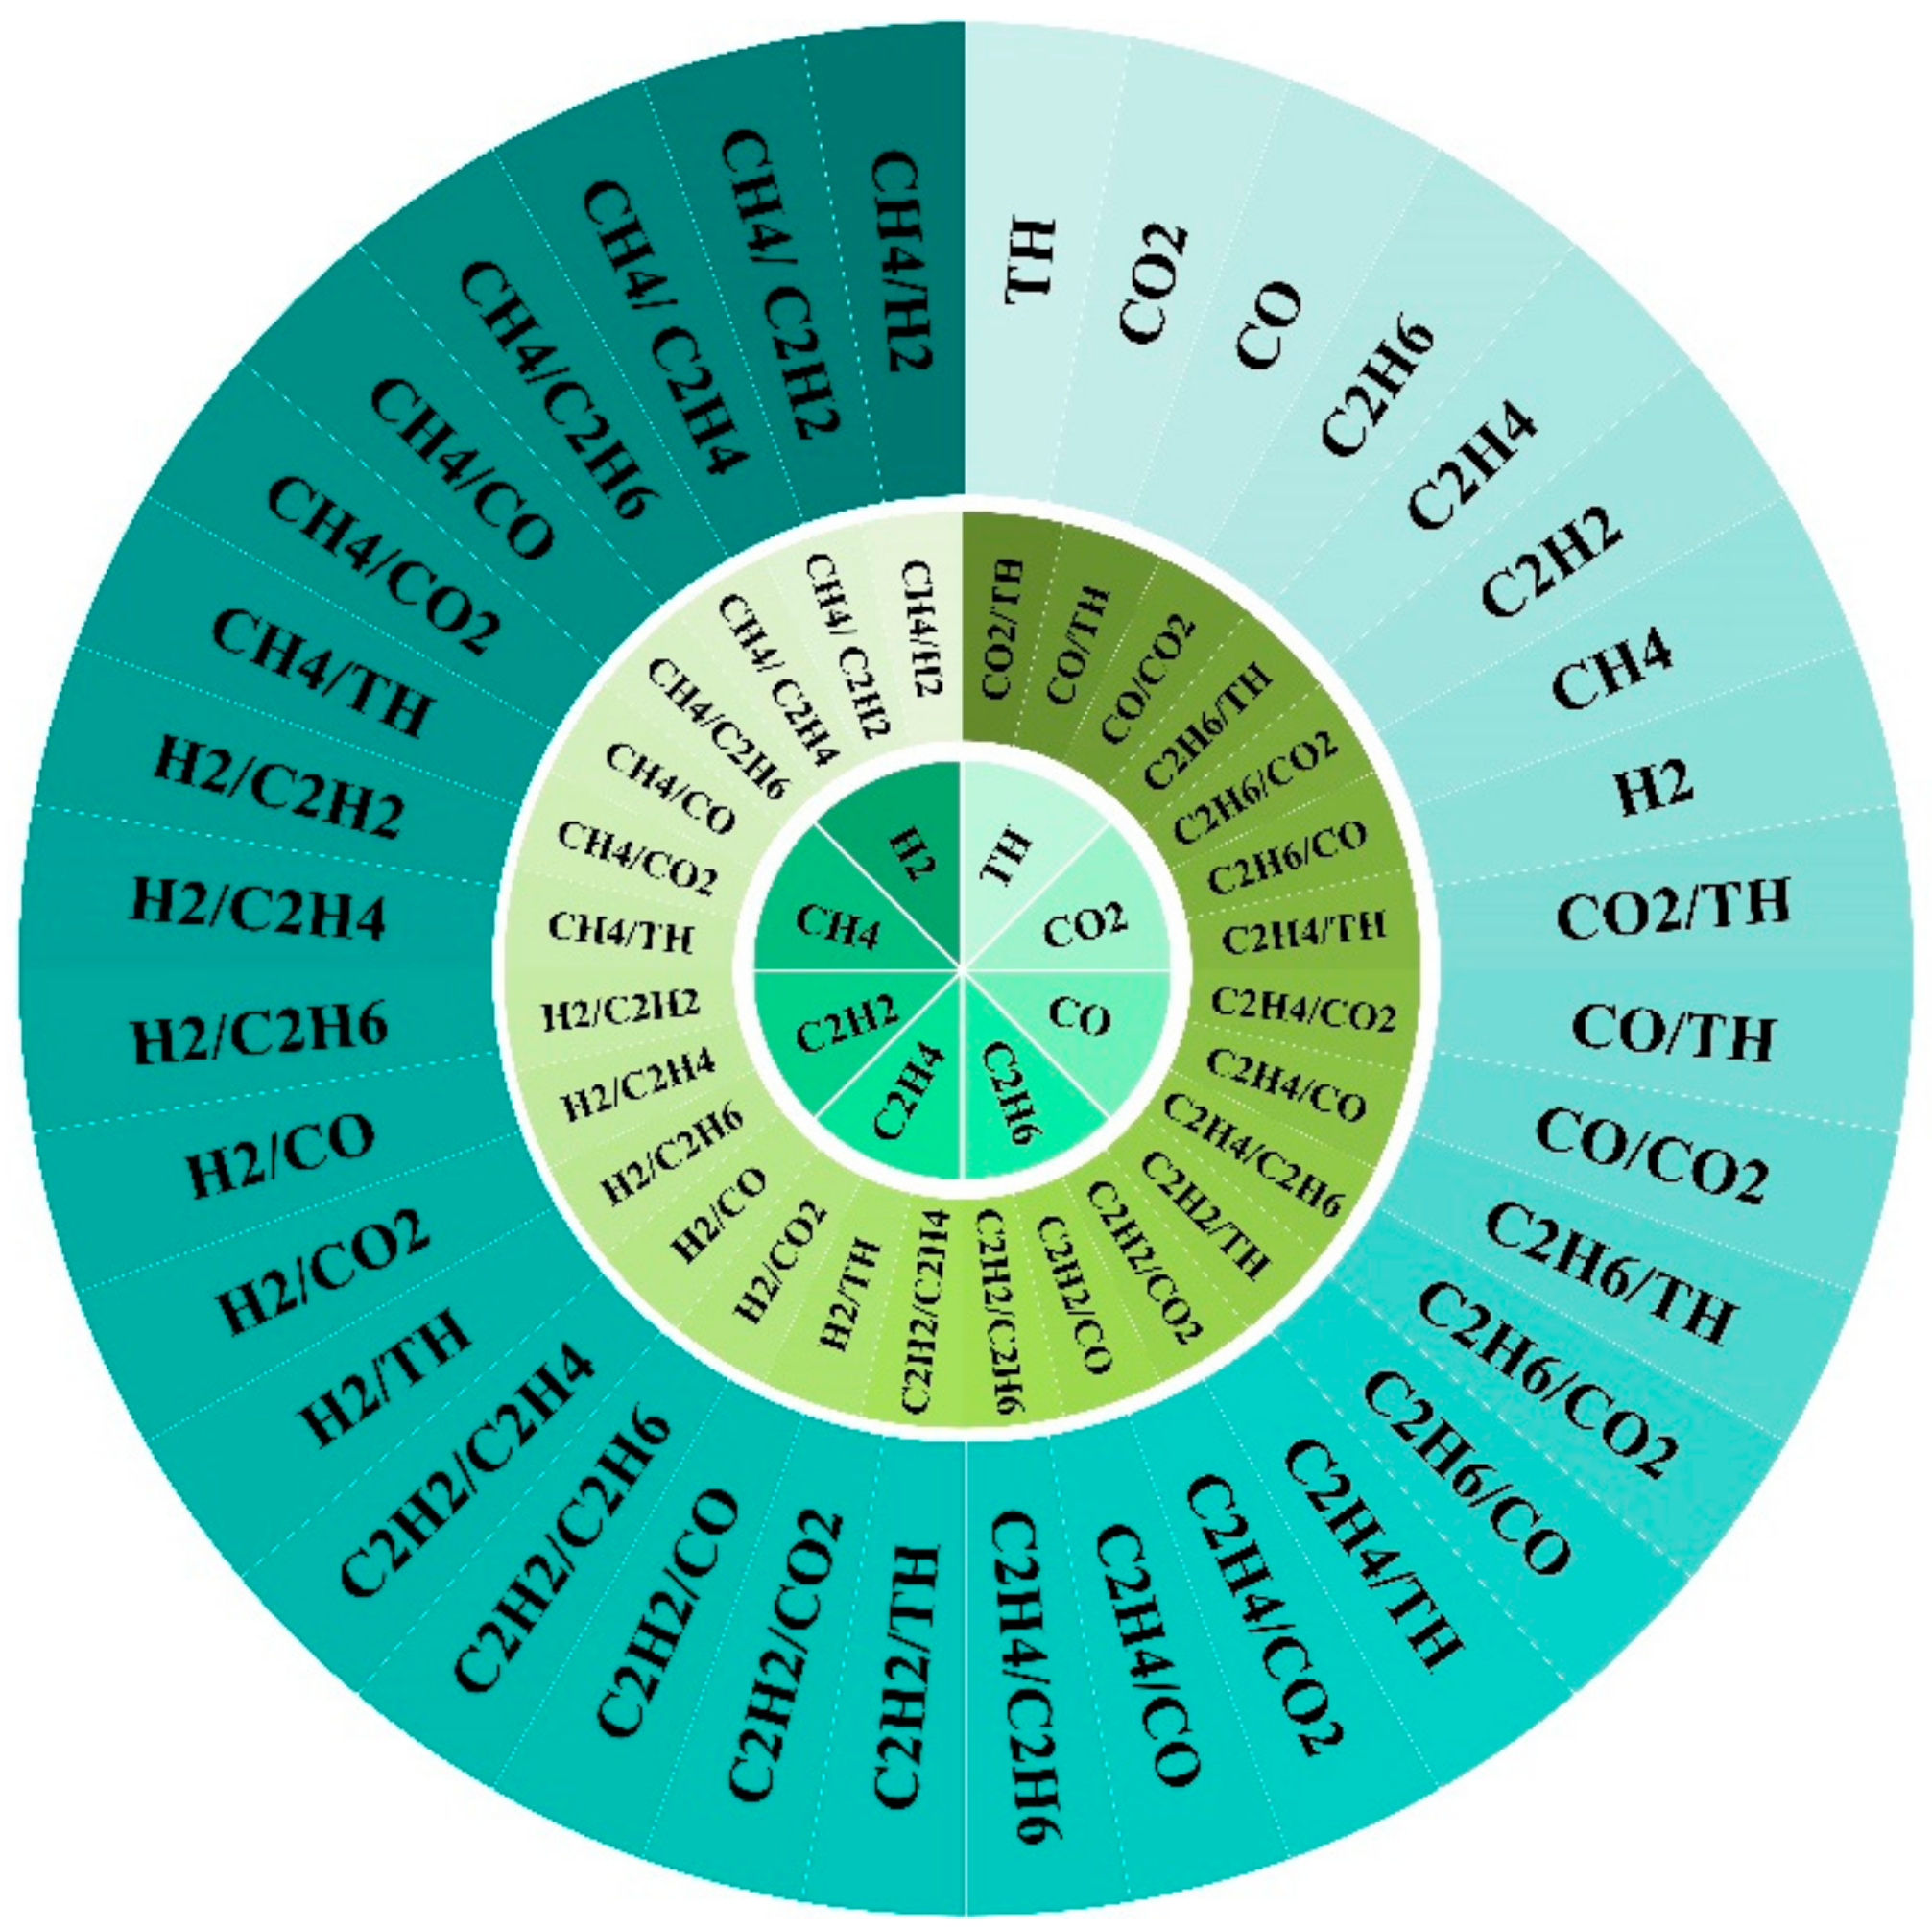
The above listed DGA sets all rely more on expert individuals’ experience rather than rigorous calculation of mathematical models. Therefore, it is still unclear that whether DGA gases or DGA gas ratios or hybrid DGA features (DGA gases and gas ratios) is most relevant to the fault types of power transformer. As shown in the Figure 1, we defined three types of feature sets to compare the relevance of three make sure the most relevant feature set and screen out the most effective features. The inner ring in Figure 1 depicts the feature set (FS1), including eight basic dissolved gases (The TH is the sum of CH4, C2H2, C2H4 and C2H6, which is related to faults of transformers [22]). The middle ring in Figure 1 illustrates second feature set (FS2), including 28 DGA gas ratios. The outer ring in Figure 1 represents the third feature set (FS3), which consist of 36 hybrid DGA features (eight basic dissolved DGA gases and 26 DGA gas ratios).

Figure 1.
Three types of feature sets.
2.2. Process of Optimization Selection
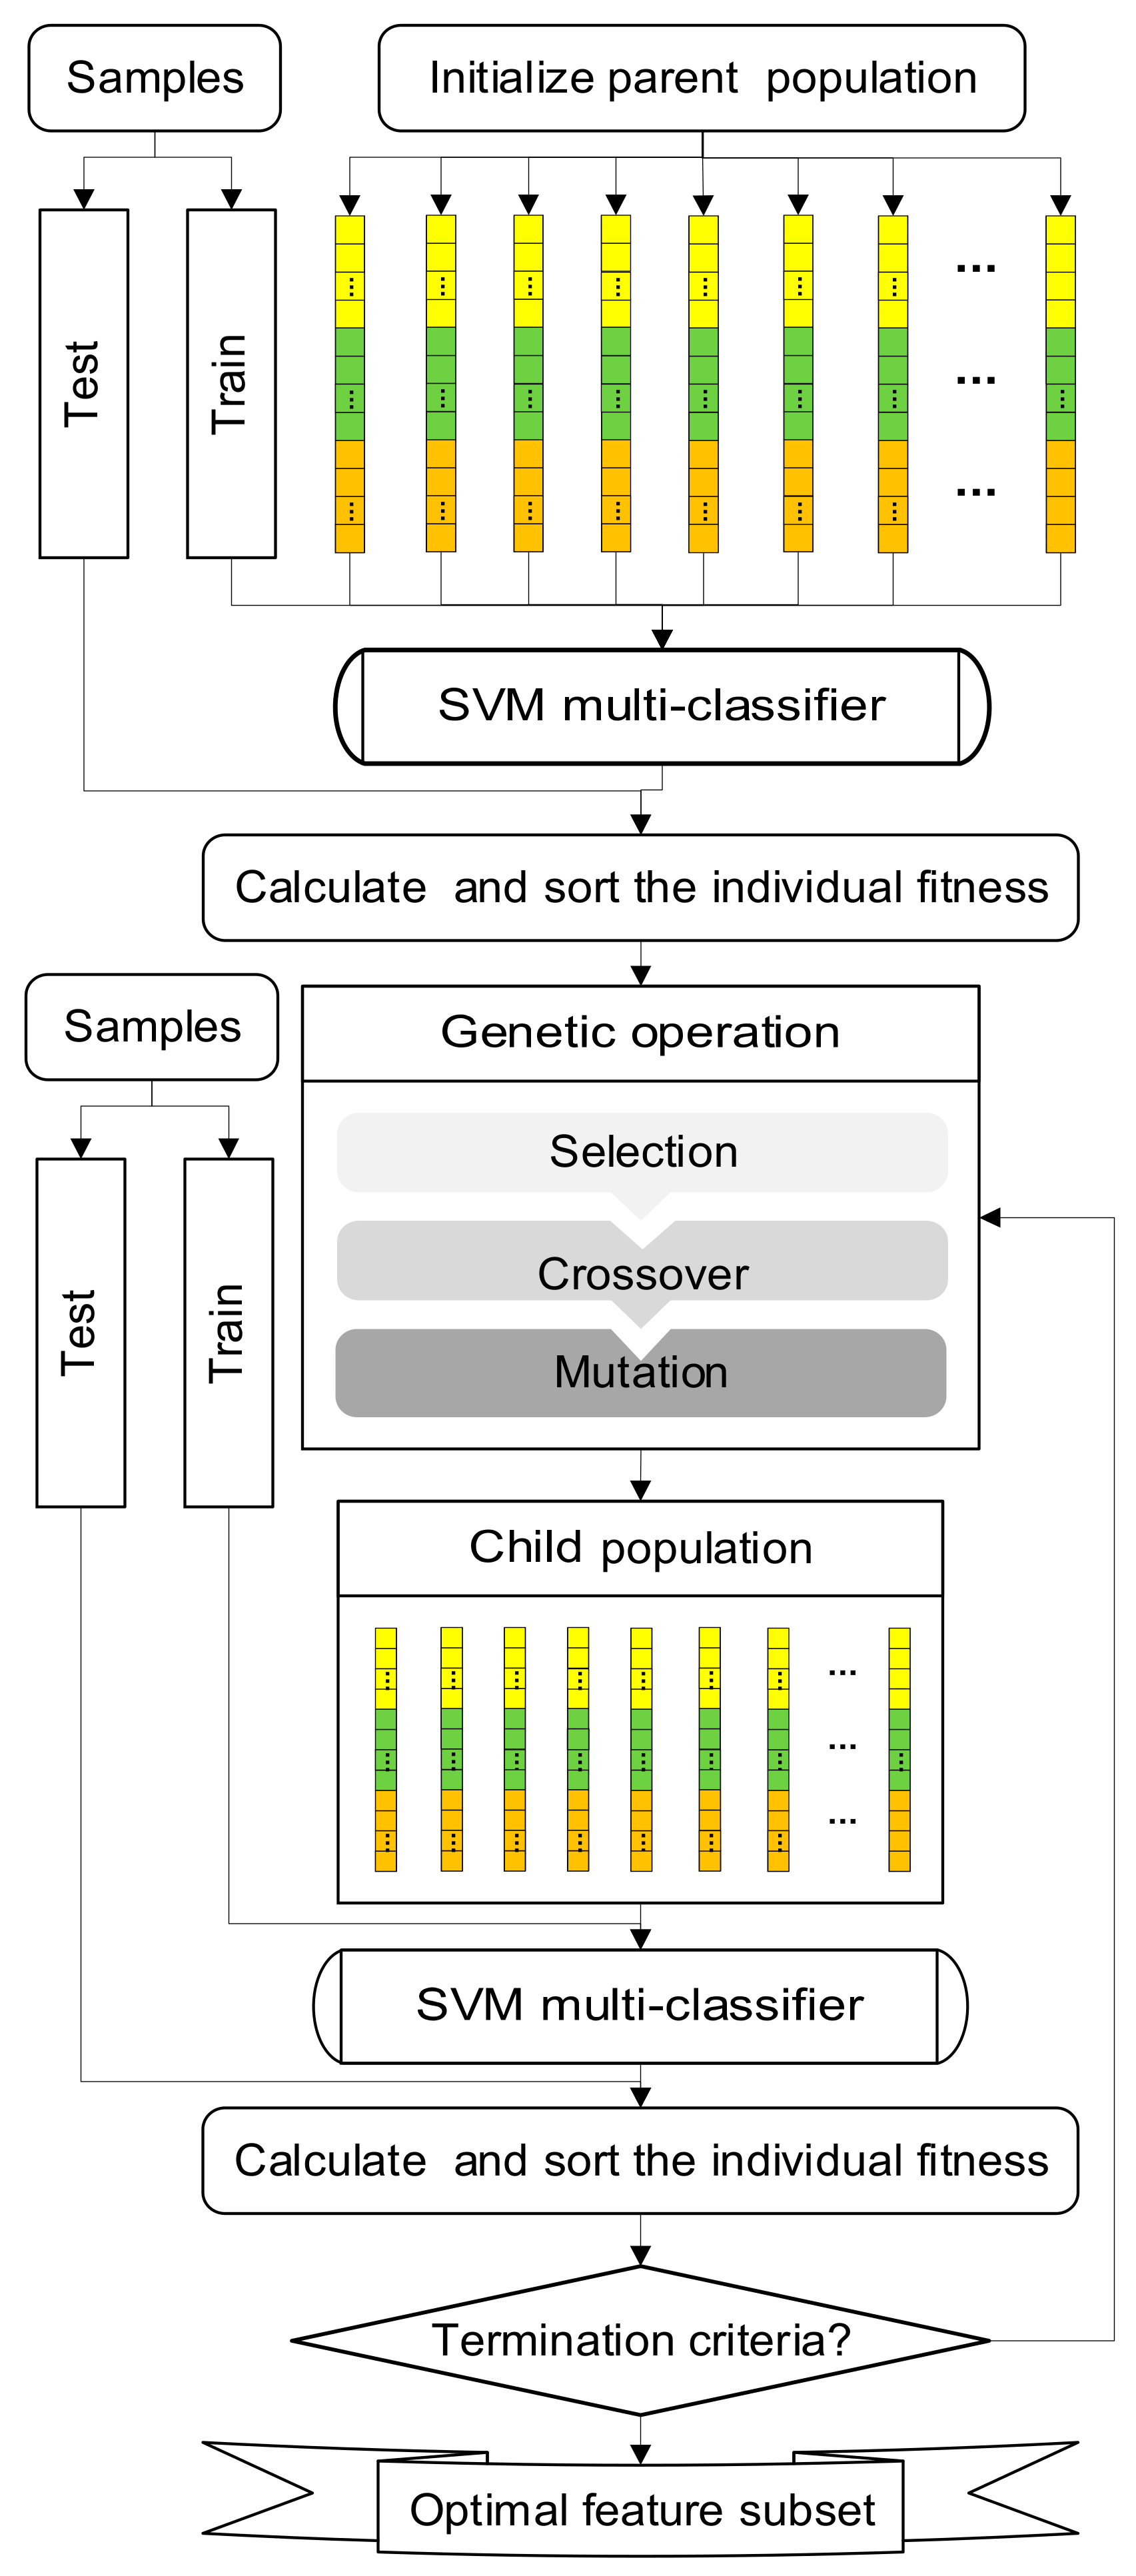
Based on three feature sets defined, we build a “genetic-algorithm-SVM-feature-screen” (GA-SVM-FS) model to screen out the optimal feature subset of each feature set. The flowchart of GA-SVM-FS model is depicted in Figure 2, the process of feature screen consists of three major steps.
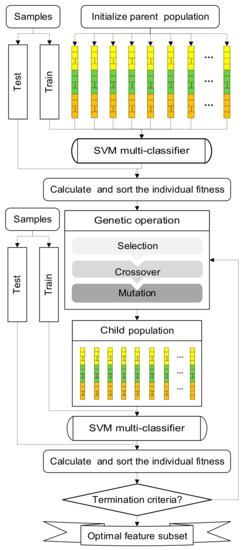
Figure 2.
Flowchart of genetic-algorithm-SVM-feature-screen (GA-SVM-FS) based on genetic algorithm and support vector machine (SVM).
(a) Data preprocessing
Three types of feature sets need to be calculated based on basic fault samples collected from IEC TC (Technical Committee of International Electrotechnical Commission) 10 database which is a public sample database related to power transformer faults. Then using these three feature sets as the input of GA-SVM-FS, respectively.
(b) Gene encoding
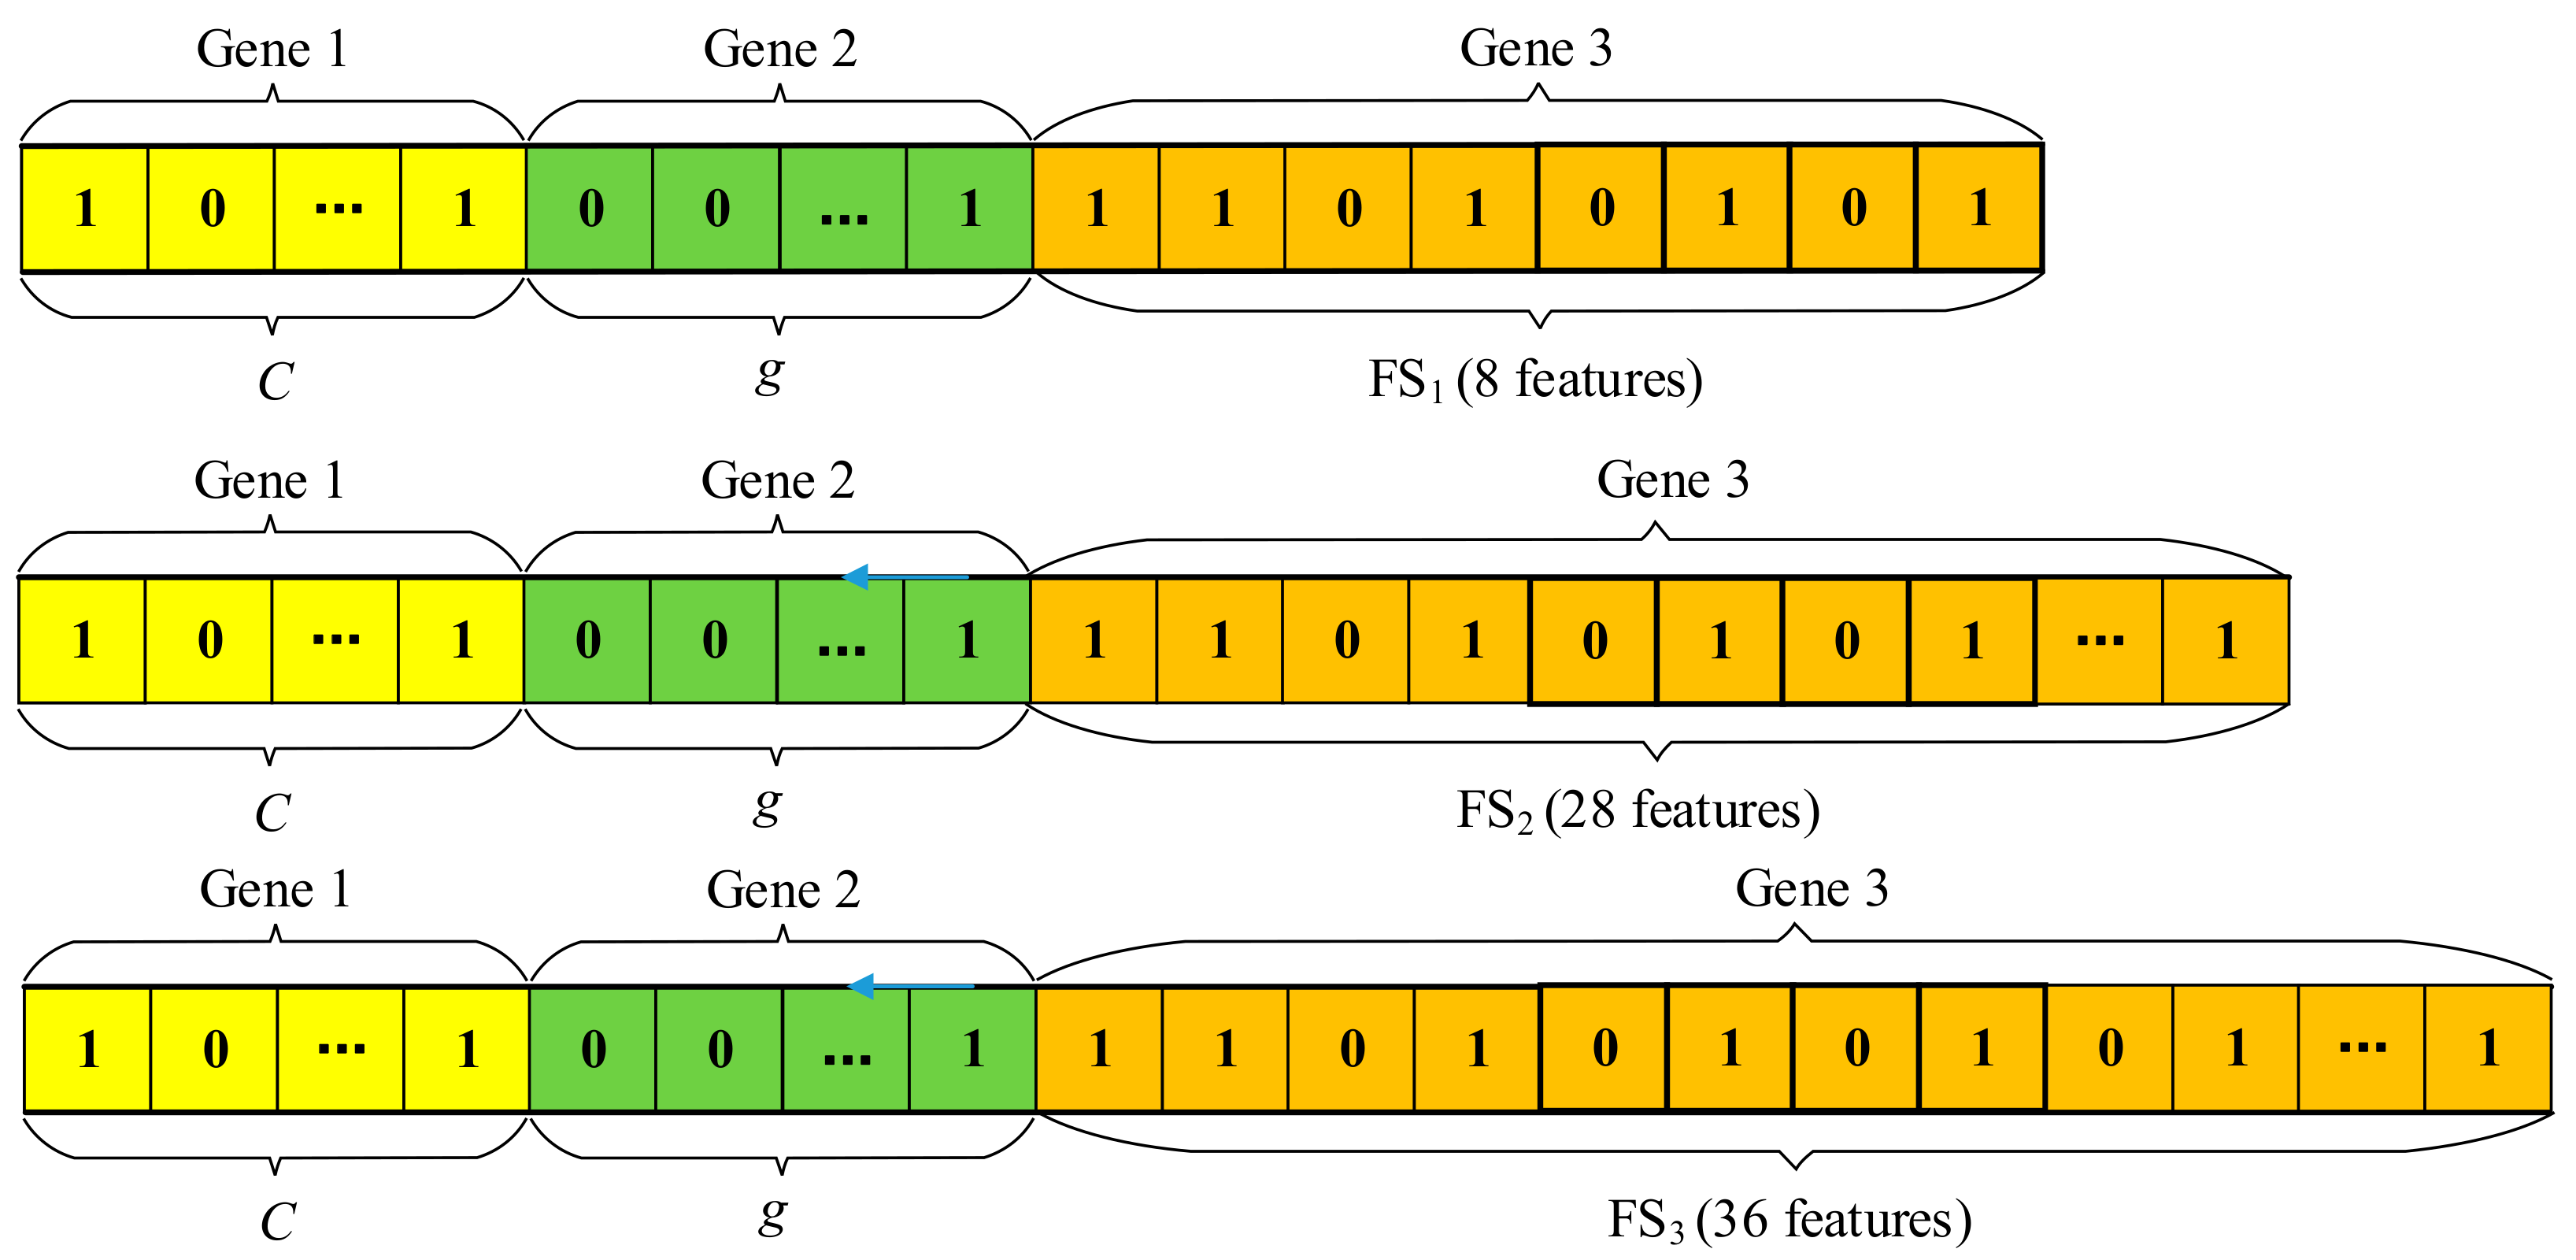
Genetic algorithm is widely in many fields. As shown in Figure 3, each chromosome is comprised of three genes, which use the binary codes represent the C, g, and DGA features, respectively. The length of binary coding of “Gene 1” or “Gene 2” is determined by its numerical boundaries, which are both set to 10. By converting the binary code to decimal, the values of C and g can be obtained. The length of “Gene 3” is the number of DGA features, which are equal to 8, 28, and 36 to represent three feature sets, respectively. In “Gene 3”, the bit which is 0, represents the corresponding DGA feature is not selected, otherwise it is selected.

Figure 3.
Gene encoding of three types of chromosomes.
(c) Building the support vector machine (SVM) multi-classifier for fault classification
Standard SVM is a binary classifier, which need to be expanded to multi-classifiers to classify the multi-types of faults of power transformers with the one-against-one (OAO) encoding strategy [39]. The nonlinear classification model can be calculated as follows [40]:
in which the C is the penalty factor. is the normal of hyperplane which can divided the samples into different groups. The hyperplane can be represented as . The is the relaxation factor which represents error of classification of training samples.
In addition, the radial basis function (RBF) is adopted as the kernel function of SVM multi-classifier [40,41], which can be expressed as follows:
where the g is the kernel parameter. The is the decision function of SVM multi-classifier.
The performance of classification of SVM multi-classifier is deeply influenced by the values of C and g. To improve the SVM multi-classifier, C and g needs to be optimized by a optimization algorithm.
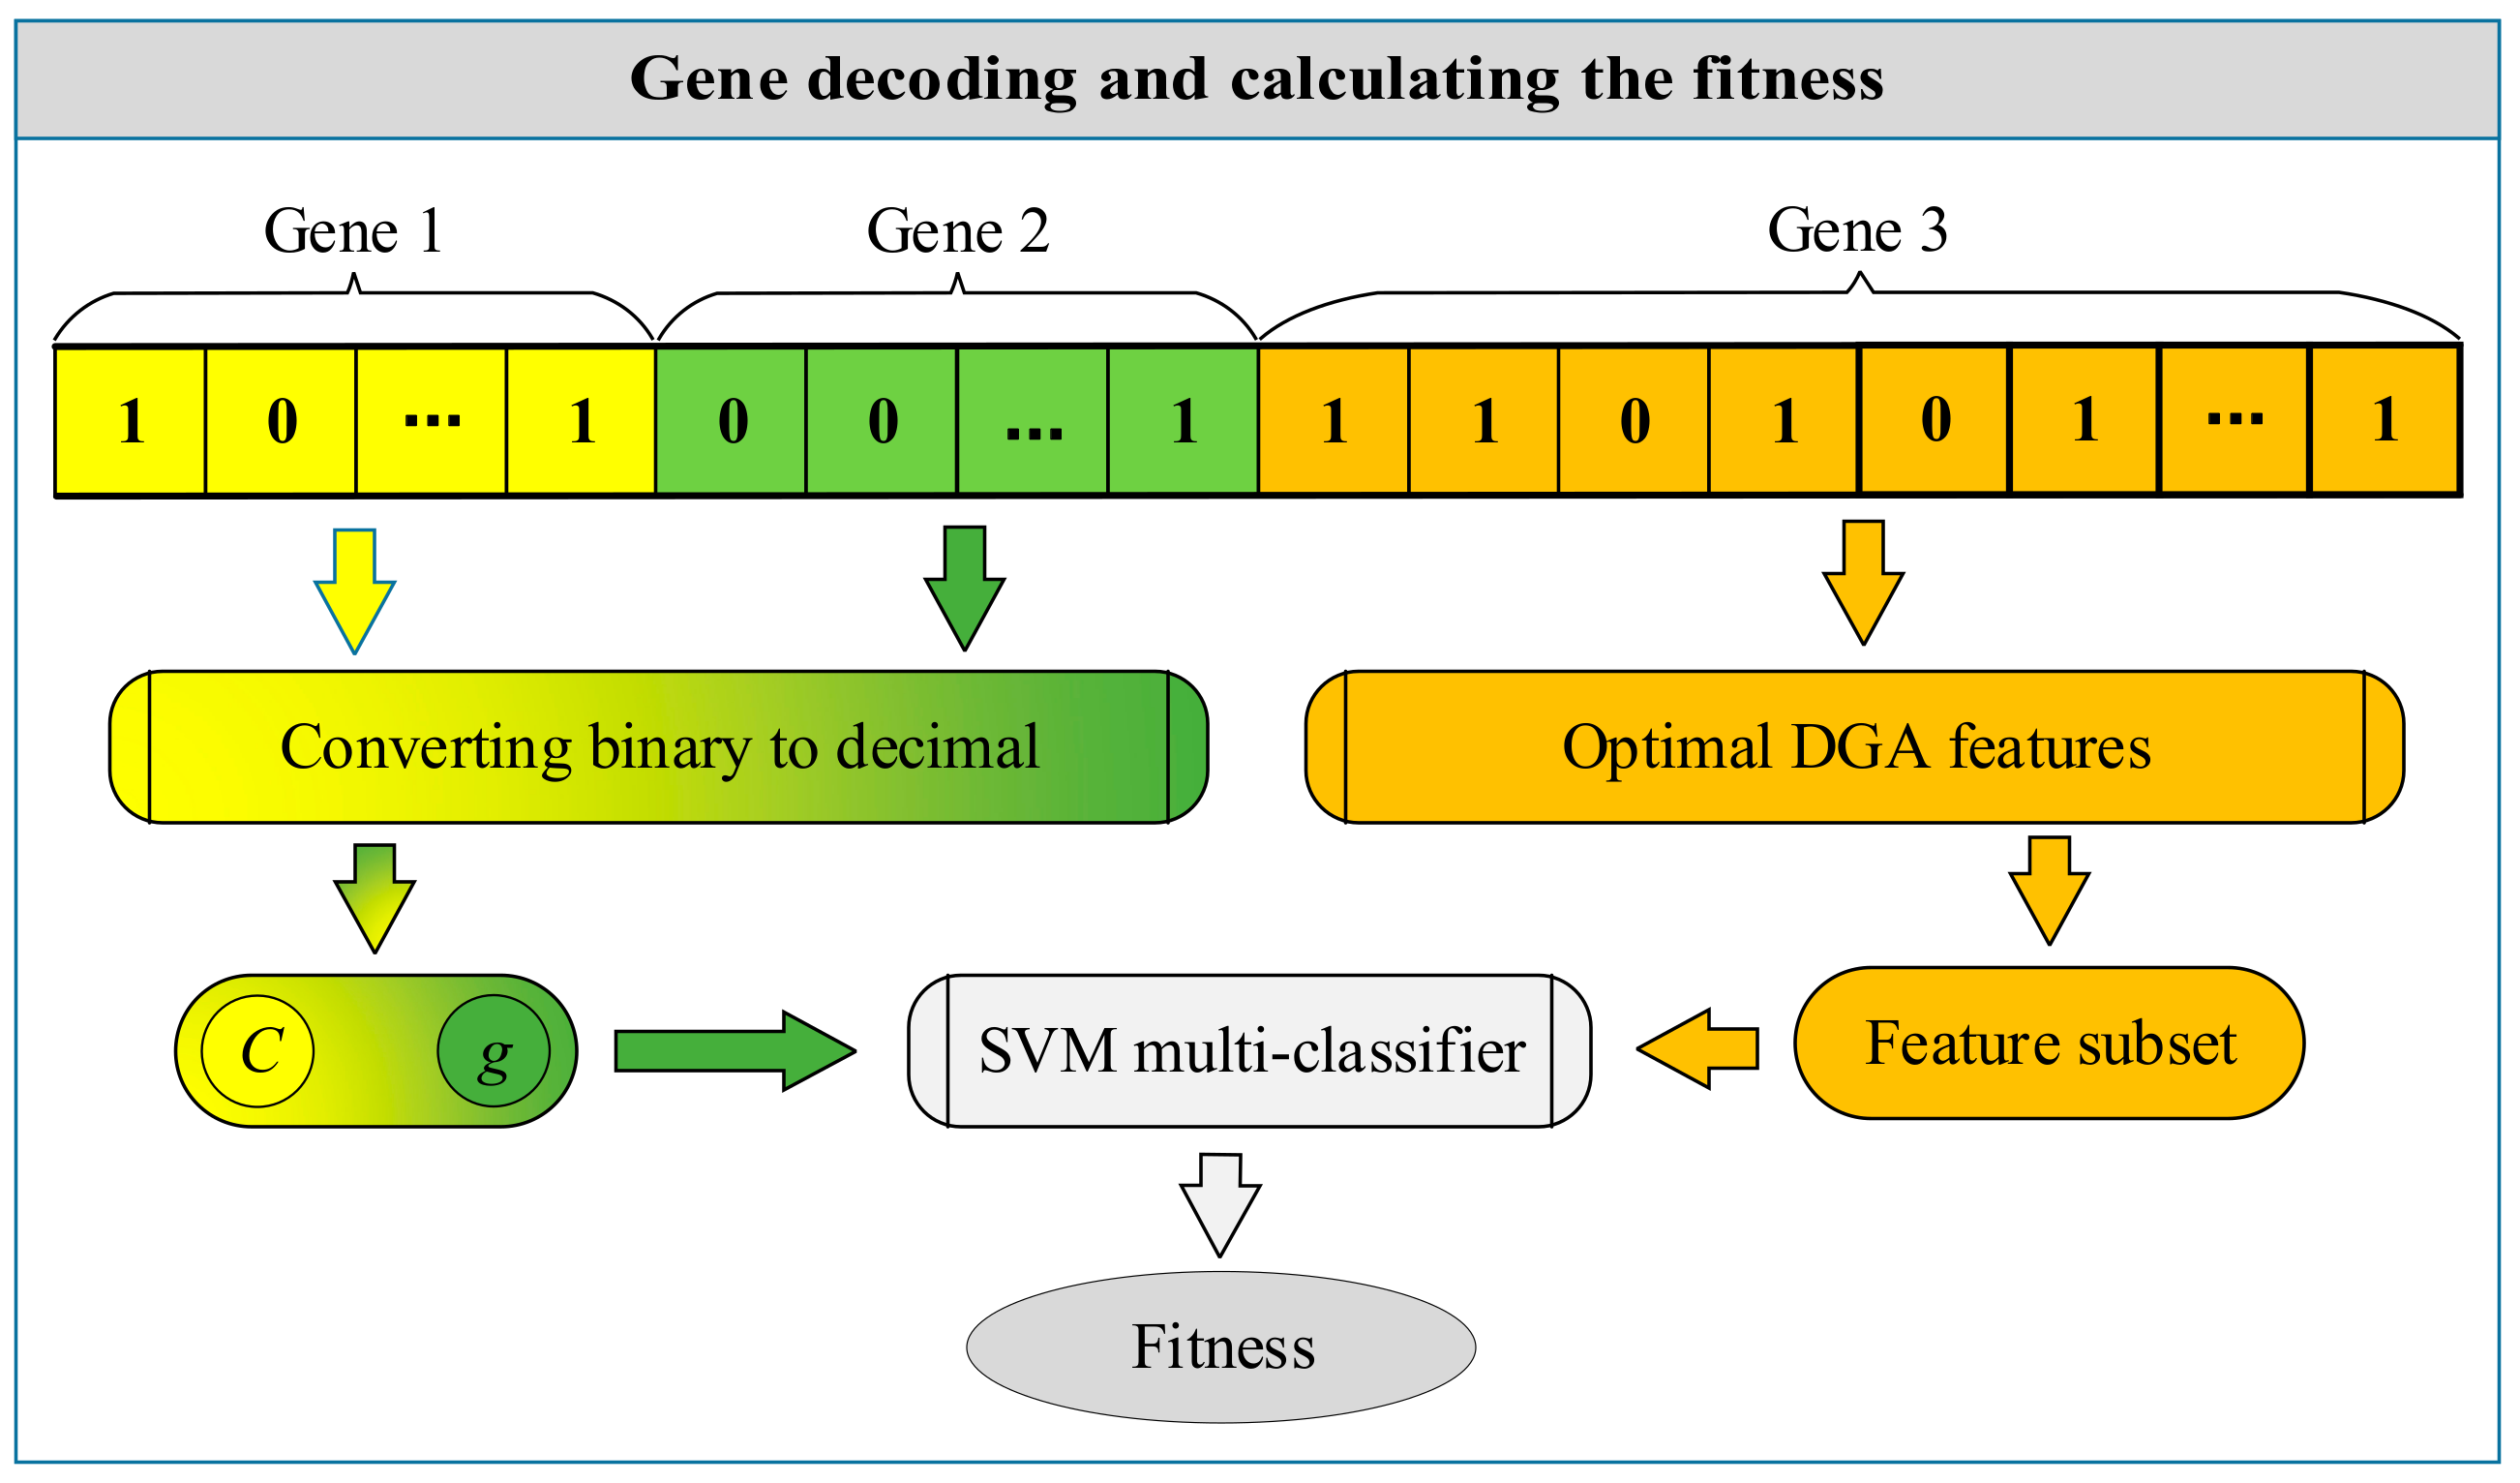
(d) Gene decoding and calculating the fitness of chromosome
As shown in Figure 4, by converting the binary code of “Gene 1” and “Gene 2” into decimal data, we can obtain the values of C and g which are used to build the SVM multi-classifier. The feature subset can be selected by choosing the features whose bit in “Gene 3” are “1”. We used the feature subset as the input of SVM multi-classifier to calculate the fitness of chromosome. Here, we used the accuracy of k-fold cross-classification (k-CV) of transformer fault training samples as the individual fitness function, which can be calculated as follows:
where, li is the number of samples in the ith verification set; liT is the correct classified number in the verification set; and k is the number of cross validation and is set as 5.
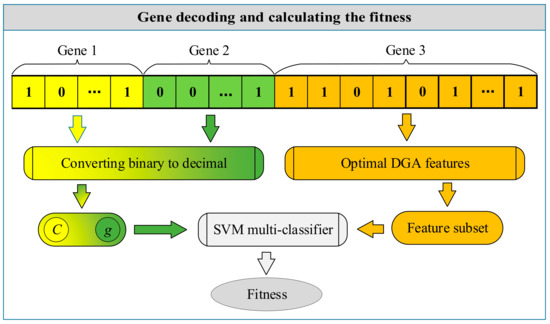
Figure 4.
Gene decoding and calculating the fitness of chromosome. DGA: dissolved gas analysis.
(e) Genetic operatations
As shown in Figure 2, the genetic operations consist of selection, crossover, and mutation. In order to accelerate the convergence of algorithm, the best chromosomes (According to Equation (3), the smaller the fitness is, the better the chromosome is) of the older generation will be reserved and incorporated into the child generation.
(f) Output the results
As shown in Figure 2, when the iterations reach the pre-determined maximum number of generations, the GA-SVM-FS model will end and output the best chromosome which own best (lowest) fitness. Based on the binary code of “Gene 3” in best chromosome, the DGA features whose bits are equal to “1” can be selected to form the best feature subset in this optimization.
2.3. Screening Results
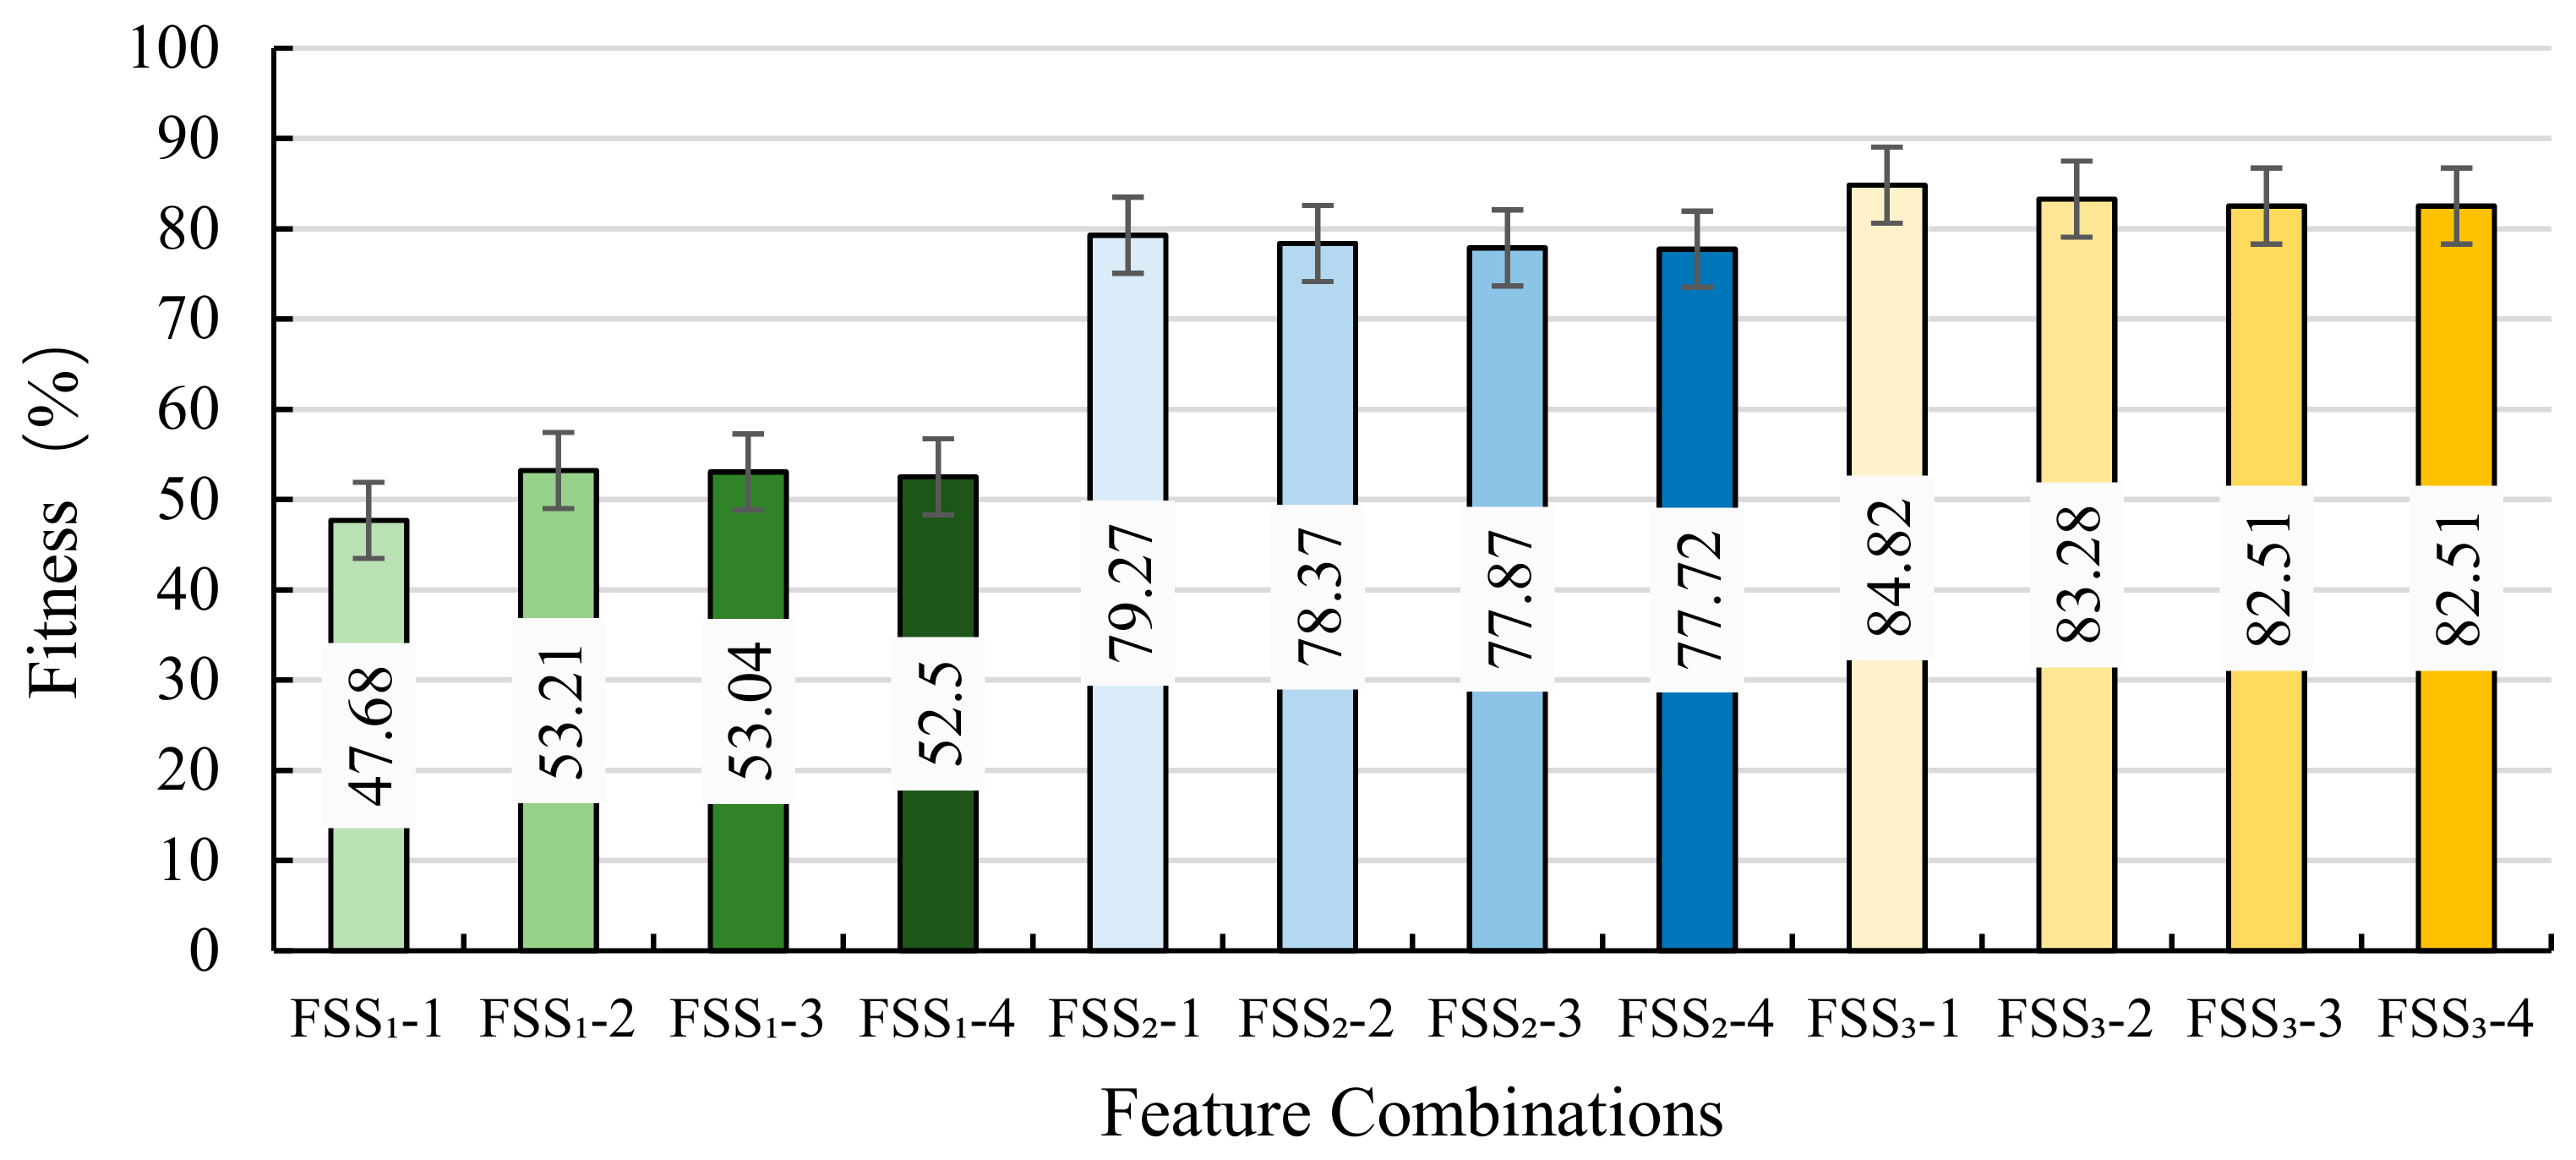
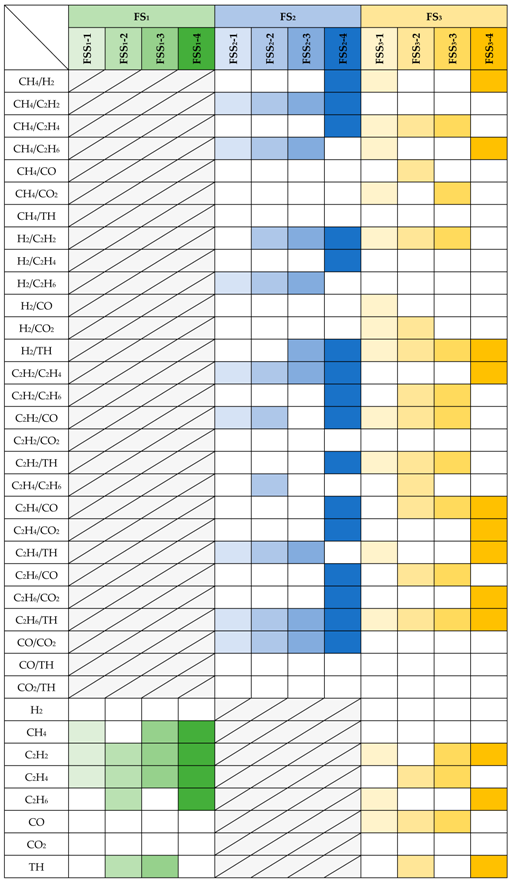
Based on the 118 fault samples in IEC TC 10 database, each type of feature set was optimized 100 times. We screened out the top four feature combinations for each type feature. As shown in Table 2, Three types of feature sets (FS1–FS3) were represented by green, blue, and brown color, respectively. The grey shaded areas represent corresponding features are not included in the feature set. The checks filled with color represent the features were selected, and all selected features in a column constitute a feature subset. We used different shades of color to distinguish different feature subsets screened out from same feature set. The FSSi-j represented the jth feature subset screened out from FSi. The average accuracies of 12 feature subsets are shown in Figure 5.
Table 2.
Optimization results of three types of feature sets.
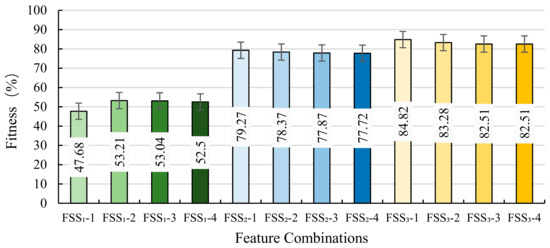
Figure 5.
Fitness of 12 feature subsets screened out from three feature sets.
As shown in Figure 5, the average testing accuracy of feature subsets selected from FS2 and FS3 are 20–30% higher than that of FS1, and the performance of feature subsets selected from FS3 is generally the best. The FSS3-1 obtains the highest average accuracy of 84.82%, which and it is defined as the optimal hybrid feature subset (OHFS). This indicates that using the hybrid feature subset including DGA gases and gas ratios as the input is better than only using DGA gases or gas ratios. The OHFS was comprised of CH4/H2, CH4/C2H4, CH4/C2H6, CH4/CO2, H2/C2H2, H2/CO, H2/CO2, H2/TH, C2H2/CO, C2H2/TH, C2H4/TH, C2H6/TH, C2H2, and C2H6.
3. Support Vector Machine (SVM) Multi-Classifier Optimized by Improved Social Group Optimization for a Fault Diagnosis Model of a Power Transformer
3.1. Improved Social Group Optimization
Social group optimization (SGO) was proposed in 2015 [37], which is inspired by humans being great imitators and followers during the process of solving complex problems, and that team solving skills can be more effective than individual skill. In this algorithm, each person represents a candidate solution, and the solving ability refers to the “fitness”. The person with best fitness is called the “team leader”, which can improve the solving skills of other members in the team by teaching them relevant experience and knowledge.
The standard SGO is mainly comprised of two steps, “Improving phase” and “Acquiring phase”.
In the “Improvement phase”, the skill level of each person in the team is enhanced by the “team leader”. The enhanced process can be expressed as follows:
where λ is a random number (0 < λ < 1), and μ is the self-introspection coefficient (μ–U(0, 1)). The Lnew(i,j) will be accepted if its fitness is better than Lold(i,j).
In the “acquiring phase”, the skill level of each person is simultaneously influenced by the “team leader” and a random other person in the team. If the other persons have more knowledge than him or her, then he or she will acquire new knowledge. The person with the most knowledge makes the highest impact on the others. The “acquiring phase” is described as follows:
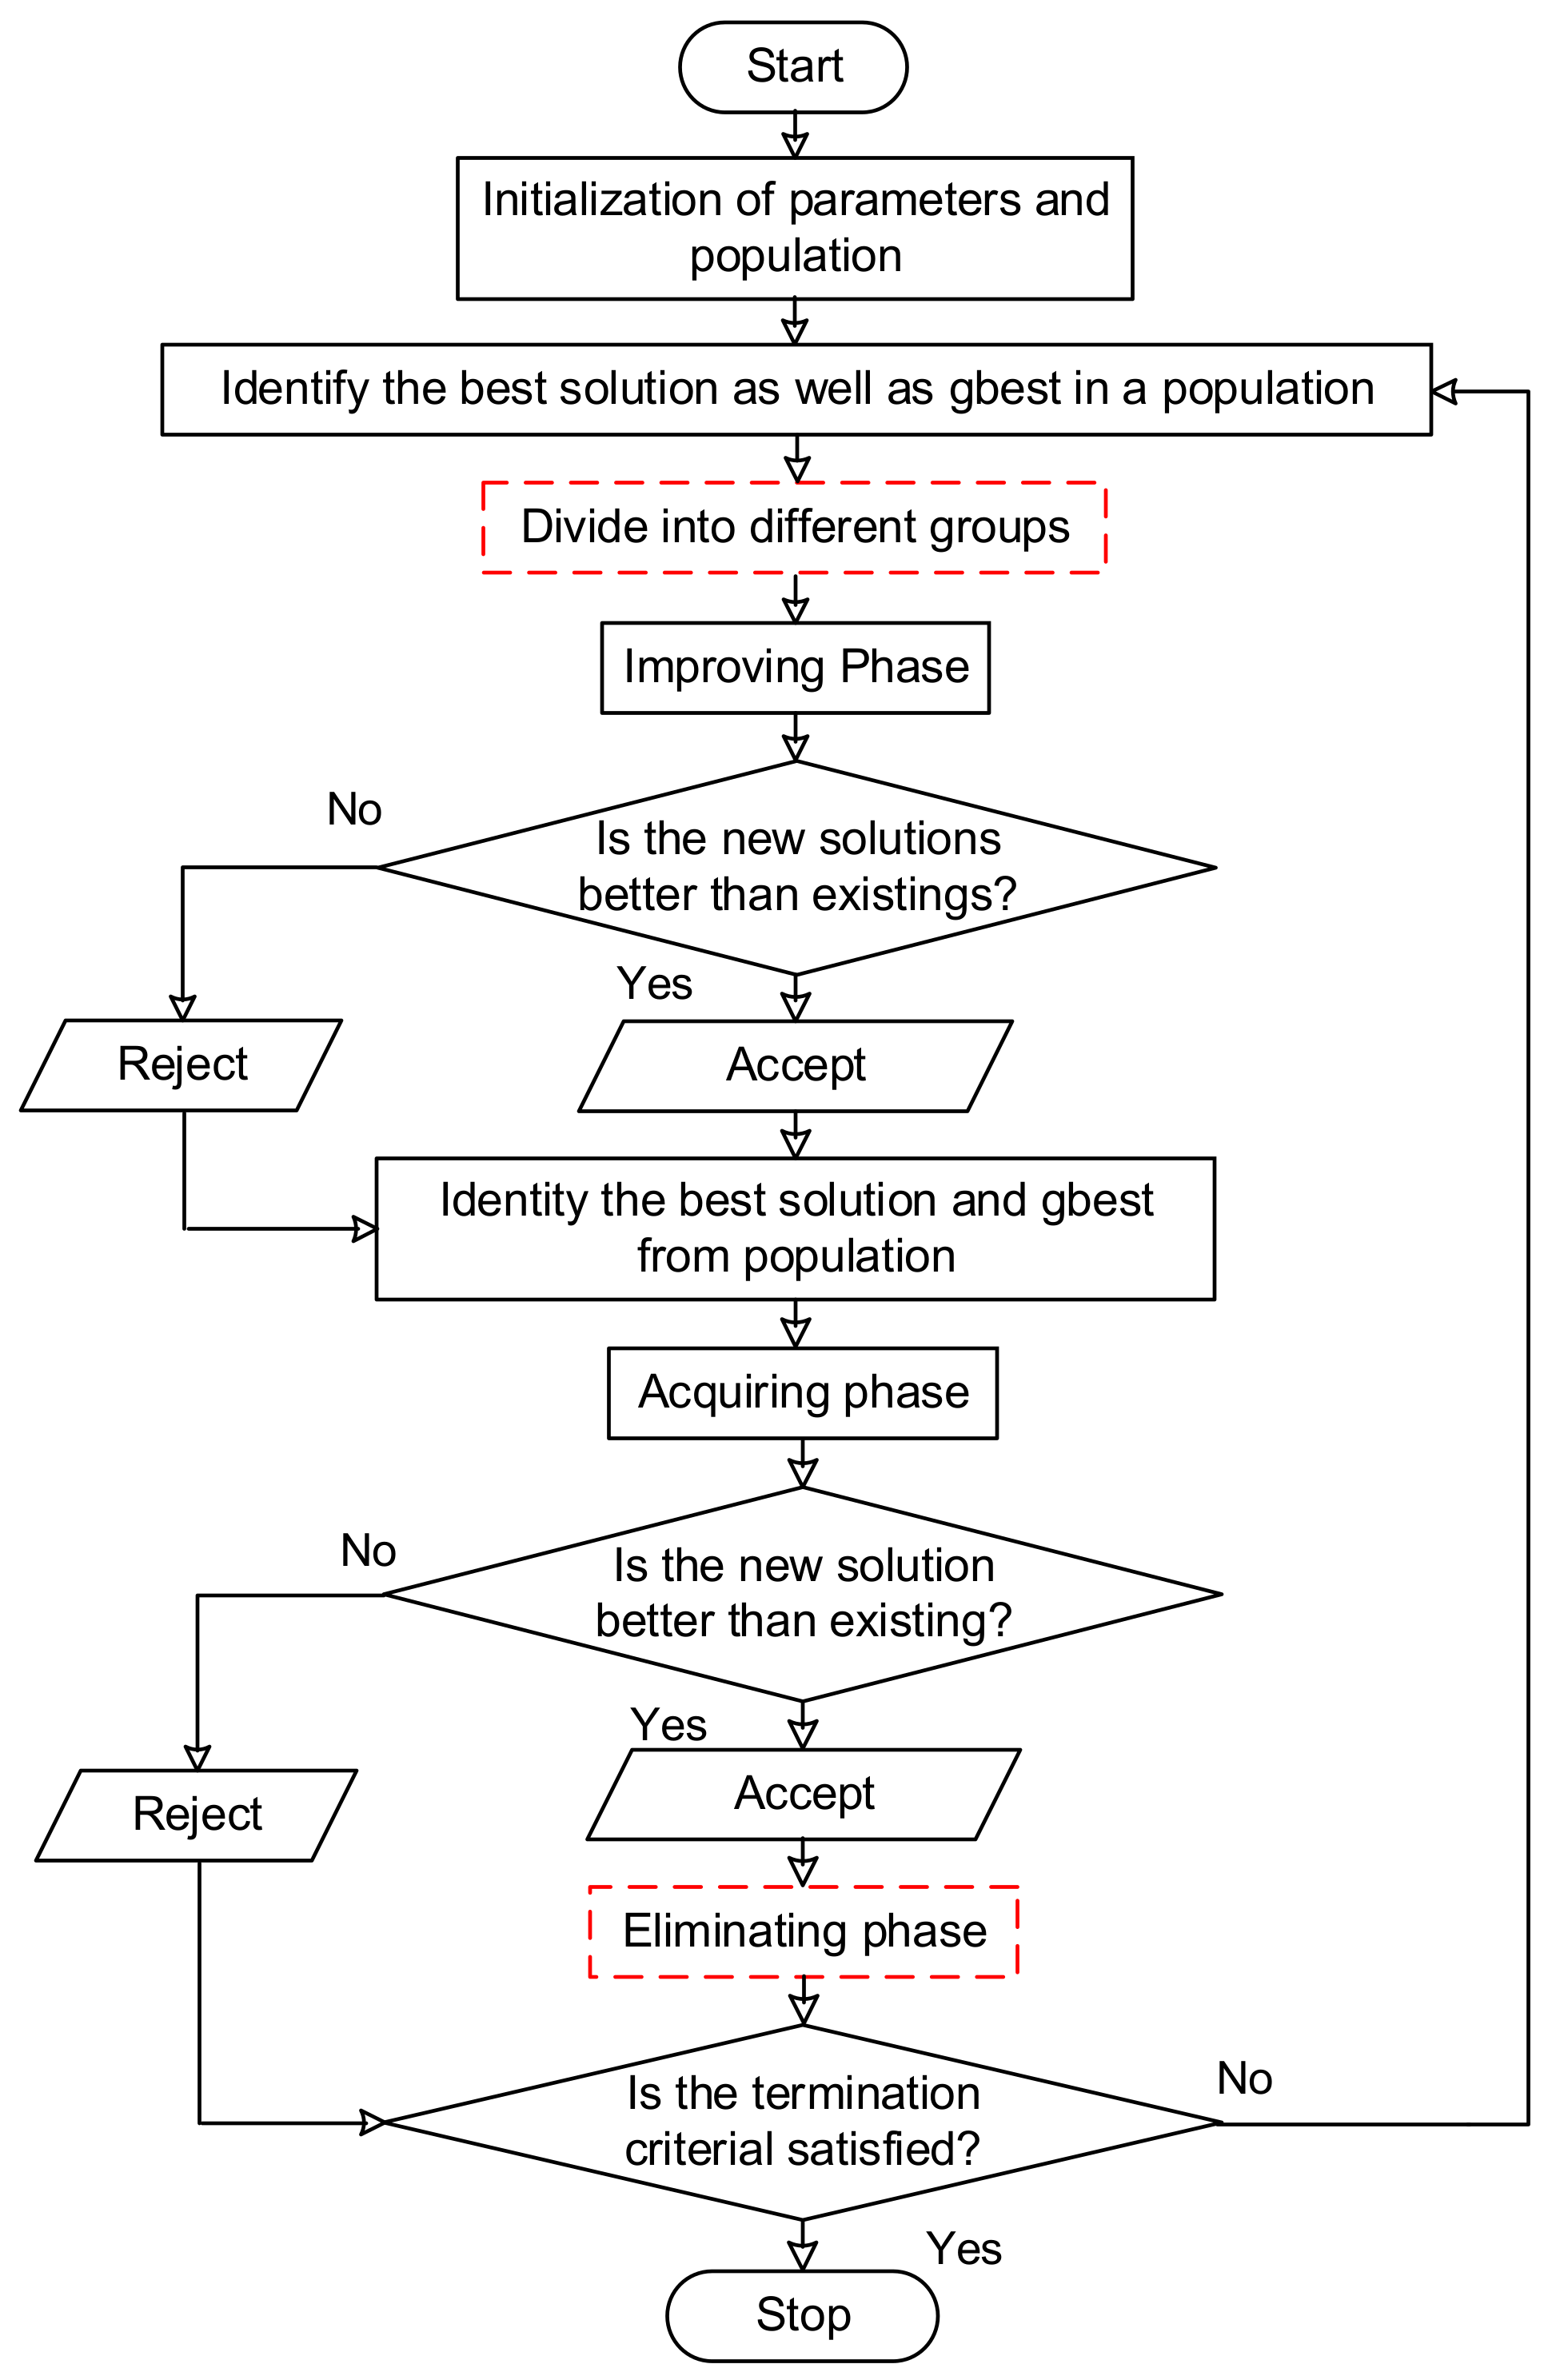
However, in the standard SGO, since the persons (candidate solutions) are only sorted into one team, each person can only acquire knowledge from the one team leader in this group, which may cause the algorithm to fall into local optima. Furthermore, the weakest person in each generation is not improved, which is not conducive to explore more potentials. Hence, to improve the performance of the SGO, an improved SGO (ISGO) is proposed in this study. Figure 6 depicts the procedure of ISGO, in which the following two steps (steps in red dashed boxes) have been added oton the standard SGO.
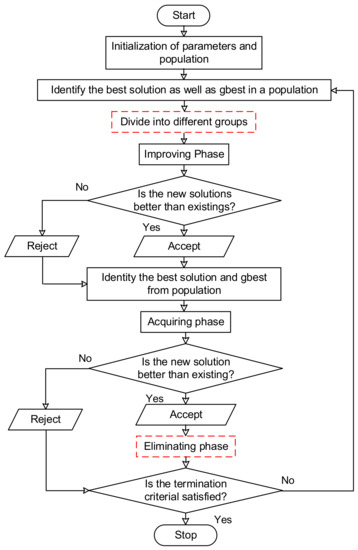
Figure 6.
Flowchart of the improved social group optimization (ISGO).
(a) Dividing all persons into different groups
By adding this step between the steps “Identify the best solution as well as gbest in a population” and “Improvement Phase”, all persons are divided into different teams, so that the person’s knowledge level can be propagated by many leaders of other teams, which can help to overstep the local optimum.
(b) Elimination phase
This step is added before the last step: “Is the termination criteria satisfied?”. In this step, the weakest persons of each teams in every generation will be dismissed and substituted by new persons. Therefore, the searching range of the parameters can be enlarged, and the algorithm will be more likely to find the best solutions.
As shown as in Figure 6, the iteration will not terminate until the maximum generation number is achieved, and the optimal solution can be obtained.
3.2. Fault Diagnosis Model Based on Improved Social Group Optimization (ISGOSVM)
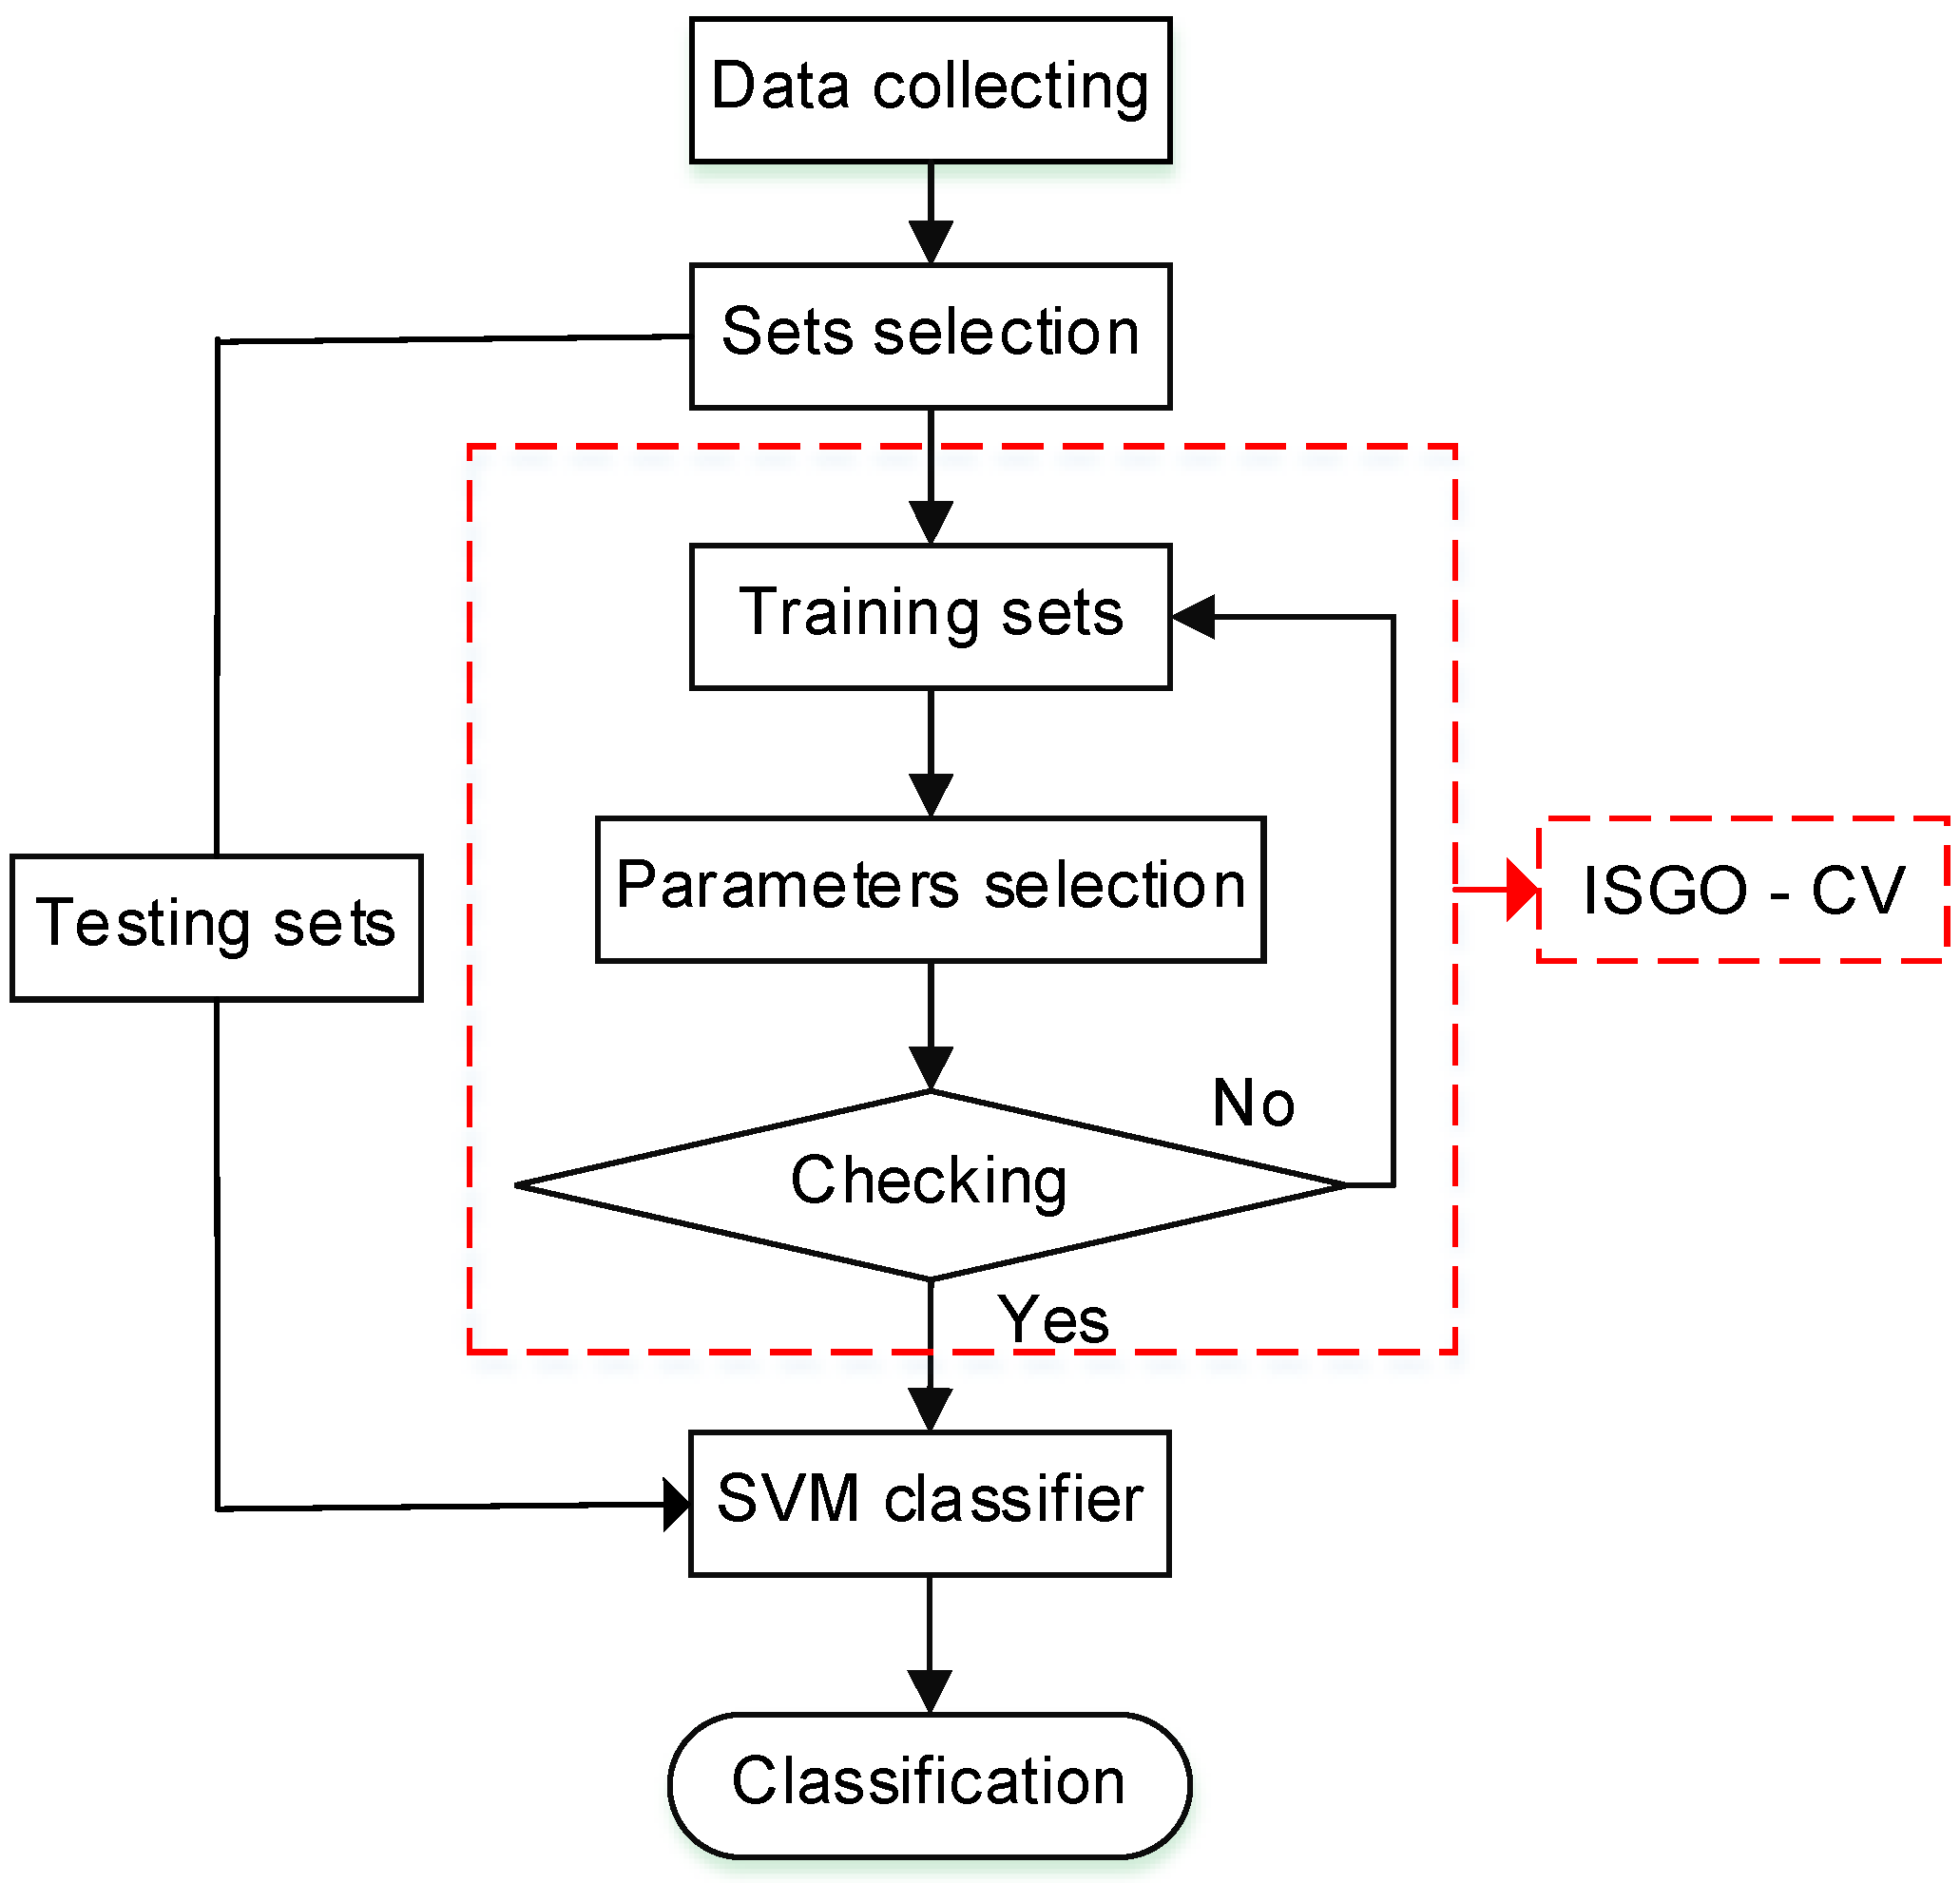
In fault diagnosis model, the ISGO was applied for obtaining the best C and g of the SVM multi-classifier. Figure 7 depicts the flowchart of fault diagnosis for power transformer. The major steps were concluded as follows:
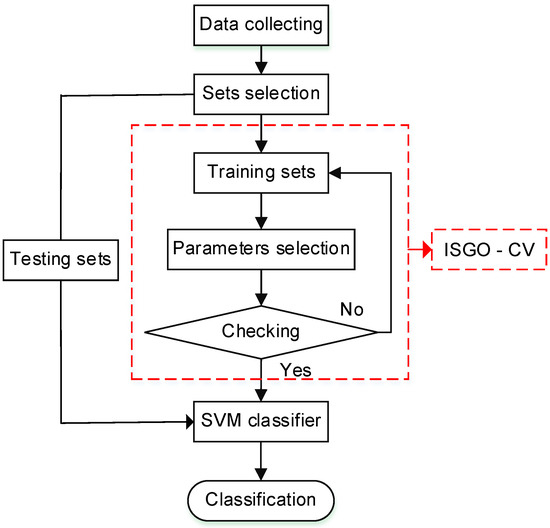
Figure 7.
Flowchart of classification based on the improved social group optimization (ISGOSVM). ISGO-CV: ISGO and cross-classification.
Step 1: The data on fault samples (including the concentration of dissolved gases and corresponding fault types) of power transformers were collected and sorted into “Training set” and “testing set” randomly.
Step 2: The training set was used to construct the SVM multi-classifier model, and the testing set was used to calculate the individual fitness.
Step 3: The parameters was optimized based on the ISGO and cross-classification (ISGO-CV). The ISGO is applied to obtain the optimal parameters (C, g) of the SVM multi-classifier. The accuracy of cross-classification (CV) of transformer fault training samples was adopted as the individual fitness function. The iteration will not stop until the termination condition is met.
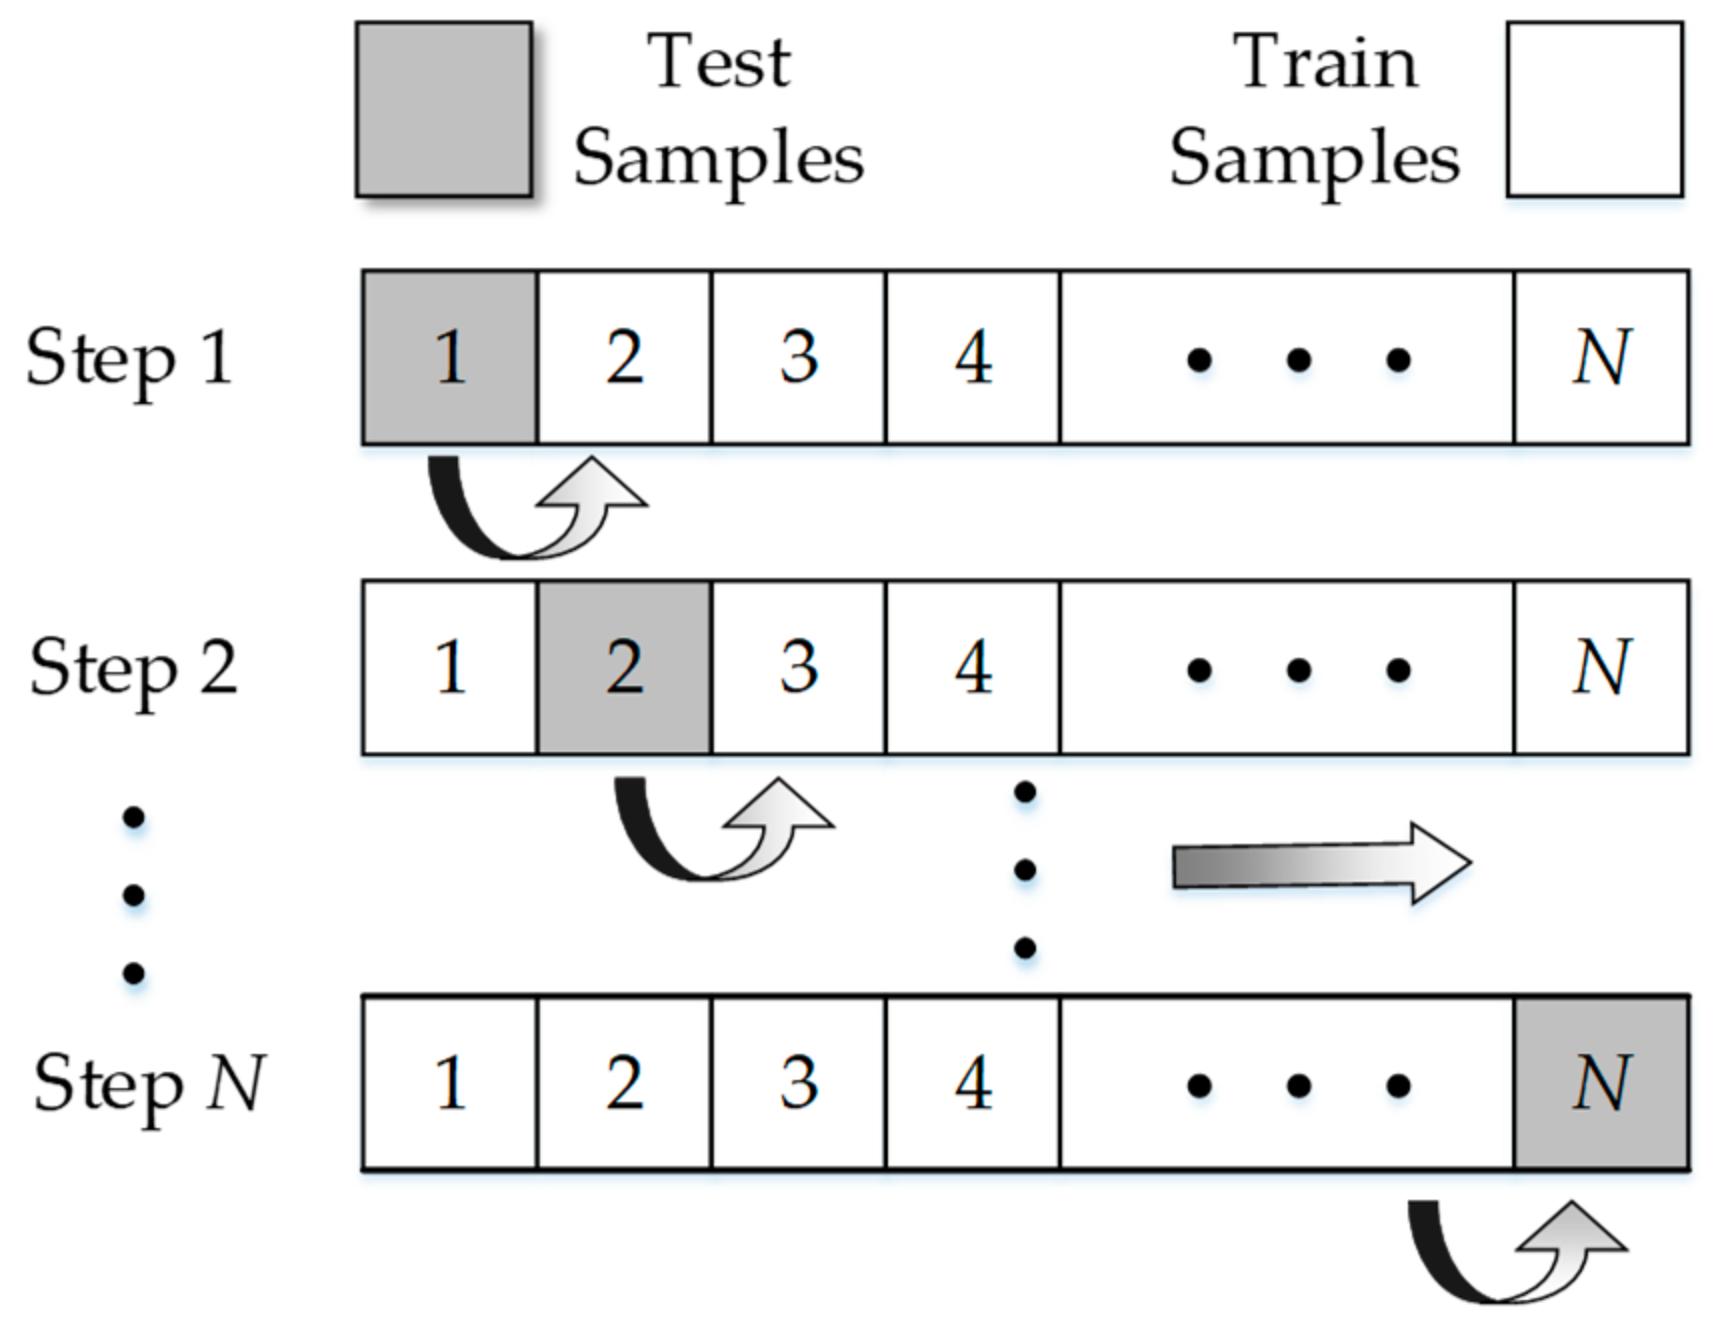
Step 4: Based on the optimal parameters (C, g), the optimal SVM multi-classifier model can be built, and the corresponding classification accuracy of fault types could be obtained, too. Here, to effectively represent the accuracy of the testing set, the Leave-One-Out Method was adopted. Figure 8 illustrates the schematic of “leave-one-out” method.
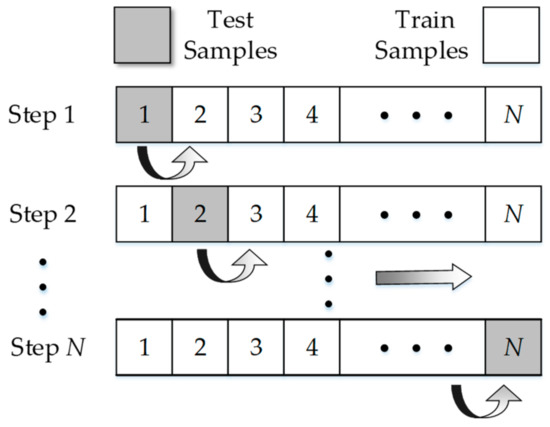
Figure 8.
Schematic of “leave-one-out” method.
As shown in Figure 8, for a testing set with N fault samples, the samples are divided N times by the Leave-One-Out Met (LOOM). Each time, one sample was retained for testing, and the others were training samples to train the SVM. The SVM parameters are optimized by GA (genetic algorithm) and diagnosed by the test sample. To obtain the fault diagnosis accuracy of the transformer based on the LOOM, the first sample to the Nth is selected in turn, and the number of samples which were diagnosed correctly in the Nth division were counted. Then the accuracy was used to evaluate the fault diagnosis performance of the six preferred characteristic quantities.
4. Case Study and Analysis
To obtain more fault types for modeling, 118 DGA fault samples collected in IEC TC 10 were divided into five classes by actual conditions, such as low energy arc (class 1), high energy arc (class 2), thermal fault of low and medium temperature (class 3), thermal fault of high temperature (class 4), and normal condition (class 5). The OHFS was chosen as the input of the fault diagnosis, the ISGOSVM model described in Section 3 was applied to fault diagnosis of transformers. The accuracy of the ISGOSVM was tested and compared with SGOSVM (SVM classifier optimized by social group optimization) and some conventional diagnostic models such as GASVM (SVM classifier optimized by genetic algorithm optimization), PSOSVM (SVM classifier optimized by particle swarm optimization), and SVM methods.
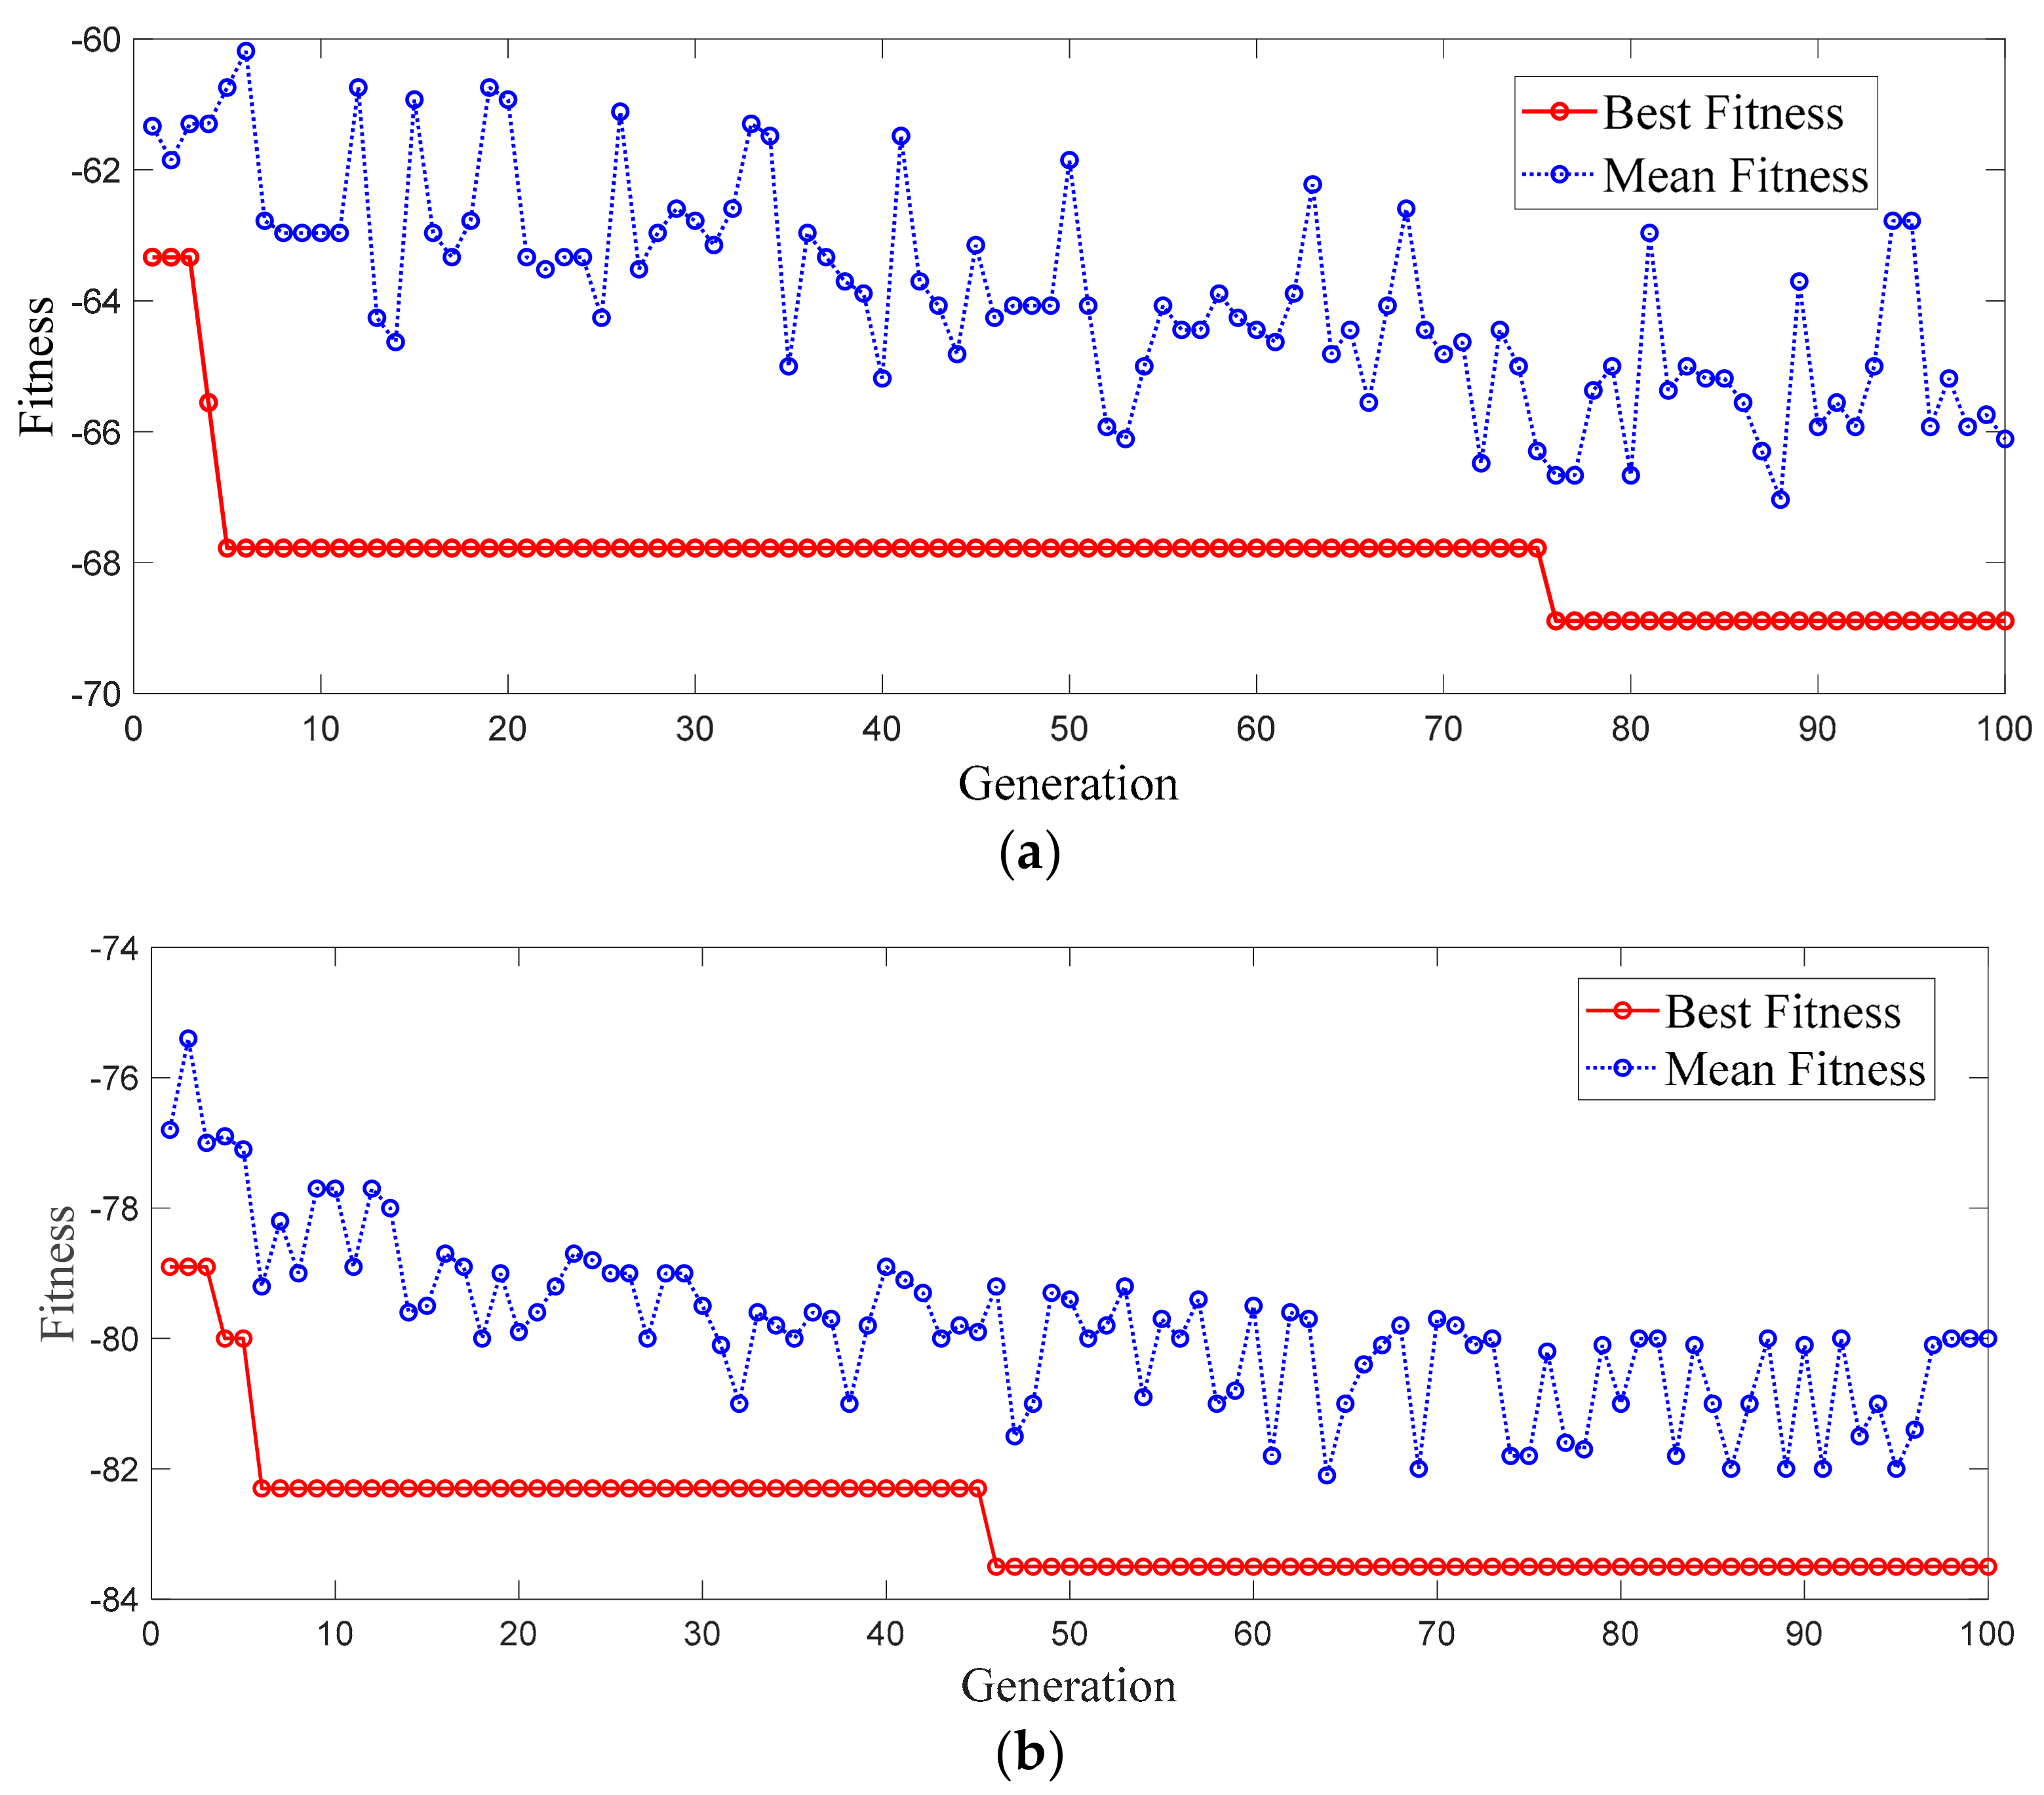
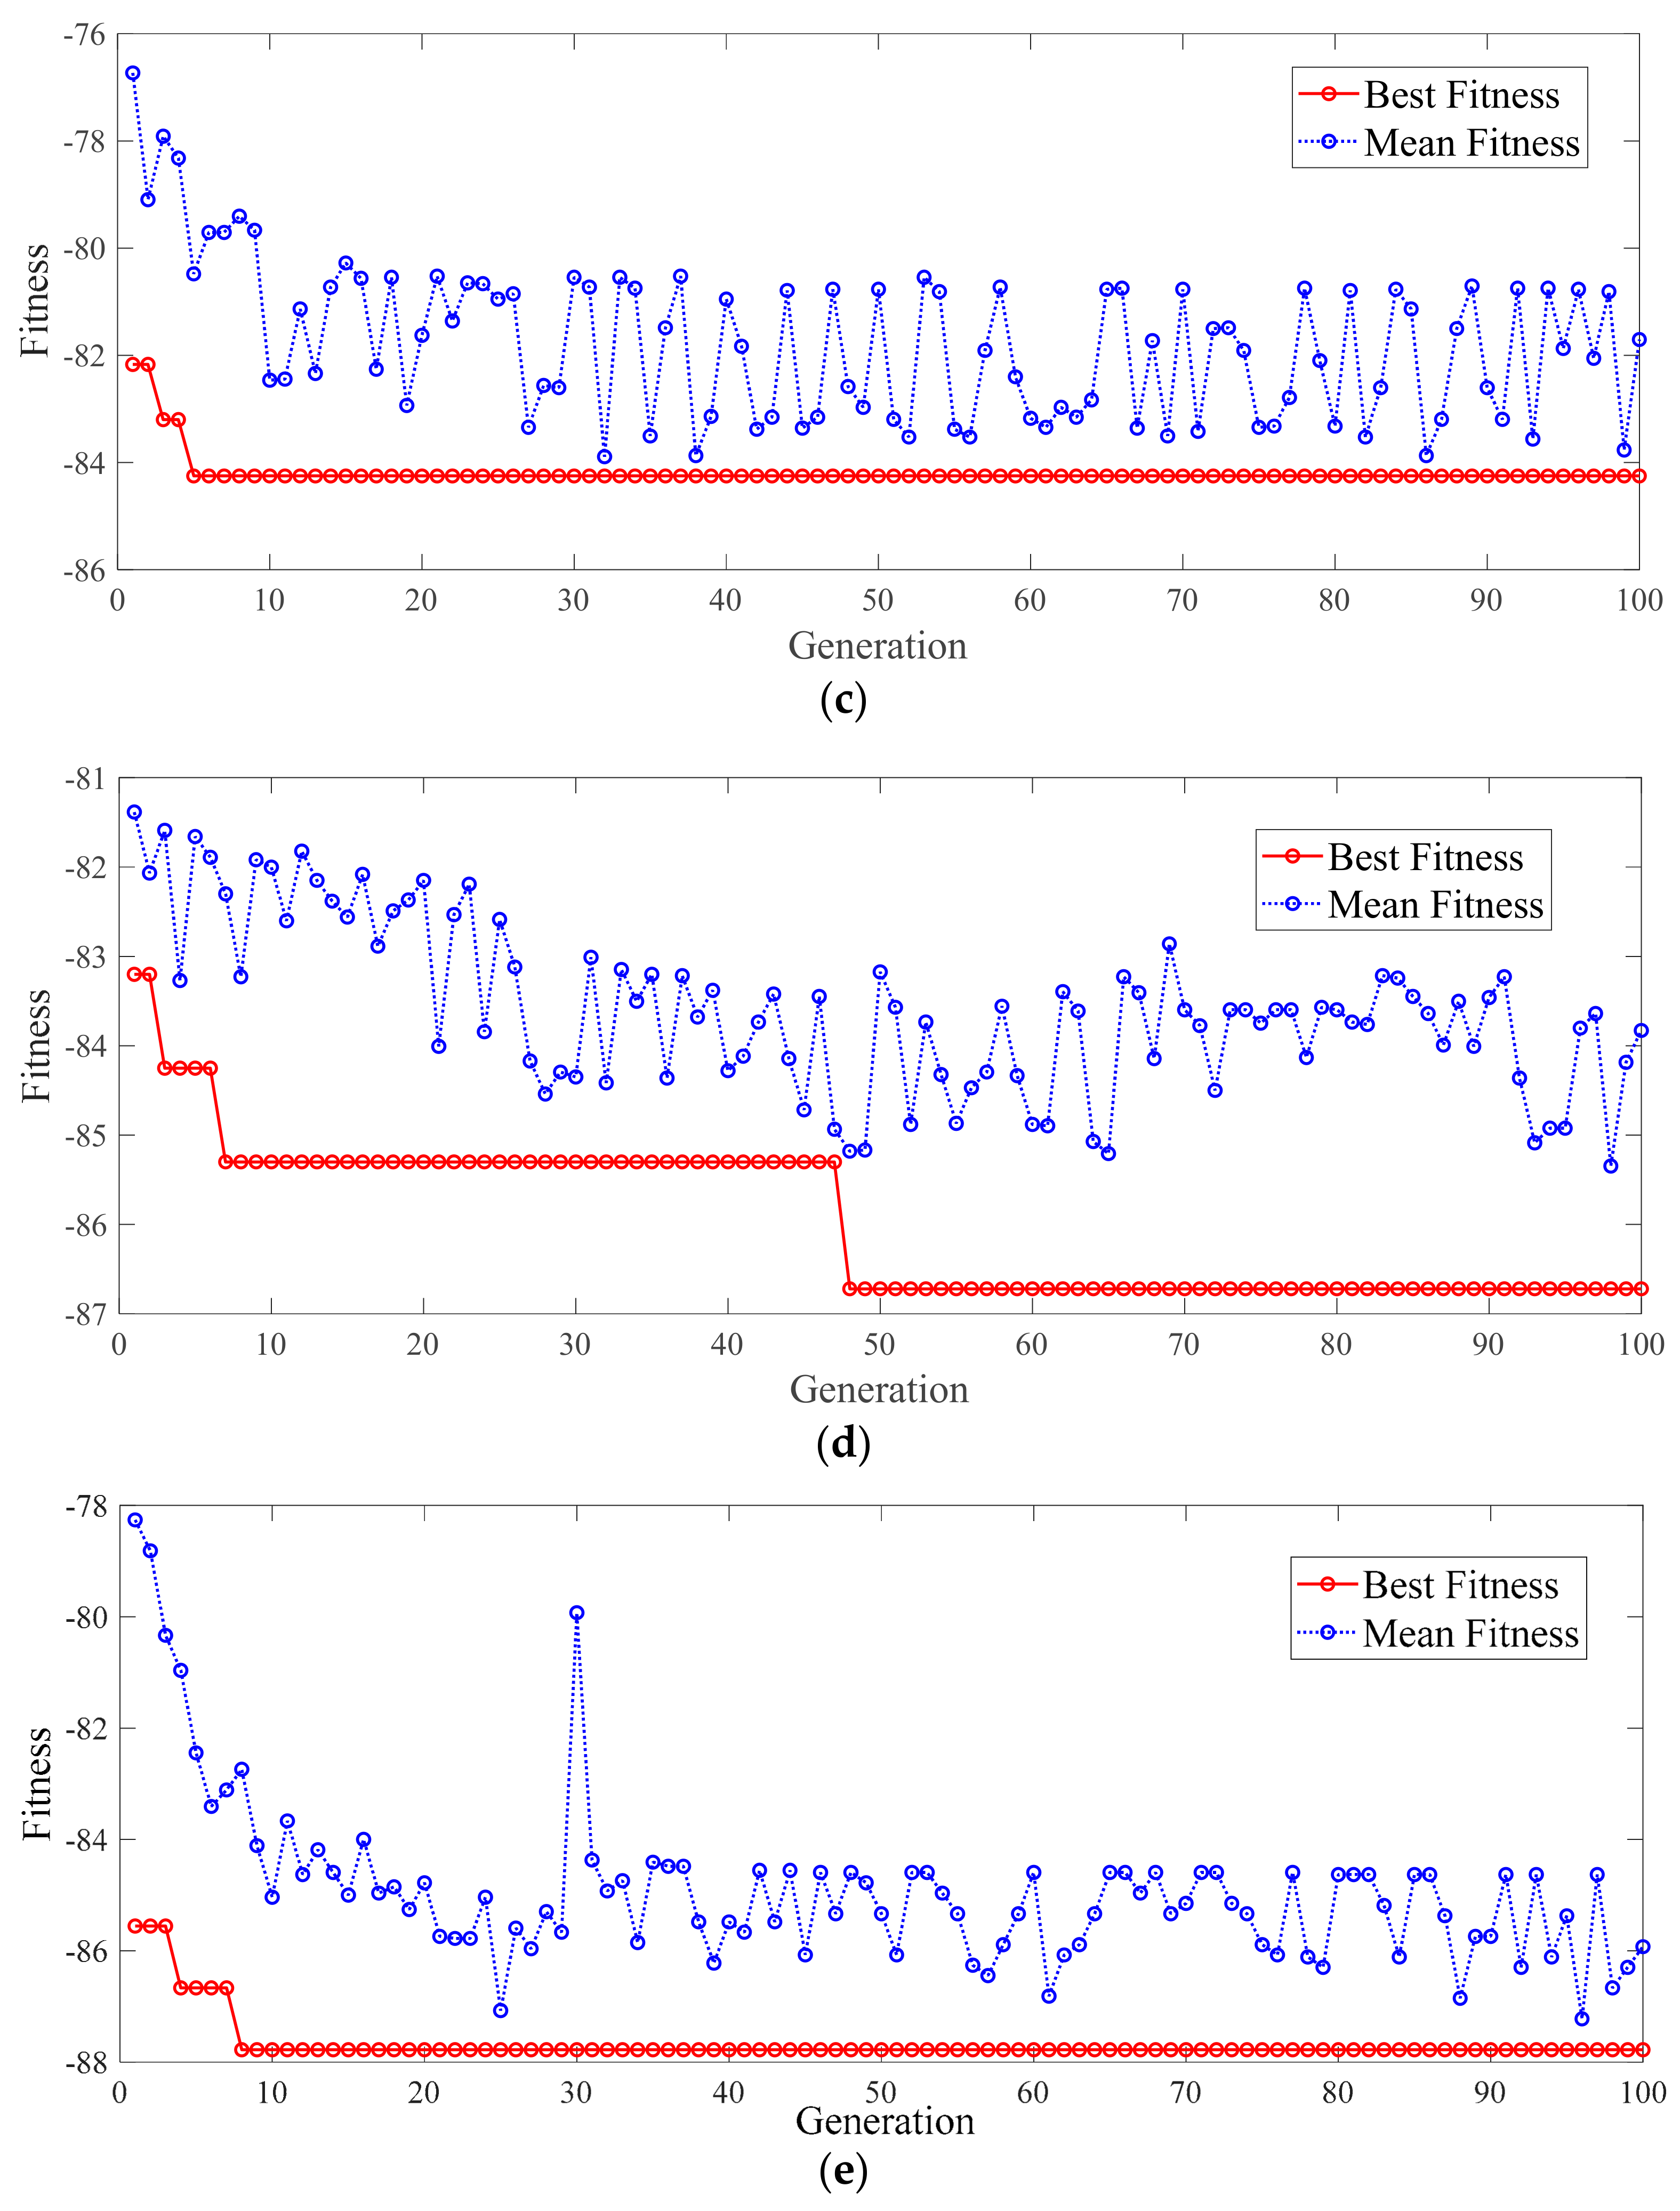
In this study, the ranges of parameters (C and g) are [0, 200] and [0, 70], respectively. The parameters of ISGO were set as follows: the maximum number of iterations was 100, and the number of persons in each team and the number of teams are set as 30 and 3, respectively. Figure 9 shows the average fitness and best fitness of the five methods.
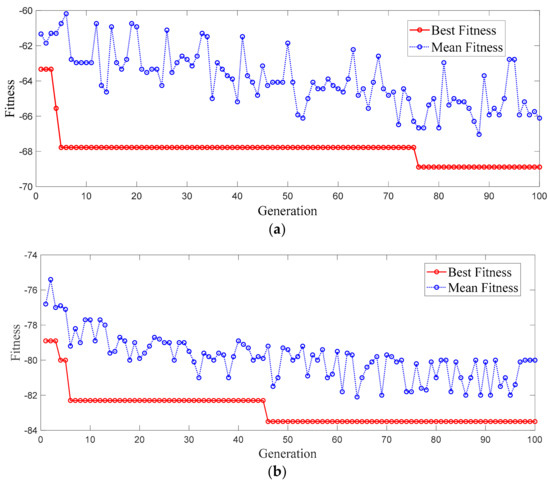
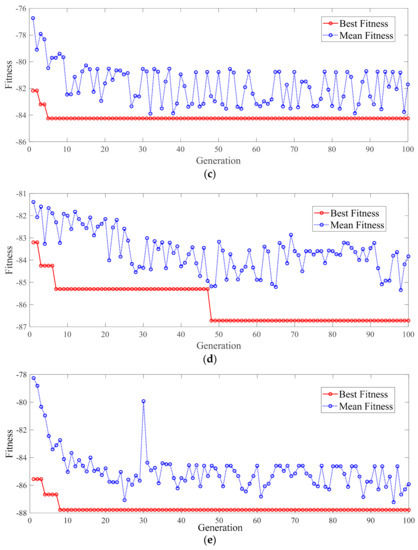
Figure 9.
Average fitness and best fitness of five methods. (a–e) represent the SVM, PSOSVM (SVM classifier optimized by particle swarm optimization), GASVM (SVM classifier optimized by genetic algorithm optimization), SGOSVM (SVM classifier optimized by social group optimization) and the ISGOSVM (SVM classifier optimized by improved social group optimization), respectively.
As shown in Figure 9, the best fitnesses of the five methods are −68.92 (SVM), −83.47(PSOSVM), −84.49 (GASVM), −86.72 (SGOSVM), and −87.89 (ISGOSVM). The ISGO achieved the best performance in optimizing parameters.
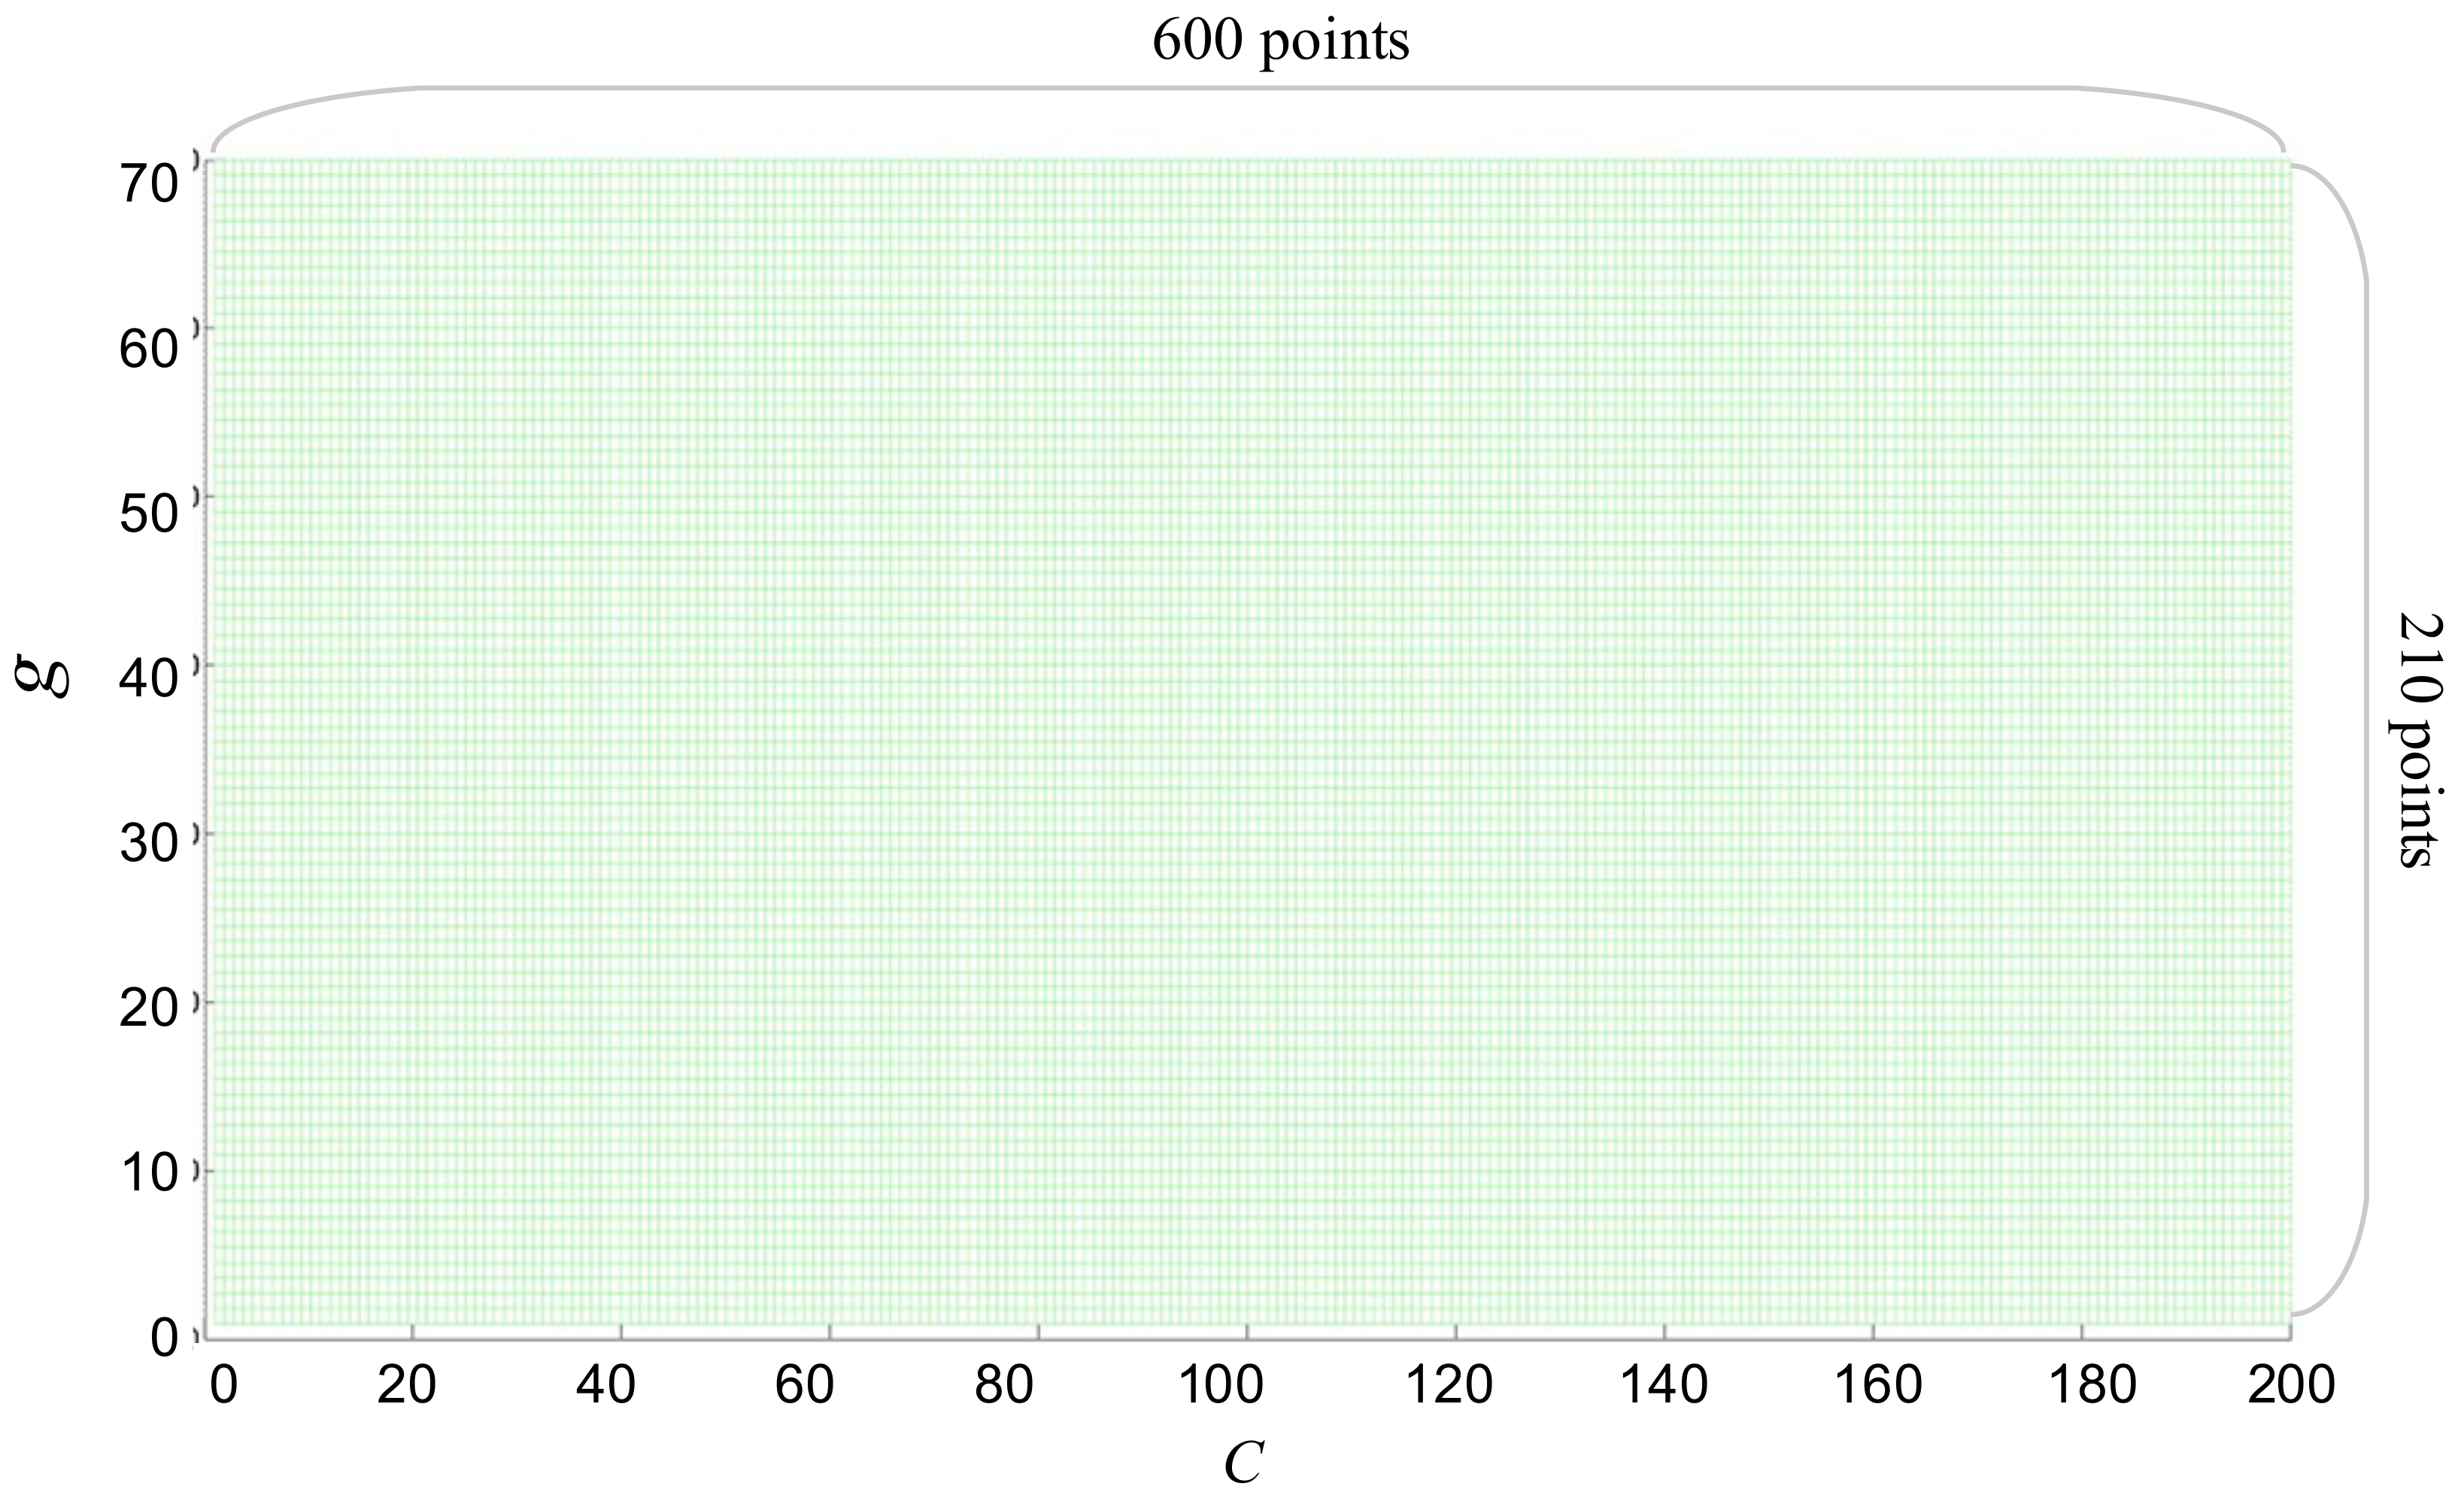
As shown in Figure 10, to investigate the influence of parameters (C and g) exert on diagnostic accuracy and compare the performances of different optimization algorithms, we set up a set of samples set which contains 126,000 (600 × 210 = 126,000) sample points in the search scope of C and g and depict them in a cartesian coordinate system in the plane. Each point (C, g) in samples set was tested as the input of a SVM multi-classifier.
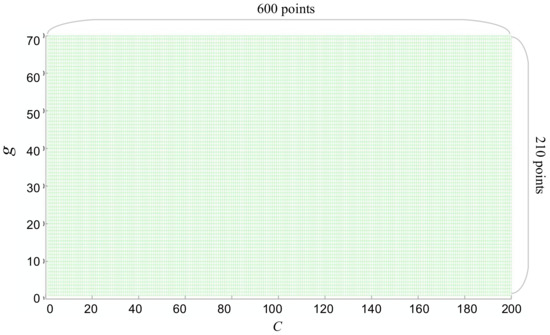
Figure 10.
Samples set containing 126,000 sample points set up in the search scope of C and g.
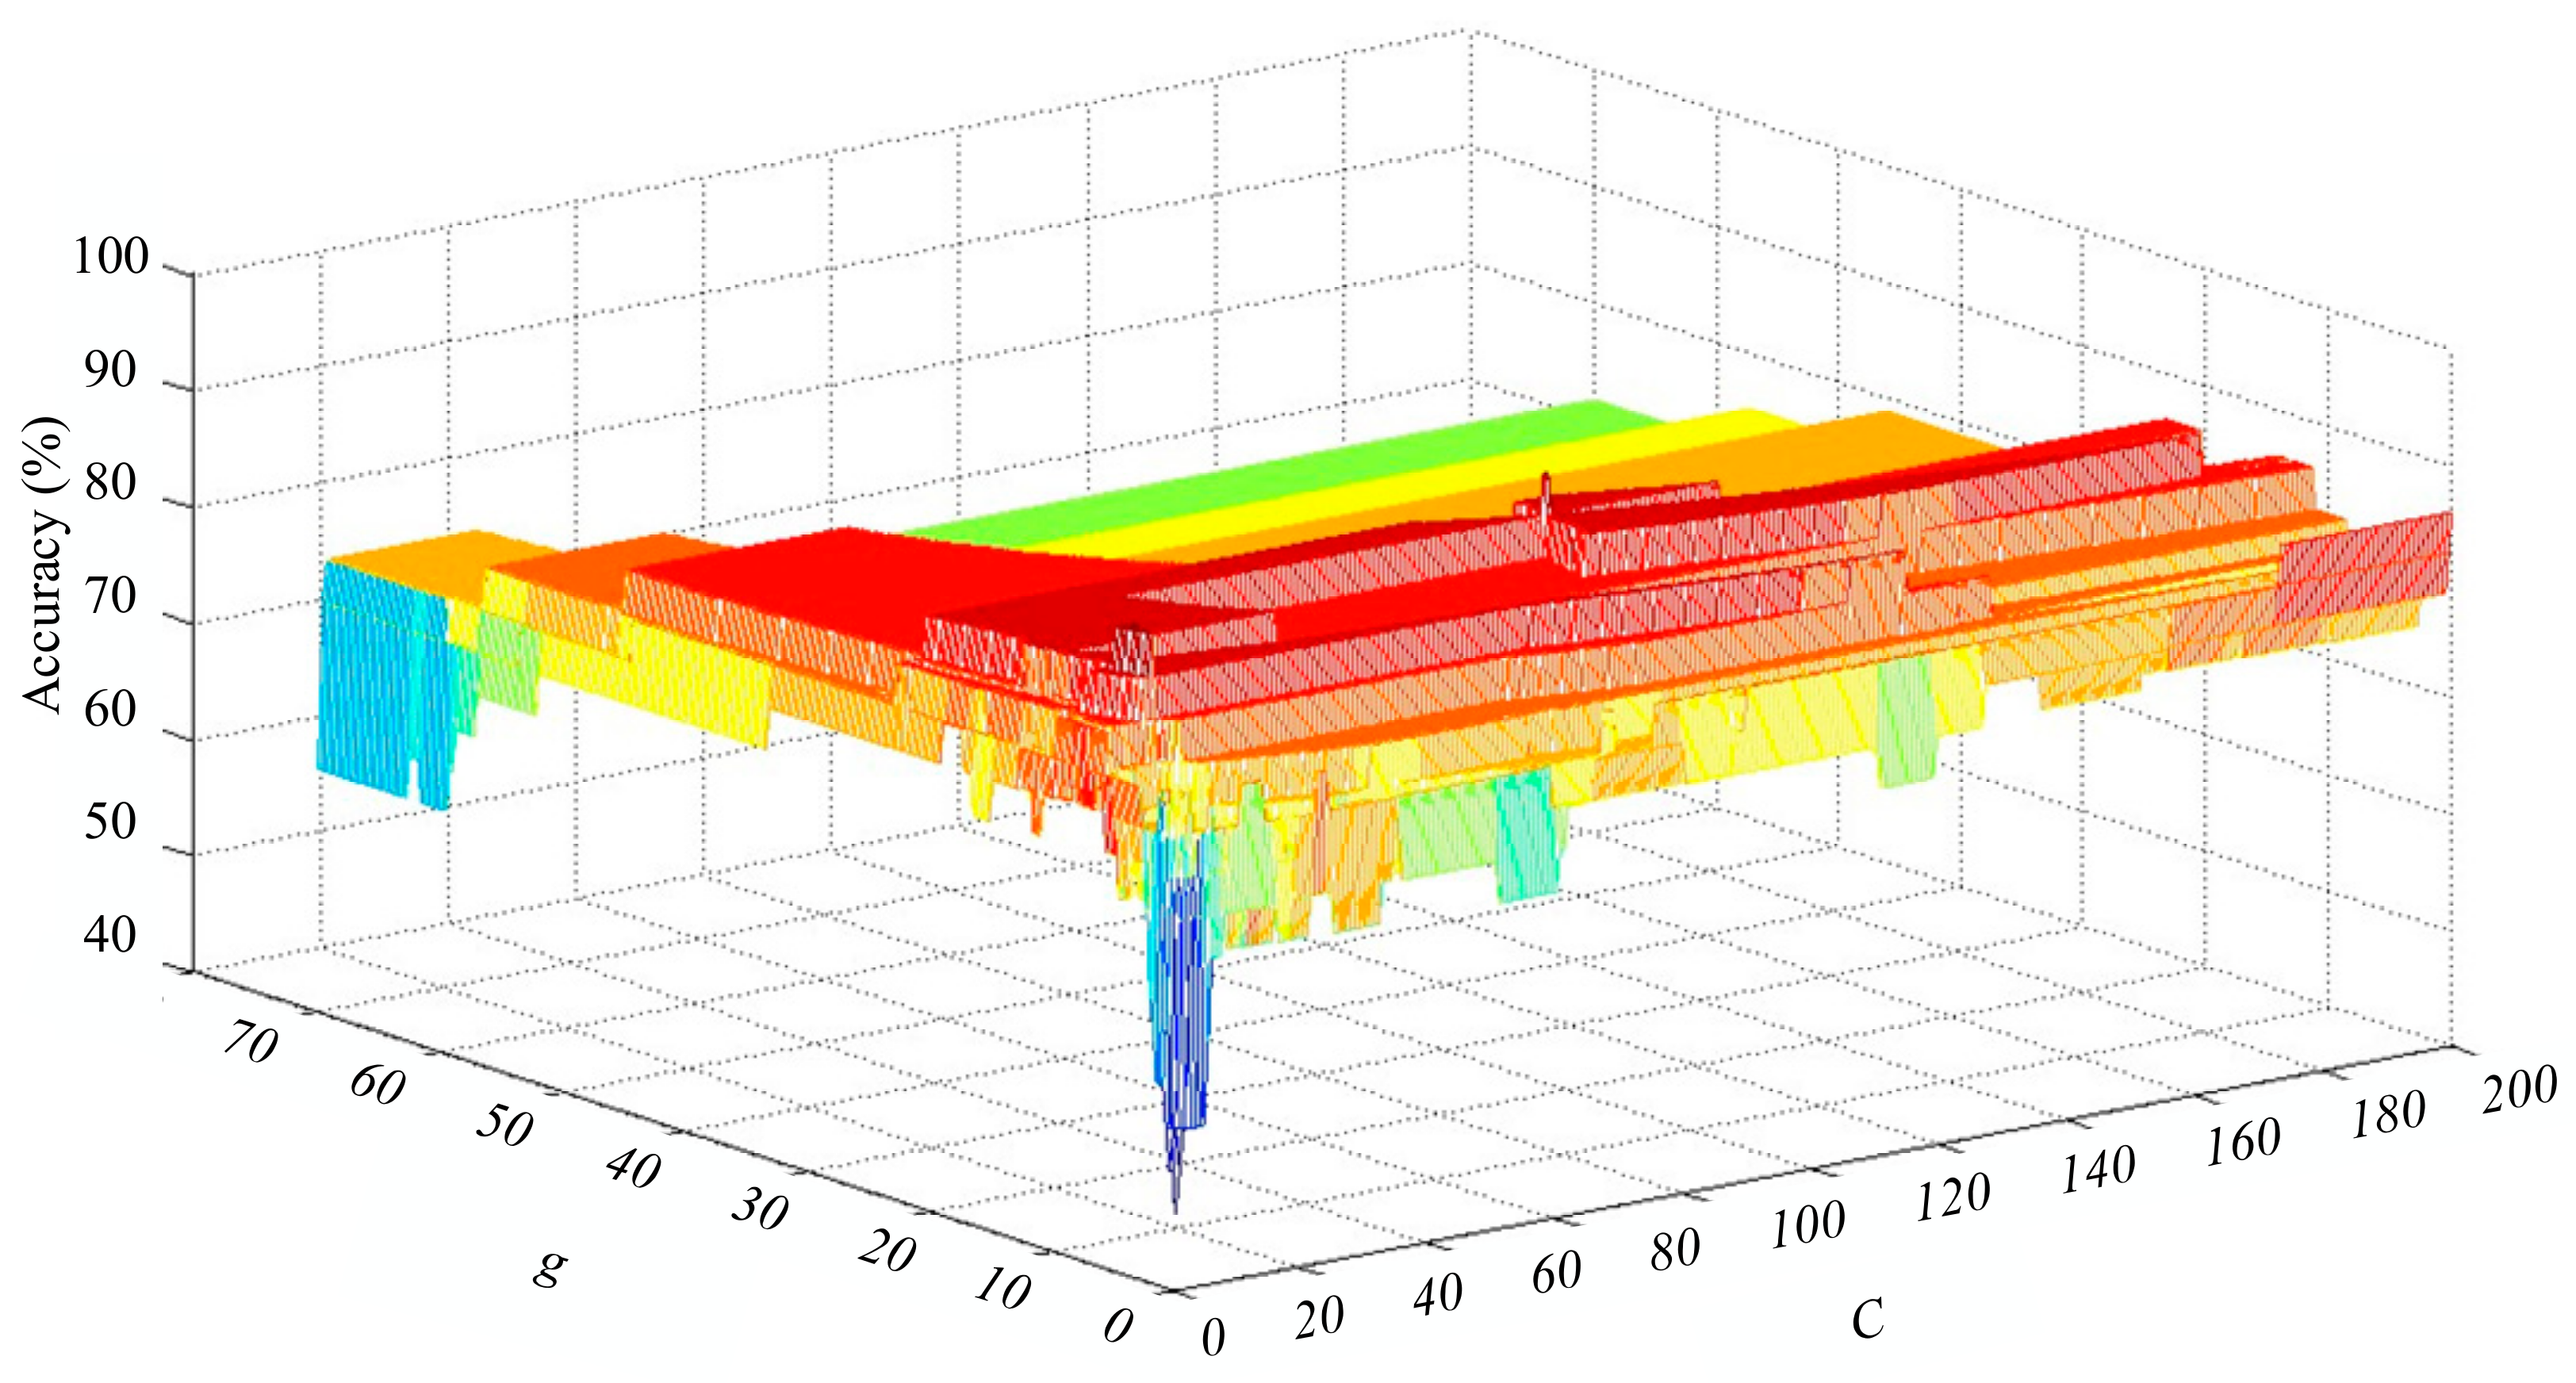
Figure 11 illustrates the relationship between C, g, and diagnostic accuracy with a Cartesian coordinate system in three dimensions, in which the X-axis, Y-axis, and Z-axis represent C, g and diagnostic accuracy, respectively. The larger the value of Z-axis, the higher the accuracy is (i.e., the deeper the red (blue) color is, the higher (lower) the accuracy of diagnosis is). From Figure 11 we can tell that the values of SVM parameters can significantly influence the accuracy of fault diagnosis. For example, the accuracy can be very low when (C, g) is near the origin (0, 0), but very high when (C, g) near the origin (10, 9). In addition, there were no specific laws can be summed up between SVM parameters and diagnostic accuracy, though there might be a general trend of “step up and then down” along the diagonal line from the origin. Therefore, the optimization for SVM parameters is necessary to obtain a better performance of classification of faults. Such an irregular distribution is a great test of the optimization performance of the algorithm.

Figure 11.
Testing accuracies for 126,000 sample points.
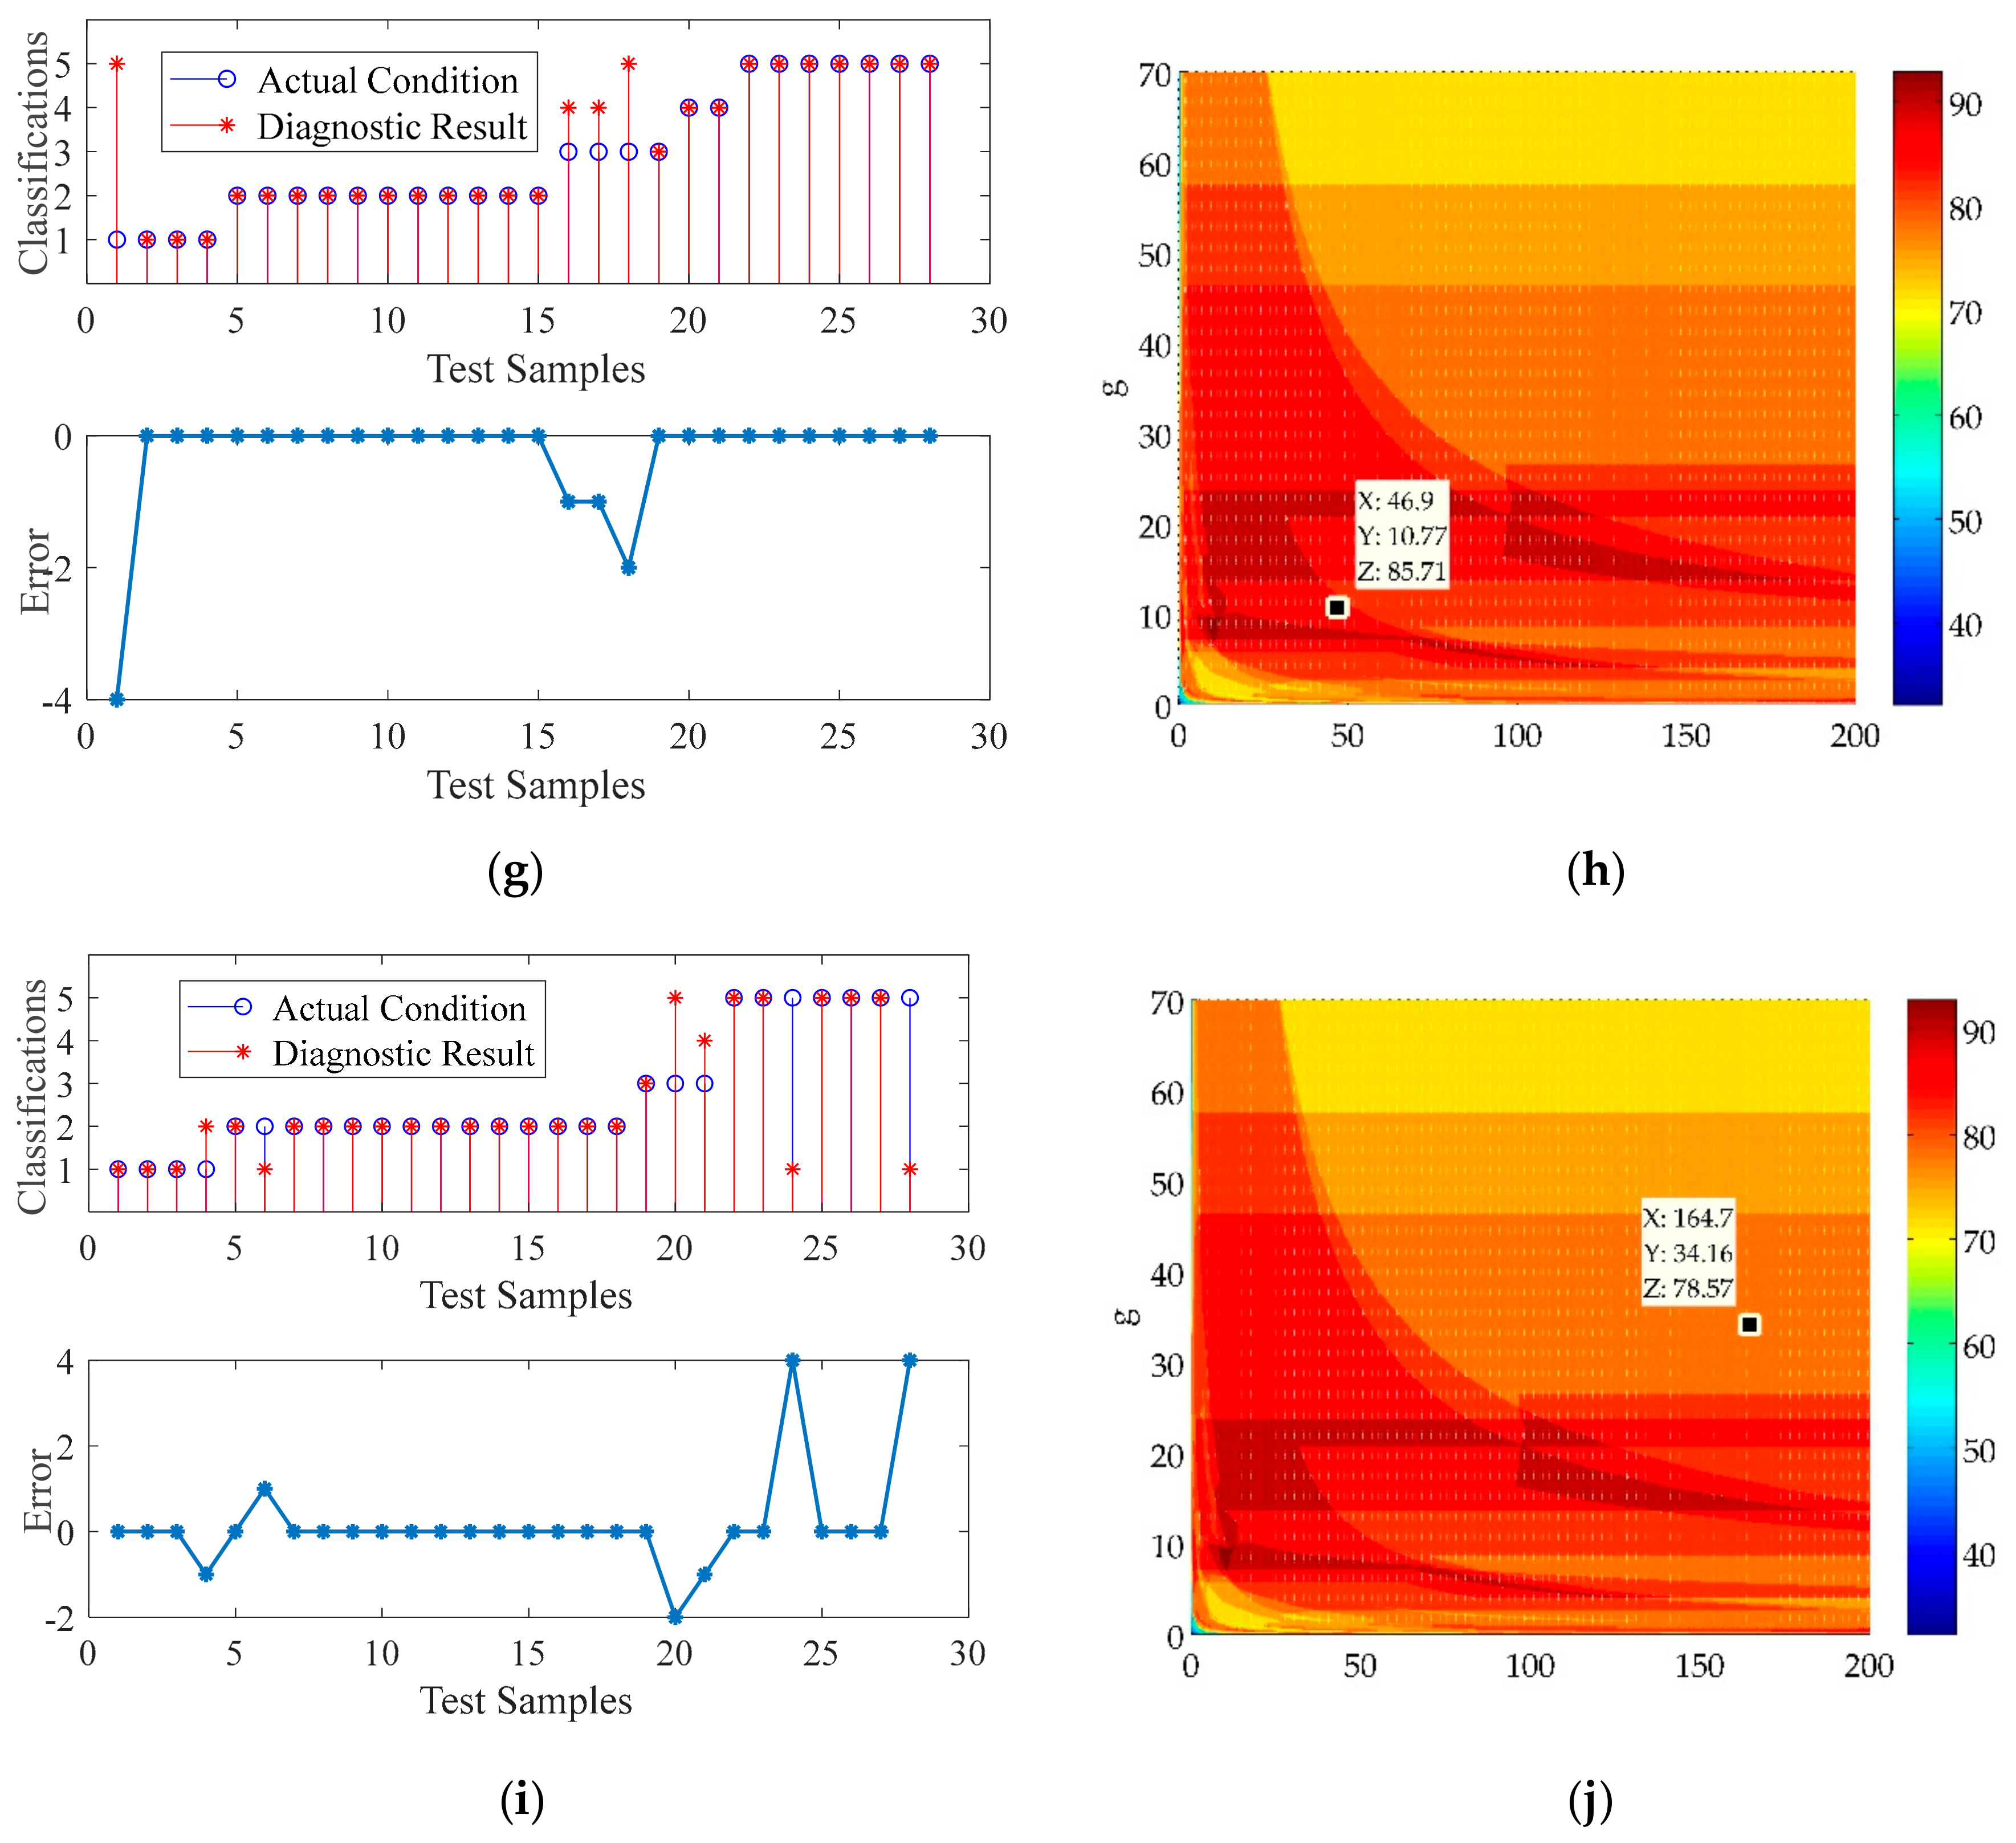
To compare the performances of five optimization algorithms, we applied them to optimize SVM parameters based on same DGA features and same fault samples, respectively. The testing accuracy and coordinate of parameters searched by five algorithms are shown in Figure 10. From (a), (c), (e), (g) and (i) in Figure 12, we can find that ISGOSVM gained the highest accuracy of fault diagnosis, in which only two out of 28 testing samples were misdiagnosed, the testing accuracy is 92.86%, followed by ISGOSVM (89.29%), GASVM (89.29%), PSOSVM (85.71%), and SVM (78.57%) methods. From (b), (d), (f) (h) and (j) in Figure 12, we can tell that the parameters optimized by ISGO located in the optimal area (the area is filled the deepest red color), while that which was optimized by the other four methods were located as inferior areas.
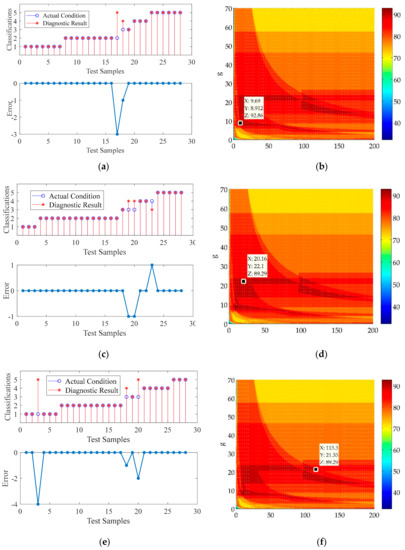
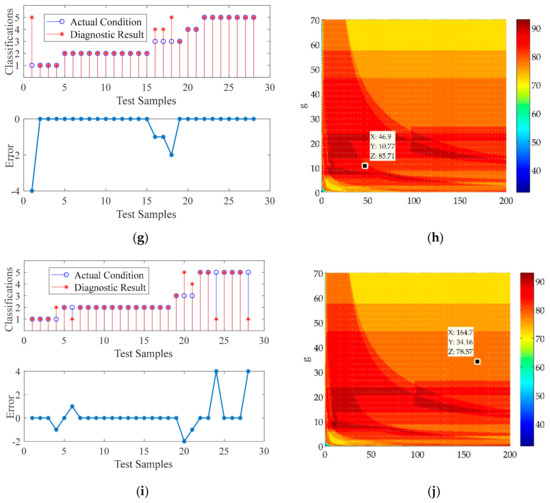
Figure 12.
Fault diagnose results and the spatial distribution of optimal solution using different methods. (a,c,e,g,i) are the diagnostic results of 30 test samples which using ISGO (improved social group optimization), SGO (social group optimization), GA (genetic algorithm), PSO (particle swarm optimization), and non-optimized, respectively. (b,d,f,h,j) show the spatial distribution of optimal solution searched out by ISGO, SGO, GA, PSO, and non-optimized. X, Y, and Z represent the c, g, and accuracy (%), respectively.
5. Conclusions
To address the limitations in the DGA feature selection and SVM parameter optimization, a hybrid fault diagnosis model combining the feature screening with the ISGO-optimized SVM multi-classifier is built in the paper. The major conclusions in this paper are listed as follows:
(1) We use the dissolved gases, dissolved gas ratios, and hybrid DGA features to construct three types of DGA feature sets, respectively. The GA-SVM-FS model was built to screen out the optimal feature subset from each feature set according to fitness. Twelve feature subsets are screened out and we choose the best one as the OHFS, which including CH4/H2, CH4/C2H4, CH4/C2H6, CH4/CO2, H2/C2H2, H2/CO, H2/CO2, H2/TH, C2H2/CO, C2H2/TH, C2H4/TH, C2H6/TH, C2H2, and C2H6. The result shows that the accuracy based on the OHFS is 3–30% higher than DGA gases, or gas ratios formed feature sets.
(2) The improved SGO (ISGO) is proposed and used to build a ISGOSVM fault diagnosis model in this paper, and its performance in optimizing parameters is tested and compared with SGO, GA and PSO. The result show that ISGO can produce better solutions than other algorithms, and the diagnosis accuracy of ISGOSVM is 3%–14% higher than that of the other four methods.
(3) The ISGOSVM classifier model integrated the OHFS can obtain the highest testing accuracy (92.86%), which can confirm the effectiveness of the proposed method.
According to results of the case study, the proposed methods can be applied to the operation and maintenance of power transformers. Firstly, the information of relevant gas concentration can be obtained from on-line monitoring system of dissolved gas in oil. Then, the OHFS can be calculated and input to the ISGOSVM fault diagnostic model. Finally, the maintenance personnel can monitor the operation status and fault type of the transformer in real time, which can help to detect, diagnose, and overhaul faults in time. We believe that applying the proposed methods to fault diagnosis of transformers can prolong the service life of the equipment and reduce the cost of maintenance.
Author Contributions
H.Z., Y.Z., J.F. and J.L. contributed equally to the paper; J.F. and Y.Z. designed the experiments; H.Z., J.L. and Y.Z. analyzed the data; H.Z. performed the writing; J.Z. and K.W. contributed the literature search, discussion and paper modification; All authors have approved the submitted manuscript.
Funding
This work was funded by the National Basic Research Program of China (973 Program, 2013CB228205), and the National High-tech R & D Program of China (863 Program, 2015AA050204), the Natural Science Foundation of Guangxi (2015GXNSFBA139235), the Foundation of Guangxi Science and Technology Department (AE020069), and the Foundation of Guangxi Education Department (T3020097903), and the National Key Research and Development Program of China (2016YFB0900101) and Training program for thousands of young and middle-aged backbone teachers in Guangxi (Guangxi Education Department) in support of this work.
Acknowledgments
The authors acknowledge the National Basic Research Program of China (973 Program, 2013CB228205), and the National High-tech R & D Program of China (863 Program, 2015AA050204), the Natural Science Foundation of Guangxi (2015GXNSFBA139235), the Foundation of Guangxi Science and Technology Department (AE020069), and the Foundation of Guangxi Education Department (T3020097903), and the National Key Research and Development Program of China (2016YFB0900101) and National Demonstration Center for Experimental Electrical Engineering Education (Guangxi University) in support of this work.
Conflicts of Interest
The authors declare no conflict of interest.
Nomenclature
| DGA | dissolved gas analysis |
| SVM | support vector machine |
| SGO | social group optimization algorithm |
| ISGO | improved social group optimization algorithm |
| SGOSVM | SVM classifier optimized by social group optimization |
| ISGOSVM | SVM classifier optimized by improved social group optimization |
| GASVM | SVM classifier optimized by genetic algorithm optimization |
| PSOSVM | SVM classifier optimized by particle swarm optimization |
| FS1–FS3 | three feature sets: the basic dissolved gas formed feature set (FS1, including 8 dissolved gases), dissolved gas ratio formed feature set (FS2, including 28 DGA gas ratios) and the hybrid DGA feature set (FS3, 28+8 hybrid features) |
| GA-SVM-FS | optimization model to screen out optimal feature subset based on genetic algorithm and svm classifier based on genetic algorithm and SVM classifier |
| FSSi-j | the jth feature subset screened out from ith feature set |
| OHFS | optimal hybrid DGA features subset |
| c | penalty factor |
| g | kernel parameter of RBF |
| RBF | the kernel function of SVM classifier |
| λ | a random number (0 < λ < 1) |
| μ | self-introspection coefficient (μ–U(0, 1)) |
| gbest | the best person in a team |
| li | the number of samples in the ith verification set |
| liT | the correct classified number in the verification set |
| Lold | the position of person before and after updating |
| Lnew | the position of person before and after updating |
| LOOM | the Leave-One-Out Method |
References
- Li, J.S.; Zhou, H.W.; Meng, J.; Yang, Q.; Chen, B. Carbon emissions and their drivers for a typical urban economy from multiple perspectives: A case analysis for Beijing city. Appl. Energy 2018, 226, 1076–1086. [Google Scholar] [CrossRef]
- Zakaria, F.; Johari, D.; Musirin, I. Artificial Neural Network (ANN) Application in Dissolved Gas Analysis (DGA) Methods for the Detection of Incipient Faults in Oil-Filled Power Transformer. In Proceedings of the 2012 IEEE International Conference on Control System, Computing and Engineering, Penang, Malaysia, 23–25 November 2012; pp. 328–332. [Google Scholar]
- Huo, Z.; Zhang, Y.; Francq, P.; Shu, L.; Huang, J. Incipient fault diagnosis of roller bearing using optimized wavelet transform based multi-speed vibration signatures. IEEE Access 2017, 5, 19442–19456. [Google Scholar] [CrossRef]
- Equbal, M.D.; Khan, S.A.; Islam, T. Transformer incipient fault diagnosis on the basis of energy-weighted DGA using an artificial neural network. Turkish J. Electr. Eng. Comput. Sci. 2018, 26, 77–88. [Google Scholar] [CrossRef]
- Sylvestre N’cho, J.; Fofana, I.; Hadjadj, Y.; Beroual, A. Review of physicochemical-based diagnostic techniques for assessing insulation condition in aged transformers. Energies 2016, 9, 367. [Google Scholar] [CrossRef]
- Hadjadj, Y.; Meghnefi, F.; Fofana, I.; Ezzaidi, H. On the feasibility of using poles computed from frequency domain spectroscopy to assess oil impregnated paper insulation conditions. Energies 2013, 6, 2204–2220. [Google Scholar] [CrossRef]
- Boczar, T.; Cichon, A.; Borucki, S. Diagnostic expert system of transformer insulation systems using the acoustic emission method. IEEE Trans. Dielectr. Electr. Insul. 2014, 21, 854–865. [Google Scholar] [CrossRef]
- Albarracin, R.; Robles, G.; Ardila-Rey, J.A.; Cavallini, A.; Passaglia, R. Partial discharges: Keys for condition monitoring and diagnosis of power transformers. Power Transform. Cond. Monit. Diagn. 2018, 1–2. [Google Scholar] [CrossRef]
- Bakar, N.; Abu-Siada, A.; Islam, S. A review of dissolved gas analysis measurement and interpretation techniques. IEEE Electr. Insul. Mag. 2014, 30, 39–49. [Google Scholar] [CrossRef]
- Ueta, G.; Tsuboi, T.; Takami, J.; Okabe, S. Insulation characteristics of oil-immersed power transformer under lightning impulse and AC superimposed voltage. IEEE Trans. Dielectr. Electr. Insul. 2014, 21, 1384–1392. [Google Scholar] [CrossRef]
- Munajad, A.; Subroto, C. Study on the effects of thermal aging on insulating paper for high voltage transformer composite with natural ester from palm oil using Fourier transform infrared spectroscopy (FTIR) and energy dispersive X-ray spectroscopy (EDS). Energies 2017, 10, 1857. [Google Scholar] [CrossRef]
- Liu, J.; Zheng, H.; Zhang, Y.; Wei, H.; Liao, R. Grey relational analysis for insulation condition assessment of power transformers based upon conventional dielectric response measurement. Energies 2017, 10, 1526. [Google Scholar] [CrossRef]
- Zhang, Y.; Liu, J.; Zheng, H.; Wei, H.; Liao, R. Study on quantitative correlations between the ageing condition of transformer cellulose insulation and the large time constant obtained from the extended debye model. Energies 2017, 10, 1842. [Google Scholar] [CrossRef]
- Arshad, M.; Islam, S.M. Significance of cellulose power transformer condition assessment. IEEE Trans. Dielectr. Electr. Insul. 2011, 18, 1591–1598. [Google Scholar] [CrossRef]
- Portilla, W.H.; Mayor, G.A.; Guerra, J.P.; Gonzalez-Garcia, C. Detection of transformer faults using frequency-response traces in the low-frequency bandwidth. IEEE Trans. Ind. Electron. 2014, 61, 4971–4978. [Google Scholar] [CrossRef]
- Kim, J.W.; Park, B.K.; Jeong, S.C.; Sang, W.K.; Park, P.G. Fault diagnosis of a power transformer using an improved frequency-response analysis. IEEE Trans. Power Deliv. 2005, 20, 169–178. [Google Scholar] [CrossRef]
- Bathich, K.; Markos, A.Z.; Boeck, G. Frequency response analysis and bandwidth extension of the doherty amplifier. IEEE Trans. Microw. Theory Tech. 2011, 59, 934–944. [Google Scholar] [CrossRef]
- Bigdeli, M.; Vakilian, M.; Rahimpour, E. Transformer winding faults classification based on transfer function analysis by support vector machine. IET Electr. Power Appl. 2012, 6, 268–276. [Google Scholar] [CrossRef]
- Paulraj, T.; Hari, K.S.P.; Dhana, S.P. Modeling and location of faults in power transformer using Transfer Function and Frequency Response Analysis. In Proceedings of the 2014 IEEE International Conference on Advanced Communications, Control and Computing Technologies, Ramanathapuram, India, 8–10 May 2014. [Google Scholar]
- Patel, K.; Das, N.; Abu-Siada, A.; Islam, S. Power transformer winding fault analysis using transfer function. In Proceedings of the 2013 Australasian Universities Power Engineering Conference (AUPEC), Hobart, TAS, Australia, 29 September–3 October 2013. [Google Scholar] [CrossRef]
- The Institute of Electrical and Electronics Engineers. IEEE Guide for the Interpretation of Gases Generated in Oil-Immersed Transformers; IEEE Std C57.104-1991; IEEE: New York, NY, USA, 2008. [Google Scholar]
- Rogers, R.R. IEEE and IEC codes to interpret incipient faults in transformers, using gas in oil analysis. IEEE Trans. Electr. Insul. 1978, 13, 349–354. [Google Scholar] [CrossRef]
- Duval, M.; Depabla, A. Interpretation of gas-in-oil analysis using new IEC publication 60599 and IEC TC 10 databases. IEEE Electr. Insul. Mag. 2001, 17, 31–41. [Google Scholar] [CrossRef]
- Benhamed, K.; Mooman, A.; Younes, A.; Shaban, K.; EI-Hag, A. Feature selection for effective health index diagnoses of power transformers. IEEE Trans. Power Del. 2017. [Google Scholar] [CrossRef]
- Medeiros, R.P.; Costa, F.B. A wavelet-based transformer differential protection with differential current transformer saturation and cross-country fault detection. IEEE Trans. Power Del. 2017, 33, 789–799. [Google Scholar] [CrossRef]
- Fofana, I.; Hadjadj, Y. Electrical-based diagnostic techniques for assessing insulation condition in aged transformers. Energies 2013, 6, 697. [Google Scholar] [CrossRef]
- Venikar, P.A.; Ballal, M.S.; Umre, B.S.; Suryawanshi, H.M. Search coil based online diagnostics of transformer internal faults. IEEE Trans. Power Del. 2017, 32, 2520–2529. [Google Scholar] [CrossRef]
- Zheng, H.; Liu, J.; Zhang, Y.; Ma, Y.; Shen, Y.; Zhen, X.; Chen, Z. Effectiveness analysis and temperature effect mechanism on chemical and electrical-based transformer insulation diagnostic parameters obtained from PDC data. Energies 2017, 11, 146. [Google Scholar] [CrossRef]
- Tang, W.H.; Spurgeon, K.; Wu, Q.H.; Richardson, Z.J. An evidential reasoning approach to transformer condition assessments. IEEE Trans. Power Del. 2004, 19, 1696–1703. [Google Scholar] [CrossRef]
- Lin, C.; Wu, C.; Huang, P. Grey clustering analysis for incipient fault diagnosis in oil-immersed transformers. Expert Syst. Appl. 2009, 36, 1371–1379. [Google Scholar] [CrossRef]
- Islam, S.M.; Wu, T.; Ledwich, G. A novel fuzzy logic approach to transformer fault diagnosis. IEEE Trans. Dielectr. Electr. Insul. 2000, 7, 177–186. [Google Scholar] [CrossRef]
- Guardado, J.L.; Naredo, J.L.; Moreno, P.; Fuerte, C.R. A Comparative Study of Neural Network Efficiency in Power Transformers Diagnosis Using Dissolved Gas Analysis. IEEE Trans. Power Del. 2001, 16, 643–647. [Google Scholar] [CrossRef]
- Zhang, Y.; Zheng, H.; Liu, J.; Zhao, J.; Sun, P. An anomaly identification model for wind turbine state parameters. J. Clean Prod. 2018, 195, 1214–1227. [Google Scholar] [CrossRef]
- Dey, D.; Chatterjee, B.; Dalai, S.; Munshi, S.; Chakravorti, S. A deep learning framework using convolution neural network for classification of impulse fault patterns in transformers with increased accuracy. IEEE Trans. Dielectr. Electr. Insul. 2016, 24, 3894–3897. [Google Scholar] [CrossRef]
- Zheng, H.; Zhang, Y.; Liu, J.; Wei, H.; Zhao, J.; Liao, R. A novel model based on wavelet LS-SVM integrated improved PSO algorithm for forecasting of dissolved gas contents in power transformers. Electr. Power Syst. Res. 2018, 155, 196–205. [Google Scholar] [CrossRef]
- Benmahamed, Y.; Teguar, M.; Boubakeur, A. Application of SVM and KNN to duval pentagon 1 for transformer oil diagnosis. IEEE Trans. Dielectr. Electr. Insul. 2018, 24, 3443–3451. [Google Scholar] [CrossRef]
- Satapathy, S.; Naik, A. Social group optimization (SGO): A new population evolutionary optimization technique. Complex Intell. Syst. 2016, 2, 173–203. [Google Scholar] [CrossRef]
- Mollmann, A.; Pahlavanpour, B. New Guideline for Interpretation of Dissolved Gas Analysis in Oil Filled Transformers. Electra Paris 1999, 186, 30–51. [Google Scholar]
- Zheng, H.; Liao, R.; Grzybowski, S.; Yang, L.J. Fault diagnosis of power transformers using multi-class least square support vector machines classifiers with particle swarm optimisation. IET Electr. Power Appl. 2011, 5, 691–696. [Google Scholar] [CrossRef]
- Chang, C.; Lin, C. LIBSVM: A library for support vector machines. ACM Trans. Intell. Syst. Technol. 2011, 2, 1–39. [Google Scholar] [CrossRef]
- Fei, S.; Zhang, X. Fault diagnosis of power transformer based on support vector machine with genetic algorithm. Expert Syst. Appl. 2009, 36, 11352–11357. [Google Scholar] [CrossRef]

© 2018 by the authors. Licensee MDPI, Basel, Switzerland. This article is an open access article distributed under the terms and conditions of the Creative Commons Attribution (CC BY) license (http://creativecommons.org/licenses/by/4.0/).