Article

Evaluation on Tensile Behavior Characteristics of Undisturbed Loess

1
State Key Laboratory for Geomechanics & Deep Underground Engineering, China University of Mining & Technology, Xuzhou 221008, China
2
College of Sciences, China University of Mining & Technology, Xuzhou 221116, China
*
Author to whom correspondence should be addressed.
Energies 2018, 11(8), 1974; https://doi.org/10.3390/en11081974
Submission received: 4 May 2018 / Revised: 13 July 2018 / Accepted: 20 July 2018 / Published: 30 July 2018

Abstract

:
Tensile strength is one significant parameter involved in tensile fracture in soil mechanics. In this paper, a stress-controlled, uniaxial, direct-tension test apparatus was developed to investigate the tensile properties of soils. A limited number of investigations have examined the impact of anisotropy and loading interval on the tensile strength of undisturbed loess. The deformation and strains generated were also examined during the tests. It was revealed that anisotropy was an important factor affecting tensile strength of undisturbed loess, and the effect of loading interval on tensile strength significantly depended on water content. It was negligible while the water content was below the plastic limit. However, when the water content was above the plastic limit, the loading interval not only affected the tensile strength, but also the failure displacement and stiffness response of the soil. Two patterns of tensile fracture were summarized and discussed. Moreover, an empirical constitutive relation was proposed to describe the stress-strain relationship of undisturbed loess and its robustness was validated by the experimental data.

1. Introduction

Loess deposits are distributed in the forest steppes, steppes, and desert steppes in the Northern and Southern Hemispheres, which occupy around 10% of the Earth’s land surface. Loess covers about 640,000 km2 of China, equivalent to about 6.7% of the total area of the country [1]. In a recent review of the publications on shear and tensile strengths of Malan loess (from Shaanxi and Gansu provinces) in China, Li (2017) described the tensile strength of loess as being dependent on water content, dry density, test method, sample size, and loading rate, and pointed out that land instability hazards in loess areas are frequent and varied, among which the cracking-sliding (Beng-hua, in Chinese) failure is a typical mode, and this failure mode demands an investigation into how it relates to tensile strength [2].
Compared with widespread shear failure phenomena such as soil slope slip and foundation instability, tensile fracture is relatively imperceptible in geotechnical engineering. However, this is not to say that the tensile strength of the soil is not important. As explained below, tensile failure tends to have an adverse effect on engineering. Shrinkage cracks caused by desiccation (Figure 1a) may affect the stability of the structures founded on soils [3]. A tensile crack produced on the upper surface of a shallow slope (Figure 1b) may induce a landslide. Furthermore, if water accumulates in tensile cracks, a landslide disaster may accelerate [4,5]. Vertical cracks may form behind a retaining wall due to active earth pressure (Figure 1c) when the soil is under the state of limit equilibrium. Tensile stress is determined by 2 c K a (c-cohesive strength, Ka-rankine active earth pressure coefficient). During the rainy season, cracks will form permeation channels which are unfavorable for the safety of the retaining wall. In an earth rockfill dam, since the consolidation rates of clay and rockfill are different, friction will be generated (Figure 1d), which will then cause horizontal tensile cracks that pose a potential threat to the seepage of the dam. Therefore, it is essential to analyze and research the tensile characteristics of soil for the prevention and control of engineering hazards.
Commonly, two categories of methods can be used to measure soil tensile strength—indirect and direct. The indirect tests mainly include the flexural beam test [6,7,8,9], the Brazilian tensile test (radial fracturing test) [10,11,12,13,14,15,16], and the double punch test (unconfined penetration test) [17,18,19,20,21,22]. They are based on assumptions and formula calculations, so tensile strength is not directly gained from experiment. Different tests are based on different assumptions. The hypothesis of the flexural beam test is the planar cross section, complete elastic deformation, and Hooke’s law. The hypothesis of the Brazilian tensile test is the linear elastic stress-strain relationship, brittle fracture, and the Griffith standard. The hypothesis of the double punch test is the perfectly plastic material and modified Mohr-Coulomb failure surface. As is known, soil is a complex three-phase body composed of soil particles, water, and air. Even for the same kind of soil, the mechanical properties and deformation behavior would be varied as a result of different physical conditions (e.g., different dry density or water content). Thus, soil cannot be assumed to be a single elastic or plastic material. Historically, the indirect methods have been mainly used for tensile tests of hard brittle materials, such as rocks and concrete. As a result, these methods may be suitable for soils of low but not high water content.
The direct methods are mainly the uniaxial tensile tests. There are two types of devices used, which are either strain or stress controlled. The strain-controlled apparatus [23,24,25,26,27] maintains a constant displacement rate in the course of the experiment. Its biggest advantage is that strain-softening behavior can be observed. For the stress-controlled apparatus [28,29], it can achieve a stress-strain curve by applying a continuous axial load. Each of the two test methods has its own advantages. However, strictly speaking, the stress measured by a displacement-controlled test apparatus does not adequately measure true stress. So, in terms of accuracy, a stress-controlled uniaxial apparatus can directly measure the true stress and the corresponding deformation value.
Previous studies have shown that tensile strength is dependent on a number of factors, such as dry density, water content, suction, pull rate, and also the plasticity index. For example, tensile strength decreases with decreasing suction or increases with increasing water content [28,30,31,32]. Tensile strength increases with increasing dry density [30,33,34] and has no sensitivity to the pull rate [19,27]. Also, tensile strength increases when the plasticity index (PI) increases [20], etc.
These studies mainly focused on compacted remolded soils, but there are relatively fewer tests on undisturbed soils. As the original structure of remolded soil will have been destroyed, its strength characteristic is definitely different from that of undisturbed soil. In the author’s opinion, it is reasonable and meaningful to study the tensile strength of undisturbed soil. Li (2017) found that the undisturbed loess structure shows strong anisotropy, and there is an absence of data and a need for further investigations regarding anisotropy of tensile behavior of loess [1]. The time effect of a tensile strength test under stress control has not been found in existing publications. Several theoretical models for the tensile strength of soils have been proposed [3,35], but there is little description of the corresponding soil fracture behavior.
Based on the construction of a high-speed rail in Western China, which inevitably passes through large area of loess, this paper used undisturbed loess as the test object. The research results will have some guidance for engineering. In addition to tensile strength, the deformation behavior of undisturbed soil is another focus of our research. This paper will discuss the following topics:
  • Designing a stress-controlled uniaxial test apparatus for measuring the stress-strain curve of testing materials. The accuracy and reliability of the apparatus has been improved from three shortages influencing the accuracy of the test.
  • Performing a series of experiments on undisturbed loess with different water content and dry densities and analyzing two factors that affect tensile strength, including anisotropy and loading interval.
  • Analyzing deformation characteristics and fracture patterns and discussing the existing strength prediction models. Further, based on the dynamic constitutive model of loess presented by Lanmin Wang et al. [36], establishing the constitutive relations to describe the tensile stress–strain behavior of undisturbed loess under different water contents.

2. Testing Apparatus

The newly designed stress-controlled uniaxial test apparatus is shown in Figure 2. It consists of two clamps and an axial loading system. The clamps include a fixed one and a movable one placed on a horizontal platform. The loading system is driven by weights. Three problems have been discussed emphatically in the course of the design of the device: (1) the problem of the connection of the sample end and the instrument. There are two types currently, including direct connection and clamp connection. The first entails the end being connected with the loading system by glue, which can only connect the cross section of the specimen (Figure 3) [26]. Although this is relatively simple, the specimen falls off easily when the bonding force of the glue is less than the tensile force, which results in the failure of the test. The second is to employ specific clamps, ensuring that the sample does not disengage at the end. As these clamps’ internal spaces are certain, this not only increases the difficulty of installation of the specimen but also brings about stress concentration at the end. Stress concentration will cause the specimen to fracture at the edge of the clamp (Figure 4) [29]. In this case, the measured tensile strength is usually smaller than the actual value. According to the above discussion, two new rectangular clamps were designed. The homogeneity of the cross section can also reduce the stress concentration on the surface of the specimen. As shown in Figure 5, the left and right sides of the clamps can freely unfold because of the design of the hinge, and 2-mm-thick rubber sheets were mounted on the inner sides of the clamps. This reduces the difficulty of the samples’ installation and improves the efficiency of the test. Epoxy adhesives were applied to each inner surface of the rubber sheets, which not only avoids stress concentration due to the extrusion between the clamp and the specimen end but also increases the bonding surfaces. The test results showed that most of the specimens would break into two pieces near the middle position (30–105 mm). Therefore, the effectiveness of the clamps was confirmed. In addition, the rubber sheets can be replaced after the test, thus avoiding the pollution of the glue to the instrument. One clamp is fixed on the apparatus and the other movable clamp can move freely along the guide rail with the ‘v-type’ guideway. (2) The influence of the bottom friction. There is no doubt that the existence of friction will cause the experimental value to be large. In order to reduce the friction of the rectangular soil specimen, two rows of uniformly distributed balls were laid along the axial direction, and one flat plate with the same v-type guideway was placed on it. At present, most test apparatuses apply this design [19,27]. (3) The influence of eccentric tensile stress. To obtain accurate uniaxial stress, the eccentricity of the specimen must be avoided. First, because of the directionality of the guide rail, the axial tension of the specimen can be largely satisfied. Then, considering the flatness of the instrument platform, four adjustable bolts and two leveling bubbles were designed. The horizontal plane of the apparatus can meet requirements by slightly adjusting the height of bolt. In this way, there is no need to over-require the flatness of the desktop under the instrument, so that the test would not be confined to the laboratory and the use scope of the instrument has been expanded.
A length of 5 cm spring connected on the wire rope can reduce vibration of loading. Displacement values are recorded by a dialgage. The accuracy of the dialgage is 0.01 mm and the measuring range is 1–10 mm. The total length of the rectangular soil specimen is 13.5 cm, and the cross section is 3.0 × 3.0 cm. The length of the specimen in the two clamps are both 3 cm, which can ensure that the central specimen meets the slenderness ratio of 2.5 based on conventional laboratory tests. In this paper, small size samples were adopted to reduce the waste of soil in the laboratory and avoid excessive exploitation of soil, which is beneficial to local environmental protection.

3. Materials and Methods

3.1. Materials

The loess used in the laboratory was obtained from Northwest of Weihe River in Shaanxi Province, Western China. Its physical properties are listed in Table 1. The inhomogeneity coefficient and curvature coefficient respectively are Cu ≈ 0.50–0.80, Cc ≈ 2.0–4.0. The undisturbed loess is yellowish brown and dense, with a few shellfishes, rhizomes, etc. In the test, optimum water content and maximum dry density were determined by a heavy compaction test. The volume of the cylinder was 947.38 cm3, the weight of hammer was 4.5 kg, and the drop distance was 450 mm. The liquid limit and plastic limit were separately determined by a rubbing strip and conical liquid limiter. The details refer to the Code for Soil Test of Railway Engineering of the industry standard of the People’s Republic of China (TB10102-2010; J1135-2010).

3.2. Methods

In this test, firstly, the effects of anisotropy and loading interval on the tensile strength of undisturbed soil were studied. The test scheme is shown in Table 2, and the test must guarantee three parallel specimens under the same conditions (e.g., three specimens tested for per water factor combination in the anisotropy test). Then, the deformation characteristics were analyzed. The test procedure consists of three steps:
(1)
Sample preparation: to study the anisotropy effect, soils were taken from 8 m below the ground. The original soils were cut in different directions to get a rectangular specimen (Figure 6), and the average dry density of these samples was 1.48 g/cm3. Similarly, different dry density samples of 1.37 g/cm3, and 1.46 g/cm3 to study the loading interval effect and stress-strain relationship. In all tests, the water film transfer method was adopted in the allocation of different water content (Figure 7), and soil samples were sealed in a moisturizing dish for two days to homogenize the water content.
(2)
Sample installation and instrument debugging: the specimen was placed on the apparatus and then glued to the front and rear clamps using epoxy adhesive. The levelling bubble was situated in the center by minor adjustments of the height of four bolts. The dial gauge was installed and settled to zero. Before the test, 2 min was allowed to let the adhesive solidify. The whole course was carried out in an 18 °C constant temperature room, and thin vaseline was daubed on the specimen surface to prevent evaporation.
(3)
Tensile test: there were five weights used—20, 30, 50, 100, and 300 g. The tensile stress was computed by dividing the tensile force by the cross-sectional area (3.0 × 3.0 cm) of the specimen. Weights can be combined when loaded. It is possible to obtain a more accurate tensile strength value by applying the lower weights in the later stage of the test. What needs to be emphasized is that, in the time effect test, when the water content is lower than the plastic limit, each time the applied mass is 150 g and the water content is higher than the plastic limit, it is 50 g each time. The displacement value was recorded for each loading stage. Except for loading interval test, the other displacement values were recorded every 2 min. If the specimen broke at the edge of one of the clamps, the tensile strength was considered to be invalid and the test was carried out again until the specimen broke along the middle cross section. The reliability of the test apparatus was verified by most samples’ fracture at the middle part.

4. Experimental Results and Analysis

4.1. Anisotropy Effect

From the results shown in Figure 8, it can be seen that tensile strength of undisturbed loess is significantly affected by anisotropy. We set the counterclockwise direction as positive. With the increase in inclination θ, there is a decrease in σt firstly, reaching a minimum in the range of 30° < θ < 60°. For the condition of the same dry density and water content, the tensile strength of the vertical direction is greater than that in any other direction in the process of changing from horizontal (0°) to vertical (90°). It is reasonable to assume that the original loess forms a higher primary structure strength in the vertical direction due to the gravitational field which causes the tight bonding of soil particles in the history of accumulation and deposition. The passive lateral force is smaller than gravity by the extrusion of soil particles, which forms the weaker primary structure strength in the other directions [37]. The highest peak stress (i.e., σt) is obtained when the tensile stress direction is parallel to the deposition direction (i.e., θ = 90°).

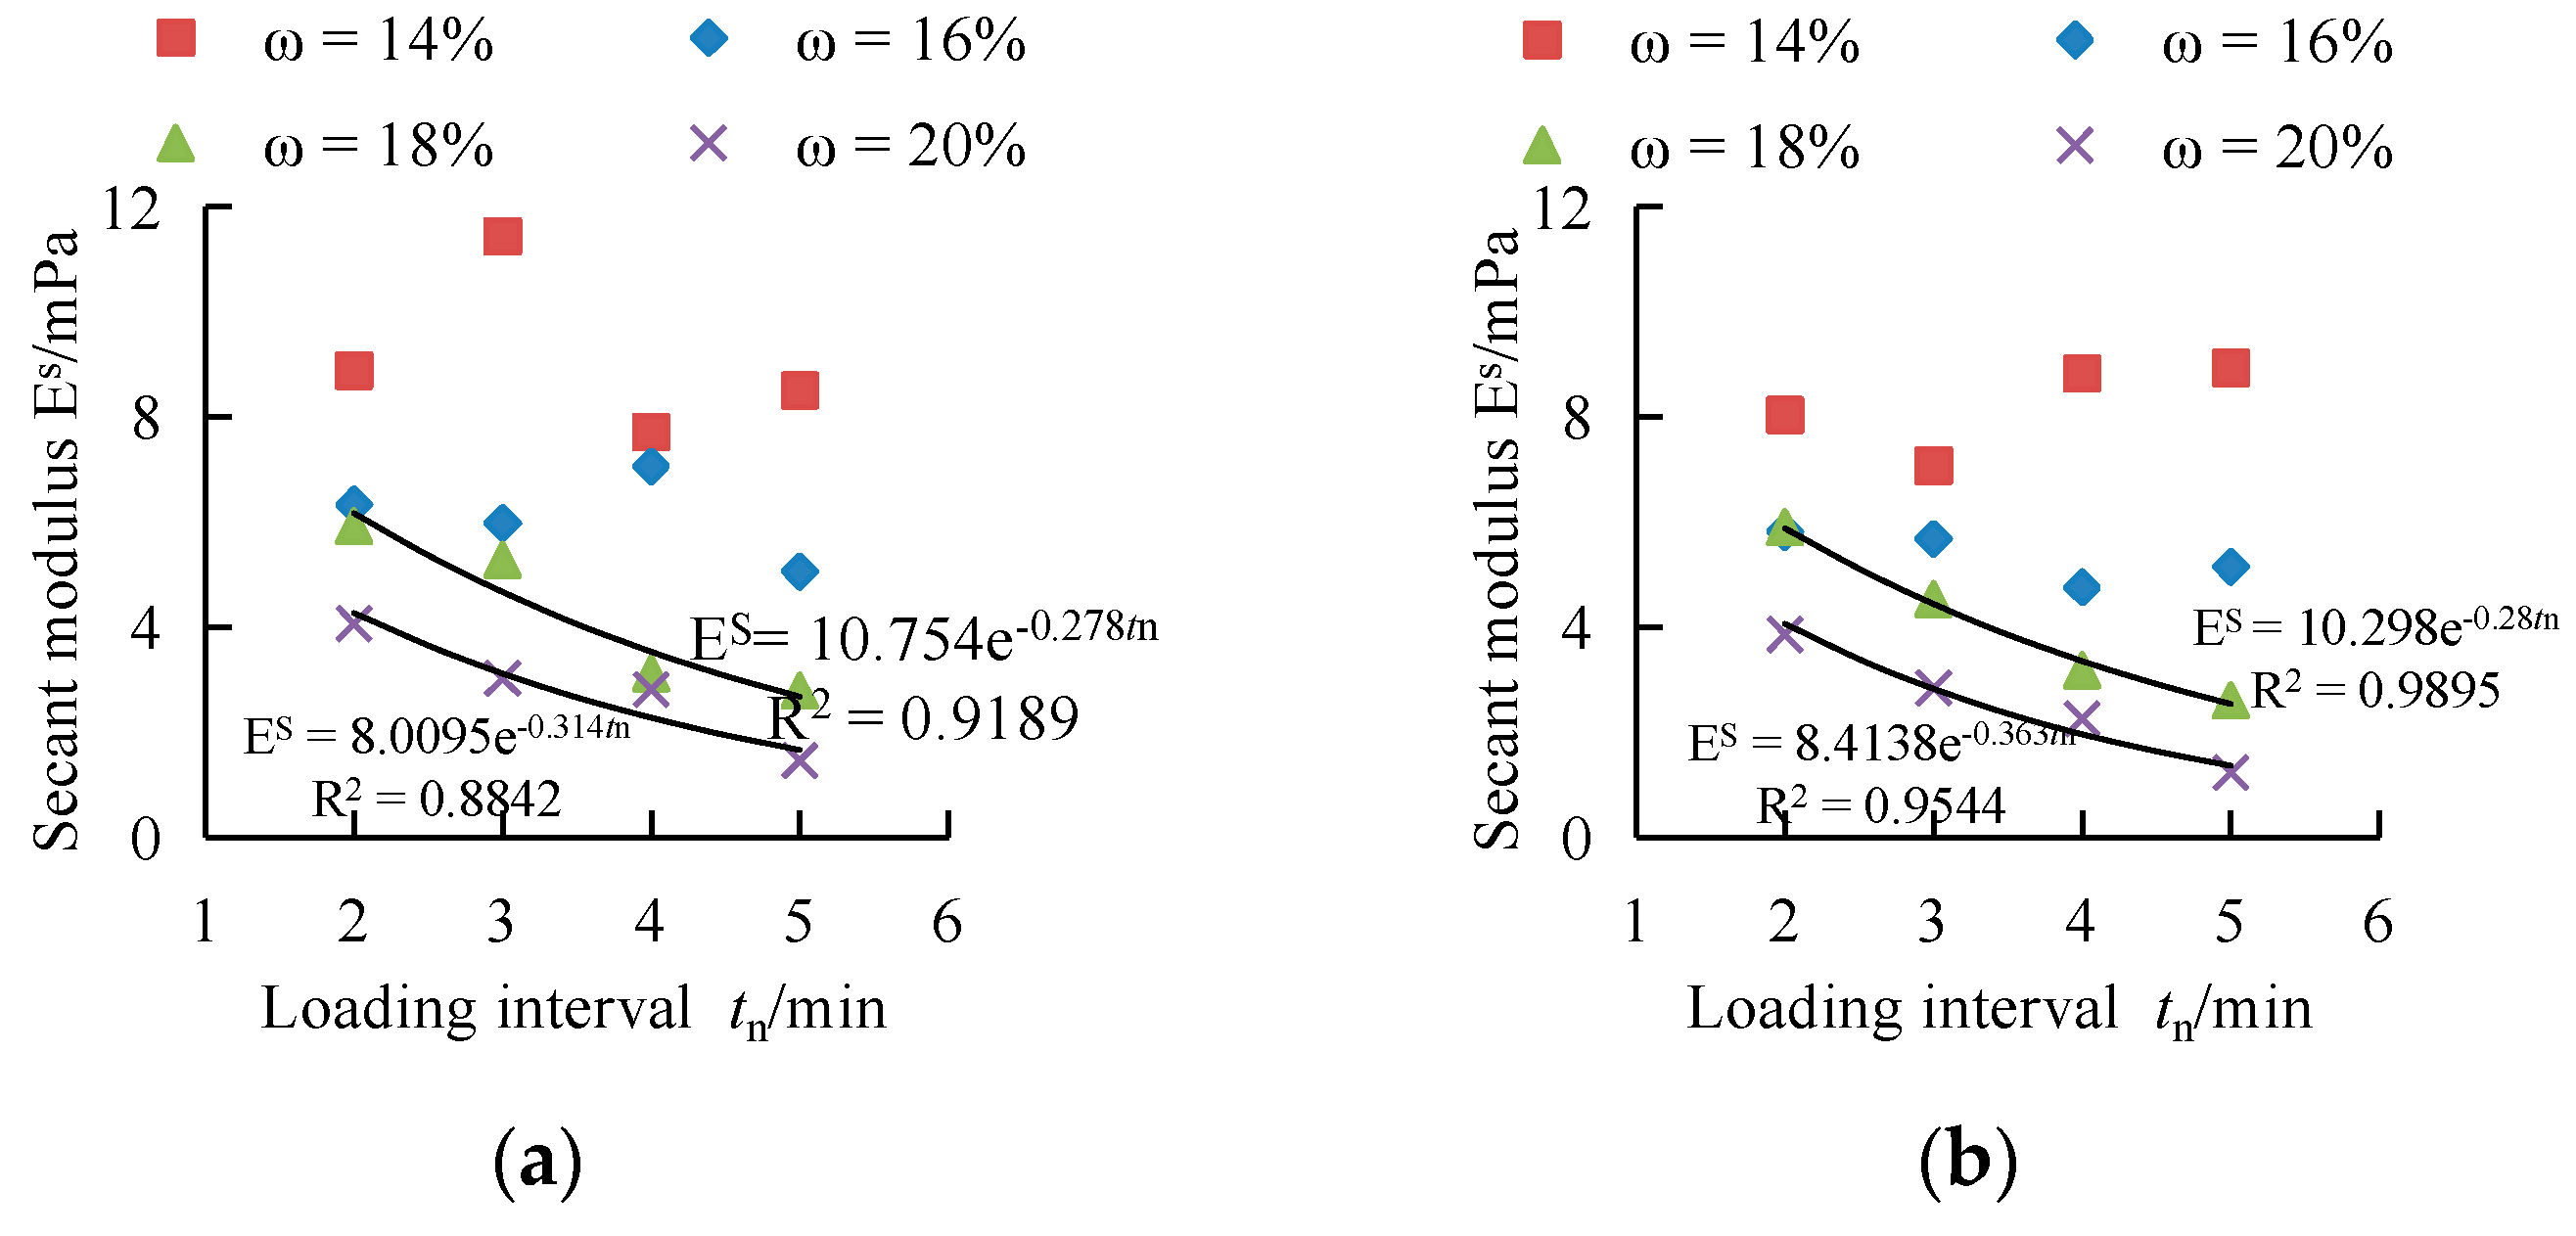
4.2. Loading Interval Effect

Figure 9 presents the tensile strength at different loading intervals for each loess set. No clear trend can be detected when ω < PL, i.e., at this condition, tensile strength does not vary with the loading interval if the scatter in the values attributed to the inherent variability can be ignored in the test. However, the tensile strength decreases gradually with the increase of the loading interval when ω > PL. The decrease of tensile strength can be fitted with a linear relationship, and the slope of the curve is between 1.2 and 3.5 in this experiment. Thus, the effect of tensile strength with the loading interval is different by taking the boundary of the soil plastic limit.
Figure 10 presents the limit displacement at different loading intervals for each loess set. Similarly, the limit displacement value hardly changes when ω < PL. However, contrary to the change rule of strength, the limit displacement increases gradually with the loading interval when ω > PL.
In order to obtain the essential attributes of loess that do not depend on the size of the sample or the specific experimental device, the data were processed to obtain the variations of the average stiffness of the samples to various water contents and loading intervals (Figure 11). The secant modulus was calculated based on the tensile strength and maximum tensile strain recorded for each test. The strain was determined by assuming an influence area of approximately two times the length of the fracture zone. The assumption was based on the results from the deformation analysis presented in the next section. The secant modulus was plotted against the loading interval. It was found that when ω < PL, the tensile strength is not sensitive to the loading interval. However, when ω > PL, the secant modulus can be approximated by an exponential function: E s ( t n ) = α e β t n (2 ≤ tn ≤ 5). Where ES is the secant modulus, tn is the loading interval (tn = 2, 3, 4, 5 min), and α is the coefficient that relates to water content. α is given by α = ES(0), i.e., it represents the secant modulus under continuous loading. β is the coefficient given by 1 E s d E s d t n = β . It indicates the relative reduction rate of the secant modulus. It is necessary to note that the above data can also be fitted with a linear relationship within the range of water content of the sample in this test. There is no doubt that the stiffness value of the specimen decreases gradually. Nevertheless, as the sample used in the test could not be fluid, it is not possible for the value to eventually become zero with the extension of the loading interval. Thus, in this paper, the exponential function was used to express this.

5. Two Fracture Patterns of Undisturbed Loess

5.1. Deformation Behavior in Tensile Test

The qualitative evaluation results of axial deformations were investigated during the pull tests. The typical fracture patterns, generally speaking, could be divided into ‘transverse failure’ and ‘serrated failure’ and are shown in the photos in Figure 12 and Figure 13. For the transverse failure (Figure 12), the difference of ultimate displacement and deformation depended largely on the water content of the specimen. The plastic limit (PL = 17.6%) could be regarded as a reference point. When ω ≤ PL, only one main crack occurred at the central section of the specimen and was perpendicular to the axial direction during the progression of the test. The failure could be regarded as a brittle fracture as there was no breaking precursor and no practical necking phenomenon (Figure 12a). The axial displacement grew slowly with the application of loads, and the maximum failure displacement merely reached 8.5 × 10⁻² mm. In contrast, when ω ≥ PL, the specimen in Figure 12b showed elastoplasticity. Besides the emergence of the main crack, numerous tiny cracks could be observed. With the increase of water content, slight necking could be observed. With the application of loads, the maximum failure displacement could reach 39.8 × 10⁻² mm. It is worth noting that, based on the above deformation analysis, the unsuitability of the indirect tensile test method was proven when ω ≥ PL.
Another pattern of serrated failure is shown in Figure 13. As we have seen, the fracture section of the specimen was not perpendicular to the axial direction but appeared to be serrated. This phenomenon occurred randomly and macroscopically, and we did not find that it was related to factors such as the cut orientation, water content, and dry density of the sample. In other words, the cut orientation, the homogeneity of the water content, the different structures formed (such as dispersion structure, flocculation structure, etc.), etc., could all be potential causes of this pattern. This may illustrate that there are some sections in which the shear strength is less than the tensile strength, so the shear stress will be the control stress of the specimen under the axial load. The occurrence of the slip zone indicates that the material exhibits shear failure on the maximum shear stress section.

5.2. Tensile Strength Prediction

The pattern of serrated failure can be described on the failure Mohr stress circle shown in Figure 14. According to the Mohr-Coulomb (M-C) shear failure criterion, failure occurs not because the applied stress reaches the bonding strength, but because the ratio of shear stress to normal stress at a point reaches tan φ [35]. As the tensile test apparatus was not equipped with suction control or measurement devices, the total stress method was proposed to predict the tensile strength under this stress regime. The following equation can be derived from Figure 14
sin φ = σ f 2 c c t g φ σ f 2
So, the tensile strength σf’ of this pattern was
σ f = 2 c cos φ 1 + sin φ
where c and φ are the Mohr-Coulomb shear strength parameters of unsaturated loess under the total stress regime. By controlling the water content (saturation) of the sample and conducting a direct shear test or triaxial shear test, the strength indexes can be obtained under certain conditions. The water content of samples can also be selected and measured by the shear test. Then, the empirical formulas of the intensity index c and φ that change with the dry density and water content (saturation) can be established, i.e., c = f(ρd, w); φ = g(ρd, w).
Maryam Varsei et al. [38] also used a Mohr-Coulomb-type model to predict uniaxial tensile strength but on the principle of effective stress. The tensile strength was given by
σ t u t = 2 c cos φ + 2 S r e ( u a u w ) tan φ cos φ 1 + sin φ
where σ t u t is uniaxial tensile strength, c’ is the effective stress cohesion intercept, φ’ is the effective stress friction angle, S r e is an effective degree of saturation, ua is pore air pressure, uw is pore water pressure, and uauw represents matric suction.
Lu et al. [35] presented a theory that describes the tensile strength of wet sand. This method attempts to relate uniaxial tensile strength to isotropic tensile strength (suction stress) of soil and uses isotropic tensile strength (suction stress) to express uniaxial tensile strength. This theory is also based on the Mohr-Coulomb failure criterion. Two expressions for the uniaxial tensile strength were proposed in terms of soil suction and equivalent degree of saturation. Lu et al. [35]
σ t u t = 2 tan φ t tan ( π 4 φ t 2 ) ( u a u w ) { + [ α ( u a u w ) ] n } 1 / ( n 1 )
σ t u t = 2 tan φ t tan ( π 4 φ t 2 ) S e α [ S e n / ( 1 n ) 1 ] 1 / n
where σ t u t is uniaxial tensile strength; φt is the internal friction angle determined at low normal stress level, i.e., less than 1 kPa; ua is pore air pressure; uw is pore water pressure; α is the inverse value of the air-entry pressure; n is pore size spectrum number; and Se is equivalent degree of saturation.
Although some strength theories have been verified, such as when Tang et al. [30] predicted the tensile strength of unsaturated remolded clay by modifying the Lu et al. model, the fracture behavior of soil under a certain strength model has not been explicitly proposed or studied.
We contend that the current models may more accurately predict serrated failure because they are all based on M-C failure [35,38,39]. For the pattern of transverse failure, we believe that the shear stress on any section of a soil sample does not reach the shear strength when the specimen fractures along the cross section, i.e., failure occurs only when the applied external stress reaches the bonding strength. That is, the tensile strength mainly comes from the bonding stress and has little relation to the shear failure. The bonding strength equals isotropic tensile strength when the soil is assumed homogeneous and isotropic. Suction stress, defined by Lu and Likos (2006) [40], is the isotropic tensile stress that can be conceptualized as the isotropic tensile strength. Thus, the tensile strength of transverse failure can be expressed by [35]
σ t i t = C t tan φ t
σ t i t = ( u a u w ) { + [ α ( u a u w ) ] n } 1 / n 1
σ t i t = S e α ( S e n / ( 1 n ) 1 ) 1 / n
where σ t i t is uniaxial tensile strength (isotropic tensile strength); Ct and φt are, respectively, the apparent cohesion and internal friction angle determined at low normal stress level; α is the inverse value of the air-entry pressure; n is the pore size spectrum number; and Se is the equivalent degree of saturation.
Most existing theories idealize two-particle systems represented by smooth spheres, rough spheres, parallel plates, and other such geometries for predicting tensile strength [40,41]. The idealizations and assumptions involved in the models significantly limit their theoretical and practical applications [35]. The verification and comparison of the above models is beyond the scope of this study. Assuredly, further study is needed to accurately predict the tensile strength of undisturbed soils and other geomaterials under various conditions.

6. Constitutive Relation for Undisturbed Soils under Uniaxial Tension

In the following constitutive equations study, we retained the definition of fracture zone l0 given by Hillerborg [42] and Labuz et al. [43], as shown in Figure 15. The length of fracture zone l0 was approximately measured by a vernier caliper after the test. It was discovered that the fracture zone l0 varies with water content rather than at a constant value. As shown in Figure 16, the exponential relationship between fracture zone l0 and water content was confirmed. The existence of the fracture zone indicates that the specimen was a nonuniform deformation, and the strain was mainly concentrated in the fracture zone. Thus, in this experiment, we have approximatively neglected the influence of the nonstrain zone, and the strain calculation was based on the fracture zone. To be conservative, 2l0 was approximatively considered to be the influence scope of strain.

6.1. Hyperbolic Equation for the Stress-Strain Curve

Figure 17 shows the tensile stress-strain curves with different water contents. Axial stress σ and strain ε were calculated separately by
σ = N S
ε = Y 2 l 0
where N is the axial load, S is the cross-sectional area, Y is the axial displacement, and l0 is the fracture zone.
As seen in Figure 17, there was a general tendency for the curve to get closer to the strain axis when the water content improved, which was attributed to the generation of greater elastic-plastic deformation as a result of the increasing water content. All stress-strain curves had similar regularity. Based on the hyperbolic model describing soil mechanical characteristics by Duncan et al. (1970) [36] and Wang (1992) [44], a hyperbolic equation was used to describe the stress-strain relationship of soil under uniaxial tension, namely,
σ = ε a + b ε
where a and b are the material coefficients, the values of which may be determined experimentally. In order to determine a and b, Equation (11) can be converted to the form
ε σ = a + b ε
As a result, a new transformed coordinate system is obtained where ordinate is ε σ and abscissa is ε, as shown in Figure 18. a and b are the intercept and slope of a straight line, respectively. Parameters a and b are listed in Table 3.
From Table 3, it can be seen that the parameters a and b significantly depend on the water content and dry density. Furthermore, the variation of a and b with water content ω was respectively obtained in Table 4.
In this way, the hyperbolic function (11) can be written as
σ = ε α 1 ω β 1 + α 2 ω β 2 ε
where α1, α2, β1, and β2 (in Table 4) are the material constants which are at least related to dry density.
To verify the rationality of the hyperbolic function, the measured tensile stress-strain curves of the specimen with ω = 22% were fitted using the proposed constitutive relation. As shown in Figure 19, the fitted curves reproduced the test results well, which demonstrated that the proposed constitutive relations (13) could reasonably represent the tensile failure characteristics of undisturbed soils under uniaxial tension.

6.2. Mechanical Meaning of Constants a and b

From Equation (11), taking ε 0 and ε , the following formulas can be obtained
a = lim ε σ = 1 E 0
b = lim ε 1 σ = 1 σ u
Both of the constants a and b have readily visualized physical meanings, as shown in Figure 20. a is the reciprocal of the initial tangent modulus E0 and b is the reciprocal of the asymptotic value of stress which the stress-strain curve approaches at infinite strain σu.
Since the hyperbola remains below the asymptote at all finite values of strain, it is commonly found that the asymptotic value of σu is larger than the tensile strength σf by a small amount. It would be expected that the asymptotic value may be related to the tensile strength but by means of a factor Rf’, as shown by
R f = σ f σ u
where Rf’ is the failure ratio for the uniaxial tensile test, which always has a value less than unity 1.
Based on Formula (15), constant b also can be written as
b = 1 / ( σ f R f )

6.3. The Tangent Modulus Et and Specific Strain Energy u

As is known, tangent modulus Et can be written as
E t = Δ σ Δ ε = σ ε
Combining Equation (11), Et is given by
E t = a ( a + b ε ) 2
From Formula (12), ε is obtained by
ε = a 1 σ b
Then, combining Formulas (19) and (20), we gain the equation
E t = 1 a ( 1 R f σ σ f ) 2 = ( 1 R f σ σ f ) 2 E 0
The specific unit volume strain energy u can be written as
u = 0 ε 1 σ d ε = 0 ε 1 ε a + b ε d ε = a ln a + b ε 1 a ln ( a + b ε 1 ) b 2 = σ u 2 E 0 ln σ u σ u + E 0 ε 1 + σ u ε 1
In (21) and (22), where ε1 is the limit strain. As mentioned earlier, parameters a, b, E0, and σu satisfied relations of Formulas (14) and (15).

7. Conclusions

In this paper, a horizontal stress-controlled uniaxial direct-tension test apparatus was developed, and a series of uniaxial tensile tests were performed on undisturbed loess with different water contents and dry densities. On the basis of the test results, the effects of anisotropy and loading interval on the tensile strength of undisturbed loess were investigated. The failure mechanism and deformation behavior of undisturbed loess were analyzed, and empirical formulas of constitutive relations were proposed. The following conclusions can be drawn:
  • The developed uniaxial direct-tension test apparatus can acquire the accurate value of tensile strength and the stress-strain curve of soils through a series of improvements by reducing friction, decreasing eccentricity, and developing new clamps.
  • The effects of anisotropy on the tensile strength of undisturbed loess are significant. The tensile strength generally decreases with increasing direction inclination θ and eventually reaches a minimum value in the range of 30° < θ < 60°, and then it increases until the maximal value of θ = 90°. The loading interval has a negligible influence on the tensile behavior when ω < PL. However, it does have an impact on the tensile strength, limit displacement, and stiffness response of the undisturbed loess when ω > PL.
  • Regarding the tensile deformation of the specimen, there were two crack patterns of transverse failure and serrated failure. For the transverse failure, a brittle fracture could be observed when ω < PL, but plastoelastic failure became the main form when ω > PL. For the serrated failure, it was not found that this pattern is related to factors such as the cut orientation, water content, and dry density of the sample.
  • Regarding the tensile strength prediction, the strength expression was proposed by the total stress in the serrated failure. Since models by Lu et al. and Maryam Varsei were all based on the M-C failure criterion, an idea was put forward for expressing tensile strength by isotropic stress (bonding stress) in the transverse failure. However, the models need further experimental verification.
  • Based on the concept of a fracture process zone, a method was proposed to calculate the apparent tensile strain, and an empirical constitutive relation was established to describe the stress-strain relationship of undisturbed loess. Reasonable agreement between the model predictions and experimental results was obtained. Further, the expressions of the tangent modulus and the specific strain energy could be derived.

Author Contributions

Conceptualization, H.B.; Data curation, S.H.; Formal analysis, S.H.; Funding acquisition, H.B.; Investigation, S.H.; Methodology, S.H. and Z.X.; Supervision, H.B. and Z.X.; Writing—original draft, S.H.

Acknowledgments

The authors would like to give special thanks to editor Grace Du. We are grateful for the support of the National Natural Science Foundation of China (grant no. 51074166), and the State Key Development Program for Basic Research of China (grant no. 2013CB227900).

Conflicts of Interest

The authors declare no conflicts of interest.

References

  1. Peng, D.; Xu, Q.; Qi, X.; Ju, Y. Study on early recognition of loess landslides based on field investigation. Int. J. Geohazards Environ. 2016, 2, 32–52. [Google Scholar] [CrossRef]
  2. Li, Y. A review of shear and tensile strengths of the Malan Loess in China. Eng. Geol. 2017, 236, 4–10. [Google Scholar] [CrossRef]
  3. Trabelsi, H.; Jamei, M.; Zenzri, H.; Olivella, S. Crack patterns in clayey soils: Experiments and modeling. Int. J. Numer. Anal. Methods Geomech. 2012, 36, 1410–1433. [Google Scholar] [CrossRef]
  4. Spencer, E. Effect of tension of stability of embankment. J. Soil Mech. Found. Div. 1968, 94, 1159–1173. [Google Scholar]
  5. Suklje, L. Rheological Aspects of Soil Mechanics; Wiley-Interscience: London, UK, 1969; pp. 456–473. [Google Scholar]
  6. Leonards, G.A.; Narain, J. Flexibility of clay and cracking of earth dams. J. Soil Mech. Found. Div. 1963, 89, 47–98. [Google Scholar]
  7. Ajaz, A.; Parry, R.H.G. Stress-strain behaviour of two compacted claysin tension and compression. Géotechnique 1975, 25, 495–512. [Google Scholar] [CrossRef]
  8. Thusyanthan, N.I.; Take, W.A.; Madabhushi, S.P.G.; Bolton, M.D. Crack initiation in clay observed in beam bending. Géotechnique 2007, 57, 581–594. [Google Scholar] [CrossRef]
  9. Viswanadham, B.V.S.; Jha, B.K.; Pawar, S.N. Experimental study on flexural testing of compacted soil beams. J. Mater. Civ. Eng. 2010, 10, 460–468. [Google Scholar] [CrossRef]
  10. Narain, J.; Rawat, P.C. Tensile strength of compacted soils. J. Soil Mech. Found. Div. 1970, 96, 2185–2190. [Google Scholar]
  11. Mellor, M.; Hawkes, I. Measurement of tensile strength by diametral compression of discs and annuli. Eng. Geol. 1971, 5, 73–225. [Google Scholar] [CrossRef]
  12. Krishnayya, A.V.G.; Eisenstein, Z.; Morgenstern, N.R. Behavior of compacted soil in tension. J. Geotech. Eng. Div. 1974, 100, 1051–1061. [Google Scholar]
  13. Ghosh, A.; Subbarao, C. Tensile strength bearing ratio and slake durability of class fly ash stabilized with lime and gypsum. J. Mater. Civ. Eng. 2006, 10, 18–27. [Google Scholar] [CrossRef]
  14. De Souza Villar, L.F.; De Campos, T.M.P.; Azevedo, R.F.; Zornberg, J.G. Tensile strength changes under drying and its correlations with total and matric suctions. In Proceedings of the 17th International Conference on Soil Mechanics and Geotechnical Engineering, Alexandria, Egypt, 5–9 October 2009; Volume 1, pp. 793–796. [Google Scholar]
  15. Consoli, N.C.; Cruz, R.C.; Consoli, B.S.; Maghous, S. Failure envelope of artificially cemented sand. Géotechnique 2012, 62, 543–547. [Google Scholar] [CrossRef]
  16. Beckett, C.T.S.; Smith, J.C.; Ciancio, D.; Augarde, C.E. Tensile strengths of flocculated compacted unsaturated soils. Géotech. Lett. 2015, 5, 254–260. [Google Scholar] [CrossRef] [Green Version]
  17. Fang, H.Y.; Chen, W.F. Further study of double-punch test for tensile strength of soils. In Proceedings of the 3rd Southeast Asian Conference on Soil Engineering, Southeast Asian Geotechnical Society, Pathumthani, Thailand, 6–10 November 1972; pp. 211–215. [Google Scholar]
  18. Favaretti, M. Tensile strength of compacted clays. In Proceedings of the 1st International Conference on Unsaturated Soils, Balkema, Rotterdam, The Netherlands, 6–8 September 1995; pp. 51–56. [Google Scholar]
  19. Kim, T.H.; Kim, C.K.; Jung, S.J.; Lee, J.H. Tensile strength characteristics of contaminated and compacted sand-bentonite mixtures. Environ. Geol. 2007, 52, 653–661. [Google Scholar] [CrossRef]
  20. Kim, T.-H.; Kim, T.-H.; Kang, G.-C.; Ge, L. Factors influencing crack-induced tensile strength of compacted soil. J. Mater. Civ. Eng. 2012, 24, 315–320. [Google Scholar] [CrossRef]
  21. Lutenegger, A.J.; Rubin, A. Tensile strength of some compacted fine-grained soils. In Unsaturated Soils: Advances in Geo-Engineering; Toll, D.G., Augarde, C.E., Gallipoli, D., Wheeler, S.J., Eds.; Taylor & Francis: London, UK, 2008; pp. 411–415. [Google Scholar]
  22. Li, X.; Liu, Y.; Jiang, L.; Tang, Y. Determination of tensile strength of compacted loess by double punch test. Adv. Mater. Res. 2011, 15, 194–196. [Google Scholar] [CrossRef]
  23. Tschebotarioff, G.P.; Ward, E.R.; Dephillippe, A.A. The tensile strength of disturbed and recompacted soils. In Proceedings of the Third International Conference on Soil Mechanics and Foundation Engineering, Zurich, Switzerland, 16–27 August 1953; ISSMFE: Zurich, Switzerland, 1953; pp. 207–210. [Google Scholar]
  24. Tang, G.X.; Graham, J. A method for testing tensile strength in unsaturated soils. Geotech. Test. J. 2000, 23, 377–382. [Google Scholar]
  25. Nahlawi, H.; Chakrabarti, S.; Kodikara, J. A direct tensile strength testing method for unsaturated geomaterials. J. Geotech. Test. 2004, 27, 356–361. [Google Scholar]
  26. Zhang, B.-Y.; Li, Q.-M.; Yuan, H.-N.; Sun, X. Tensile Fracture Characteristics of Compacted Soils under Uniaxial Tension. J. Mater. Civ. Eng. 2015, 27, 04014274. [Google Scholar] [CrossRef]
  27. Tollenaar, L.A.; van Paassen, C. Experimental evaluation of the effects of pull rate on the tensile behavior of a clay. Appl. Clay Sci. 2017, 144, 131–140. [Google Scholar] [CrossRef]
  28. Ibarra, S.Y.; Mc Kyes, E.; Broughton, R.S. Measurement of tensile strength of unsaturated sandy loam soil. Soil Tillage Res. 2005, 81, 15–23. [Google Scholar] [CrossRef]
  29. Lakshmikantha, M.R.; Prat, P.C.; Ledesma, A. Image analysis for the quantification of a developing crack network on a drying soil. ASTM Geotech. Test. J. 2009, 32, 505–515. [Google Scholar]
  30. Tang, C.-S.; Pei, X.-J.; Wang, D.-Y.; Shi, B.; Li, J. Tensile Strength of Compacted Clayey Soil. J. Geotech. Geoenviron. Eng. 2015, 141, 04014122. [Google Scholar] [CrossRef]
  31. Wang, J.J.; Zhu, J.G.; Chiu, C.F.; Zhang, H. Experimental study on fracture toughness and tensile strength of a clay. Eng. Geol. 2007, 94, 65–75. [Google Scholar] [CrossRef]
  32. Morris, P.H.; Graham, J.; Williams, D.J. Cracking in drying soils. Can. Geotech. J. 1992, 29, 263–272. [Google Scholar] [CrossRef]
  33. Blazejczak, D.; Horn, R.; Pytka, J. Soil tensile strength as affected by time, water content and bulk density. Int. Agrophys. 1995, 9, 179–188. [Google Scholar]
  34. Sun, P.; Peng, J.; Chen, L.; Yin, Y.; Wu, S. Weak tensile characteristics of loess in China-an important reason for ground fissures. Eng. Geol. 2009, 108, 153–159. [Google Scholar] [CrossRef]
  35. Lu, N.; Kim, T.; Sture, S.; Likos, W. Tensile strength of unsaturated sand. J. Eng. Mech. 2009, 12, 1410–1419. [Google Scholar] [CrossRef]
  36. Wang, L. The dynamic constitutive model of loess under irregular seismic loading. Northwest. J. Seismol. 1992, 4, 61–68. [Google Scholar]
  37. Burland, J.B. On the compressibility and shear strength of natural clays. Géotechnique 1990, 40, 29–78. [Google Scholar] [CrossRef]
  38. Maryam, V.; Gerald, A.; Miller, P.E.; Hassanikhah, A. Novel Approach to Measuring Tensile Strength of Compacted Clayey Soil during Desiccation. Int. J. Geomech. 2016, 16, D4016011. [Google Scholar]
  39. Alonso, O.S.; Vaunat, J.; Pereira, J.M. A microstructurally based effective stress for unsaturated soils. Géotechnique 2010, 60, 913–925. [Google Scholar] [CrossRef]
  40. Lu, N.; Likos, W.J. Suction stress characteristic curve for unsaturated soil. J. Geotech. Geoenviron. Eng. 2006, 132, 131–142. [Google Scholar] [CrossRef]
  41. Lechman, J.; Lu, N.; Wu, D. Hysteresis of matric suction and capillary stress in monodisperse disk-shaped particles. J. Eng. Mech. 2006, 5, 565–577. [Google Scholar] [CrossRef]
  42. Hillerborg, A. The theoretical basis of a method to determine fracture energy GF of concrete. Mater. Struct. 1985, 18, 291–296. [Google Scholar] [CrossRef]
  43. Labuz, J.F.; Shah, S.P.; Dowding, C.H. The fracture processzone in granite: Evidence and effect. Int. J. Rock Mech. Min. Sci. Geomech. Abstr. 1987, 24, 235–246. [Google Scholar] [CrossRef]
  44. Duncan, J.M.; Chang, C.-Y. Nonlinear analysis of stress and strain in soils. J. Soil Mech. Found. Div. 1970, 96, 1629–1653. [Google Scholar]
Figure 1. Various tensile cracks in engineering: (a) shrinkage cracks (H. Trabelsi et al., 2012); (b) tensile cracks on soil slope; (c) tensile cracks behind retaining wall; (d) tensile cracks in earth and rockfill dam.
Energies 11 01974 g001
Figure 2. Schematic drawing of the uniaxial direct-tension test apparatus (units for the numbers: mm).
Energies 11 01974 g002
Figure 3. Direct connection (Bing-yin Zhang, 2015).
Energies 11 01974 g003
Figure 4. Clamp edge fracture (Lakshmikantha, 2009).
Energies 11 01974 g004
Figure 5. Schematic drawing of the two specimen clamps (units for the numbers: mm).
Energies 11 01974 g005
Figure 6. Cutting model of undisturbed loess.
Energies 11 01974 g006
Figure 7. Water film transfer.
Energies 11 01974 g007
Figure 8. Tensile strength in different directions (ρd = 1.48 g/cm3).
Energies 11 01974 g008
Figure 9. Effect of loading interval on tensile strength: (a) ρd = 1.37 g/cm3; (b) ρd = 1.46 g/cm3.
Energies 11 01974 g009
Figure 10. Effect of loading interval on limit displacement: (a) ρd = 1.37 g/cm3; (b) ρd = 1.46 g/cm3.
Energies 11 01974 g010
Figure 11. Secant modulus at different loading intervals: (a) ρd = 1.37 g/cm3; (b) ρd = 1.46 g/cm3.
Energies 11 01974 g011
Figure 12. The transverse failure: (a) low water content; (b) high water content.
Energies 11 01974 g012
Figure 13. The serrated failure: (a) low water content; (b) high water content.
Energies 11 01974 g013
Figure 14. Failure Mohr stress circle.
Energies 11 01974 g014
Figure 15. The schematic diagram of fracture zone.
Energies 11 01974 g015
Figure 16. Length of fracture zone with water contents: (a) ρd = 1.28 g/cm3; (b) ρd = 1.37 g/cm3; (c) ρd = 1.46 g/cm3; (d) ρd = 1.53 g/cm3.
Energies 11 01974 g016
Figure 17. Tensile stress-strain curve of undisturbed soils: (a) ρd = 1.28 g/cm3; (b) ρd = 1.37 g/cm3; (c) ρd = 1.46 g/cm3; (d) ρd = 1.53 g/cm3.
Energies 11 01974 g017aEnergies 11 01974 g017b
Figure 18. Transformed hyperbolic stress-strain curve: (a) ρd = 1.28 g/cm3; (b) ρd = 1.37 g/cm3; (c) ρd = 1.46 g/cm3; (d) ρd = 1.53 g/cm3.
Energies 11 01974 g018
Figure 19. Measured and fitted tensile stress-strain curves (ω = 22%).
Energies 11 01974 g019
Figure 20. Physical meaning of parameters a and b: (a) hyperbolic stress-strain curve; (b) transformed hyperbolic stress-strain.
Energies 11 01974 g020
Table 1. Physical properties of the test loess.
Specific Gravity
Gs
Liquid Limit
LL (%)
Plastic Limit
PL (%)
Plasticity Index
PI (%)
Optimum Water
Content ωopt (%)
Maximum Dry
Density ρd max (g/cm−3)
2.6727.217.69.614.81.82
Table 2. Test scheme.
GroupsDry Density ρd (g/cm−3)Water Content ω
(%)
Dip Angle θ (°)Interval Time tn (min)
Anisotropy effect1.4814.0, 16.0, 18.0, 20.00, 30, 60, 90_
Loading interval effect1.37, 1.4614.0, 16.0, 18.0, 20.0_2, 3, 4, 5
Table 3. Parameters a and b.
ω (%)
ρd (g/cm3)
abababab
1.281.371.461.53
140.01780.03220.01420.02670.01410.02330.00910.0192
160.02840.03860.02530.03110.030.02590.01530.0243
180.05420.04780.04330.03620.03130.03890.02270.0313
200.11370.05990.05410.04430.04290.04320.03320.0352
Table 4. Fitting formula of a and b.
Dry Density ρd (g/cm3)Fitting Formula
1.28 a = 2 × 10 8 ω 5.1855 R2 = 0.977 b = 0.0003 ω 1.7383 R2 = 0.989
1.37 a = 6 × 10 7 ω 3.8546 R2 = 0.982 b = 0.0007 ω 1.3979 R2 = 0.985
1.36 a = 8 × 10 6 ω 2.8841 R2 = 0.881 b = 0.0002 ω 1.8951 R2 = 0.929
1.45 a = 7 × 10 7 ω 3.605 R2 = 0.999 b = 0.0002 ω 1.7505 R2 = 0.989

